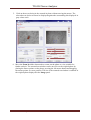
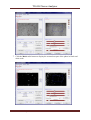
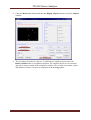
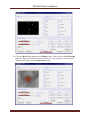
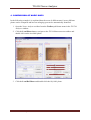
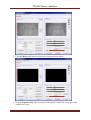
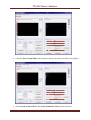
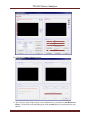
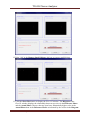
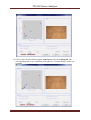
1
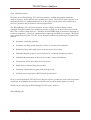
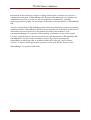
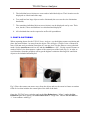
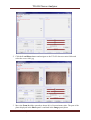
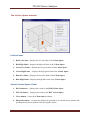
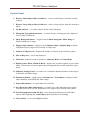
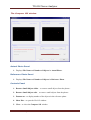
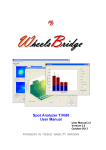
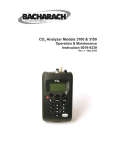
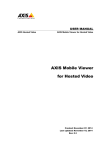
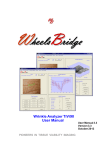
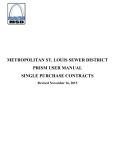
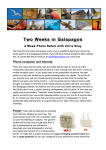
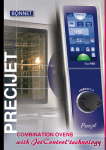
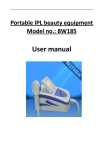
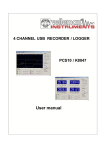
Nevus Analyzer TiVi102
User Manual
User Manual 1.1
Version 1.1
December 2012
PIONEERS IN TISSUE VIABILITY IMAGING
TiVi102 Nevus Analyzer Dear Valued Customer!
Welcome to the WheelsBridge TiVi102 Nevus Analyzer toolbox intended for automatic
analysis of naevi, moles and skin spots of different colours. The TiVi102 Nevus Analyzer was
designed for observer-independent analysis of skin spots in association with evaluation of
skin care products and for medical research applications.
The WheelsBridge TiVi 102 Nevus Analyzer utilizes a highly sensitive digital camera
equipped with polarization filters making it possible to suppress surface reflections from the
skin. The versatile system software – based on the MATLAB® high performance language for
technical computing – allows for rapid and easy capturing and analysis of images. Among the
many useful features of the TiVi 102 Nevus Analyzer software the following are of particular
interest:
•
Automatic capturing of photos.
•
Automatic tracking of skin objects by colour or intensity discrimination.
•
Removal of large and small objects from the nevus lesions map.
•
Individual display of objects (nevus lesions) by a scanning through procedure.
•
Individual determination of object area, border, colour and diameter.
•
Comparison of two naevi maps lesion by lesion.
•
Small objects removal from plot possible.
•
Automatic identification of spots with growing areas.
•
All data can be exported to ASCII-format spread sheets.
We are convinced that the TiVi102 Nevus Analyzer will be a productive tool in the assessment
and follow-up of human skin treatment with skin care products and in medical research.
Thank you for choosing the WheelsBridge TiVi102 nevus Analyzer.
WheelsBridge AB
TiVi102 Nevus Analyzer 1.1 Sida 1 TiVi102 Nevus Analyzer Information in this document is subject to change without notice and does not represent a
commitment on the part of WheelsBridge AB. No part of this manual may be reproduced or
transmitted in any form or by any means, electronically or mechanically, including
photocopying and recording, for any purpose without the written permission of WheelsBridge
AB.
Any use of application of WheelsBridge products must be performed by properly trained and
qualified personnel. WheelsBridge AB takes no responsibility for action taken on the basis of
information derived from the use of the product described in this manual or from
consequential damages in connection with furnishing, performance or use of this manual.
Licensee’s limited rights are governed by the license agreement between WheelsBridge AB
and MathWorks. Licensee may not modify or remove any license agreement file
(MarthWorks or third party) that is included with the MCR Libraries (“MCR Library
License”). Licensee of this Application accepts the terms of the MCR Library License.
WheelsBridge is a registered trade mark.
TiVi102 Nevus Analyzer 1.1 Sida 2 TiVi102 Nevus Analyzer 1. INTRODUCTION
Nevus (moles, birthmarks, brown spots) is the medical term for well-defined and benign
lesions of the skin. Skin cancer – especially malignant melanoma – however may arise from
pre-existing nevus lesions. It is therefore of interest to closely follow the development of
nevus spots with respect to changes in colour, area, border and diameter over time and pay
special attention to protecting sensitive skin from UV radiation and other skin damaging
factors.
The TiVi102 Nevus Analyzer makes it possible to automatically track important nevus
parameters such as area, border, colour and diameter and quantify how these parameters vary
over time and over the skin surface. It is further possible to compare the change of individual
naevi areas in two different photos and automatically detect spots with enlarged areas.
The intended use of the TiVi102 Nevus Analyzer is to analyse skin spots of different
shapes and colour in experimental and research applications. It is not yet approved for the
diagnosis and treatment of disease.
TiVi102 Nevus Analyzer 1.1 Sida 3 TiVi102 Nevus Analyzer 2. OPERATING PRINCIPLE
The basic operating principle of the TiVi102 Nevus Analyzer is probably best explained by a
flow chart (Fig 1). After having captured a high resolution photo (typically 18 Mpixels) of the
central part of the skin of the back, this photo is uploaded to the TiVi102 Nevus Analyzer.
Fig 1. Basic operating principle Flow Chart.
1. Upload the photo to the TiVi102 Nevus Analyzer.
2. Zoom in and move the zoomed-in window over the photo until a representative nevus
becomes visible.
3. Click on the nevus in the photo to display its colours against gray-scale background
(the colour space around the centre colour can be selected by the user). Alternatively
the intensity of the nevus can be used for colour space discrimination.
4. Zoom out until the target size of the sub-photo is attained. All nevus lesions within the
selected colour space become visible.
TiVi102 Nevus Analyzer 1.1 Sida 4 TiVi102 Nevus Analyzer 5. The individual nevus lesions are converted to individual objects. Their location can be
displayed as a black and white map.
6. Too small and too large objects can be eliminated (the user sets the size elimination
threshold).
7. The remaining individual objects (nevus lesions) can be displayed one-by-one. Their
area, border, colour and diameter are calculated and displayed.
8. All calculated data can be exported to an Excel® spreadsheet.
3. PHOTO CAPTURING
When capturing photos for the TiVi102 Nevus Analyzer, use the highest camera resolution and
place the camera about 1 m away from the object. This will give a field of view of about 430
mm x 290 mm and a resolution better than 0.1 mm per pixel. Set the filters to cross-polarized
mode. Set the AutoFocus switch to AF and the Stabilizer to ‘ON’. Use the zoom in feature to
attain a field of view that captures a photo of the central part of the back (Fig. 2), in order to
avoid shadows from the periphery and to get the highest resolution allowing also small skin
objects to be included and analyzed.
Fig 2. Place the camera one meter away from the object and use the zoom in feature to attain a
field of view that includes the central part of the skin of the back.
Open the TiVi701Camera window and set the Size Reduction to ‘Minor’ (under the Size
Reduction pull-down menu), the Select Photo Size to ‘Large Fine’ and the No of Photos to
‘1’ in accordance with Fig 3.
TiVi102 Nevus Analyzer 1.1 Sida 5 TiVi102 Nevus Analyzer Fig. 3. Setting Camera parameters in the TiVi701Camera window.
Power the Illuminator and switch off the ambient light in the room. Capture a photo and
store it in the selected folder under the selected name in the computer.
3. GETTING STARTED
The basic features of the TiVi102 Nevus Analyzer are probably best explained by way of an
example. In the following example it is assumed that the photo nevus-0001.jpg has been
captured by a Canon EOS550D/650D TiVi camera system and stored in the TiVi102
demonstration folder. This photo displays the central part of a back with a number of nevus
lesions of different sizes and colours.
1. Open the Nevus Analyzer toolbox from the Toolbox pull-down menu in the TiVi700
Analyzer window.
TiVi102 Nevus Analyzer 1.1 Sida 6 TiVi102 Nevus Analyzer 2. Click the Load Photo button and navigate to the TiVi102 demonstration folder and
select the nevus-0001.jpg.
3. Move the Zoom In slider upwards to about 90% of its maximum value. The part of the
photo displayed in the Photo panel is outlined in the Image panel photo.
TiVi102 Nevus Analyzer 1.1 Sida 7 TiVi102 Nevus Analyzer 4. Place the mouse pointer on the photo displayed in the Photo panel. Press the left mouse
button and drag the mouse over the photo. Release the mouse button. Repeat the
procedure until a representative nevus lesion appears in the zoomed-in photo.
TiVi102 Nevus Analyzer 1.1 Sida 8 TiVi102 Nevus Analyzer 5. Click on the nevus lesion in the zoomed-in photo without moving the mouse. The
selected nevus lesion will now be displayed against the surrounding skin displayed in
gray colour scale.
6. Move the Zoom In slider downwards to zoom out the photo to a size suitable for
further analysis. The zoomed-out window can be moved over the original photo by
placing the mouse pointer on the photo, pressing the left mouse button and dragging
the mouse pointer to a new position. The site of the zoomed-out window is outlined in
the original photo displayed in the Image panel.
TiVi102 Nevus Analyzer 1.1 Sida 9 TiVi102 Nevus Analyzer 7. Click the Mask radio-button to display the zoomed-out part of the photo in black and
white scale.
TiVi102 Nevus Analyzer 1.1 Sida 10 TiVi102 Nevus Analyzer 8. Click the Mixed radio-button and then the Display Objects button to open the Objects
window.
9. This sub-photo includes 261 objects. To eliminate the smallest objects move the
Remove Small slider to its rightmost position. The smallest objects are now deleted
and only 9 objects remain in the zoomed-in window. The average area, border, colour
and diameter of these 9 objects are displayed in the Average panel.
TiVi102 Nevus Analyzer 1.1 Sida 11 TiVi102 Nevus Analyzer 10. Click the Mixed radio-button to display the selected nevus lesion objects against a gray
scale coloured skin background.
11. Click the Enumerate button to display the object number next to the object.
TiVi102 Nevus Analyzer 1.1 Sida 12 TiVi102 Nevus Analyzer 12. Click the Mixed radio-button in the Display panel. Then click the Scan Through
button to display the different objects one-by-one. The parameters for the object
displayed are shown in the Actual Object panel.
TiVi102 Nevus Analyzer 1.1 Sida 13 TiVi102 Nevus Analyzer 13. Click the Scan Through button repeatedly to display the different objects and the
associated parameters.
14. Click the Export Data and select a name and folder to save the Excel file. Open the
Excel file to display the data.
15. This completes the GETTING STARTED section.
TiVi102 Nevus Analyzer 1.1 Sida 14 TiVi102 Nevus Analyzer 4. COMPARISON OF NAEVI MAPS
In the following example it is explained how the areas of different naevi in two different
photos can be compared and how an enlarging spot can be automatically identified.
1. Open the Nevus Analyzer toolbox from the Toolbox pull-down menu in the TiVi700
Analyzer window.
2. Click the Load Photo button, navigate to the TiVi102demonstration toolbox and
double-click on the Act-0001 photo.
3. Click the Load Ref Photo and double-click the Ref-0001 photo.
TiVi102 Nevus Analyzer 1.1 Sida 15 TiVi102 Nevus Analyzer 4. Place the mouse pointer on the darkest nevus click the left mouse button.
5. The Mixed photo is now displayed.
TiVi102 Nevus Analyzer 1.1 Sida 16 TiVi102 Nevus Analyzer 6. Click the Mask radio-button to display the black and white photo.
7. Drag the Expand Color slider somewhat to the right to expand the colour space and
include more spots.
TiVi102 Nevus Analyzer 1.1 Sida 17 TiVi102 Nevus Analyzer 8. Click the Show Actual Photo radio-button to display the black and white actual photo.
9. Select Synch Actual to Ref in the Select Standard Colour pull-down menu.
TiVi102 Nevus Analyzer 1.1 Sida 18 TiVi102 Nevus Analyzer 10. Click the Compare Images button.
11. The reference spot (largest spot) is now indicated by a red square in the Reference
Photo. Click on the corresponding spot in the Actual photo to synchronize the two
photos.
TiVi102 Nevus Analyzer 1.1 Sida 19 TiVi102 Nevus Analyzer 12. Print ‘100’ in the Remove Small Objects edit box to remove small objects.
13. Click the Show Plot button to display the Plot 102 window. The Diagram in the
Plot102 window displays the relationship between spot sizes in the Reference Photo
and the Actual Photo. Observe that one spot has a substantially higher value in the
Actual Photo than in the Reference Photo as indicated by the red dot in the Diagram.
TiVi102 Nevus Analyzer 1.1 Sida 20 TiVi102 Nevus Analyzer 14. Click on the red dot with the highest Actual Area value in the Diagram. The
corresponding spot is now identified in the photo by circumscribing it with a red
rectangle.
TiVi102 Nevus Analyzer 1.1 Sida 21 TiVi102 Nevus Analyzer 15. Check the Mask radio-button to display the corresponding black and white photo.
16. Check the Refresh button to hide the red rectangle circumscribing the actual spot.
Check the Actual Photo radio-button and then the Reference Photo radio-button to
verify that the actual spot is indeed larger in the Actual photo than in the Reference
photo.
17. Click the Export Data button to export the results to an Excel file. Open the Excel file
to display the data set.
18. This completes the COMPARISON OF NAEVI MAPS section.
TiVi102 Nevus Analyzer 1.1 Sida 22 TiVi102 Nevus Analyzer 5. DETAILED DESCRIPTION
The TiVi102 Nevus Analyzer main window
Photo Panel
1. Photo text – a text string that guides the user to the next step in the image processing
process.
2. Zoom In slider with edit box – to zoom in on a specific part of the photo. The section
displayed is outlined in the Image Panel photo.
3. Clicking in the photo – placing the mouse pointer somwhere in the photo, pressing
the left louse button and moving the mouse with the button pressed causes the zoomed
in region to move over the original photo. Clicking on a spot inside the photo without
moving the mouse generates a new photo with the colours representing the actual
point displayed against a gray-scale background photo. The colour space – the colours
displayed – is composed of colours around the colour of the point clicked on. The size
of this colour space is determined by the setting of the Expand Color slider.
4. Photo size – displays the size of the zoomed-in photo.
TiVi102 Nevus Analyzer 1.1 Sida 23 TiVi102 Nevus Analyzer 5. Date and Time – displays the date and time of photo capturing.
Select Photos Panel
1. Load Photo button – to load a new photo from file.
2. Load Ref Photo button – to load a new reference photo from file.
3. Show Actual Photo rb-button – to display the actual photo.
4. Show Ref Photo rb-button – to display the reference photo.
5. Display Panel: Photo, Mixed & Mask – check the Photo radio-button to display the
entire photo in colour. Check the Mixed radio-button to display the coloured nevus
lesions against gray-scale background skin. Check the Mask radio-button to display
the photos as black and white images.
6. Actual Photo edit-box – displays the name of the actual photo.
7. Reference Photo edit-box – displays the name of the reference photo.
8. Display Objects button – opens the Object window and transfers image information
to this window.
9. Clear All button – deletes photos and resets the system to start mode.
10. Display Colour Space button – opens the Colour Space window.
11. Reset button – resets the settings but keeps the photos uploaded and displayed.
12. Coordinates Panel – displays the coordinates of the zoomed-in photo.
Image Panel
1. Image text – displays the selected mode: Coulour Mode indicates that the Colour
Space is selected with the centre colour widened by the settings of the Expand
Colour slider. In this mode a dark nevus lesion can contain a core area outside the
selected Colour Space. Intensity Mode (default) indicates that the Intensity is
selected with the centre intensity increased by the setting of the Expand Color slider.
In this mode all pixels of an intensity lower than the centre intensity increased by the
Expand Color slider setting are included in the nevus lesions identified, i.e. a dark
nevus lesion will include its centre darker colours in the mask.
2. Centre edit-box – displays the centre colour of the Colour Space.
3. High edit-box – displays the brightest colour included in the Colour Space.
TiVi102 Nevus Analyzer 1.1 Sida 24 TiVi102 Nevus Analyzer 4. Low edit-box – displays the darkest colour included in the Colour Space.
5. Size – displays the size of the photo in pixels.
Select Colour Panel
1. Red slider & edit-box – sets the red centre colour (automatically updated when a
pixel is pointed on in the photo in the Photo Panel).
2. Green slider & edit-box – sets the green centre colour (automatically updated when a
pixel is pointed on in the photo in the Photo Panel).
3. Blue slider & edit-box – sets the blue centre colour (automatically updated when a
pixel is pointed on in the photo in the Photo Panel).
4. Expand Colour slider & edit-box- sets the extension of the Colour Space around the
centre colour (Colour Mode) or intensity threshold level above the centre intensity
(Intensity Mode).
5. Select standard Colour pull-down menu – sets predetermined centre colours and
width of Colour Space (and updates the sliders and edit boxes accordingly). By
Mouse Pointer – the Color Space is set by pointing at a point in the photo and
clicking the left mouse button. Light Nevus – The RBG-values of the centre point are
set to [0.5 0.3 0.2] and the Expand Color slider value to 0.1. Dark Nevus– The RBGvalues of the centre point are set to [0.25 0.15 0.1] and the Expand Color slider value
to 0.1. Synchronize – the Colors Space of the photo in focus is synchronized (made
equal to that of) with the hidden photo. After having clicked on a nevus to define a
colour space, two more items are added to the pull-down-menu if both the actual and
the reference photo are uploaded. Synch Act to Ref synchronizes the colour space of
the actual photo to that of the reference photo, while Synch Ref to Act synchronizes
the colour space of the reference photo to that of the actual photo. After synchronizing
the colour spaces of the two photos the Compare Images button is enabled.
6. Compare Images button – to open the Compare 102 window.
7. Int Mode button – this toggle button sets the system to operate in Colour Mode or
Intensity Mode.
8. Load Settings – loads saved parameter settings from file.
9. Save Settings – saves parameters to file.
10. Close – closes the TiVi102 Nevus Analyzer Toolbox.
TiVi102 Nevus Analyzer 1.1 Sida 25 TiVi102 Nevus Analyzer The Colour Space window
Limits Panel
1. Red Low Limit – displays the low red limit of the Colour Space.
2. Red High Limit – displays the high red limit of the Colour Space.
3. Green Low Limit – displays the low green limit of the Colour Space.
4. Green High Limit – displays the high green limit of the Colour Space.
5. Blue Low Limit – displays the low blue limit of the Colour Space.
6. Blue High Limit - displays the high blue limit of the Colour Space.
Select Colour Space Panel
1. ROI rb-button – displays the results in the RGB Colour Space.
2. HSV rb-button – displays the results in the HSV Colour Space.
3. Close-button – closes the Colour Space window.
4. Diagram rotation – to rotate the diagram by pointing on it with the mouse pointer and
pressing the left mouse button while moving the mouse.
TiVi102 Nevus Analyzer 1.1 Sida 26 TiVi102 Nevus Analyzer The Object window
Object Panel
1. Photo text – a text string that guides the user to the next step in the image processing
process.
2. Photo – displays the zoomed-in-photo imported from the TiVi102 Nevus Analyzer
main window.
Data Panel
1. File Name – displays the filename.
2. Actual Object Panel – displays number, area, border, colour and diameter of the
object (nevus lesion) selected.
3. Average Panel – displays number of nevus lesions and average area, border, colour
and diameter of the nevus lesions in the zoomed in photo.
TiVi102 Nevus Analyzer 1.1 Sida 27 TiVi102 Nevus Analyzer Control Panel
1. Remove Small Object slider & edit-box – removes small objects from the zoomedin photo.
2. Remove Large Object slider & edit-box – removes large objects from the zoomed-in
photo.
3. No.Bin edit-box – to set the number of bins in the histogram.
4. Histogram Type pull-down menu – to select the type of histogram to be displayed
(area, border or diameter).
5. Show Histogram button – toggles between Show histogram / Show Image to
display histogram or image.
6. Display Object button – toggles between Display Object / Display Map to display
individual objects (single nevus lesions) or image map.
7. Number of Objects text – displays the number of objects in the zoomed-in photo.
8. Size of Map text – size of map diplayed.
9. Mode text –indicates mode of operation – Intensity Mode or Colour Mode.
10. Display Panel: Photo, Mixed & Mask – displays the zoomed-in photo as pure colour
photo, coloured nevus lesions against gray background skin or black and white object
mask.
11. Indicator Settings Panel – to set the size of numbers and their distance to the objects
in the black and white image.
12. Enumerate button – toggles between Enumerate / No Numbers to display or hide
object numbers in the black and white image.
13. Export Data button – to export data to Excel® file.
14. Set Object Size slider and edit-box – to set the size of the individual object photo.
With the slider set to zero the boundaries of the largest object fills the entire photo.
15. Scan Through button and edit box – scans through and displays the individual
objects while updating the Actual Object panel parameters accordingly.
16. Close button – to close the Object window.
TiVi102 Nevus Analyzer 1.1 Sida 28 TiVi102 Nevus Analyzer Object window with a single object (nevus lesion) displayed.
TiVi102 Nevus Analyzer 1.1 Sida 29 TiVi102 Nevus Analyzer The Compare 102 window
Actual Photo Panel
1. Displays File Name and Number of Objects in Actual Photo .
Reference Photo Panel
1. Displays File Name and Number of Objects in Reference Photo .
Controls Panel
1. Remove Small Objects slider - to remove small objects from the photos .
2. Remove Small Objects edit - to remove small objects from the photos .
3. Enumerate – to display number of the objects in the reference photo.
4. Show Plot – to open the Plot102 window.
5. Close – to close the Compare 102 window.
TiVi102 Nevus Analyzer 1.1 Sida 30 TiVi102 Nevus Analyzer Display Panel
1. Photo radio-button – to display the full colour photos.
2. Mixed radio-button – to display the spots in colour space colours superimposed on
the full photo displayed in gray-scale colour.
3. Mask radio-button – to display the spots in white colour on black background.
The Plot 102 window
Diagram Panel
1. Displays areas of spots in the actual photo versus the corresponding areas of the spots
in the reference photo. Actual photo spot sizes are displayed as red dots if the
corresponding actual spot – reference spot areas ratio exceeds the warning limit as set
by the Warning slider. Spots along the y-axes (spots existing only in the actual
photo) are indicated by yellow dots while spots along the x-axis (spots existing only in
the reference photo) are indicated by green dots. The remaining spots are indicated by
blue dots.
TiVi102 Nevus Analyzer 1.1 Sida 31 TiVi102 Nevus Analyzer 2. Any dot in the Diagram clicked on by the mouse pointer automatiaclly identified the
corrsponding spot in the reference photo by circumventing it by a red square in the
photo.
Photo Panel
1. Displays the photo, mixed photo or the spots (white on black background). A red
sqaure is automatically drawn around the spot corresponding to the dot clicked on by
the mouse in the Diagram.
Display Panel
1. Displays filename of the actual and reference photo displayed as well as the number of
objects in the corresponding photos.
2. Photo radio-button – to display the full colour photos.
3. Mixed radio-button – to display the spots of selected colour space colours against a
gray-scale version of the photo.
4. Mask radio-button – to display the spots in the actual or reference photo in white
colour against a black background.
5. Actual photo – to display the Actual Photo.
6. Reference photo – to display the Reference Photo.
7. Export Data – to export data to an Excel spread-sheet.
8. Refresh – to remove the red square circumventiung the selected spot from the photo.
9. Close – to close the Plot 102 window.
TiVi102 Nevus Analyzer 1.1 Sida 32