1
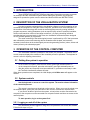
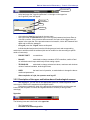
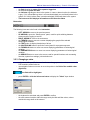
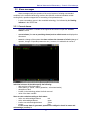
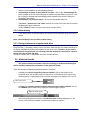
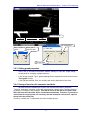
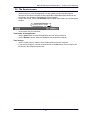
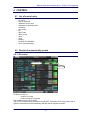
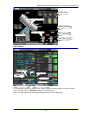
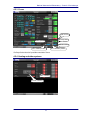
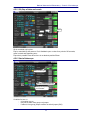
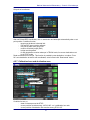
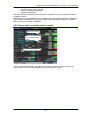
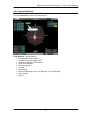
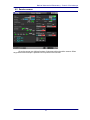
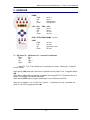
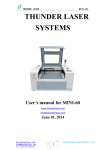
National Astronomical Observatory
Rozhen, Bulgaria
Control of 2m telescope
USER MANUAL
date:
visualization:
version:
processed:
6. 9. 2009
TomPack 2
1.0.0
Jan Rieger, DiS.
All rights of author reserved.
Reproduction or abandonment those
documentation another side, requires written
agreement of firm ProjectSoft HK a.s.
www.projectsoft.cz
ProjectSoft HK a.s.
Eliščino nábřeží 375
500 03 Hradec Králové
Czech republic
National Astronomical Observatory – Control of 2m telescope
CONTENT
1
2
3
4
5
6
7
INTRODUCTION................................................................................................................. 3
DESCRIPTION OF THE VISUALISATION SYSTEM........................................................... 3
OPERATION OF THE CONTROL COMPUTER.................................................................. 3
3.1
Putting the system to operation................................................................................... 3
3.2
System controls .......................................................................................................... 3
3.2.1
Logging on and off of the system......................................................................... 3
3.2.2
Description of the upper and bottom bars of technological screens ..................... 4
3.2.3
Changing a value ................................................................................................ 5
3.3
Alarm messages ......................................................................................................... 6
3.3.1
Current alarms .................................................................................................... 6
3.3.2
Alarm history ....................................................................................................... 7
3.3.3
Saving of alarms to computer hard drive ............................................................. 7
3.4
Historical trends .......................................................................................................... 7
3.4.1
Reading out of graph........................................................................................... 8
3.4.2
Movements in time .............................................................................................. 8
3.4.3
Setting graph properties ...................................................................................... 9
3.4.4
Saving of trend on the computer hard drive ......................................................... 9
3.5
The Service screen ................................................................................................... 10
CONTROL......................................................................................................................... 11
4.1
List of control units .................................................................................................... 11
4.2
Control of automatically system ................................................................................ 11
4.2.1
Oil control.......................................................................................................... 11
4.2.2
Dome ................................................................................................................ 12
4.2.3
Focus ................................................................................................................ 13
4.2.4
Heating and other systems................................................................................ 13
4.2.5
Slit, flap of tube and coude ................................................................................ 14
4.2.6
Start of telescope .............................................................................................. 14
4.2.7
Calibration hour and declination axes................................................................ 15
4.2.8
Hour’s move, correction and error model........................................................... 16
4.2.9
Special functions ............................................................................................... 17
4.3
Service screen .......................................................................................................... 18
HANDLER ......................................................................................................................... 19
Data collection for TPOINT................................................................................................ 20
MAINTENANCE AND SERVICE OF THE CONTROL COMPUTER .................................. 21
7.1
Fail-safe operation policy .......................................................................................... 21
7.2
Troubleshooting ........................................................................................................ 21
7.3
Modifications of hardware and software of the control computer ............................... 22
7.4
Maintenance and back-up......................................................................................... 22
2
National Astronomical Observatory – Control of 2m telescope
1 INTRODUCTION
These OPERATING INSTRUCTIONS provides basic information necessary to operate
2m telescope and the visualization system. Before starting any operation, the personnel
assigned to operate the system must be trained and familiar with these INSTRUCTIONS.
2 DESCRIPTION OF THE VISUALISATION SYSTEM
A control computer equipped with the visualization software is used for operation of the
controlled technological file. Using this control computer, operators have visual information on
the condition of the technology and control the technological process by running individual
program sequences, setting parameters (such as required (set) values of controlled variables,
minimum and maximum values of two-stage controls etc.) or simply controlling individual
actuating devices in manual mode. In this case, the visualization software has been designed
on the TomPack platform by ProjectSoft.
The actual controlling of the technological process is performed by a PLC that processes
data collected by sensors and metering devices located around the plant, and executes
necessary interventions to the technological process using actuating devices (valves, drives and
motors) as set by the selected program.
3 OPERATION OF THE CONTROL COMPUTER
The visualization software is installed on the control (PC) computer. The monitor of the
control computer displays the condition of the controlled process to operators. The keyboard or
mouse is used for inputting interventions.
3.1 Putting the system to operation
-
on the monitor front panel, press the main switch; green light indicates power on
on the computer front panel, press the main switch; green light indicates power on
after the monitor and computer have been switched on, procedures necessary to start
the TomPack visualization software will start.
When these procedures are completed, the initial display called Main menu will appear on the
monitor.
3.2 System controls
Use the keyboard or mouse to control the system. The monitor shows information
of the controlled process.
The mouse is used to move the pointer on the monitor. When you move the pointer over
the selected object, press (click) the left button of the mouse to execute the required action.
If you want to be able to print from the system, a local printer must be connected to the
computer or the computer must be connected to a computer network and have an access to the
network printer.
To start operation, log in to the system first!
3.2.1 Logging on and off of the system
Only authorized persons logged on using their user passwords can access the software.
Follow these steps to log on:
3
National Astronomical Observatory – Control of 2m telescope
Logon/off button
-
select and press the "Logon/Logoff button" on the right on the upper bar
the "Logon/off” panel will appear
Logoff button
User
Password
-
-
click inside the User field and type in the user name
then click inside the Password field, type in the required password and press Enter or
click OK to confirm. If the procedure was successful, the name of the logged user will
appear in the upper bar. If the procedure was not successful, click to the Password field
again and re-enter the password.
to log off, press the “Logoff” button at this panel
Individual authorized persons have the following access levels and corresponding
restrictions to activities within the software (this can be modified on-site according to specific
needs of customers):
-
PROJECTSOFT
no restrictions
-
M and R
authorized to change constants of PID controllers, switch off and
on individual control loops and directly control analog outputs
-
TECHNOLOG
authorized to change selected set values, maximum and minimum
values of metered variables, technological times
-
USER
the basic level of operation, no authorization to change the abovementioned parameters
After completion of a job, the operator must log off!
3.2.2 Description of the upper and bottom bars of technological screens
After logging on, you can click on the appropriate symbol of a technological file in the
main menu to switch to the respective technological screen.
Each screen contains the chart of the appropriate technological file and the upper and
lower bars with a system of controls and signals common to all files (or having similar
meanings).
Upper bar
The following items are to be found in the upper bar:
-
The Projectsoft logo
the name of the technological file
4
National Astronomical Observatory – Control of 2m telescope
-
-
the field showing the name of the operator logged on
the field showing date and time
the indicator signaling an alarm in the system. In case no alarm is active, the indicator
is grey. If it is yellow-flashing, there is a non-acknowledged (non-confirmed) alarm in the
system. If it is solid yellow, there is an acknowledged (confirmed) alarm in the system
The bottom red line displays information on the last active alarm
Bottom bar
The following items are to be found in the bottom bar:
-
LEFT ARROW to move to the previous screen
UP ARROW to open the “Select screen” panel, used for quick switching between
screens and for logging on and off
RIGHT ARROW to move to the next screen
the TRENDS button to move to a screen displaying the graph of the selected
technological variables
the TEXT button to display descriptions of drives
the CONTROLING button to open the Control panel for a program sequence
the FORMULAS button to move to a screen displaying parameters of technological
variables
the PARAMETERS button to move to a screen displaying parameters of technological
variables
the SERVICE button to move to the screen used for special functions such as naming
formulas, system time settings, job termination etc.
3.2.3 Changing a value
-
only users with specified access levels can change parameter values, constants of
PID controllers, alarm limits etc.
use navigation buttons or mouse to move the pointer to the field of the variable value
(light blue)
the field will be highlighter
-
press ENTER or click the left mouse button to display the "Value" input window
-
the keyboard to enter date and press ENTER to confirm
the value entered must be within the range set by the Min and Max values; values
outside this range shall not be entered
5
National Astronomical Observatory – Control of 2m telescope
3.3 Alarm messages
Alarm messages notify the operator of the control system of existing non-standard
conditions in the controlled technology such as drive failures, monitored variables outside
working limits, operation stopped due to exceeding of set parameters etc.
-
in case a new alarm occurs in the controlled technology, it is indicated by the flashing
indicator in the UPPER bar
3.3.1 Current alarms
-
select the exclamation "!" button in the upper bar and click it to open the “Current
alarms” screen
-
current alarms (i.e. new or persisting alarms) and so-called events are displayed on
this screen
-
event is a change of the system that does not have the character of a fault (change of
operator, change of important parameters etc.), however, it is advisable to monitor it
individual columns of the table specify the following:
- date and time of fault generation
- alarm status (A - active, + alarm generation, - alarm termination)
- description of fault
- location in the technology where the fault occurred
- value of the alarm variable
lines are color coded according to their status:
- active non-acknowledged alarms:
red
- active acknowledged alarms:
green
- inactive non-acknowledged alarms:
yellow
- events:
blue
In case a new alarm is generated, operators are obliged to check its cause and
acknowledge (confirm) it.
6
National Astronomical Observatory – Control of 2m telescope
- there are two possibilities of acknowledging alarms:
1. acknowledge all alarms in the system at one time - click on the “Acknowledge all”
button located on the left of the lower bar the indicator will stop flashing, however, it will
be on (solid) to indicate that acknowledged faults (operators are aware of them) are
persisting in the system
2. acknowledge only selected alarms - click to the appropriate alarm line
-
"up arrow", "down arrow" and "Start” buttons on the left of the lower bar are used for
navigation through the alarm list
use the “History” button to move to the screen of alarm history
3.3.2 Alarm history
-
in the alarm history, terminated alarms and events can be displayed along with current
alarms
Note: acknowledging is not possible in alarm history.
3.3.3 Saving of alarms to computer hard drive
All alarms are saved to the hard disk in the AlarmList.dat file located in C:\Program
Files\TomPack_2. Generally, history is set to 100 days. After this time, the oldest recordings in
the file are automatically deleted and replaced by the newer ones. Therefore, if you want to
archive data for longer period, it is necessary that the backup be carried out in a period
shorter then the set time 100 days.
If need be, contact your IT department and solve the backup issue.
3.4 Historical trends
The system of historical trends is used for archiving of measured technological
values and their subsequent presentation in the graphical format.
There are two ways of displaying historical trends in TomPack:
-
to display the trend of a specific measured variable, click on the symbol of the
controlled value (the left black section of the box) or on the symbol of the control loop
actuating device. Control panel of the controller will appear (see chapters 3.2.6 and 7).
Open control panel
-
to display the summary trend of multiple measured inter-related variables, click on
the TRENDS button located in the lower bar of technological screens
Open the trend screen
-
when first opening the trend screen, the real-time trend is always displayed, i.e. the
course of the measured variable is continuously updated in real-time
7
National Astronomical Observatory – Control of 2m telescope
3.4.1 Reading out of graph
-
-
on the right of the graph, displayed variables are listed; for each variable,
information updated at every movement of the slide ruler is displayed under the name
of the variable
how to read out values in the graph using the slide ruler: position the pointer to the
"Y" axis, press the left mouse button, hold it and drag
date and time is displayed above the ruler; in this position, values are read out and they
display in the mentioned list of values
3.4.2 Movements in time
1. viewing of real-time course
- if you want to change the time range of the displayed variable in real time, you can use
the following buttons located in the lower bar:
-
the „Detail“, button used to enlarge the time range
the „Look in“, button used to reduce the time range
the "Today" button to display the past 24 hours
the "Stop of trend" button used to stop updating of the graph
-
alternatively, the following steps can be used:
click on the "X" axis above the position marked "Time From" to open the "Time
setting" control panel for the time shift
in the control panel, the time from which we want to display the course can be set
directly or the button for shifting the time back (Back panel) by certain amount of time
can be used
in this way, the graph will be extended to the past
-
-
2. viewing the course in past
- the "Stop of trend" button used to stop updating of the graph
- click on the "X" axis above the position marked "Time From" to open the "Time setting"
control panel for the time shift
- in the control panel, the time from which we want to display the course can be set
directly or the button for shifting the time back (Back panel) by certain amount of time
can be used
- in this way, the graph will be extended to the past
- however, if you want to shift the course in time while maintaining the same width of the
graph, the "retain width" box should be checked
- similarly, if the course has already been shifted to the past and you want to shift it
forward in time, click on the "X" axis above the position marked "Time From" to open
the "Time setting" control panel for the time shift
- in the control panel, the time to which we want to display the course can be set directly
or the button for shifting the time forward (Forward panel) by certain amount of time can
be used
8
National Astronomical Observatory – Control of 2m telescope
Slide ruler
The values
reading out
of a graph
„Time from“setting
„Time to“setting
Time shift forward
Stop or update
values
Show grids of
value and time
Time shift back
3.4.3 Setting graph properties
-
click on the "X" axis above the position marked "Settings" to open the "Graph setting"
control panel for changing of graph properties
-
in the left part marked "Type", graph updating can be stopped (the same function as the
"Stop graph" button)
in the right part marked "Grid", an auxiliary grid can be displayed for both axes
-
3.4.4 Saving of trend on the computer hard drive
All trend-monitored variables are saved to the computer hard disk on which the
“Tpserver” application is running, to files with .jou extension, directly to the TomPack directory
(by default, C:\Program Files\Tompack). Files will be stored in the disk for the preset time.
After this time, the oldest files will be overwritten automatically. Therefore, if you want to
archive data for longer period, it is necessary that the backup be carried out in a period
shorter then the preset time.
If need be, contact your IT department and solve the backup issue.
9
National Astronomical Observatory – Control of 2m telescope
3.5 The Service screen
-
-
use this screen to close the application, set the system time and set other special
functions of the control computer, that are application dependant (these functions are
described in the Operating instructions for control system)
to open the screen, click to the SERVICE button located in the lower bar of technological
screens
Open the Service screen
- on the screen are next functions:
Termination of the application:
- use the Close button to close the application and turn off the computer
- use the Restart button to close the application and restart the computer
Time settings:
- use the "Load” button to load the current date and time from the computer
- if you want to change it, set new values and click on the Set button; the new values will
be stored to the computer system time
10
National Astronomical Observatory – Control of 2m telescope
4 CONTROL
4.1 List of control units
-
oil control
turn on telescope
calibration of hour axis
calibration of declination axis
correction
error model
slit
flap of tube
flap of coude
dome
focus
heating
set point of coordinates
hour’s move (tracking)
4.2 Control of automatically system
4.2.1 Oil control
Start/Stop of oil
State of oil
Condition for turn on:
- must be oil in tank
- must be pressure of nitrogen
This condition so turn off oil control.
Stop of oil is possible when telescope is in state OFF. If decrease oil in some parts of the oil
system is telescope turn off automatically and after that is stopped oil system.
11
National Astronomical Observatory – Control of 2m telescope
Pressure of oil
Pressure in distributor
Pressure of nitrogen
Level of oil in tank I
Level of oil in tank II
Pressure of oil
Temperature of pump
4.2.2 Dome
Start auto follow
Stop
State of dome
Control voltage
of DOME
Manual control
Actual position
Go to relative position
Go to absolute position
For controlled of dome you must turn on control voltage for dome, when you click on button
“ON” in section “Dome”. Attention – tension is on trolley wire.
When you start auto follow, dome automatically follow move of telescope.
12
National Astronomical Observatory – Control of 2m telescope
4.2.3 Focus
Stop
State of focus
Actual position
Select speed
Manual control
Go to relative position
If is flap of tube close isn’t possible controlled of focus.
4.2.4 Heating and other systems
State of heating
Control of heating
13
Go to absolute position
National Astronomical Observatory – Control of 2m telescope
4.2.5 Slit, flap of tube and coude
Close
Stop
State
Open
Slit is controlled only by time.
Flap is controlled by end sensors. If isn’t feedback open or close for a period of 30 seconds,
motor is stood and signalizing error.
Flap tube is possible close when focus is on absolute position 50mm.
4.2.6 Start of telescope
Start of telescope
Manual control of telescope
Dialogs for set point
of coordinates
Condition for turn on:
- oil must be turn on
- may not be alarm from group non-jumper
- if alarm is from group jumper must be on switch jumper (SA2)
14
National Astronomical Observatory – Control of 2m telescope
Set point of coordinates
After set RA and DEC coordinates, click on start button and telescope automatically slew on set
point position. Condition for slew:
- target must be above horizontal limit
- RA and DEC axes must be calibrate
- may not be alarm from group limit
- must be off switch jumper (SA2)
- bridge must be parked
- for star destination must be telescope in TRACK mode, for source destination must
be in STOP mode
Read coordinates from text file. This function is possible by star destination. In textbox “From
file” set a destination to text file with coordinates, set a line and click “Read actual” button.
4.2.7 Calibration hour and declination axes
Manual start of centering
Start of calibration
State of calibration
Condition for turn on:
- state of telescope must be STOP
- source position must be among -180° till 180° - on ly calibration hour axis
- source position of declination axis must be among 55° till 125°
15
National Astronomical Observatory – Control of 2m telescope
- may not be alarm from group limit
- must be off switch jumper (SA2)
- bridge must be parked
After start calibration, telescope slew fast (speed in parameter 3) on crude calibration position
by absolute sensor.
When is near of crude calibration position switch speed on fine calibration (speed in parameter
4) and looking for position by home sensor. When is interception home position, set position
and to event record overlap of calibration.
4.2.8 Hour’s move, correction and error model
Start of hour’s move
Turn on of corrections,
error model and guide
mode
Select index of error model
Turn on corrections (aberration, precession and nutation, refraction and error model) and
selecting index of error model is possible only when is stop hour’s move.
16
National Astronomical Observatory – Control of 2m telescope
4.2.9 Special functions
On screen Observatory is button with special function.
STOP observe
STOP Observe – ending observe.
• stop automatic follow of dome
• set dome to absolute position 180°
• set focus to absolute position 50mm
• close coude aperture
• close tube aperture
• close slit
• stop tracking
• source coordinate go to H.A. -90° 00m 00s / D.A. 9 0° 00m 00s
• stop telescope
• stop oil
17
National Astronomical Observatory – Control of 2m telescope
4.3 Service screen
On service screen are visible all system of telescope with end position sensors. When
any problem with telescope is possible find out problem on this screen.
18
National Astronomical Observatory – Control of 2m telescope
5 HANDLER
DOME
Right
Left
Up
Down
dome +
dome –
wind shutter +
wind shutter –
F/R1 – fast F/R2 – slow
Right
focus +
Left
focus –
Up
not use
Down
not use
OFS1, OFS2, M1M2, M3M4 – not use
USR1
Right
Left
Up
Down
not use
not use
light in the dome
not use
T1 – big motor T2 – small motor T3 – recount of coordinates
Right
RA +
Left
RA Up
DEC +
Down
DEC Speed T1, T2 or T3 is possible set in visualization on screen “Telescope I” in “Manual
control” section.
When shining LIM, telescope if after limits. Is possible use only speed T2 or T3 together button
LIM.
When shining CR, bridge isn’t parking. Is possible use only speed T2 or T3 without limits. And
speed T1 is possible use together button CR.
When shining STOP button, program of telescope is turn off. Motors are STOP.
When H.A. is between -2° to +2° and D.A. is under 0 ° -> telescope is on rod. Is possible use
speed T1 UP (DEC+) together button LIM.
19
National Astronomical Observatory – Control of 2m telescope
6 Data collection for TPOINT
1st – for data collection for TPOIN must be calibration both axis of the telescope. Calibrations
turn on of Start button on screen Control I. (Hour axis calibration, Declination axis
calibration). Hour axis calibration is possible start when declination axis has 55° and more.
Calibration is possible when is tracking off state.
Check UTC time and DUT1 in parameters.
2nd – turn on corrections aberration, precession and nutation, refraction and guide mode, when
exist any error model select index of model and turn on error model. After that, turn on tracking
(hour move).
3rd – Go to star coordinates from catalogue J2000. On screen Control I. is button Sky for open
dialog “sky coordinates”.
Set coordinates:
- click on line RA and set number e.g. 183714.00 for 18h37m14.00s
- click on line DEC and set number e.g. 384730.00 for 38°47’30.00’’
- select orientation EAST or WEST (once EAST, once WEST)
- click on Start button – telescope start slew (pointing)
or
- set file with star catalogue
- set line
- click on button Read actual (Read next – add line by 1 and read line) – program reads line
from file and add yearly move of star
- select orientation EAST or WEST (once EAST, once WEST)
- click on Start button – telescope start slew (pointing)
4th – when is telescope on start coordinates, you must set star to center of screen or finder. You
must use only speed T3!!! When is star in center click on button TPC on screen Control I. Will
show dialog “TPC”. In this dialog click on button Read and after that click button Write record.
File with data will save to disk C.
5th – every 5 stars start calibration both axis. And check overlap in history of alarms (go to alarm
click on button on top bar, left, button with exclamation. After click on button last day and end, it
is blue line) must be to 3.0’’. When overlap lager data are not correct.
6th – in TPOINT program (execute, shortcut is in desktop)
You can edit file generate from TPC TomPack. When you have more files you can add lines
from one file to second file.
Commands on TPOINT
indat C:\file.dat – open file with data
use ih id np ch me ma tf daf – for set counting parameters
fit – for count and display
gscat – show map
gsmap – show map
20
National Astronomical Observatory – Control of 2m telescope
7 MAINTENANCE AND SERVICE OF THE CONTROL
COMPUTER
7.1 Fail-safe operation policy
To ensure fail-safe operation of the control computer, the following rules must be observed:
- only duly trained and instructed personnel can operate the control computer
- smoking is forbidden in the computer room
- carefully protect the computer and keyboard against contamination
- if not necessary, do not move the computer
- if you need to move it, store it in a clean, dust-free room with constant room temperature
without excessive humidity and vibrations
- if you are planning not to use the computer for longer time, properly close the software
first (see the Service screen) and turn off the computer and monitor
7.2 Troubleshooting
software is not responding to mouse or keyboard actions
- check connectors for loose connections
- if connectors are ok, the software may be “frozen”; in this case, restart the computer
(cycle the main switch of the computer)
-
in case restarting does not solve the problem, peripheral devices - mouse or keyboard may be defective; try to use another mouse and keyboard
technology cannot be controlled by the program; invalid values are displayed on the
screen
- the problem is caused by communication failure between the control computer and the
programmable automated control unit (PLC) indicated by yellow-flashing computer icon
located to the right of the upper bar (see Description of the upper and lower bars) and
the alarm message named " Communication failure "
- check whether the communication line connector is properly inserted in the computer
and the PLC
- in case a communication converter is used, check whether it is connected and powered
technology cannot be controlled by the program; valid values are displayed on the
screen
- the problem may be caused by a programmable control unit fault (see Operating
instructions for the control system of the technology, chapter Maintenance of control
system)
printing from the application is not working
- check whether printing is enabled in the Servis (Service) screen
- check whether the printer is properly connected and whether it is in Ready status
(generally, solid green light indicates the status)
- if the mentioned causes are ok, ask your IT department or the administrator to try
printing directly from Windows
21
National Astronomical Observatory – Control of 2m telescope
7.3 Modifications of hardware and software of the control computer
-
any modifications of the control computer hardware and software, even after the
warranty, must be consulted with our technicians first
our company is not responsible for potential functional problems of the control computer
caused by non-consulted modifications
in case any non-consulted modifications of hardware or software are made during
warranty period, the warranty is void
from this point of view, replacing the keyboard, mouse or monitor is not considered
hardware modification
7.4 Maintenance and back-up
-
-
no maintenance is necessary on the control computer, with the exception of cleaning the
keyboard, mouse and monitor screen
in case the computer is equipped with a back-up source (UPS), the battery must be
replaced or recalibrated in intervals set by the manufacturer
if you require archiving of alarm message and historical trend files for future purpose
such as for inspection authorities, back up files regularly as described in chapters Alarm
messages and Historical trends
in all these cases, contact your IT department or administrator and discuss specific
solutions
22