1
University of
Graduate School
215 South
Narragansett,
Revised: October 2005
Rhode Island
of Oceanography
Ferry Road
RI,
RI, USA 02882
Table of Contents
Chapter 1
1.1
1.2
1.3
1.4
1.5
1.6
1.7
IES Model 6.2 OVERVIEW ………………………………………………………
INSTRUMENT FEATURES ……………………………………….……………...
OPTIONAL MODIFICATIONS ……………………………………..………..……..
STANDARD ACCESSORIES …..………………………………..………..………
REFURBISHING KITS AND SPARE PARTS ……………………………………
IES Model 6.2 SPECIFICATIONS ………………………………..……………..…
TRAVEL TIME MEASUREMENTS ………………………………………………..
PRESSURE and TEMPERATURE MEASUREMENT ……….………………….…
1.7.1 PIES Measurement Technique ………………………………………………
1.8 IES PARTS LOCATION DIAGRAM ……………………………………………….
1-1
1-1
1-2
1-2
1-2
1-3
1-4
1-5
1-5
1-6
Chapter 2 GETTING STARTED - CONFIGURING THE IES …………………………..
2.1 INTERNAL SWITCHES & CONNECTORS ……………………………..…………
2.2 COMMUNICATIONS ……………………………………………………………….
2.2.1 Communications Setup ……………………………………………...………
2.2.2 RESET Sequence ……………………………………………………………
2.3 USER INTERFACE - MENU MODE ………………………………………………..
2.3.1 One Minute Warning ………………………………………………………..
2.3.2 IES Main Menu …………………………………………………………….….
2.3.3 IES Mission Setup Menu ………….……………………..……………….…
2.3.3.1 Saving a New Mission Configuration …………………………………..
2.3.4 Optional Sensor Menus ………………………………………………………
2.3.5 IES Memory Card Menu …………..………………………………….………..
2-1
2-2
2-3
2-3
2-4
2-6
2-6
2-7
2-8
2-9
2-10
2-11
Chapter 3
3.1
3.2
3.3
3-1
3-1
3-2
3-4
3-5
3-5
3-6
3-6
3-6
3-6
3-6
3-6
3-7
3-8
3-9
3-10
3-11
3-12
3.4
3.5
3.6
3.7
3.8
3.9
ADVANCED PLANNING & PREDEPLOYMENT TESTING ……………….
ADVANCED PLANNING …………………………………………………………
IES SELF-TEST MENU …………………………………………………………...
BATTERY LIFE ……………………………………………………………....…...
3.3.1 Replacing the Batteries ……….…………………………………………..…..
3.3.2 De-Passivating the Battery Pack ………………………………………………
DATA ACQUISITION SCHEDULES ……………………………………………….
3.4.1 Travel Time Measurements …………………………………………………
3.4.2 Pressure & Temperature Measurements ………………………………..……
3.4.3 Pressure & Temperature Raw Data Measurements ………………………..….
3.4.4 Engineering Data Measurements …………………………………………..….
3.4.5 Memory Card Operation Schedule ………………………………..…………
MEMORY CAPACITY VS. DEPLOYMENT TIME & SAMPLING SCHEDULE .
TEMPERATURE & PRESSURE OFFSETS……………………………………….
ACOUSTIC OUTPUT vs. DEPTH CONSIDERATIONS …………………………..
SETTING THE AUTO-RELEASE DATE & TIME ………………………………..
DEPLOYMENT CHECKLIST …………………………………………………..…..
3.9.1 Important Checklist Notes ……………………………………………………
1
Chapter 4 DATA RECOVERY & ANALYSIS ……………………………………………..
4.1 DATA OFFLOAD TECHNIQUES …………………………………………………
4.2 MEMORY CARD FILE MANAGEMENT……..……………………………….…
4.2.1 File Types ………………………………………………………………….….
4.2.2 Data File Creation and File Names ………………………………………….
4.2.3 Data Recording, Day Buffers and the Time Stamp ………………………...
4.3 RECORD TYPES & FORMATS ……..……………………………………….….
4.3.1 System Log File ……..………..…………………………………………….
4.3.2 Engineering Data File ……………………………………………………...
4.3.3 Travel Time Data File ………………………………………………..….…
4.3.4 Pressure and Temperature Data File ………………………………………
4.3.5 Pressure and Temperature Raw Data File …………………………………..
4.3.6 Telemetry Data File …………………………………………………………
4-1
4-1
4-1
4-2
4-2
4-3
4-3
4-4
4-5
4-6
4-7
4-9
4-10
Chapter 5
5.1
5.2
5.3
ACOUSTIC COMMAND SUBSYSTEM (ACS) ………………………………..
PROGRAMMING THE ACOUSTIC COMMANDS ……………………………..
ACOUSTIC COMMAND ENCODING EXAMPLE …………………………..….
ACOUSTIC COMMAND DETAILS ………………………………………….…..
5-1
5-1
5-4
5-6
Chapter 6
6.1
6.2
6.3
6.4
6.5
CIRCUIT DETAILS ……………………………………………………………..
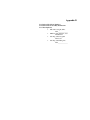
BATTERY PACK …………………………………………………………….……
PERSISTOR COMPUTER MODULE & MEMORY CARD …………………….
RECOVERY AIDS (the RELOC Module) ………………………………………..
FAIL-SAFE CIRCUITS ……………………………………………………………
DYNAMIC CLOCK ADJUSTMENT ……………………………………………..
6-1
6-1
6-2
6-2
6-3
6-3
Chapter 7
7.1
7.2
7.3
7.4
7.5
IES ASSEMBLY INSTRUCTIONS ………………………………………..……
GLASS INSTRUMENT HOUSINGS………………………………………….……
SEALING THE GLASS SPHERE……………..…………………………………..
HARD HAT ASSEMBLY …………………………………………………………
BURN-WIRE RELEASE MECHANISM …………………………………….……
PRESSURE & VACUUM PORTS ………………………………………………….
7-1
7-1
7-2
7-4
7-6
7-6
Chapter 8 AT-SEA OPERATIONS - IMPORTANT NOTES ……………………….……
8.1 DEPLOYMENT …………………………………………………………………….
8.1.1 Launch Precautions …………………………………………………………...
8.1.2 Selecting and Attaching the IES Anchor………………………………………
8.1.3 Acoustic Tracking Operations ………………………………………………...
8.1.4 Acoustic Telemetry Operations ………………………………………………..
8.2 RECOVERY …………………………………………………………………………
8.2.1 Acoustic Commands …………………………………………………………..
8.2.2 Burn Wire Release Mechanism ……………………………………………….
8.2.3 RELOC Module ………………………………………………………..……
8.2.4 Flag and Reflective Tape ………………………………………………………
8.2.5 Floating Recovery Line ………………………………………………………
8-1
8-1
8-1
8-2
8-3
8-4
8-5
8-5
8-5
8-6
8-6
8-6
Chapter 9 MAINTENANCE …………………………………………………………………
9.1 PRESSURE SENSOR ………………………………………………………………
9.1.1 Cleaning & Filling the Pressure Port …………………………………………
9.1.2 Pressure Sensor Calibration …………………………………………………..
9.2 INSTRUMENT HOUSING ………………………………………………………..
9.3 GLASS PENETRATORS ……………………………………………………….….
9.4 RELEASE BLOCK …………………………………………………………………
9.5 LOADING NEW FIRMWARE …………………………….………………….…...
9-1
9-1
9-1
9-2
9-2
9-2
9-3
9-3
2
Chapter 10 Advanced Acoustic Telemetry Option (for PIES and C-PIES Configurations) .
10.1 PDT TELEMETRY TECHNIQUE ……………………………………………….
10.2 IES DATA PROCESSING FOR FILE TELEMETRY DATA ……………………..
10.2.1 tau data ………………………………………………………………………
10.2.2 pressure data …………………………………………………………………
10.2.3 current meter data ……………………………………………………………
10.3 IES SCHEDULE FOR PDT OPERATIONS ……………………………………..
10.4 PDT RECORD FRAMING ……………………………………………………….
10.5 PDT RECEIVER DATA LOGGING ……………………………………………..
10.6 RECEIVING: BURST PDT vs FILE PDT ………………………………………..
10.7 BURST TELEMETRY REPORT ………………………………………………..
10.8 BURST TELEMETRY CHECKLIST ……………………………………………
10.9 FILE TELEMETRY ………………………………………………………………
10.10 FILE TELEMETRY CHECKLIST ……………………………………………...
10.11 ADDITIONAL TELEMETRY OPERATIONS NOTES ………………………….
10.11.1 Telemetry Session Interrupt – Saving the File Pointer …………………..
10.11.2 Telemetry Session Interrupt – Pause at 2330 hours ………………………
10.11.3 Telemetry After Failed Release ………………...…………………………
10-1
10-1
10-2
10-2
10-2
10-2
10-3
10-3
10-3
10-4
10-4
10-5
10-7
10-10
10-11
10-11
10-11
10-12
Chapter 11 Acoustic Tracking & Telemetry – At Sea Operations …………….……………
11.1 TELEMETRY CRUISE PREPARATIONS ………………………………………..
11.1.1 Hardware & Software Requirements………………………………………….
11.1.2 Shipboard Equipment Setup ………………………………………………….
11.2 PREPARATIONS PRIOR TO INDIVIDUAL SITES ……………………………..
11.2.1 Telemetry Log Form ………………………………………………………….
11.3 STARTING AND MAINTAINING A TELEMETRY SESSION ………………….
11-1
11-1
11-1
11-2
11-4
11-5
11-6
Chapter 12 C-PIES: Aanderaa Acoustic Doppler Current Sensor Option ………………… 12-1
12.1 GENERAL DESCRIPTION ……………………………………………………….. 12-1
12.2 DOPPLER CURRENT SENSOR SPECIFICATIONS ……………………………. 12-2
12.3 DCS SETUP MENU ……………………………………………………………….. 12-3
12.4 THE DCS CONFIGURATION FILE ……………………………………………… 12-4
12.4.1 Set_Property_Averagebase( ) …………………………………………… 12-4
12.4.2 Set_Property_Current_Type( ) ………………………………………….. 12-4
12.4.3 Set_Property_Compensation_Compass( ) ………………………………. 12-4
12.4.4 Set_Property_Compensation_Tilt( ) ……………………………………. 12-4
12.4.5 Set_Property_Compensation_Upstream( ) ……………………………… 12-4
12.4.6 Set_Property_Output_Comprehensive …………………………………. 12-5
12.4.7 Set_Property_Output_Format( ) ………………………………………… 12-5
12.4.8 Set_Property_Output_Polled( ) ………………………………………… 12-5
11.4.9 Set_Property_Pingrate( ) ……………………………………………….. 12-5
12.5 DCS TESTING WITH THE IES …………………………………………………. 12-6
12.6 DCS DATA RECORD …………………………………………………………… 12-6
12.7 DCS ERROR RECORD ………………………………………………………….. 12-6
12.8 C-PIES ENERGY BUDGET – BATTERY REQUIREMENTS …………………… 12-7
12.9 C-PIES MOORING ASSEMBLY ………...……………………………………… 12-7
12.10 DEPLOYING THE C-PIES ……………………………………………………… 12-7
12.11 POST-DEPLOYMENT CONFIRMATION OF DCS OPERATION …………… 12-7
12.13 C-PIES RECOVERY OPERATIONS ………...…………………………………. 12-8
3
Appendix A
A.1 Nautilus-style Glass Sealing Precautions
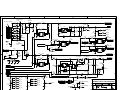
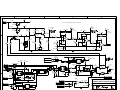
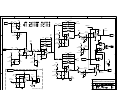
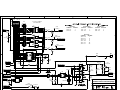
A.2 IES Schematics
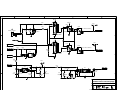
A.2.1 IES-Power Conditioner
A.2.2 IES-Preamp & Output Driver
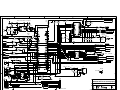
A.2.3 IES-Echo Detector
A.2.4 IES-PIC Decoder & Release Relay
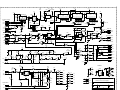
A.2.5 IES-Ref. Oscillator & Dividers
A.2.6 IES-CF1 Interface
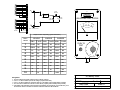
A.3 IES Accessories Schematics
A.3.1 Echo Simulator
A.3.2 Signal Insertion Cable
A.3.3 Release Simulator
Appendix B
B.1 Paroscientific Pressure Sensor Specifications
Appendix C
C.1 Bliley Frequency Reference Crystal Specifications
Appendix D
D.1 Release Block Part Numbers
D.2 Release Block Assembly Instructions
Appendix E
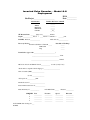
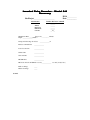
E.1 IES Deployment Form
E.2 IES Recovery Form
Appendix F
F.1 Refurbishing Kits
F.2 Replacement Parts
4
CHAPTER 1 OVERVIEW
Chapter 1
1- 1
IES Model 6.2 OVERVIEW
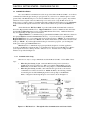
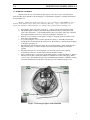
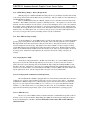
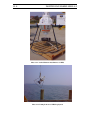
The Inverted Echo Sounder (IES) is an ocean bottom-moored instrument that measures the vertical
acoustic travel time (VATT) round-trip from the sea floor to the sea surface and back. The URI-GSO Model 6.2
is a combined IES, data-logger, and acoustic release, with optional measurements of bottom pressure,
temperature and current speed and direction (with attached Aanderaa Doppler current sensor). Data are
processed in situ and are available (optional) remotely by an acoustic telemetry link or expendable, satellite-link
data shuttle.
The VATT varies principally due to changes in the integrated temperature profile of the water column.
Applications in several large and meso scale ocean currents and frontal zones have demonstrated that VATT can
often be re-interpreted as geopotential height (dynamic height), which varies due to current meandering and
eddies. Thus, the IES is well-suited to monitor changes in temperature structure and dynamic height. In many
regions the vertical profiles of temperature and geopotential height, which vary with time, may be determined
from VATT measurements. Data from laterally separated IESs can then estimate horizontal gradients in
geopotential height, from which geostrophic ocean current profiles may be calculated.
In addition to the largely baroclinic IES-measured VATT, barotropic near-bottom pressure variations
may be measured with an optional pressure sensor. The Paroscientific Digiquartz sensor is used to achieve the
desired accuracy and long-term stability, and for consistency with this purpose, a super-stable temperaturecalibrated time base is added. The Digiquartz sensor also measures the near-bottom temperature; this is used to
correct for the slight temperature sensitivity of both the pressure sensor and the IES time base.
Our engineering/research group has been directly involved in more than 25 years of development and
field experience with IESs at Yale and Columbia Universities, Woods Hole Oceanographic Institution (WHOI),
and the University of Rhode Island (URI). The new Model 6.2 IES retains a measurement system, based on a
beamed acoustic transducer and our echo-detector with a proven track-record. The controller/data-logger
(Persistor CF1 computer module) incorporates the simplicity and reliability of microprocessor control and
solid-state ("flash-memory") data storage, plus improved time-base, data-processing and telemetering
capabitities… features not available on earlier versions.
1.1 INSTRUMENT FEATURES
• Entirely self-contained in a single, non-corroding, glass sphere: acoustic & timed release,
flotation buoyancy and optional recovery aids (radio or GPS beacon, xenon flasher and
flag)
• 32-bit microcontroller combines high-performance data manipulation (tidal signal
filtering of VATT and pressure data) with low-power operation modes
• data stored on removable (type ATA compact flash) memory cards (16 - 512Mbyte
capacity)
• data stored as engineering units in MS-DOS file formats
• many self-test features
• through-the-glass communications – high speed data download without opening housing
• acoustic command subsystem, including acoustic telemetry option
• acoustic command and data logging circuitry and batteries are independent
• 17-inch (43 cm) diameter glass sphere instrument housing provides buoyancy for 120 to
240 Amp-hr Lithium battery. Typical deployment durations of 2 – 5 years, depending on
measurement schedule, water depth (output power), sensors installed, and battery
capacity.
• pressure/temperature measurement as well as current speed/direction options
• long-term stability and barotropic pressure resolution better than 10µPa = 0.1 mbar
(equivalent to 0.001 m water)
Web-page: http://calvin.gso.uri.edu/
(includes photos, project descriptions, and link to IES bibliography)
1- 2
INVERTED ECHO SOUNDER MODEL 6.2
1.2 OPTIONAL MODIFICATIONS
At this printing (1/1/2005), the available options are:
• Pressure sensor, for measurement of absolute bottom pressure
• Aanderaa model 3820R acoustic Doppler current sensor – single point, up to 50
meters above the moored IES
1.3 STANDARD ACCESSORIES
The following accessories (with URI-GSO part numbers) are standard and are provided with each
instrument or group of instruments:
• Recovery flag
P/N 13-07
• Polypropylene recovery line P/N 11-08
• Spare release block
P/N 12-05
• Spare mechanical parts kit,
P/N 10-05 (see Appendix F)
nylon hardware: 3/8”-16 x 1.25” bolts with washers and nuts (2)
nylon hardware: 3/8”-16 x 2.00” release block mount bolt (1)
anchor line: 5/16” Dacron (2)
plastic cable ties (6)
• Internal communications cable (6ft)
P/N 54-11 (2 each for each group shipment)
• External communications cable (6 ft) P/N 51-05 (2 each for each group shipment)
• IES User Software Disk
P/N 59-01
• IES Model 6.2 User Manual
P/N 58-01
• Glass sphere sealing materials kit
P/N 11-12 (see Appendix F)
• Calibration documents for pressure and temperature sensor
P/N 58-02
• Calibration document for IES time base
P/N 58-03
1.4 REFURBISHING KITS AND SPARE PARTS
Some IES parts are used up during routine deployments (battery, sealing tape, release block anode,
anchor and line), while others need to be replaced when they show deterioration, e.g., release block cathode,
rubber cables, o-rings, plastic parts. Appendix F, at the end of this manual, lists maintenance kits, special
assemblies and spare parts available from URI-GSO. Equivalent second source part numbers are stated
where applicable. Contact URI-GSO for pricing and delivery schedule.
CHAPTER 1 OVERVIEW
1- 3
1.5 IES Model 6.2 SPECIFICATIONS
General _______________________________________________________________________
measured parameters
acoustic travel time; bottom pressure & temperature (optional)
data storage
type ATA compact flash card
data capacity
32 Mbytes standard (opt. 32-192 Mbytes) – removable memory card
data playback
memory card adapts to type ATA card reader – or RS-232 download
data format
MS-DOS file formats – data in physical units
communications
RS-232, fixed at 9600 baud, 8 bits, 1 stop, no parity
measurement rate
menu-selectable burst-sampling at 10 minutes to 1 hour interval
battery capacity/life
120 Amp-hrs standard; optional 180 and 240 Amp-hrs
Lithium battery pack (2–5 year deployment – depends on measurement
schedule, options added and water depth)
Acoustic Travel Time_______________________________________________________________
pings/measurement
24 pings/hour, in programmable bursts of 4, 8, 12, or 24 pings each
ping interval
alternating 16 & 18 seconds to avoid aliasing by surface waves
ping duration
6 millisecond
ping frequency
12.0 kHz (for reception on standard shipboard depth recorders)
operating depth
500 to 6700 meters
acoustic transducer
custom transducer with conical radiation beam
bandwidth (-3dB)
150Hz centered at 12kHz
acoustic output power (standard) adjusted under firmware control for depth: 170 – 197 dB re 1uPa
echo detection
multi-stage, hard-limiting receiver followed by broad & narrow band
filters (150 Hz bandwidth)
echo time resolution
0.01 millisecond each ping
measurement “noise”
(std deviation of 24-ping median) typically < 0.5 ms in 4500-m
deployment @ 25-kt wind; < 1.5ms in rain
acoustic telemetry
pulse delay telemetry (PDT) of average travel time after each
measurement burst
Pressure (optional)____________________________________________________________________
sensor
Paroscientific Digiquartz model 410K (optionally 46K, 42K)
FS range (standard)
10000psi (6000dbar)
FS range (options)
6000psi (4000dbar) or 2000psi (1300dbar)
freq-counter time-base
added to PIES with compatible accuracy, low-drift, and temperature
calibration
resolution
0.001 dbar (1mm H2O) for 4000 dbar sensor (1 part in 64x106)
absolute accuracy
+/- 0.01% FS
drift
4 ppm/month
temperature compensation
coefficients provided with each sensor
Temperature (optional)_________________________________________________________________
sensor
Paroscientific Digiquartz, temperature included in Pressure option
FS range
0 – 125°C
resolution
0.1 millidegree (1 part in 12x106)
Current Speed & Direction (optional)_____________________________________________________
see Manual Section 12.2
1- 4
INVERTED ECHO SOUNDER MODEL 6.2
1.5 IES Model 6.2 SPECIFICATIONS (cont’d)
Power System_________________________________________________________________________
system battery
Lithium DD cells, up to 8 parallel stacks of 2 cells; 240 Amp-hours
@ 7.4Vdc (17-inch sphere)
release battery
Lithium DD cells, up to 2 stacks of 4 cells; 60 Ampere-hours @
14.4Vdc (17-inch sphere)
operating capacity
2 – 5 years in 17” sphere – depends on measurement schedule, options
added, water depth and telemetry options used.
safety
parallel diodes on cells ensure series battery stack integrity,
series diodes on each stack isolate stacks from each other
Intelligence___________________________________________________________________________
processor
Persistor™ CF1 with Motorola™ MC68CK338 microprocessor
crash protection
Independent system and release functions; “deadman” watchdog
timer; low battery detection stops all except release functions
Mechanical___________________________________________________________________________
weight in air
36kgs (80 lbs) with full (180 Amp-hr) lithium battery pack
34kgs (76 lbs) with 120 Amp-hr lithium battery pack
buoyancy
16kgs (36 lbs) with 180 Amp-hr lithium battery pack
18kgs (40 lbs) with 120 Amp-hr lithium battery pack
shipping container
HAZMAT sealed polyethelene barrel
total shipping weight
57Kgs (125 lbs)
1.6 TRAVEL TIME MEASUREMENTS
Two primary measurements are taken by the IES: inverted-echo-sounding travel time, and
(optionally) absolute bottom pressure. The travel time is the time it takes an acoustic pulse (12.0kHz @ 6
milliseconds) to travel from the IES on the seafloor to the sea surface and return, i.e., the time it takes to
detect the surface echo
The IES processes 24 individual echo measurements to produce a single travel time. In a typical
deep sea experiment, the ocean acoustic travel time sensitivity to changes in actual water surface height is
about +1.3 milliseconds/meter (ms/m) with thermocline depth variations changing the travel time by
approximately 0.05 ms/m.
To eliminate early echoes from reverberation and false targets, the IES echo detector is disabled
immediately after the acoustic transmission for a period of time called the lockout time. The detector is
enabled again just before the anticipated surface echo. To minimize false echoes from fish and other weak
targets, the IES acoustic output power level is adjusted for depth under firmware control so that the sea
surface is the most viable target. The optimal lockout time and output power level are suggested by the IES
firmware after the user estimates the deployment depth (see Chapter 2.3.3)… the user can override these
suggestions.
CHAPTER 1 OVERVIEW
1- 5
1.7 PRESSURE AND TEMPERATURE MEASUREMENTS
An IES equipped with the pressure measurement option (PIES) uses a quartz pressure sensor made
by Paroscientific, Inc. for high accuracy and resolution. Paroscientific’s stated accuracy of 0.01% for this
line of sensor is well established. Typical resolution of Paros sensors is better than 1 part per million, and
under stabilized conditions, resolution can approach 1 part per billion. In the typical PIES application,
where the temperature and pressure are changing slowly and are relatively stable, the estimated sensor
resolution is 1 part in 10 million. In the PIES, the pressure channel electronics measure with a resolution of
about 1:64,000,000; that’s about 0.00016 psi or about 0.16 mm H20 for a 10,000 psi sensor. This ensures
that the PIES pressure measurement resolution is limited by the capabilities of the sensor and not by the
PIES electronic circuits.
See additional technical and application notes at www.paroscientific.com
Warning: The resolution of the pressure measurement is proportional to the full-scale range of
the sensor. Over-pressuring the sensor by 20% of full scale will result in permanent damage; use caution
when choosing sensor ranges less than 10,000 psi.
1.7.1
PIES Measurement Technique
The Paroscientific Digiquartz pressure sensor output is a frequency modulated (fm), squarewave signal, i.e., the output frequency is a function of applied pressure. The PIES pressure channel
measures this frequency by first dividing the signal frequency by 219 and then measuring the time between
two successive rising edges of the signal; this period is typically about 16 seconds. Any pressure change
(noise) during this 16 second period is integrated into the result. The period measurement is made by
counting a temperature calibrated 4.0MHz reference oscillator during the time between the rising edges of
the pressure sensor signal. A similar technique is used to simultaneously measure the temperature signal
from the Digiquartz sensor. The two period measurements (pressure and temperature) are then used,
along with the specific sensor calibration coefficients provide by Paroscientific, to calculate the pressure in
physical units.
The PIES 4.0MHz frequency reference circuit, used (as outlined above) in the PIES pressure and
temperature measurements, employs an ultra stable crystal manufactured by Bliley Electric, Inc. The aging
(drift) of this device is 1x10⁻⁹/day after 30 days operation. The specified accuracy of the reference
oscillator is +/-5ppm (re 4.0MHz) but is corrected for temperature (by the PIES) using the uncorrected
temperature measurement from the Paros temperature sensor. In other words, the approximate temperature
from the Paros sensor is first used to correct the reference oscillator output and then the corrected reference
is used to determine the temperature and pressure measurements. After these corrections for temperature,
the accuracy of the PIES pressure measurement remains within the 0.01% FS sensor specification stated by
Paroscientific, Inc.
URI-GSO has empirically determined that an order of magnitude reduction in the long term drift
characteristic of the Paroscientific DigiQuartz pressure sensor can be realized if the sensor is pre-stressed,
i.e., hold the sensor at the anticipated deployment pressure (+/- 1000dbar) for some period prior to the
actual IES deployment. This is particularly true for new sensors. Pre-stressing for two months is
recommended. Be careful not to exceed the full scale range of the sensor.
1- 6
INVERTED ECHO SOUNDER MODEL 6.2
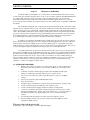
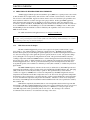
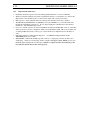
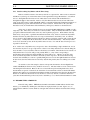
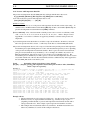
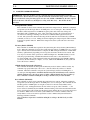
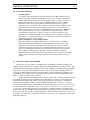
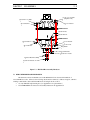
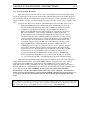
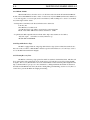
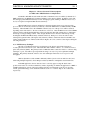
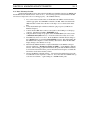
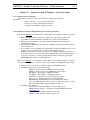
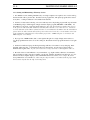
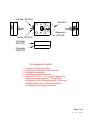
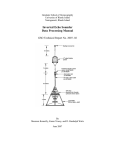
1.8 IES PARTS LOCATION DIAGRAM
Take a few moments to look over the following diagram. The parts pointed out in the diagram are
discussed in succeeding chapters of this manual.
Transducer Guard
Recovery Line
Acoustic Transducer
Ballast Weights
Upper Hard Hat
Acoustic Output Cable
Glass Sphere
Release Battery
System Battery
CF1 Electronics
Rubber Mounts
Reloc Control Board
Reloc Module
Xenon Flasher
Internal Cable
Radio & Antenna
Lower Hard Hat
Pressure Sensor
Pressure Port
Vacuum Port
External Cable
On/Off (red)
RS232(yellow)
{ Anode
{ Cathode
Release Block
Connections
Flag Holder
Release Block
Release Block Guard
Anchor Line
Figure 1-1 IES Model 6.2 Parts Location Diagram
CHAPTER 2 GETTING STARTED - CONFIGURING THE IES
Chapter 2
2- 1
GETTING STARTED - CONFIGURING THE Model 6.2 IES
This chapter provides instructions on how to:
• use the internal and external switches and connectors
• understand the acoustic diagnostic signals
• establish communications with the IES
• use the menus to set up and start an IES mission
Note: As you read the following sections, keep in mind the parts location drawing (Figure 1-1) of
Chapter 1.7. This diagram shows the location of many of the IES elements referred to in the text.
The Model 6.2 IES is usually shipped sealed, with its battery installed, ready to be turned ON,
configured and deployed. Follow these steps after unpacking the IES:
1.
2.
3.
4.
5.
6.
7.
8.
Find the red ON/OFF plug that is taped or strapped to the IES housing.
Pull the IES external ON/OFF jack out of the lower hard hat and attach the red ON/OFF plug.
You should hear a single “ping”, followed about 15 seconds later by a double “ping”. This
indicates that the IES computer has booted properly into data acquisition mode.
Remove the yellow RS-232 plug from the IES connector and attach the external communications
cable between the IES RS-232 connector and the serial port of your computer.
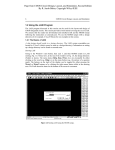
Start the IES Hyperterminal communications program (See Chapter 2.2) on your PC and set up the
serial port for baud 9600, 8bits, 1 stop, no parity and no hardware or software handshaking.
Remove the red ON/OFF plug from the IES and then plug it back in. The IES should RESET
again (see Chapter 2.2.3) and the IES banner should appear on your computer screen. If trash
characters appear, the computer serial port baud rate probably needs to be changed. The IES is
shipped with a baud rate of 9600.
After the IES banner appears, you have 5 seconds to press the <space> key on your computer to go
to the IES Main Menu.
Once you are at the IES Main Menu you can proceed to the following sections to set up your IES
mission.
2- 2
INVERTED ECHO SOUNDER MODEL 6.2
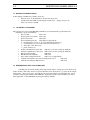
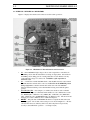
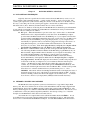
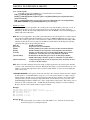
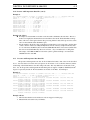
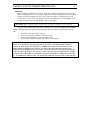
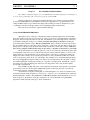
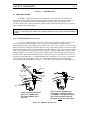
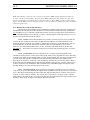
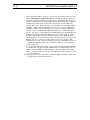
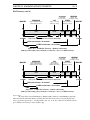
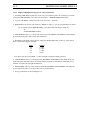
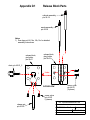
2.1 INTERNAL SWITCHES & CONNECTORS
Figure 2-1 displays the switches and connectors used in routine operations:
Figure 2-1 IES Model 6.2 Internal Switches and Connectors
•
•
•
•
S1 - turns ON/OFF the high voltage to the acoustic output driver. It should be in
the XMIT position when the instrument is sealed up for deployment. It should be in
the STBY position during periods of testing when there is a risk that the user may
contact the high voltages on connector J1. DANGER: at full output there is
2500Volts at J1!
S2 - overrides the external ON/OFF switch so that the IES electronics can be turned
ON/OFF when the external cable is removed. It should be in the REMOTE position
during deployment so that the external cable switch can control the ON/OFF
function and in the LOCAL position when the IES is being tested with the sphere
opened.
JP1, JP2, JP3, JP4 - these jumpers (or switches) encode the acoustic command
system. The four types of commands and the number of code combinations for each
are: TELEM (JP4 - 4 different codes), XPND (JP3 - 4 different codes), BEACON
(JP2 - 4 different codes) and RELEASE (JP1 - 64 different codes). The selection and
changing of acoustic command codes is outlined in Chapter 5.
RESET - This push button will RESET the Persistor computer module and restart
the IES program. A flow chart of the restart process is shown in Figure 2-3. All data
collected since the start of that day will be lost unless they have been previously
saved by a data buffer flush operation - see Chapter 2.5(F).
CHAPTER 2 GETTING STARTED - CONFIGURING THE IES
2- 3
2.2 COMMUNICATIONS
Two custom RS-232 communications cables are provided with each Model 6.2 IES: one for direct
communications when the glass housing is open (part # 54-11), and one for use when the sphere is sealed
(part # 51-06). The IES RS-232 protocol is fixed at 9600 baud, 8 data, 1 stop bit, no parity. Any terminal
emulation software capable of the above RS-232 protocol can be used to set up the IES; however, it is
handy to have a “capture” feature to document testing and a reliable data file transfer protocol (YMODEM)
to upload data files through the external cable. These software utilities are provided on the IES User’s
Disk.
An CD disk labeled “IES User’s Disk” is provided with each Model 6.2 IES and contains two
directories: Hyperterminal and MotoCross. Hyperterminal.exe is used to communicate and offload data
from the IES and MotoCross.exe is used to load new IES firmware if necessary. Additional directories
may exist depending on what options were installed.
Hyperterminal™ is a communications program bundled with MicroSoft™ Windows software in
the c:\programfiles\accessories\communications directory… if you do not have it, copy the IES disk
Hyperterminal directory to your computer and create a desktop shortcut to “IES.ht”. If you already have a
Hyperterminal directory, install only “IES.ht” and “ies.ico” in that directory, then create a shortcut on the
desktop to “IES.ht”. If you then right click the desktop icon and select properties, you can change the
desktop icon to the special URI-GSO IES icon.
MotoCross™ is a communications program specifically designed to load new application
programs to the IES CF1 computer module. Copy the MotoCross directory from the IES User’s Disk to
your computer and create a desktop shortcut to “MotoCross.exe”. Instructions for loading new IES
firmware are provided in Chapter 9.5
2.2.1
steps:
Communications Setup
There are two ways to set up communications with the Model 6.2 IES… follow either of these
•
•
When the glass housing is open, connect the RS-232 cable (p/n 54-11) directly to
the IES circuit board at connector J3. With your computer running IES.ht, press the
RESET button on the IES board and follow the prompts to reach the IES Main Menu.
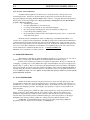
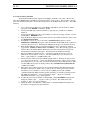
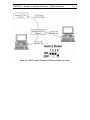
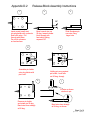
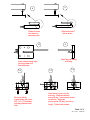
When the glass housing is sealed, connect RS-232 cable (p/n 51-06) to the external
communications connector shown below. RESET the IES by disconnecting, and then
reconnecting, the external ON/OFF plug and follow the prompts to the IES Main
Menu. A diagram of the through-the-glass control cable is shown in Figure 2-2.
Figure 2-2 IES Model 6.2 -- Through-the-Glass Communications and Control Cable
2- 4
INVERTED ECHO SOUNDER MODEL 6.2
2.2.2
RESET Sequence
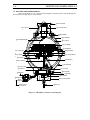
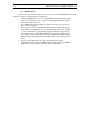
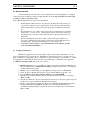
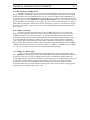
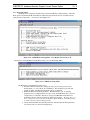
For those who want to know the details, a flow chart of the power ON or RESET function is shown
in Figure 2-3. The most important details are listed below.
• Pressing the RESET button or power cycling (OFF/ON) restarts the model 6.2 IES.
• Listen (or watch the PC screen for “*ping”) for a single ping that indicates the IES
has begun its initial start-up tests.
• If a communications cable is attached, the user has 5 seconds to press the <space>
key to enter the menu mode.
• If no <space> key is detected, the IES will check the battery voltages and currents,
verify that there is enough memory to store data until the auto-release date, and then
(5 - 30 seconds after the 1st ping) transmit two pings (and display “*ping” twice on
the computer screen) to indicate that the IES has entered the data acquisition mode.
If a computer is attached to the IES, the operating configuration parameters and the
IES clock setting will be displayed on the terminal where it can be captured for the
record.
• If a PC is not attached and the “two ping” signal is not heard, attach the
communications cable and a PC with Hyperterminal running and repeat the RESET.
Monitor the messages displayed on the PC to diagnose the problem.
CHAPTER 2 GETTING STARTED - CONFIGURING THE IES
Power ON or
RESET
initialize the CF1
configure I/O lines
get the last mission
configuration saved
enable the watchdog
clear the release relay
create an ies_***.log file
(if none exists) and
write a RESET record
1st 'O.K' *ping
exit to PicoDOS C:> prompt (no return)
keystroke
input?
loop for 5
seconds
Yes
disable
watchdog
No
MENUS
GO - display latest mission
configuration & engineering data
check voltages & currents
calculate mission memory requirement
check capacity of flash card
No
save configuration
and start mission?
Yes
check voltages & currents
all systems
GO?
No
report
error
Yes
display mission configuration
& engineering data
two 'O.K.' *pings
0.3 seconds apart
No
create a new set of data files: (if enabled)
T***_xx.dat
P***_xx.dat
E***_xx.dat
F***_xx.dat
any engineering
files exist?
Yes
write metadata records in
all three data files
calculate mission memory requirement
check capacity of flash card
all systems
GO?
No
report
error
Yes
SAVE mission configuraton
write an OPERATE record
create a new set of data files:(if enabled)
T***_xx.dat
P***_xx.dat
E***_xx.dat
F***_xx.dat
write metadata records in
all data files
clear the day buffers (RAM)
write an OPERATE record
enable & reset the watchdog (11 min)
clear the day buffers (RAM)
enable & reset the watchdog (11 min)
Data Acquisition Loop
Figure 2-3
IES RESET program flow
2- 5
2- 6
INVERTED ECHO SOUNDER MODEL 6.2
2.3 USER INTERFACE – MENU MODE
Previous sections describe how to access the IES menus by resetting or power cycling the
instrument. The menu mode is also accessible without performing the RESET routines, i.e., without
clearing the day buffers (RAM) and without creating any new data files. See the next section for a
description of the wake up cycle.
2.3.1
One Minute Warning
By referring to the clock used to set the IES internal clock, the user can determine exactly when
the instrument will perform its data acquisition tasks. If the user wishes to establish communications with
the IES without using the RESET function (power cycle OFF/ON or RESET push button) there is a two
second “window of opportunity” every ten minutes to do so. These windows of opportunity begin ten
seconds prior to the ten minute mark of the time reference mentioned above, e.g., at **:09:50, **:19:50,
**:29:50, etc., after the hour. To make it easy for the user to be ready for this small window, a one minute
warning is sent as a prompt at the nine-minute mark, e.g., **:09:00, **:19:00, **:29:00, etc. After the one
minute warning, the user can simply hold down the <space> key on the computer and the IES will enter the
Main Menu when it wakes up 50 seconds later. In other words, the one minute warning occurs 50 seconds
before the start of the “window of opportunity” for communications, and 1 minute before the next set of
data acquisition tasks.
CHAPTER 2 GETTING STARTED - CONFIGURING THE IES
2- 7
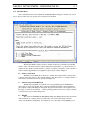
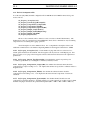
2.3.2 IES Main Menu
Once communications has been established, the IES Main Menu will appear, similar to the screen
below. The top banner lists any optional sensors that have been installed.
A ---- Self-Test Menu
The Self-Test Menu contains selections of functions that can test virtually all of the IES
circuits. Some of the menu selections require additional test instruments, e.g., the travel time test
requires an echo simulator and the reference oscillator test requires a frequency counter. Details of
each test and the supplementary test equipment required are provided in Chapter 3.
B ---- Memory Card Menu
The Memory Card Menu allows the user to examine and read the memory card data files
as well as prepare the card for a data acquisition mission and offload files to a computer. Details of
each memory card menu selection are provided in Chapter 2.5.
C ---- Mission Setup and START Menu
The Mission Setup Menu is essentially a list of programming options that MUST be
selected prior to deploying the IES. These selections determine the behavior of the instrument’s
data acquisition subsystem during the subsequent deployment. The menu is self-explanatory and
the ranges of selections are indicated… invalid operating parameters will not be accepted. Details
of each selection are provided in Chapter 2.4.
D ---- RESET
This selection will RESET the IES without saving any changes that may have been made
while in menu mode. Changes will be lost unless they were saved by the SAVE or the GO
selection in the Mission Setup Menu. See Chapter 2.2.2 for a description of the RESET process.
2- 8
INVERTED ECHO SOUNDER MODEL 6.2
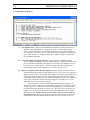
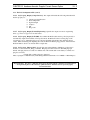
2.3.3 IES Mission Setup Menu
A ---- Set date/time clock displays the current IES date and time. To modify the time, enter a
date/time that is slightly ahead of your timepiece and press <enter> when the times
match… the new time will be saved and will remain accurate even when the IES is off.
To confirm the correct time, select “A” while monitoring your timepiece and compare the
times. After selecting “A”, simply pressing <enter> without entering a valid time will
leave the timing unchanged.
B ---- Select travel time measurement schedule displays the current schedule and other
options, including disabling the travel time measurements. To change the schedule, select
an option and the new schedule will be displayed. Note that a new schedule has not yet
been saved to non-volatile memory… this will not happen until data acquisition has
started and the entire mission configuration is saved (see selection S or G).
D ---- Enter water depth, lockout time and output power level displays the current value of
estimated water depth (in meters) and prompts the user for a new value. For no change in
depth value, press <enter>. Water depth is the primary consideration that determines the
lockout time and the output power level. After estimating the depth at the deployment
site, the IES will suggest the proper lockout time and output power level. To accept these
values, press <enter> after each current value is displayed. See Chapter 1.5 for some
further discussion of travel time measurements.
The water depth is solicited so that the IES instrument can advise the user of a
suitable lockout value. The user can override these suggestions by entering other values
as long as they do not violate the basic measurement principles, e.g., you cannot enter a
lockout time that would block the sea surface echo. The selection of lockout time and
output power level is critical to the mission success and is dependent upon the depth at
the deployment site. The IES will not operate usefully if deployed in water shallower
than estimated here. The lockout time and output power level will not be saved in nonvolatile memory until the SAVE or GO menu selection (S or G) is made (see below).
CHAPTER 2 GETTING STARTED - CONFIGURING THE IES
2- 9
E ---- Enter auto-release date and hour displays the current automatic release date and hour
and prompts the user for a change. This is the date and hour when the IES will release its
anchor and rise to the sea surface without user intervention. Data acquisition will stop
and the IES will initiate a 4-second acoustic beacon. The IES will not start the data
acquisition mission unless the auto-release date and hour are in the future AND there is
enough data storage available on the memory card to operate until the auto-release date.
Note: The auto-release is not the primary method of IES recovery. An acoustic release is
the routine method. The auto-release is a back-up in case the acoustic release system
should fail.
F ---- Enable/disable the acoustic data telemetry file Enables the daily processing of data for
transmission via the telemetry link. If the file is enabled, the IES will process the travel
time, pressure and any other sensor data at the end of each day. See Chapter 10 for a
description of the TELEM.DAT file and the various formats associated with each sensor
suite.
H ---- Enter a mission statement the user is prompted to enter a line of text as a mission
statement. To assist in data record keeping, a line of text (mission statement) is written to
the system log file when data acquisition starts. This might be a site location, a project
name, etc. End the statement (80 characters maximum) by pressing the <enter> key. The
mission statement does not get saved with the operating parameters so it is valid for the
subsequent data acquisition mission ONLY if the mission is started with the GO selection
(see below)… it will NOT be saved by the SAVE selection and will be lost if the IES is
turned OFF prior to new data files being created (see Chapter 4.2).
S ---- SAVE mission configuration will write all of the current operating parameters to nonvolatile memory. If the IES is turned OFF after a SAVE, any changes to the mission
configuration will be saved and a new set of data files will be created when the IES is
turned back ON. Note: It is o.k., but not recommended, that you start a mission this way.
There is no configuration review. You should carefully review all of the operating
parameters prior to starting a mission (see the GO selection below).
G ---- GO - review configuration and START data collection displays the entire mission
setup and prompts the user for approval to start the data acquisition mission. If, after
review, further modifications are required, the user can return to the mission setup menu
or continue to the final IES self test before starting the mission. In the final self-test the
IES will measure battery voltages and currents, make sure there is enough memory for the
entire mission, create a new set of data files on the memory card, write the appropriate
meta-data records and start the data acquisition process. At this point the user can
disconnect the communications cable from the IES or continue to monitor the
operations… the IES will display operating notes as it performs its data acquisition
functions. After this step the user can turn OFF the IES and ship it to the deployment
site… when the IES is turned back ON, the “saved” mission and the clock setting will be
preserved and the mission will start without any further communications. During this
final step before starting a mission it is a good idea to turn on the “capture” mode of
Hyperterminal™ and save a record of the setup as the IES starts its mission
2.3.3.1 Saving a New Mission Configuration
Modifications to the mission configuration (measurement schedules, timed release, sensor
coefficients, etc.) made while in any of the above menus will be saved only when the user selects SAVE or
GO from the Mission Setup Menu… so do not change values and then shut OFF or RESET the IES… your
new values will be lost! The mission statement text will be saved only by using the GO selection to start a
mission.
2- 10
2.3.4
INVERTED ECHO SOUNDER MODEL 6.2
Optional Sensor Setup Menus
There may be additional setup menus, depending on the optional sensors installed. For example,
the menu shown below will be available when the pressure sensor is installed. If no additional sensors are
installed, the ‘Optional Sensors’ list in the Mission Setup Menu will not be displayed. See Chapter 11 for a
description of the Doppler Current Setup Menu.
A ---- Select pressure & temperature measurement schedule displays the current schedule
and other options, including disabling the pressure and temperature measurements (if
there is no pressure sensor). To change the schedule, select an option and the new
schedule will be displayed. Note that the new schedule has not yet been saved to nonvolatile memory… this will not happen until data acquisition has started and the entire
mission configuration is saved (see selection S or G).
B ---- Enter pressure sensor conversion coefficients displays the serial number of the pressure
sensor and each of the sensor’s calibration coefficients. The user is prompted for
modifications. The serial number and temperature coefficients of the Bliley reference
frequency oscillator crystal are also displayed and modifications solicited. The pressure
sensor and oscillator are not “smart” devices, i.e, the user must load the serial numbers
and coefficients… the IES does not detect them. The proper values are set initially for
the sensor and crystal provided with the instrument and a copy of the coefficients is
shipped with the documentation packet for each IES. If the pressure sensor or reference
oscillator crystal is changed, a new set of coefficients must be loaded.
C---- Enable/disable the pressure sensor raw data file The signals (pressure and temperature)
output from the Paroscientific pressure sensor are frequency modulated square waves
whose frequency is a function of the applied pressure and ambient temperature. This
menu selection enables/disables the saving of the frequency measurements in case there
are any questions regarding the validity of the conversion (to engineering units) process
applied by the IES. The format of the raw data file is identical to the converted data file
except that the units are in milliHertz. The IES computer will attempt to remove any wild
points from the pressure and temperature converted data, but will include these wild
points in the raw data file.
CHAPTER 2 GETTING STARTED - CONFIGURING THE IES
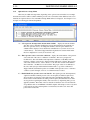
2.3.5
2- 11
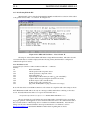
IES Memory Card Menu
From the IES Main Menu select “B” to enter the Memory Card Menu. Your display should look
similar to the following:
A ---- Display memory card directory and capacity displays the name, size and date of
creation of each file on the memory card as well as the number of free bytes available on
the card.
B ---- Read a file displays the directory (as above) and prompts the user for the name of a file to
be read. When the file name is entered, the file contents will be displayed. This is the
equivalent of the MS-DOS “TYPE” command.
C ---- Transfer data files to computer using Hyperterminal™ displays the directory (as
above) and prompts the user to enter the index of the data set to be transferred to a
computer directory. When a data set index is entered, the display will list the available
files and prompt the user to continue. If the user enters ‘Y”, the IES will respond by
displaying the filenames and message “sending filenames”. The user must then click the
right mouse button and select “receive file”. When the Hyperterminal™ file transfer
window opens, enter the destination directory and select “YMODEM” as the transfer
protocol. Click OK and monitor the status window for any transfer errors.
E ---- Erase ALL files - format the memory card erases ALL files on the memory card. There
is no recycle bin… when this operation is performed; all data will be irretrievably lost!
The user will be warned and asked to approve the operation. To approve the operation
the user must enter an uppercase “Y”.
F ---- Save RAM data to memory card - for testing only
transfers the data in volatile RAM
buffers to non-volatile memory card data files. During routine operations, this data
transfer takes place at the end of every day and when the IES senses that the RELEASE
relay has been activated. It is included here to allow the user to move data from RAM to
the memory card after IES testing in the laboratory. There are important details about this
process in Chapter 4.2.3.
2- 12
INVERTED ECHO SOUNDER MODEL 6.2
THIS PAGE INTENTIONALLY LEFT BLANK
CHAPTER 3 ADVANCED PLANNING & PREDEPLOYMENT CHECKS
Chapter 3
3- 1
ADVANCE PLANNING & PREDEPLOYMENT TESTING
This chapter will provide instructions on how to:
• determine the specific mission requirements
• test the IES before deployment
3.1 ADVANCED PLANNING
Advanced planning involves the IES user answering the following questions:
• how often do I need IES travel time measurements?
• do I need a pressure measurement at the site?… how often?
• how long do I want to deploy this IES?
• what is the water depth at the deployment site?
• any special precautions at the site (high currents, fishing activity, unusual
topography, etc.)?
• what date and time shall I set the auto-release ?
The implications of the various answers to these questions are addressed in this section.
Discussions on the choices of:
• travel time measurement schedule
• pressure measurement schedule
• battery pack capacity and loading
• output power
• lockout time
• special mooring requirements
• auto-release date and hour
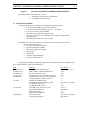
For the general planning of an IES deployment, the following time-chart shows what needs to be
done, when and where to find relevant information.
Time
4 months before
3 months before
2 months before
4 weeks before
2 weeks before
1-2 weeks
1 hour before
at deployment
Operation
order batteries & expendable parts
check condition of IES mechanical parts
pre-stress the pressure sensor
preliminary electronics tests with test battery
load new batteries & de-passivate battery pack
configure the mission, final test at 25°C
Vacuum seal the IES housing
2 day IES test with echo simulator @ 0°C
test ACS subsystem @ 0°C
test RELOC module @ 0°C
set the IES clock, clear memory card
fill out Deployment Form
attach anchor & flag
check the vacuum indicator
test for false release
record position and time
See Chapter
3.3, 6.1, 7.3, 7.4, 9.4
7&9
1.6.1
2&3
3
2
7
Test Accessories Guide
5
8.2.3
2.4, 2.5
Appendix E
8
7&8
Test Accessories Guide
Appendix E
3- 2
INVERTED ECHO SOUNDER MODEL 6.2
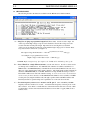
3.2 SELF-TEST MENU
The following describes the functions available from the IES Model 6.2 Self Test Menu:
A ---- Ping Test: 10 pings at programmed output level (4 sec. rate) tests the acoustic output. An
oscilloscope with a high voltage test probe can be attached to measure the voltage across the
acoustic transducer and the pulse length. Important: before selecting this test, attach the
oscilloscope probe with the ground lead on -OUT and the high voltage probe on +OUT. These
test points are near connector J1 (see Figure 2-1)
The output voltage should measure = 150 x 10(programmed level, dB – 172.4)/20 Volts, p-p
For example, for a programmed level of 188,
Output voltage = 150 x 10(188 – 172.4)/20 = 904Volts, p-p
DANGER: Highest output voltage (for output level= 197dB) will be 2500Volts peak-to-peak!
B ---- Travel Time Test: a single TT measurement tests the echo detector. In order to detect an echo
you must provide a simulated one. If a URI-GSO echo simulator is available, attach the box’s
INPUT cable to the TRIGGER (TP37) of the IES model 6.2 and the OUTPUT of the echo box to
either one of the signal insertion cable’s input connectors. The signal insertion cable itself must be
attached to TRANSDUCER (J1) of the IES. With this test setup, the IES should report a travel
time within 1 milliseconds of the echo simulator setting. See the Test Accessories Users Guide for
details on using the Echo Simulator. If the URI-GSO Echo Simulator is not available, a 12.0kHz
acoustic pulse (any length > 6 milliseconds) through a speaker aimed at the IES transducer and
time delayed with a stopwatch will provide a qualitative test of the echo detect circuits.
C ---- Precision frequency reference test – measure on CF1, pin 35 turns on the Bliley 4.0 MHz
frequency reference circuit for 15 seconds… measured with a frequency counter at pin 35 on the
CF1 connector. Note: There is a small white dot on the main circuit board next to CF1-35. With
no temperature correction, this measurement should not be more than +/- 4 ppm (16Hz) in error
from 0 to 25°C.
CHAPTER 3 ADVANCED PLANNING & PREDEPLOYMENT CHECKS
3.2
3- 3
SELF TEST MENU (cont’d)
D ---- Pressure Sensor Test: a single P&T measurement pair tests the pressure, temperature and
frequency reference (4MHz) circuits. This menu selection will appear only if the optional pressure
sensor is installed. If no pressure is applied to the IES pressure port, the measurement should
indicate approximate barometric pressure and ambient temperature if the IES is oriented with the
acoustic transducer facing UP. If a calibrated pressure is applied to the pressure port, the IES
should measure within 0.01%FS of the pressure applied. Warning: applied pressure must not
exceed the pressure rating of the sensor.
G ---- Output Power Test measures the power, in Watts, delivered to the acoustic output transformer.
This test charges the output capacitor (C57) to the programmed output level, reports the voltage at
the capacitor before and after a single ping, then calculates the power delivered to the output
circuit based on this voltage difference. To be accurate, this test should be done with the ITC
3431B transducer in water… especially at high output levels. A wide range of acceptable test
values are displayed that indicate the variability of the transducer when driven in air.
H ---- Check memory card sectors checks each sector of the memory card to determine the integrity
of the write/read process. Any defective sectors will be reported. Any errors here indicate the
memory card should be replaced.
J ---- View Engineering Data reports the current values of the battery voltages, system currents and
the internal temperature. Acceptable ranges are indicated.
K ---- Release Relay Test activates the release relay (and the radio/flasher RELOC module, if
attached) for 30 seconds. The release indicator (red LED on the circuit board – see Figure 2-1)
will light during the test period period. This test checks the relay driver circuits and can be used to
test the external release block cables, release block connectors and RELOC module operations (see
Chapter 8.2.3).
3- 4
INVERTED ECHO SOUNDER MODEL 6.2
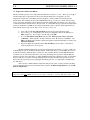
3.3 BATTERY LIFE
Note: As of this printing (January 2005) the only battery cells suitable for the IES Model 6.2
battery pack is the size “DD” lithium thionyl-chloride (LiSOCl2). Two recommended sources are:
Tadiran® Inc. (model no. T-5137-/T). Contact their web site www.tadiranbat.com for the address of
your local distributor.
ZenoEnergy Co., Ltd.® Inc. (model no. XL-205F/1S2P/T1). This is a proprietary cell configuration
that will require an approval-of-purchase from URI-GSO.
There are two batteries in the IES; a system battery to power the data acquisition functions, and the
release battery to power the acoustic command functions… we will refer to the mechanical package that
houses these two batteries as the ‘battery pack’.
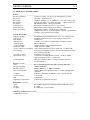
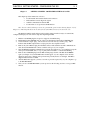
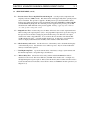
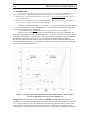
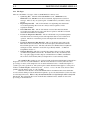
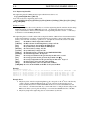
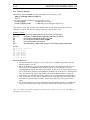
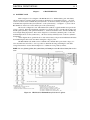
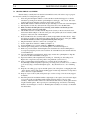
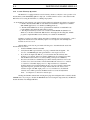
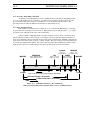
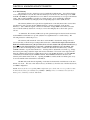
To determine the proper system battery capacity for a given mission, refer to Figure 3-1.
There are only two mission configuration selections that influence the battery requirement; the
depth of the deployment site and pressure measurement rate… both of these selections are made by the user
in the Mission Setup Menu (see Chapter 2.3.3). After the user has entered the depth estimate, the IES will
recommend the appropriate output power level… the power level must be known to use Figure 3-1.
Knowing the output power level and the pressure measurement rate the user can find the average system
battery drain and life-expectancy of two configurations of IES system batteries: 120 Amp-hr and 180 Amphr. Follow the example below the figure.
Figure 3-1 Total average current (mA) drawn from the battery pack for a chosen output
power level (dB) and pressure-temperature sampling rate.
Example: When the user enters a depth of 5500 m, the IES Mission Setup Menu (selection “D”)
recommends a power level of 194 dB. Having chosen this power level and a P-T sampling rate (selection
“C”) of one per hour, follow the vertical dashed line at 194 dB to the point where it intersects the "1/hr"
curve. Then follow the horizontal dashed line from this point to the current axis, showing an average
current drain of 3.2 mA. This horizontal line lies below the "4yr" mark on the "120 Amp-hr batt. duration"
CHAPTER 3 ADVANCED PLANNING & PREDEPLOYMENT CHECKS
3- 5
stave, indicating the 120 Amp-hour battery has sufficient energy for a 4-year deployment. The line is above
the "5yr" mark on this stave, indicating the 120 Amp-hour battery does not have sufficient energy for a 5year deployment. But the line lies below the "5yr" mark on the "180 Amp-hr batt. duration" stave, so the
higher capacity battery is capable of powering the instrument for 5 years with this mission configuration.
Always configure the release battery as a double stack (60 Amp-hrs). This will eliminate
problems due to passivation (see section 3.3.1) an will support the acoustic command functions (with a 20%
safety margin) for 5 years, regardless of mission configuration.
IMPORTANT BATTERY NOTES:
• The shelf-life of a lithium cell is ten years, however, a conservative 20% safety margin
should be added to the above system battery calculations to make up for any optimism
in the battery manufacturer’s specification, low temperature operations and for long
communications sessions, e.g., repeated setup sessions, final testing and data
offloading. Communications uses up about 0.045Amp-hr/hr.
•
If the system battery becomes exhausted during the experiment, it is not
catastrophic…the CF1 computer will sense that the battery is getting low and gracefully
shut down the data acquisition circuits. The release battery will then take care of
routine recovery operations… however, after the system battery shuts down, the autorelease timer is no longer active.
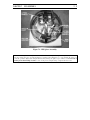
3.3.1 Replacing the Batteries
The number of cells required on a battery board is dependent on the mission energy requirements
as outlined in the previous section. However, after the system battery capacity is determined, the position
of the cells on the battery board is important in order to properly ballast the IES so that the acoustic
transducer is vertical during deployment. Cells should be loaded such that the battery board center of
gravity remains in the middle of the board… with a little examination of the diagram on the board and the
circuits outline in Chapter 6, you’ll see that this is possible for system battery (top of board) capacities of
90, 120, 150, 180 and 240 Ampere-hours. The release battery (bottom of board) can be configured for 30
or 60 Ampere hours (1 or 2 stacks) with both configurations’ center of gravity being in the center of the
board.
3.3.2 De-Passivating the Battery Pack
Lithium batteries are affected by a phenomenon known as passivation. Passivation is a film of
lithium chloride(LiCl) that forms on the surface of the lithium anode, and it serves to protect the lithium
from discharging on its own when the load is removed from the cell. The film of LiCl, which is essentially
a high resistance layer between the electrodes, is primarily responsible for the long shelf life (>10 years) of
lithium cells.
Passivation may cause voltage delay after a load is placed on the cell. When the cell is loaded, the
high resistance of the passivation layer causes the voltage to dip. The discharge reaction slowly removes
the passivation layer thereby lowering the internal resistance of the cell. This in turn causes the cell’s
voltage to reach a peak value which should remain steady if other discharge conditions do not change. If
the load increases after the cell’s voltage stabilizes, then it may dip again until the passivation layer is
sufficiently removed.
Battery cells that have been on the shelf for many weeks or exposed to high temperature may cause
the IES supply voltage to dip below the minimum requirement and cause the instrument to reset. Since it is
impossible to know how long new cells have sat without a load since their manufacture, it is wise to
deliberately load the cells prior to use until the passivation layer is removed. Once the cells have been
cleaned (de-passivated) the routine data acquisition operations of the IES will keep them clean.
URI-GSO provides a battery tester and de-passivator for this purpose. This instrument will
intermittently (push-button control) load each individual battery stack in an IES battery pack to its
maximum current capability. The user can monitor the voltage during the loading process to determine
when the passivation layer has been removed and the voltage no longer drops below minimum values.
3- 6
INVERTED ECHO SOUNDER MODEL 6.2
3.4 DATA ACQUISITION SCHEDULES
There are two data acquisition schedules that must be configured before starting an IES mission:
the travel time measurements and the pressure/temperature measurements (if the optional high pressure
sensor is installed). A third measurement schedule, the engineering data, is on a fixed schedule of once per
day as outlined below. These schedules may be independently chosen, and all are synchronized to the real
time clock as described below.
3.4.1
Travel Time Measurements
If the travel time (TT) measurements are enabled, there are always 24 TTs in an hour. The user
can program how these 24 measurements are spaced within the hour. The TT measurements are grouped in
bursts, such that one burst/hour programs 24 TT measurements in a single burst, two bursts/hour programs
12 TTs in two bursts… to six bursts/hour with 4TTs/burst. All of these bursts begin precisely at ten minute
increments of the real time clock (RTC)… for example, 1 burst/hr starts precisely on the hour, 2 bursts/hr
start on the hour and at 30 minutes after the hour, etc. Within the bursts, the individual TT measurements
are timed to alternate between a 16 and 18 second rate to prevent aliasing in the data.
3.4.2
Pressure & Temperature Measurements
The pressure and temperature measurement schedules (since they are made with the same sensor)
are identical and will be referred to as a single P&T measurement schedule. If the pressure sensor is
installed and the P&T schedule is enabled, the user can choose from one, two, four or six P&T
measurements per hour. Like the TT measurements, the P&T measurements are synchronized with the real
time clock (RTC) 10 minute marks but will occur after the TT measurement burst if scheduled at the same
10-minute mark, or precisely at the 10 minute mark, if not scheduled with the TT measurement. In other
words, the TT measurement has priority if the two measurements (TT and P&T) are scheduled for the same
time.
3.4.3 Pressure & Temperature Raw Data Measurements
If the P&T frequency data file collection is enabled (see Chapter 3.4.3 & 4.2.1), a separate file
will be created to store the raw frequency data from the pressure and temperature sensors. These data will
be collected on the same P&T schedule described above. Errors in P&T measurements may be caused by
the sensor itself or the conversion process. This feature is primarily a diagnostic tool to determine if the
P&T sensors can be eliminated as the source of error.
3.4.4 Engineering Data Measurements
Engineering data, as described in Chapter 4.3.2, are collected once per day, at the end of the
measurement day (at 23:50:00 hours or after any measurements scheduled for 23:50 hours). This schedule
is always enabled and cannot be modified by the user.
3.4.5 Memory Card Operations
To minimize power consumption, the Model 6.1 IES collects a day’s worth of data in RAM before
it writes to the non-volatile memory card, i.e., the memory card is activated once per day to transfer data
from RAM to the card. This write operation is synchronized to the real time clock (RTC) of the CF1
computer module to occur at the end of the data acquisition day (at 23:50 hours or after any scheduled
23:50 operations). At the beginning and end of a mission, there will most likely be partial days written to
the card. The data transfer operation will also occur when the IES detects an acoustic or auto-release
function.
CHAPTER 3 ADVANCED PLANNING & PREDEPLOYMENT CHECKS
3.5
3- 7
MEMORY CARD CAPACITY VS. DEPLOYMENT TIME & SAMPLING SCHEDULE
The standard IES Model 6.2 memory card capacity is 32Mbytes. If both travel time and
pressure/temperature measurement schedules are enabled, the requirement for memory space is 8500
bytes/day… so the standard card will support 5 year deployments. There are larger memory cards available
(up to 192Mbytes!) to support longer deployments or custom, high-capacity data collection schemes.
Consult URI-GSO for assistance in customizing schedules and memory capacity.
The memory card capacity influences the auto-release date and time selection (see Chapter 3.7). If
there is not enough memory capacity to allow the IES (as it is currently configured) to collect data until the
auto-release date, the IES will not allow the mission to start. To abandon the auto-release feature, you
cannot put the auto-release date so far in the future that the memory capacity requirement, as stated above,
is violated. At this time (2005/10/10) the standard memory card size is 32 Mbytes… this should allow the
user to program the auto-release date far enough in the future, without compromising the memory
requirement or the mission startup, to effectively disable the auto-release feature.
Table of Memory Requirements vs. Sampling Schedule
Includes requirements for pressure (P&T) and Doppler current sensor (DCS) options
Record type
Tau
P&T
DCS
Eng
Telem
Sys log*
Requirements, in bytes, for 30 days deployment
Sample rate
10 min.
20 min.
30 min.
125K
23K
439K
3K
1K
---
125K
17K
220K
3K
1K
---
125K
15K
110K
3K
1K
---
60 min.
125K
14K
55K
3K
1K
----
*will depend on errors during operations… no problems == no error messages == no data
Examples, using the table:
For: tau@10min, P&T@10min, DCS@10min = 591K/30 days ~= 7.1M/yr
For: tau@10min, P&T@10min, DCS@20min = 372K/30 days ~= 5M/yr
Standard instruments have a data capacity of 32Mbytes.
3- 8
INVERTED ECHO SOUNDER MODEL 6.2
3.6 Temperature and Pressure Offsets
The Paroscientific pressure sensor temperature measurement is accurate to +/- 2°C. This is good enough to
calculate temperature compensation for the pressure measurement, but not acceptable to provide
temperature compensation for the Bliley reference frequency oscillator which is used in the pressure
measurement. Paroscientific, Inc has assured URI-GSO that the poor accuracy is a fixed offset error that
can be corrected by measuring a known ambient temperature with the IES and entering a zero offset value
to make the measured value the same as the true value. To confirm that the proper pressure and temperature
offsets are installed in your PIES, let the sealed up instrument reside at a known, stable temperature for 6
hours and follow these steps with the IES acoustic transducer facing UP:
1.
2.
3.
4.
Select “D” from the IES Self Test Menu and note the reported temperature value.
Subtract the reported temperature from the known temperature and note the difference as
Tdif, in degrees C. Don’t forget to note the sign of the Tdif.
Go to the IES Mission Setup Menu and select “H - Enter pressure sensor conversion
coefficients”. When queried to modify coefficients, enter “N” until you reach Tzero. Add
Tdif to the Tzero value and then continue through the coefficient menu until you return to the
Mission Setup Menu.
Repeat the single measurement from the Self Test Menu, selection “D” to verify that an
accurate temperature is now reported.
The Paroscientific Digiquartz pressure sensor measurement is accurate to +/- .01% of full scale,
assuming that the sensor is mounted vertically with the oil-filled tube at the top. In the PIES, the sensor is
mounted horizontally, which introduces a small error. Paroscientific, Inc has assured URI-GSO that the
orientation error is a fixed offset that can be corrected by measuring a known pressure with the IES and
entering a pressure offset value (Pzero) to make the IES measured value equal the true value. To determine
the size of this error, locate the sealed up instrument in an area where the barometric pressure is known.
Follow the four steps in the previous paragraph, substituting ‘pressure’ for ‘temperature’ and ‘Pdif, Pzero’
for ‘Tdif, Tzero’.
After you have confirmed that the temperature and pressure offsets you have entered result in the
correct temperature and pressure measurement values, return to the Mission Setup Menu and ‘S – SAVE
mission configuration’…
Note: Since the temperature measurement is used to calculate the pressure, be sure to modify the
temperature offset first, THEN check the pressure offset. Remember: orient the IES with transducer UP.
CHAPTER 3 ADVANCED PLANNING & PREDEPLOYMENT CHECKS
3.7
3- 9
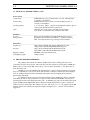
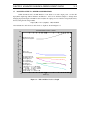
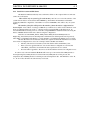
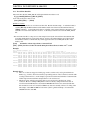
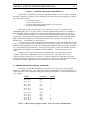
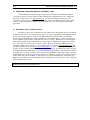
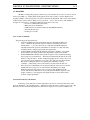
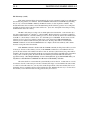
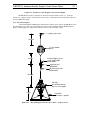
ACOUSTIC OUTPUT vs. DEPTH CONSIDERATIONS
Unlike the Model 6.1C, the IES Model 6.2 can adjust its acoustic output power over the full
deployment depth range without hardware modification… there are no hardware jumpers to change when
changing deployment depth. The IES model 6.2 adjusts the output power as a function of depth (entered by
the user) using the following formula:
Output (dB) = 170 + (depth(m) - 500) x 0.00491
The resultant echo and various acoustic levels vs. depth are shown in Figure 3-2.
IES ECHO DETECT LEVELS vs DEPTH
200
ECHOS & OTHER ACOUSTIC LEVELS (dB)
180
transmitted source level
using full sonar equation
160
140
120
100
80
60
40
20 2
10
surface echo
sl-rl-2a*d-20*log(2d)
echo-detect threshold
40 kt wind & rain noise
60+10*log(bw)-a*d
fish or scatt layer
sl+ts-a*(2d)-40*log(d)
10 kt wind noise
40+10*log(bw)-a*d
absorption loss a = 1.1 dB/1000m
source level
sl = 170 -to- 197 dB
@ depth d = 400 -to- 6000 m
surface refl loss rl = 6 dB
target strength ts = -20+20= 0 dB
3
10
DEPTH (m)
Figure 3-2
Echo and Noise Levels vs. Depth
4
10
3- 10
INVERTED ECHO SOUNDER MODEL 6.2
3.8 SETTING THE AUTO-RELEASE DATE & TIME
The auto-release feature will be activated only if there is no other method to return the IES to the
sea surface… either the acoustic command system has failed or the user could not return to (or locate!)
the instrument. This emergency back-up feature cannot be disabled directly… the user must enter
some future auto-release date and time, otherwise the IES will not start its data acquisition mission. It
is felt that, if the acoustic release system has failed or the user cannot return to recover the instrument,
the IES can use the last energy in the battery to return to the sea surface and, with luck, be found and
returned.
The selection of the auto-release date and time is often difficult because ship availability for such
an unplanned event is unpredictable. The best way to select the auto release date and time is to enter
the most probable date after the planned recovery that a ‘rescue’ ship may be available. When this
date is entered at IES Setup Menu - selection ‘E’, the IES will calculate (using the existing operating
schedule and output power level) the battery capacity required to reach that date. If it is impossible to
install the required battery capacity calculated by the IES, the auto-release date will have to be
modified or the auto-release function disabled as discussed below.
Setting the auto-release date and time further in the future than the installed battery will support
effectively disables the auto-release function. When the system battery is near depletion, the IES will
sense the impending failure and shut down the data acquisition functions, including the auto-release
timer. The release battery will support routine (acoustic command system) recovery operations.
WARNING: The selection of an auto-release date and time is also influenced by the memory card
capacity. Without sufficient data capacity to get to the auto-release date, the IES will not allow a
mission to start. See Chapter 4.4 for more details.
CHAPTER 3 ADVANCED PLANNING & PREDEPLOYMENT CHECKS
3- 11
3.9 DEPLOYMENT CHECKLIST
About an hour before deployment, attach the communications cable to the IES, turn ON the
Hyperterminal capture mode and confirm the proper setup and operations as follows:
A.
B.
C.
D.
E.
Turn ON IES and go to Self-Test Menu: (at Main Menu, record the IES version date)
1.
View engineering data: (enter ‘H’)
⇒Clock Battery > 3.0Vdc
⇒Release Battery Drain < 1.3mA
⇒System Battery Drain < 50mA
⇒Acoustic Driver : any value from 0 - 17 Vdc
⇒Release Battery > 14.3Vdc
⇒System Battery > 6.8 Vdc
⇒Internal temperature = ambient temp
2.
Travel time test (enter ‘B’) - use the 12.0kHz echo box and speaker to simulate echo
3.
Pressure & Temperature test (enter ‘D’) - confirm barometric press and room temp
4.
Output power test (enter ‘F’) - record power level before deployment
5.
Release Relay test (enter ‘J’) - with acoustic transducer pointing down, radio &
flasher ON for 30 seconds… flasher ON only when dark. With acoustic transducer
pointing up… radio and flasher OFF.
Go to Memory Card Menu
1.
erase all files (enter ‘D’)
Go to Mission Setup Menu
1.
set the clock (enter ‘A’)
2.
set the travel time measurement schedule (enter ‘B’)
3.
set the pressure & temperature measurement schedule (enter ‘C’)
4.
set depth and lockout and output power level (enter ‘D’)
5.
set auto-release time (enter ‘E’) (see Chapter 3.7)
6.
enable/disable the acoustic telemetry data file (enter ‘H’)
7.
enable/disable the pressure sensor raw data file (enter ‘J’)
8.
enter mission statement (enter ‘K’)
9.
review, save and start the mission (enter ‘G’)
Test ACS system (Fill out the IES deployment sheet, see Appendix E) Remember, any
properly framed command will trigger a 2 ping reply @ 1Hz.
1. XPND - interrogate @ 12.5kHz, reply @ 12.0Hz (tune deck box for 12.0kHz reception)
2. CLEAR - 2 ping reply then XPND function is disabled.
3. TELEM - extra pings at end of every burst. Refer to Manual section 10.7 for details.
4. RELEASE - 2 ping reply then 4 additional pings (all @ 2-sec rate) - then continuous 4
sec pings when the release block anode and cathode are momentarily shorted together.
Final Preparations before launch:
1. After the release test, simply RESET the IES by removing and re-installing the red
ON/OFF switch.
2. Listen for the double “ping” that signifies that the IES is ready to be launched, then
remove the communications cable and install the yellow communications plug.
3. Secure the locking rings on the red & yellow cable ends and push them inside the hard hat.
4. During the remaining time prior to launch, listen/confirm the proper timing of the travel
time measurements.
5. See Chapter 8 for IES launch instructions.
3- 12
3.9.1
•
•
•
•
•
•
•
INVERTED ECHO SOUNDER MODEL 6.2
Important Checklist Notes:
Remember that ACS responses are blocked during TT measurements - be aware of IES time!
Without a computer attached, an accurate stopwatch/chronometer is a very handy tool to monitor the
IES activities. Once the IES clock is set, the acoustic signals will occur at precise times.
IES responses to ACS commands will be at reduced power until the release relay is latched.
The IES will NOT START unless it is RESET, power cycled OFF/ON, or you exit the menu mode
through the Setup Menu (selection ‘G’). Do not simply unplug the communications cable while in
menu mode… the instrument will not start.
If you do a ‘SAVE’ (selection ‘S’ in the Setup Menu) and then turn the IES OFF, a new set of data files
will be created for your new configuration when your turn the IES back ON. This is an acceptable way
of starting an IES mission but you don’t get to review the mission configuration before the mission
starts.
Offloading data files is outlined in the Chapter 4.1 - You MUST use Hyperterminal and the
YMODEM transfer protocol here.
When RESET or turned ON, the IES responds as follows: a single ping, followed (15-30sec) by a
double ping… if there is no double ping, attach a computer with Hyperterminal, RESET (power cycle
OFF/ON) again and check the error messages. Without a computer attached, the double ping is the
best indication that the mission has started properly.
CHAPTER 4 DATA RECOVERY & ANALYSIS
Chapter 4
4- 1
DATA RECOVERY & ANALYSIS
4.1 DATA OFFLOAD TECHNIQUES
Typically, data from a specific mission will be retrieved from the IES memory card as a set of 4
files: 3 data files (with a matching file index… a T file, a P file, an E file)… and a system log file. The
system log file captures the system activities during the collection of all data file sets on the memory card.
It is easy to select that portion of the system log that applies to the data file set (T,P & E files) of interest.
The details follow. (Note: Telemetry and current meter files do not have a file index)
There are two methods of retrieving data from the IES Model 6.2; instrument open and instrument
closed, with the second method requiring the standard RS-232 communications cable provided with the
instrument. The two techniques are outlined:
• IES open - When the instrument is open, the easiest way to retrieve data is to shut the IES
OFF and remove the compact flash memory card, insert it into the PCMCIA port adapter
provided with each IES and install it into the PCMCIA port of your computer. The data files
are then available as MS-DOS formatted files that can be copied, edited, etc. On Microsoft™
Windows systems, the PCMCIA port is a plug-and-play device, so your computer should
automatically recognize the memory card when it is plugged in and assign a drive letter to it.
Using Windows Explorer, you can then examine and transfer the files to the hard disk
directories of your choice. Note: never uplug the memory card from your computer without
first disabling the PCMCIA port (see your Windows User’s Guide for instructions).
• IES closed - When the IES is sealed up, the data can be uploaded through the external RS232 cable using the IES User Interface Menus and the IES utility program IES.ht (from your
IES Users Disk). Hyperterminal™ must be installed on your computer for this utility to run.
It is usually bundled with Microsoft™ Windows software in the c:\programfiles\
accessories\communications directory. Install IES.ht and IES.ico in the same directory.
Start from the Memory Card Operations Menu and select Transfer data files to computer
using Hyperterminal. The IES will display the current memory card files and prompt the user
for the index of the files (see Chapter 4.2.2) to be transferred. Enter the index and press
<enter>… the IES will respond by displaying the available files and prompt the user to
continue. If you continue, the IES will set itself up in the YMODEM data send mode. The
user must then click the right mouse button and select Receive File. A window will open that
allows the user to select the destination directory and the transfer protocol… select
YMODEM. The transfer will start and the Hyperterminal™ window will display the status of
the transfer and report any errors. The baud rate for the transfer remains at 9600… however,
with error-checking overhead, the effective throughput is about 9220 bytes/sec… it will take
about 1 hour to offload a 1 year deployment (3.6Mbytes without current meter data).
4.2 MEMORY CARD FILE MANAGEMENT
The IES Model 6.2 data acquisition system stores information on a type ATA Compact Flash
memory card. This non-volatile device can be removed from the IES and, with the adapter supplied with
the IES shipment, inserted into any IBM compatible computer (PC) equipped with a PCMCIA port. The
memory card then appears as a disk drive and the IES data as MS-DOS formatted files. The data are stored
as ASCII text in a form (array matrix) ingestible by Matlab or other data-processing tools. A detailed
description of the IES Model 6.2 files and record formats follows.
An external drive for compact flash cards is available from MicroTech called ZiO!™. It costs
about $40 US and operates with computers running Windows with USB port support. This inexpensive
device is more convenient than the PCMCIA card adapter. See www.microtechint.com for more details.
4- 2
INVERTED ECHO SOUNDER MODEL 6.2
4.2.1 File Types
There are a maximum of six types of files on an IES Model 6.1 memory card:
• System Log File - This file will include RESET records, OPERATE records,
RELEASE record, ABORT record, mission statement, deployment notes and error
messages. There is only one system log file on an IES memory card and it is always
present.
• Engineering Data File - The “E” file includes one engineering meta-data header
record and engineering data records. It is always created, regardless of data
acquisition schedules.
• Travel Time Data File - The “T” file includes one travel time meta-data header
record and a travel time data record for each hour of operation. The file is created if
travel time measurements are scheduled.
• Pressure & Temperature Data File - The “P” file includes one pressure/temperature
meta-data header record and a pressure and temperature data record for each hour of
operation. The file is created if the pressure and temperature measurements are
scheduled.
• Pressure & Temperature Raw Data File – This “F” file has the same format as the
P&T data file above but the data are unconverted frequency measurements from the
Paroscientific pressure sensor. The data value units are both Hertz instead of µPascals
and degrees Celsius. This file is created if it is specifically enabled… see Mission
Setup Menu, selection ‘J’.
• Telemetry Data File – This file is created if the telemetry data processing is enabled
(see Mission Setup Menu selection ‘H’). If enabled, there is only one telemetry data
file. A properly equipped surface ship can command the moored IES to transmit this
file via the acoustic telemetry link (see Chapter 10 for acoustic telemetry details).
The system log file contains records of various lengths and formats with information intended as a
diagnostic tool in case of system malfunction. This file is not intended to be used by time-series data
processing tools but as a time-stamped record of routine and unusual events. A detailed description of
system log records is given below. The system log file contains information that applies to a time period
inclusive of all the data files on the memory card… no more… no less. In other words, the user cannot
partially erase the memory card… it’s all or nothing.
Each time a new data file is created the filename index is incremented and a meta-data header
record is written, which provides the information required to process the data in the file (see the meta-data
record descriptions below). There is only one meta-data header record per data file and it is always the
first record. The subsequent data records in the file have identical formats, suitable for time-series
processing, as described below.
CHAPTER 4 DATA RECOVERY & ANALYSIS
4- 3
4.2.2 Data File Creation and File Names
The Model 6.2 IES automatically creates and names all files on the compact flash card. The user
cannot choose file names.
There will be only one system log file on the memory card. It is a record of the activities of the
system since the file was created and is named IES###.log where ### is the instrument serial number
assigned by URI-GSO. Regardless of the number of restarts and RESETs, there will be only one system
log file.
The number of data files will depend on the number of times the mission configuration has
been modified. A new edition of each type of data file (as outlined above) will be created whenever a new
mission configuration has been saved, i.e., after the user has restarted the IES via the menu mode. To
restart the IES without creating a new set of data files, simply RESET the instrument without accessing the
menus or RESET while in menu mode, without saving the configuration.
Data files are named E###_XX.dat, T###_XX.dat, P###_XX.dat and F###_XX.dat, for
Engineering, Travel Times, Pressure & Temperature and raw Pressure & Temperature data respectively,
where ### is a 3-digit IES serial number (e.g., 076) and XX is a sequential index number from 1 to 32768.
The data file names will be indexed to indicate the sequence in which the instrument was restarted
after a mission configuration was saved. For example, if 076 is the IES serial number,
• The first (since the last card erasure) travel time data file will be named T076_1.dat.
• If the system is stopped and the user saves another mission configuration, a new data file
called T076_2.dat will be created when the data acquisition mode is re-started.
• New data will be appended to these most recent files until the next mission configuration save.
In other words, each new restart via the menu will create up to four new data files; E###_XX.dat to
hold engineering data, T###_XX.dat to hold travel time data, P###_XX.dat to hold pressure and
temperature data and F###_XX.dat to hold raw pressure and temperature data. The XX indices of the ‘E’,
‘T’, ‘P’ & ‘F’ files will all be the same after any save/restart.
4- 4
INVERTED ECHO SOUNDER MODEL 6.2
4.2.3 Data Recording, Day Buffers and the Time Stamp
Each record will be written to the memory card file on a separate line. The records are written in
ASCII text. System log records and meta-data records begin with record type ID characters, as described
below, to distinguish them from data records. Meta-data records will start with an ID character to
distinguish the type of data in the file. Data records (other than meta-data records) all start with a time
stamp (hours elapsed since 1970/1/1 00:00:00) which is compatible with the time manipulation functions of
ANSI standard C programs) and indicate the hour of data collection. All data file records (other than
metadata records) are measurement values delimited by a null (space) character as described below.
At the start of a mission, numerical arrays are created in the IES volatile memory (RAM) to hold a
single day’s data. These arrays are referred to as the day buffers. They are initially filled with zeros, which
get replaced with measurement values as the day’s data acquisition progresses. Each element of the day
buffer arrays corresponds to a particular measurement and time of day. Data are saved in the day buffers
until the end of the day when data records are composed and written to the memory card. As outlined
below, except for the beginning and end of the mission, memory card write operations will occur at the end
of every day… actually, after the 23:50 activities, the end of the measurement day. After the day buffers
are moved to the memory card, all the day buffer values are reset to zero and the data collection process is
repeated for the next day.
Note: Each row in a day buffer array corresponds to data collected during a single calendar hour, and, at
the end of the day, these rows get composed into a data record. If any data have been collected during the
hour, the entire row (record) will be written to the memory card. Hence, when the mission was started, it is
likely that the first row (record) will get only partially filled, i.e., array values corresponding to
measurement values in that hour, before the IES was started, will be zero. Likewise, at the end of the
mission, when the day buffers are written to the memory card in response to the release function being
detected, there will likely be some zeros partially filling the last record for time after the IES was released.
In other words, the first and last data records in any data file will probably have zeros filling some of their
fields.
As stated above, the time stamp in a data record represents the number of hours elapsed since
1970/1/1 00:00:00 (the first hour of day 1970/1/1 is hour zero). The data in that record are collected some
time during the hour indicated. Hence, in the case of travel time and pressure/temperature data, whose
measurements are spread over the hour, the actual time of a measurement could be as much as 50 minutes
after the time stamp in accord with the measurement schedule documented for the mission in the meta-data
header record. The meta-data header record, the first record in every data file, contains the information
(start time and measurements-per-hour rate) used to determine precisely when each measurement was taken.
4.3 RECORD TYPES & FORMATS
In the following outlines, ### indicates the IES serial number and XX indicates the file index.
Fields [ ], are delimited by ASCII spaces and all data are in physical units (seconds, degrees, etc.) as
indicated in the definition of terms. Each record begins with a line-feed character and ends with a carriage
return.
CHAPTER 4 DATA RECOVERY & ANALYSIS
4- 5
4.3.1 System Log File
In the IES system log file (IES###.log) you will find these record formats:
RES [yyyy/mm/dd] [hh:mm:ss] [reset type]
OPR [yyyy/mm/dd] [hh:mm:ss] [IES s/n] [Paros s/n] [TTint] [PTint] [lockout] [data file index]
[mission statement]
REL [yyyy/mm/dd] [hh:mm:ss] [reserved] [# of pressure adjustments] [# of clock adjustments]
MISSION ABORTED at [yyyy/mm/dd] [hh:mm:ss] [error message]
Definition of terms:
RES This RESET record is appended to the system log file every time the IES is powered up or reset. It
will indicate the time of reset. If a system log file does not exist at this time, it will be created as
IES###.log. Besides the time stamp which indicates the time the RESET occurred, the [reset type] is a
number that will be added later.
OPR This record is appended to the system log file when the user exits the menu mode to start the mission
data acquisition and/or when the instrument is powered up (or RESET) without the user going to the
menus. If a system log file does not exist at the time, it will be created. Besides the time stamp, which
indicates the time the record was composed, the OPR record will indicate all the important operating
parameters that apply to the upcoming data file set:
[IES s/n]
the IES serial number
[Paros s/n]
the pressure sensor serial number
[TTint]
the time (minutes) between the start of travel time measurement bursts
[PTint]
the time (minutes) between pressure and temperature measurements
[lockout]
the time (seconds) that echos are blocked from the IES detector after a
transmission - entered by the user via the Mission Setup Menu
[data file index]
the file index of the data files just created - use this integer number
with the time stamp to match a specific set of data files to a time frame.
[mission statement]
a single and separate line of text (80 characters max), entered by the user,
as a note to the data analyst
REL This record will contain the release time stamp. It will be appended to the system log file when the
acoustic or auto release function is detected. Besides the time stamp, a reserved field (always zero), the
number of pressure and temperature count corrections and the number of clock corrections during the
mission is recorded.
MISSION ABORTED Once per day, at the end of the day’s data collection activities, the CF1 computer
module checks to see if the IES battery voltage is too low or the system current is too high to support
further activities. In either case, if a problem is detected, this message is written to the system log file,
subsequent data collection activities are suspended and the system will enter a low power state. The
[error message] will indicate whether low voltage or high current is the problem. This activity does not
affect the acoustic command system… the IES will still be listening, waiting for acoustic commands.
However, the auto-release function will no longer be enabled.
Example:
OPR 1999/12/20 14:40:43 002 77523 10 10 1.20 0
Okinawa - Frontier Project: Alpha - Site B3 - depth 2350 m
RES 1999/12/20 18:42:40 0
RES 1999/12/21 10:26:05 0
REL 1999/12/27 09:00:13 0 0 5
RES 1999/12/27 09:01:22 0
Example Notes:
The system log file does not have to start with a RES record… the memory card may have
been erased just prior to starting the mission.
4- 6
INVERTED ECHO SOUNDER MODEL 6.2
4.3.2 Engineering Data File
The engineering data file (E###_XX.dat) begins with this meta-data record:
E [yyyy/mm/dd] [hh:mm:ss] [IES s/n]
and is followed by these engineering data records:
[hour] [ClkVbat] [Irel] [Isys] [RelVbat] [SysVbat] [IntPress] IntTemp] [TTav] [Pav] [Tav] [Pfrq]
[Tfrq] [ClkfrqDiff]
Definition of terms:
E The engineering meta-data record is the first record of the engineering data file. Besides the time stamp,
the IES instrument serial number [IES s/n] is reported. An engineering meta-data record will be
composed and written to memory card each time a new engineering data file is created… it will always
be the first record in the E###_XX.dat file.
The engineering data record will contain a time stamp and a number of IES self-test measurements made to
monitor the instrument’s operations. An engineering data record will be composed and written to the
memory card at the end of each day’s operations, i.e., just after the activities that started at 23:50:00.
[hour]
the number of hours elapsed since 1970/1/1
[ClkVbat] the IES real time clock backup battery voltage, in Volts
[Irel]
the release battery current drain, in milliAmperes
[Isys]
the system battery current drain, in milliAmperes
[RelVbat]
the release battery voltage, in Volts
[SysVbat] the system battery voltage, in Volts
[IntPress]
the internal pressure (vacuum), in psia (NOT INSTALLED)
[IntTemp] the internal temperature, in degrees C
[TTav]
the average travel time for the previous day, in units of 10-5 second
[Pav]
the average pressure for the previous day, in units of 10 µPa
[Tav]
the average temperature for the previous day, in units of 10-4 degree C
[Pfrq]
the last pressure sensor raw data value, in Hertz
[Tfrq]
the last temperature sensor raw data value, in Hertz
[ClkfrqDiff] the error, from 32768Hz, of the IES clock crystal, in Hertz
Example:
E 2001/11/21 12:48:26 039
279551 3.06 0.84 38.02 14.19
279575 3.07 0.86 38.04 14.18
279599 3.07 0.84 37.98 14.18
279623 3.08 0.74 38.01 14.16
279647 3.06 0.79 38.04 14.18
6.93
6.92
6.90
6.91
6.90
0.20
0.20
0.19
0.19
0.20
4.16
3.65
3.48
3.51
3.74
8.7113
8.7114
8.7114
8.7114
8.7114
10074
10285
10384
10439
10415
5222 33025.691 171162.844 -0.238
0 33025.504 171160.109 -0.271
0 33025.574 171160.469 -0.270
0 33025.637 171160.984 -0.270
0 33025.609 171161.109 -0.262
Example Notes:
The [hour] value on the first engineering data record corresponds to the 23rd hour of the first day
of data collection. It may or may not be the 23rd hour of the date in the meta-data record
because the IES may have been turned OFF after the mission was started but before any data
were collected… and then turned ON, days, even months later! Looking at the time stamps of the
RES records in the system log file should help to reconstruct the ON/OFF time line of the IES.
The [hour] stamp in the engineering data records increments by 24 hours.
CHAPTER 4 DATA RECOVERY & ANALYSIS
4- 7
4.3.3 Travel Time Data File
The travel time data file (T###_XX.dat) will begin with this meta-data record:
T [yyyy/mm/dd] [hh:mm:ss] [IES s/n] [TTint]
and is followed by these data records:
[hour] [TT1] [TT2]…… [TT24]
Definition of terms:
T The ‘T’ record is the first record of the travel time file. Besides the time stamp… in calendar format, it
contains [IES s/n], the IES instrument serial number and the travel time burst measurement interval,
[TTint], in minutes. A travel time meta-data record will be composed and written to the memory card
each time a new travel time data file is created… it will always be the first record in the T###_XX.dat
file.
The travel time data file is composed of a time stamp followed by the 24 travel time measurements that
were taken during that hour. Travel time data are saved in a day buffer until the end of the last daily
measurement activities, at which time they will be appended to the active T###_XX.dat file on the
memory card.
[hour]
the number of hours elapsed since 0 hours 1970/1/1
[TT1] - [TT24] the 24 travel times measured during the indicated hour, in units of 10-5 second
Example:
T 2001/11/21 12:48:26 039 10
279540 0 0 0 0 0 0 0 0 0 0 0 0 0 0
279541 871022 871010 871123 870998
871053 871032 871087 871035
279542 871053 871062 871047 871081
871078 871078 871065 871084
279543 871123 871111 871117 871114
871114 871114 871111 871126
279544 871117 871132 871129 871132
871111 871126 871126 871126
279545 871120 871132 871120 871114
871126 871108 871123 871108
279546 871126 871117 871120 871120
871126 871123 871126 871117
0 0 0 0 0 0 999999 999999 999999 871001
871016 871038 871022 871007 871007 871001
871084 871078 871056 871035 871050 871038
871050 871044 871090 871065 871056 871065
871087 871087 871084 871090 871105 871102
871117 871117 999999 871114 871117 871111
871123 871126 871102 871099 871111 871117
871117 871129 871114 871120 871111 871114
871132 871114 871132 871129 871126 871120
871129 871132 871126 871111 871126 871126
871142 871129 871129 871136 871123 871117
871136 871129 871145 871123 871132 871129
871142 871132 871129 871142 871126 871132
871108
871038
871078
871099
871114
871117
871114
871111
871129
871126
871129
871129
871007
871047
871059
871102
871117
871114
871114
871126
871114
871132
871132
871120
Example Notes:
The rows of data are wrapped to fit this page. In fact, each record (row) begins with an hour
number (e.g., 279541), has 24 travel times (representing an hour of data collection) and ends with
a carriage return. The zeros, in the example, represent travel time measurements not taken and the
999999 represent measurements attempted but no echo was detected.
The [hour] value on the first travel time data record corresponds to the first hour of data
collection. However, it may or may not be an hour of the day stamped in the meta-data ‘T’
record because the IES may have been turned OFF after the mission was started (and the data
files and meta-records were created) but before any data were actually collected. Looking at the
time stamps of the OPR and RES records in the system log file should help to reconstruct the
ON/OFF time line of the IES.
4- 8
INVERTED ECHO SOUNDER MODEL 6.2
4.3.4 Pressure and Temperature Data File
The pressure and temperature data file (P###_XX.dat) will begin with this meta-data record:
P [yyyy/mm/dd] [hh:mm:ss] [IES s/n] [Paros s/n] [PTint] [Paros coefficients]
and is followed by these pressure and temperature data records:
[hour] [P1] [T1] [P2] [T2]……… [P6] [T6]
Definition of terms:
P This record is the first record of the pressure and temperature data file and contains a time stamp… in
calendar format, the IES instrument serial number [IES s/n], the Paros serial number [Paros s/n], the
pressure and temperature measurement interval [PTint], in minutes.
[Paros coefficients] A list of the fourteen Paroscientific pressure sensor conversion coefficients, in this
order: U0, Y1, Y2, Y3, C1, C2, C3, D1, D2, T1, T2, T3, T4, T5 , Tzero, Pzero. Refer to Chapter 3.5 and
Appendix B to see how these coefficients are applied (by the IES) to calculate actual pressure and
temperature.
A pressure/temperature meta-data header record will be composed and written to the memory card each
time a new pressure data file is created… it will always be the first record in the P###_XX.dat file.
The pressure and temperature data record is composed of the time stamp and the pressure and temperature
measurement pairs acquired during that hour. Some of the measurement pairs may be zeros depending
on the pressure and temperature measurement schedule. There is space allocated for 6 measurement
pairs per hour (measurements every ten minutes), so if, for example, the schedule only calls for one
P&T measurement/hour, there will be 5 pairs of zeros in the record (see Example 2 below). The
measurement pairs are delimited by two nulls (spaces) as shown. Pressure/temperature data are saved in
a day buffer until the end of the last daily measurement activities at which time they will be appended to
the active P###_XX.dat file on the memory card.
[hour]
the number of hours elapsed since 0 hours 1970/1/1
[P1] [T1]… [P6] [T6] pressure and temperature measurement pairs in units of 10Pa (1/10millibar)
and 10-4 degree C respectively.
Example 1:
P 2001/11/21 12:48:26 039 87087 10 5.842375 -4036.615 -2110.00 0.00 -47948.39 3713.318
162670.80 0.037720 0.00 30.28409 2.333273 60.53492 71.7080 0.00 0.00 0.00
279540 0 0 0 0 0 0 0 0 0 0 10982 19447
279541 10863 19479 10732 19420 10519 19220 10244 18838 9990 18260 9755 17504
279542 9569 16586 9450 15557 9397 14463 9386 13365 9417 12294 9473 11272
279543 9532 10318 9593 9436 9659 8626 9717 7883 9763 7210 9810 6604
279544 9854 6048 9890 5546 9928 5093 9956 4677 9980 4305 10013 3958
279545 10029 3647 10048 3363 10063 3105 10076 2865 10094 2643 10104 2442
279546 10114 2259 10125 2089 10130 1930 10134 1787 10141 1652 10153 1526
279547 10164 1412 10167 1304 10178 1203 10180 1110 10179 1023 10181 944
279548 10189 867 10194 795 10198 727 10201 667 10209 607 10203 555
279549 10209 503 10209 452 10209 412 10214 367 10221 325 10217 288
279550 10225 251 10219 216 10228 185 10226 156 10227 129 10231 102
279551 10229 77 10236 52 10233 30 10232 11 10236 -11 10239 -27
279552 10243 -50 10237 -66 10242 -83 10243 -100 10241 -112 10246 -129
279553 10244 -141 10239 -151 10242 -166 10241 -176 10247 -188 10248 -201
279554 10243 -211 10241 -222 10240 -228 10248 -242 10252 -252 10254 -259
279555 10244 -265 10248 -275 10244 -279 10248 -288 10250 -296 10254 -300
279556 10247 -308 10252 -312 10253 -315 10260 -321 10257 -325 10259 -327
Example 1 Notes:
The meta-data header record is wrapped to fit this page… the data records are not wrapped.
Each data record (row) begins with an hour number (e.g., 279540), has up to 6 pairs
(depending on P&T schedule) of pressure and temperature measurements and ends with a
carriage return. The zeros, in the example, represent pressure measurements not taken.
This example shows measurements taken every ten minutes. If a P&T measurement were
taken every 30 minutes, it would look like example 2 that follows.
CHAPTER 4 DATA RECOVERY & ANALYSIS
4- 9
4.3.4 Pressure and Temperature Data File (cont’d)
Example 2:
P 2001/11/21 12:48:26 039 87087 10 5.842375 -4036.615 -2110.00 0.00 -47948.39 3713.318
162670.80 0.037720 0.00 30.28409 2.333273 60.53492 71.7080 0.00 0.00 0.00
279540 0 0 0 0 0 0 0 0 0 0 10982 19447
279541 10863 19479 0 0 0 0 10244 18838 0 0 0 0
279542 9569 16586 0 0 0 0 9386 13365 0 0 0 0
279543 9532 10318 0 0 0 0 9717 7883 0 0 0 0
279544 9854 6048 0 0 0 0 9956 4677 0 0 0 0
279545 10029 3647 0 0 0 0 10076 2865 0 0 0 0
279546 10114 2259 0 0 0 0 10134 1787 0 0 0 0
279547 10164 1412 0 0 0 0 10180 1110 0 0 0 0
279548 10189 867 0 0 0 0 10201 667 0 0 0 0
279549 10209 503 0 0 0 0 10214 367 0 0 0 0
279550 10225 251 0 0 0 0 10226 156 0 0 0 0
Example 1 & 2 Notes:
In example 2, measurements were taken on the hour and at 30 minutes after the hour. The zeros
in the record signify that measurements were not taken at the 10, 20, 40 and 50 minute wake-up
times. The zeros will be ignored in the data processing and these data will be processed as a time
series of measurements taken 30 minutes apart.
In both examples, the [hour] value on the first travel time data record corresponds to the first hour
of data collection. However, it may or may not be an hour of the day stamped in the meta-data
‘T’ record because the IES may have been turned OFF after the mission was started (and the data
files were created) but before any data were collected… days or months later! Looking at the
time stamps of the OPR and RES records in the system log file should help to reconstruct the
ON/OFF time line of the IES.
4.3.5
Pressure and Temperature Raw Data File
The pressure and temperature raw data ‘F’ file is identical in format to that of the ‘P’ file described
above… the meta-data record is the same (except it has an ‘F’ instead of a ‘P’ as the first character) and the
relationship of the measurements to the time stamp is the same. The only difference is in the units of the
data… the ‘P’ file pressure and temperature measurement pairs are in units of 10µPa (1/10millibar)and 10-4
degree C respectively and the ‘F’ file measurements are in units of 10-3Hertz. See Example 1.
Example 1:
F 2001/11/21 12:48:26 039 87087 10 5.842375 -4036.615 -2110.00 0.00 -47948.39 3713.318
162670.80 0.037720 0.00 30.28409 2.333273 60.53492 71.7080 0.00 0.00 0.00
279540 0 0 0 0 0 0 0 0 0 0 33036868 171304816
279541 33036824 171305040 33036730 171304608 33036528 171303136 33036204 171300336
33035790 171296080 33035296 171290512
279542 33034742 171283776 33034156 171276224 33033562 171268224 33032980 171260176
33032426 171252336 33031898 171244880
279543 33031406 171237904 33030950 171231472 33030528 171225568 33030136 171220176
33029778 171215280 33029454 171210864
279544 33029152 171206832 33028878 171203184 33028632 171199888 33028402 171196880
33028196 171194176 33028004 171191664
279545 33027828 171189424 33027668 171187360 33027520 171185488 33027382 171183744
33027258 171182160 33027140 171180704
279546 33027036 171179376 33026938 171178144 33026844 171176992 33026758 171175952
33026680 171174992 33026610 171174080
Example 1 Notes:
The meta-data header record and data records are wrapped to fit this page.
Measurements were taken every ten minutes.
4- 10
INVERTED ECHO SOUNDER MODEL 6.2
4.3.6 Telemetry Data File
The telemetry data file (TELEM.dat) will begin with these two meta-data records:
TEL [yyyy/mm/dd] [hh:mm:ss] [IES s/n]
375 0 0
and is followed by these travel time and pressure data records:
[year-day] [T] [P]
: for IES with pressure sensor
[year-day] [T] [P] [S] [H]
: for IES with pressure & Doppler current sensor
The data are low-pass filtered using a tide-elimination filter [Godin, 1972, Sections 2.1.1 and 4.5].
Reference: Godin, G., The Analysis of Tides, University of Toronto Press, 1972
Definition of terms:
[year-day]
the year–day, an integer from 1 to 365 (or 366 on a leap year)
[375 0 0]
a pseudo record that flags the beginning of the data (see below)
[T]
processed travel time data, in units of seconds
[P]
processed pressure data, in units of 10µ
µPa
[S]
processed current speed, in cm/sec
[H]
current heading, compass angle, in degrees, increasing clockwise from North
Example:
TEL
375
234
235
236
237
238
239
1999/12/20 14:40:43 039
0 0
3.3768 2532675
3.3768 2532675
3.3769 2532676
3.3769 2532676
3.3770 2532677
3.3770 2532677
Telemetry File Notes:
The time that should be assigned to a pair of data values is 12:00:00 of the specified year day.
The time interval is one day.
Before the detiding processing can begin the IES must collect 72 hourly mean values for travel
time and pressure. The IES will run the detide program at the end (midnight) of every day
beginning after the 72 hour data buffer has been filled. In other words, it will not start processing
data for the telemetry until the fourth midnight (by the IES clock) of the mission… the first partial
day’s data will not be processed. The telemetry file (with the TEL meta-data record) will be
created at the start of the mission, but there will be no processed data until the fourth midnight.
Only one meta-data record is written to the telemetry file. Each time a new mission starts the 72
hour buffer is cleared and must be refilled… hence restarts will cause a 3 day gap in the time
stamp.
The acoustic telemetry process will read the file backwards (LIFO: last-in-first-out) and the first
record [375 0 0] will provide a flag to the receiver that the end of the file has been reached.
Note: See Chapter 10 & 11 for a complete description of the acoustic telemetry feature and additional
information on telemetry files.
CHAPTER 5 ACOUSTIC COMMAND SUBSYSTEM (ACS)
Chapter 5
5- 1
ACOUSTIC COMMAND SUBSYSTEM (ACS)
The Acoustic Command Subsystem (ACS) of the Model 6.2 IES is a block of circuitry on the IES
board that is dedicated to receiving acoustic commands from a surface ship and converting those commands
into control functions used to:
• locate a deployed IES
• release it from the sea floor
• provide acoustic tracking signals during recovery operations.
• initiate the data telemetry function
This chapter describes the ACS and provides instructions on 1) how to set up the ACS on an
individual IES and 2) how to set up the deck box, either the EdgeTech™ Model 8011A or the Benthos™
Model DS-7000. Chapter 8 describes how to use the ACS during deployment and recovery operations.
The ACS has been designed to decode bit-encoded commands like those produced by the Model
8011A deck box manufactured by EdgeTech Inc (formally EG&G Instruments). The standard Model DS7000, manufactured by Benthos, Inc. of Falmouth, MA, USA can be customized to transmit all of the
IES/ACS codes… contact Benthos for details and cost.
The ACS can be configured (via hardware switches/jumpers) to accept one each of the following
code sets: 4 transpond enable codes, 4 telemetry enable codes, 4 beacon enable codes and 64 release codes.
A fifth command (CLEAR) was created by allowing any properly framed command (regardless of whether
it is a valid command for the instrument) to cancel a previous telemetry or transpond command. A special
command has been designated as the CLEAR command for all IESs… see the following sections for
details.
In general, the acoustic command circuits in the IES Model 6.2 are independent of the data
acquisition circuits and are additionally powered by a separate battery. There are, however, some
components that are shared by the two subsystems… namely the output driver, transformer and acoustic
transducer. The release battery will power these components, powered by the system battery during routine
data acquisition functions, after the release has been activated or if the system battery fails.
5.1 PROGRAMMING THE ACOUSTIC COMMANDS
The jumpers JP1 thru JP4 on the IES circuit board are used to encode the acoustic command
signals for a specific instrument. After selecting the desired command number, use the switches/jumpers to
set the binary value of the command according to the weights given in Table 5-1. See the following section
for an example.
JUMPER
FUNCTION
WEIGHT
JP4-1 to JP4-4
JP4-2 to JP4-3
telem
telem
1
2
JP3-1 to JP3-4
JP3-2 to JP3-3
xpnd
xpnd
1
2
JP2-1 to JP2-4
JP2-2 to JP2-3
beacon
beacon
1
2
JP1-1 to JP1-12
JP1-2 to JP1-11
JP1-3 to JP1-10
JP1-4 to JP1-9
JP1-5 to JP1-8
JP1-6 to JP1-7
release
release
release
release
release
release
1
2
4
8
16
32
Table 5-1 IES circuit board jumper weights - used to encode the command number
5- 2
INVERTED ECHO SOUNDER MODEL 6.2
After the four commands are encoded on an individual IES, the corresponding equivalents must be
entered into the deck box sending unit as shown in Table 5-2: (see the following sections for examples of
setting up either type of deck box, EdgeTech or Benthos)
TELEM CODE
0
1
2
3
EdgTech 8011A code
Benthos DS-7000 URI code
1 1000 0100 0 1 0100 0100 0
1 1100 0100 0 1 0010 0100 0
1 1010 0100 0 1 0110 0100 0
1 1110 0100 0 1 0001 0100 0
64
65
66
67
1 1000 1000 0 1 0100 1000 0
1 1100 1000 0 1 0010 1000 0
1 1010 1000 0 1 0110 1000 0
1 1110 1000 0 1 0001 1000 0
68
69
70
71
1 1000 0000 0 1 0100 0000 0
1 1100 0000 0 1 0010 0000 0
1 1010 0000 0 1 0110 0000 0
1 1110 0000 0 1 0001 0000 0
72
73
74
75
1 0000 0000 0 1 1111 1111 0
76
XPND CODE
0
1
2
3
BEACON CODE
0
1
2
3
CLEAR CODE
<= VALID FOR ALL IESs
Figure 5-2 Deck box settings for various IES commands
(continued on next page)
CHAPTER 5 ACOUSTIC COMMAND SUBSYSTEM (ACS)
RELEASE CODES
0
1
2
3
4
5
6
7
8
9
10
11
12
13
14
15
16
17
18
19
20
21
22
23
24
25
26
27
28
29
30
31
32
33
34
35
36
37
38
39
40
41
42
43
44
45
46
47
48
49
50
51
52
53
54
55
56
57
58
59
60
61
62
63
EdgeTech 8011A codes
1 0000 1100 0 1 1000 1100 0
1 0100 1100 0 1 1100 1100 0
1 0010 1100 0 1 1010 1100 0
1 0110 1100 0 1 1110 1100 0
1 0001 1100 0 1 1001 1100 0
1 0101 1100 0 1 1101 1100 0
1 0011 1100 0 1 1011 1100 0
1 0111 1100 0 1 1111 1100 0
1 0000 0010 0 1 1000 0010 0
1 0100 0010 0 1 1100 0010 0
1 0010 0010 0 1 1010 0010 0
1 0110 0010 0 1 1110 0010 0
1 0001 0010 0 1 1001 0010 0
1 0101 0010 0 1 1101 0010 0
1 0011 0010 0 1 1011 0010 0
1 0111 0010 0 1 1111 0010 0
1 0000 1010 0 1 1000 1010 0
1 0100 1010 0 1 1100 1010 0
1 0010 1010 0 1 1010 1010 0
1 0110 1010 0 1 1110 1010 0
1 0001 1010 0 1 1001 1010 0
1 0101 1010 0 1 1101 1010 0
1 0011 1010 0 1 1011 1010 0
1 0111 1010 0 1 1111 1010 0
1 0000 0110 0 1 1000 0110 0
1 0100 0110 0 1 1100 0110 0
1 0010 0110 0 1 1010 0110 0
1 0110 0110 0 1 1110 0110 0
1 0001 0110 0 1 1001 0110 0
1 0101 0110 0 1 1101 0110 0
1 0011 0110 0 1 1011 0110 0
1 0111 0110 0 1 1111 0110 0
1 0000 1110 0 1 1000 1110 0
1 0100 1110 0 1 1100 1110 0
1 0010 1110 0 1 1010 1110 0
1 0110 1110 0 1 1110 1110 0
1 0001 1110 0 1 1001 1110 0
1 0101 1110 0 1 1101 1110 0
1 0011 1110 0 1 1011 1110 0
1 0111 1110 0 1 1111 1110 0
1 0000 0001 0 1 1000 0001 0
1 0100 0001 0 1 1100 0001 0
1 0010 0001 0 1 1010 0001 0
1 0110 0001 0 1 1110 0001 0
1 0001 0001 0 1 1001 0001 0
1 0101 0001 0 1 1101 0001 0
1 0011 0001 0 1 1011 0001 0
1 0111 0001 0 1 1111 0001 0
1 0000 1001 0 1 1000 1001 0
1 0100 1001 0 1 1100 1001 0
1 0010 1001 0 1 1010 1001 0
1 0110 1001 0 1 1110 1001 0
1 0001 1001 0 1 1001 1001 0
1 0101 1001 0 1 1101 1001 0
1 0011 1001 0 1 1011 1001 0
1 0111 1001 0 1 1111 1001 0
1 0000 0101 0 1 1000 0101 0
1 0100 0101 0 1 1100 0101 0
1 0010 0101 0 1 1010 0101 0
1 0110 0101 0 1 1110 0101 0
1 0001 0101 0 1 1001 0101 0
1 0101 0101 0 1 1101 0101 0
1 0011 0101 0 1 1011 0101 0
1 0111 0101 0 1 1111 0101 0
Benthos DS-7000 codes
0
1
2
3
4
5
6
7
8
9
10
11
12
13
14
15
16
17
18
19
20
21
22
23
24
25
26
27
28
29
30
31
32
33
34
35
36
37
38
39
40
41
42
43
44
45
46
47
48
49
50
51
52
53
54
55
56
57
58
59
60
61
62
63
Figure 5-2 (continued)
5- 3
5- 4
INVERTED ECHO SOUNDER MODEL 6.2
5.2 ACOUSTIC COMMAND ENCODING EXAMPLE
The acoustic commands for each IES are encoded and tested at the time of manufacture. However,
the user has the option to modify an IES ACS system (change the jumpers on the circuit board – see Figure
2-1) so that the instrument will not detect codes intended for IESs at nearby deployment sites… especially
the release command!
The following example outlines how to set up the IES and either the EdgeTech 8011A or the
Benthos DS-7000 deck box for a set of codes.
Assume the user has chosen the following ACS commands for a particular IES:
•
•
•
•
TELEMETRY
TRANSPOND
BEACON
RELEASE
CODE # 1
CODE # 2
CODE # 3
CODE # 52
First, code the IES circuit board (Figure 2-1) using the weights in Table 5-1 to set the hexadecimal
values of each chosen command… the proper settings on JP1 thru JP4 are:
command code #:
jumper installed(0=NO, 1=YES):
circuit board reference:
circuit board label:
1
01
JP4
TELEM
2
3
52
10
11
110100
JP3
JP2
JP1
XPND BEACON RELEASE
After programming these commands onto the IES circuit board, the corresponding binary
equivalents from the tables above must be encoded into the acoustic command deck box… follow these
steps for the appropriate deck unit:
EdgeTech 8011A Deck Box Setup
•
•
•
•
•
•
•
•
•
•
•
•
•
Go to Command Setup < menu >
Choose Custom Cmd Setup < 2 >
Choose a custom command number < 0 - 9 >
Choose a Bit-encoded Custom Command < 1 >
Set 0-freq = 12500 Hz
Set 1-freq = 12000 Hz
Set Bit ON time = 22 msec
Set OFF time = 228 msec, <enter>
Enter the 20 bit binary code, from Table 5-2, using 0 & 1 keys, <enter>
Choose guarded for RELEASE command, not-guarded for others
Return to Command mode and enter the custom cmd# (0-9)
Set the output level and use <enter> again to send the command
Set the deck box receive frequency at 12.00kHz
For our example, the binary codes entered in the deck box are:
TELEM (1)
Custom command #1
XPND (2)
Custom command #2
BEACON (3)
Custom command #3
RELEASE(52) Custom command #4
=>
=>
=>
=>
1 1100 0100 0 1 0010 0100 0
1 1010 1000 0 1 0110 1000 0
1 1110 0000 0 1 0001 0000 0
1 0001 1001 0 1 1001 1001 0
IMPORTANT: Allow at least 15 seconds between command transmissions.
Recommendation: Attach a label to the display of the deck box that matches the custom command number
with its IES serial number and command function.
CHAPTER 5 ACOUSTIC COMMAND SUBSYSTEM (ACS)
5- 5
Benthos DS-7000 Deck Box Setup
•
•
•
•
•
press POWER and verify that the display shows:
BENTHOS DS7000
ES 7331 A-500-114
V1.41
(only deck sets with these firmware codes will work with URI IES units)
Set the RX FREQ @ 12.0 kHz
press MODE SELECT until “ID / URI ” is in AUX 3 display window
press AUX 2 scroll arrows until the desired URI code is displayed (see Table 5-2)
press SEND COMMAND + SINGLE to transmit the URI/IES command
For our example, the codes entered in the AUX 2 window of the deck box are:
TELEM (1)
AUX ## 2 => 65
XPND (2)
AUX ## 2 => 70
BEACON (3)
AUX ## 2 => 75
RELEASE(52) AUX ## 2 => 52
CLEAR
AUX ## 2 => 76
IMPORTANT: Allow at least 15 seconds between command transmissions.
Recommendation: Attach a label to the display of the deck box that matches the URI/ID command number
with its IES serial number and command function.
5- 6
INVERTED ECHO SOUNDER MODEL 6.2
5.3 ACOUSTIC COMMAND DETAILS
IMPORTANT: Responses from the acoustic command subsystem are blocked during travel time
measurements so the user must be aware of the measurement schedule when using acoustic commands.
To prevent the ACS system from being left in an active state (XPND or TELEM ON), the CF1 computer
will reset the ACS controller every midnight (according to the IES clock)… this disables all ACS
functions.
Transpond Enable (XPND)
This command sets the acoustic command subsystem in the transpond mode. When the command is
accepted the system will reply with two 12.0 kHz pulses, two seconds apart. The command decoder
will then continuously listen for 12.5kHz interrogation pulses and, if detected, will respond
immediately with a 12.0kHz reply pulse. After each transpond reply, the system will wait for 4
seconds before returning to listening so the shortest recommended interrogation interval is 6
seconds. The system will continue in the transpond mode until it has been disabled by a CLEAR
command (see below) or a reset. During travel time sampling, the transpond replies will be blocked
by the data acquisition function. While in the transpond mode the system can receive the release
command.
Telemetry Enable (TELEM)
This command sets the IES data acquisition subsystem in the pulse delay telemetry (PDT telemetry)
mode. When the command is accepted, the system will reply with two 12.0 kHz pulses, two seconds
apart. After the next measurement burst is complete, the IES will begin transmission of either burst
telemetry or file telemetry, depending on how long it has been since the mission was started. The
many important details of this operation are outlined in Chapter 10. The PDT telemetry is used to
verify the proper functioning of the IES measurement circuits and to collect data in lieu of
recovering the IES. The system will remain in this mode until disabled by the CLEAR command
(see below), the file telemetry is complete, or a reset. While in the TELEM mode, the system can
receive the release command.
CLEAR (Disable Transpond & Telemetry)
This command will disable the Transpond and Telemetry modes if either is enabled. In fact, any
command, if properly framed (bits 1 & 11 are 1’s, bits 10 & 20 are 0’s) will act as a disable
command. When the command is accepted, the system will reply with two 12.0 kHz pulses, 2
seconds apart. It is important to remember that the Transpond and Telemetry modes cannot be
enabled simultaneously, since the reception of either command disables the other. If either of
these commands is enabled at midnight (according to the IES clock), it will be disabled.
Beacon Enable (BEACON)
This command sets the acoustic command subsystem in the beacon mode. When the command is
accepted the system will reply with two 12.0 kHz pulses, two seconds apart. The command decoder
will then generate 12.0 kHz pulses at an eight second rate for the next twenty minutes unless
disabled by a reset. During this time the decoder will not accept any other commands… so the
beacon cannot be terminated by the CLEAR command. During a travel time measurement burst the
beacon is blocked, but will continue after the burst if twenty minutes has not passed since the beacon
was enabled. While in beacon mode the system cannot receive a release command. After the
twenty minutes of beacon mode have expired the acoustic command subsystem will return to
listening for further commands.
Note: If the Beacon function is enabled at midnight (according to the IES clock), it will be
disabled.
CHAPTER 5 ACOUSTIC COMMAND SUBSYSTEM (ACS)
5- 7
RELEASE
This command sets the IES in release mode. When the command is accepted the system will reply
with six 12.0 kHz pulses, two seconds apart to signify that a release command has been detected. If
current is detected in the burn-wire release, the system will continue to transmit pulses at a four
second rate for at least 3 hours. The burn wire release will usually take about 15-20 minutes before
it drops the ballast anchor, allowing the IES to come to the surface.
IMPORTANT: Refer to Chapter 8 for details of at-sea operations regarding the release function.
The IES data acquisition subsystem will not detect the release activation until the next ten-minute
wakeup. When the IES data acquisition subsystem detects the active release, it performs the following
tasks:
• Writes the release time in the system log
• Moves all data in the day buffers to the memory card
• Writes an engineering data record to the memory card
• Stops the data acquisition schedule and returns to listening mode
WARNING: When performing short tests in the lab it is important to remember that, after an acoustic
(ACS) release, the IES does not transfer the data to the memory card until the NEXT ten minute
wakeup. If, during testing on the lab bench, you RESET to the menu mode after an ACS release,
without waiting for the data to be transferred, you will lose the data from that day that have been
temporarily stored in RAM memory. If you don’t activate the release but you want to transfer the data
from a short test to the memory card, connect your PC, wait for the next ten minute wake up, establish
communications with the IES, go to the Memory Card Operations Menu (see Chapter 2.3.4) and select
‘F’- Save RAM data to Memory Card… the data buffers will then be appended to the existing data files.
5- 8
INVERTED ECHO SOUNDER MODEL 6.2
THIS PAGE INTENTIONALLY LEFT BLANK
CHAPTER 6 CIRCUIT DETAILS
Chapter 6
6- 1
CIRCUIT DETAILS
6.1 BATTERY PACK
Refer to Figure 6-1 for a diagram of the IES Model 6.2 17” Lithium battery pack. The battery
cells are mounted on a reusable circuit board and are divided into two independent sections… the lower
section is for the acoustic command subsystem (referred to as the release battery) and the upper section is
for the IES data acquisition subsystem (referred to as the system battery) – see Figure 1-1. [Note: Cells #
B23 & B24 are on the lower section and are part of the system battery].
The board is configured for size “DD” lithium cells (with tab or pigtail terminals and open circuit
voltage = 3.6Volt). If the full complement of batteries is not needed, be sure to load the cells in such a way
that the spatial symmetry of the pack is maintained, i.e., balanced around the center, otherwise the IES may
sit at an angle during deployment. The board is designed to accommodate symmetric packs of 120, 180
and 240 Ampere-hours for the system battery… the release battery will always have 8 cells in a symmetric
arrangement.
As the diagram shows, parallel diodes on each release battery cell prevent an individual cell failure
from influencing the entire stack other than lowering the voltage by 3.6V.
The IES Lithium cells, unlike carbon or alkaline cells, maintain their open-circuit voltage (3.4 –
3.6 Volts) until near end-of-life, so it is not possible to determine the energy remaining in a cell with a
voltage measurement. Use the chart in Chapter 3.3 to estimate how long a battery will last.
NOTE: In case of battery failure, the system battery will attempt to assist the release battery but not vice
versa.
Figure 6-1
IES Model 6.2 Lithium Battery Pack for 17” Sphere
6- 2
INVERTED ECHO SOUNDER MODEL 6.2
6.2 PERSISTOR COMPUTER MODULE & MEMORY CARD
All scheduling, measurement, data processing and storage functions of the Model 6.2 IES are
controlled by the Persistor CF1 computer module, manufactured by Peripheral Issues, Inc. of Falmouth,
MA, USA. See their web site at www.persistor.com . The data file management and memory card
subsystems are integral parts of the CF1module. The CF1 mounts on the IES circuit board with a simple
connector so that any problems traceable to the computer module can be resolved with a CF1 module
replacement.
6.3 RECOVERY AIDS (the RELOC Module)
In addition to the acoustic command subsystem, which controls the mechanical release mechanism
and the relocation and recovery acoustic signals, there is an optional radio/flasher module (RELOC) which
mounts inside the glass sphere to aid in recovery after the IES has reached the surface. The RELOC
module contains a high intensity (1 million candlepower) xenon flasher (flash at ~ 1Hz) and a VHF radio
beacon (Channel 77) that transmits a CW pulse about every 4 seconds. The flash can be seen through the
white translucent hard hat of the IES and the radio can transmit (@ 100mWatts) through the glass & hard
hat… radio range varies with sea state from ½ to 2 miles. Radio direction finder (RDF) receivers are
available to indicate relative bearing, e.g., those made by Taiyo (see web site www.taiyomusen.co.jp) and
NovaTech Designs Ltd. (see web site www.novatechdesigns.com). Also see Chapter 8.3.3. The RELOC
module is activated when the IES RELEASE relay is activated, but uses an additional tilt switch to keep the
radio/flasher OFF until the IES turns over (acoustic transducer facing DOWN)… this will be the orientation
of the IES when it is on the sea surface. Once on the surface, the RELOC module will continue to be active
until the IES batteries (both system and release batteries) are exhausted. A photoelectric switch controls the
flasher, which only operates in darkness. After the release is activated and the IES is on the surface, the
RELOC module will operate for about 60 hours with a 30 Amp-hr stack of release battery cells or 120 hours
with a 60 Amp-hr stack of cells.
Remember! – The RELOC radio/flasher module only operates when the acoustic transducer is facing
DOWN and the flasher only when it is dark.
CHAPTER 6 CIRCUIT DETAILS
6.4
6- 3
FAIL-SAFE CIRCUITS
Watchdog Timer
A “watchdog” alarm will attempt to restart the instrument if the IES computer module is
inactive longer than 12 minutes. The IES wakes up from sleep mode every 10 minutes to
check its measurement schedule and resets the watchdog timer… missing one of these 10
minute timer resets will cause the watchdog to RESET the IES after about 12 minutes.
The watchdog timer circuit operates with an independent time base and is powered
exclusively by the system battery. The watchdog is operating whenever the IES is in data
acquisition mode but is disabled when the IES is in menu mode or when an acoustic or
timed release is detected. The time of each IES RESET will be noted in the “IES###.log”
file as outlined in Section 4.3.1. The watchdog timer is independent of the acoustic
command subsystem and does not monitor or control its operations. However, if the
watchdog resets the IES, the IES will, in turn, reset the acoustic command controller and
release relay, i.e., the entire instrument gets reset. If the IES system battery is exhausted,
the watchdog timer is no longer operative.
• Battery Independence & Low Voltage Monitor
The model 6.2 IES has two independent batteries… system and release. The IES is
designed such that if the system battery is entirely exhausted, the release battery will
support all recovery features. When the system battery falls below 6.0 volts, the data
acquisition system will save all data, cease collecting further data and enter a low-power
sleep mode. Alternatively, if the release battery fails, the system battery will operate the
recovery functions, although, due to the lower voltage, the burn time of the release
mechanism will be as much as three times longer and the acoustic responses will be 12dB
weaker. If the system battery is exhausted, the auto-release function will no longer be
operative.
•
6.5
DYNAMIC CLOCK ADJUSTMENT
The time base (crystal oscillator) of the IES real time clock (RTC) is integral to the IES’s CF1
computer module. The CF1 is the computer engine that controls the IES data-collecting schedule. The
CF1 time base has an unacceptable frequency tolerance (30 – 60ppm) over the IES operating temperature
range (0-25°C). This can result in an IES clock drift of up to 5 seconds/day or 30 minutes/year!). To
correct this problem the IES periodically measures the RTC oscillator frequency using the IES’s superstable Bliley crystal oscillator and corrects the IES clock. This correction should keep the IES clock
accurate to within an estimated 10 seconds/year.
The IES dynamic clock adjustment works as follows: At the end of each measurement hour (after
the xx:50:00 scheduled activities), the IES will use its YSI thermistor circuit to measure the ambient
temperature inside the IES . This value is used to apply temperature compensation to determine the
reference frequency (Bliley oscillator). The IES will then (using the Bliley oscillator as a reference)
measure the CF1 RTC frequency and calculate the clock drift during the previous hour based on the error
from the nominal value of 32768Hz. Note that this assumes the temperature has been stable during the
previous hour. The IES will sum the errors from each hour’s calculation until the clock drift becomes
greater than 1.0 second. The IES will then adjust the RTC appropriately by 1.0 second and reduce the error
sum by 1.0 second. Ideally, if the operating temperature is stable, the IES clock will never be in error by
more than 1.0 second, however, temperature fluctuations on the order of 1°C in 30 minutes will introduce
additional small errors.
6- 4
INVERTED ECHO SOUNDER MODEL 6.2
THIS PAGE INTENTIONALLY LEFT BLANK
CHAPTER 7
IES ASSEMBLY
Chapter 7
7- 1
IES ASSEMBLY INSTRUCTIONS
Note: While reading this chapter, refer to the IES Parts Location drawing Figure 1-1 in Chapter 1
to see the proper positioning of the elements in a properly assembled IES.
General precautions for sealing glass instrument housings are provided in a separate document
provided by Nautilus Marine Service, Bremen, Germany (See Appendix A.1). Specific instructions for
sealing the IES model 6.2 are provided in this chapter. The assembly procedure is divided into two parts;
1) sealing the electronics in the glass sphere, and 2) installing the sphere in the hard hat.
First some notes about the use of glass instrument housings.
7.1 GLASS INSTRUMENT HOUSINGS
Although new users of this type of instrument housing are initially apprehensive about handling
glass, they usually become advocates because most of the corrosion issues concerning undersea equipment
disappear. The most important advice we can offer, after hundreds of successful deployments, is the need
for cleanliness during the seal up process. Clean your hands with rubbing alcohol before cleaning the
glass mating surfaces and the o-rings. This is very important! Once your fingers are clean of grease they
become excellent detectors of any dirt or grease on the glass… gently slide your clean finger over the glass
mating surfaces. The glass itself should be cleaned with a residue-free solvent such as toluene. Make sure
that you have adequate ventilation when using strong solvents… the fumes are hazardous to your health.
The preferred method of sealing the sphere is to remove most of the air from inside the sphere with
a vacuum pump. This removes most of the moisture that can condense when the sphere is cooled at ocean
depths and also provides an indication of how well the sphere is sealed prior to applying the sealing tape.
Simply remove the vacuum port screw and hold a plastic hose to the port until the vacuum sensor needle
points to the green dot (this is about ~14” (36cm) Hg). The vacuum port is so small that pulling the plastic
hose away and quickly inserting the sealing screw will not allow enough air back into the sphere to change
the vacuum significantly. Replace the vacuum port o-ring after every deployment. Examine the o-ring on
the sealing screw with a magnifying glass and remove any dust particles. The o-ring should be lightly
greased with o-ring lubricant.
Since the IES is usually deployed in a low temperature environment, it is important to perform the
glass housing closure in a dry atmosphere AND include packets of desiccant (silica-gel) to prevent any
condensation collecting on the IES circuit board.
An alternative to using the vacuum pump to seal the hemispheres is to direct some warm air from
an electric hair dryer inside the sphere as you close it up… as the air cools, a vacuum will develop that will
hold the hemispheres together. Be careful not to overheat the electronics! If the hemispheres do not seal,
check for grease or dirt particles on the glass sealing faces. If you use this method, it is particularly
important to install desiccant (silica-gel) to absorb condensation.
7-2
INVERTED ECHO SOUNDER MODEL 6.2
7.2 SEALING THE GLASS SPHERE
After the battery assembly has been attached to the IES electronics, follow these steps to prepare
the electronic assembly for sealing in the glass sphere:
1. Select the glass hemisphere with the acoustic transducer attached and support it so that the
transducer is pointing down and the open hemisphere is facing up… like a bowl. One of the
foam blocks from the shipping container is ideal for this operation.
2. Pull the IES transducer cable from inside the glass and hang it over the side of the hemisphere.
3. Install packets of fresh, dry desiccant in the orange desiccant sock on the IES frame.
4. Make sure that both hemispheres have matching serial numbers and that the pressure
transducer is the correct one for the IES.
5. Lift the IES electronics assembly with the finger holes (battery on the bottom) and lower it
between the rubber bumpers on the side of the glass. Keep all the yellow arrow labels (on IES
and glass) on the same side of the hemisphere.
6. Rotate the IES electronics assembly until it is firmly wedged under the rubber blocks. Align
the yellow arrow labels of the electronics package with the yellow arrows on the glass. Make
sure that the transducer cable is not pinched between frame and glass.
7. Plug the transducer cable into connector J1 (see Figure 2-1).
8. Set the output driver switch S1 to XMT (see Figure 2-1).
9. Set the ON/OFF power override switch S2 to REMOTE (see Figure 2-1).
10. Clean the glass sealing surfaces on both hemispheres as described in Chapter 7.1.
11. While one person holds the other hemisphere, rim downward above the first hemisphere, a
second person plugs the pressure sensor cable into J6 of the IES board, the external cable into
J3 of the IES board.
12. Close the hemispheres and align their outside edges. Rotate the top hemisphere to align the
yellow arrows and serial numbers of the glass.
13. Open and examine (with a magnifier) the vacuum port. Clean the port and sealing screw.
Replace the o-ring if necessary using a little o-ring lubricant (see Section 7.1).
14. Using a vacuum pump and clean rubber hose, evacuate the air from the sphere to
20”(50cm)Hg vacuum and quickly replace the port sealing screw (see Section 7.2). Confirm a
good seal by trying to slide the hemispheres apart… they should not move. See **Warning
below.
15. Wrap the soft sealing (goop) tape around the equator joint of the sphere, overlapping the ends
~ 0.25” (0.6cm). Before removing the backing paper from the tape, flatten the soft tape with a
roller to half of its original thickness.
16. Wrap two layers of the 2”(5cm) wide plastic tape over the soft tape. Smooth out any trapped
air bubbles.
17. Install the plastic belt and rubber handles at right angles to the equator joint as shown in figure
7-1 (note the position of the lifting handle, buckle and clasp relative to the top of the
assembly). Adjust the buckle of the belt so that when the belt ends are joined together the belt
is tight around the sphere. Put a tape strip across the lifting strap on both sides of the lifting
handle as shown in Figure 7-1 and 7-2. The IES sphere assembly is now ready to be installed
into the hard hat.
2
CHAPTER 7
IES ASSEMBLY
7- 3
Figure 7-1 IES Sphere Assembly
**Warning: Even a slight vacuum will firmly hold the glass hemispheres together. If the IES is
going to be shipped by air, it is important that a vacuum of 1/3 atmosphere be created inside the sphere to
prevent the pressure differential at high altitudes from forcing the sphere open. However, do not create a
vacuum greater than 20”Hg vacuum because arcing between high voltage components may occur.
7-4
INVERTED ECHO SOUNDER MODEL 6.2
7.3 HARD HAT ASSEMBLY
After the electronics are sealed inside the glass sphere, follow these steps to install the sphere
inside the white plastic hard hat as shown in Figure 7-2. The hardware required to assemble the hard hat is
shown in Figure 7-3.
Warning: During this assembly procedure, the “upper” hard hat is actually under the “lower”
hard hat. In the following steps, don’t get the terminology mixed up… “upper” and “lower” refer to
names of the hard hats, as shown in Figure 7-1, and not to their position in this assembly process.
1.
2.
3.
4.
5.
6.
7.
Start with the “upper” hat section on the floor… resting on the acoustic transducer guard.
Lift the IES sphere assembly by the rubber lifting handle (transducer pointing down) and
lower it into the hard hat… rotate the IES until the yellow arrow label on the edge of the hard
hat is aligned with the yellow arrow on the glass hemisphere. See Figure 7-2.
Place the “lower” hard hat over the sphere, rotating it to align the green arrow labels on the
inside edges of the hard hats.
As you are placing the “lower” hard hat, pull all the connectors on the IES external cable
through the hole in the hat beside the release block. Be careful not to disturb the plastic fitting
on the sphere pressure port.
Install the nylon bolts and nuts that clamp the two plastic hard hats together; install the nylon
flag holder hardware. Use nylon washers on both sides when bolting the two hard hats
together.
Install the release block as shown in Figure 7-3. Orient the release block so that the
anode/cathode connectors are nearest the hole in the hard hat assembly.
Apply a small amount of o-ring grease to the mating surfaces of cable and connectors. Plug in
the release block cables and the yellow RS-232 communications cable sealing plug. When
you are ready to turn the IES ON, grease the red ON/FF plug and install it. When the red plug
is installed, the IES will turn ON and acoustically respond as outlined in Chapter 2.2.2.
Figure 7-2 Placing the Sphere in the Hard Hat
4
CHAPTER 7
IES ASSEMBLY
7- 5
(1) 1/2"-13 x 1.5" bolt
(flag base nut)
(8) 3/8-16 x 1.5" bolts
(1) 1/2" washer
(8) 3/8 washers
UPPER hard hat
(2) 3/8-16 nuts
(2) 3/8 washers
LOWER hard hat
(8) 3/8 washers
(8) 3/8-16 nuts
(1) 1/2" washer
(1) 1/2-13 nut
Flag holder
(2) 3/8 washers
(2) 3/8-16 x 1" bolts
Release Block Assembly
(4) 3/8-16 x 2" bolts
Figure 7-3 IES Hard Hat Assembly Hardware
7.3 BURN-WIRE RELEASE MECHANISM
The burn-wire release mechanism used on the IES Model 6.2 has been used in hundreds of
successful IES recoveries. However, the following details must be adhered to, without exception, otherwise
omitting a small detail could result in the IES never releasing from the sea floor.
• use only URI-GSO replacement parts (see Appendix D.1 for part numbers)
• follow PRECISELY the release block assembly instructions in Appendix D.2
7-6
INVERTED ECHO SOUNDER MODEL 6.2
7.4 PRESSURE & VACUUM PORTS
Both the pressure port and the vacuum port are made from titanium alloy to minimize corrosion.
The internal plumbing that connects the pressure port to the pressure sensor has been tested to 10,000 psia
(6.9x10⁴ kPa) for 48 hours to assure safe deployments to full ocean depths. If the pressure sensor is
changed, the internal fitting seals should be retested to comply with the anticipated deployment depths.
Between deployments be sure to perform the pressure port maintenance procedures outlined in Chapter
9.1.1. The only o-ring in the pressure port assembly is between the titanium port and the glass and can be
inspected from inside the hemisphere.
The vacuum port has two o-rings: one between the port and the glass sphere and another between
the port and the external sealing screw. The o-ring seal between the port and the glass can be inspected
from the inside of the glass sphere… make sure that the rubber is flat against the glass. Since the port
sealing screw is removed and reinserted for every deployment, great care should be exercised in examining
the o-ring and sealing surfaces for dirt & wear... use magnifying glasses to examine these pieces… a leak
here is catastrophic!
6
CHAPTER 8 AT SEA OPERATIONS - IMPORTANT DETAILS
Chapter 8
8- 1
AT SEA OPERATIONS - IMPORTANT DETAILS
8.1 DEPLOYMENT
For its measurement capabilities, the IES Model 6.2 is small and inexpensive. However, its release
mechanism is somewhat delicate and requires a little care during the launch procedure. It is important to
follow the launch guidelines in this section!
IMPORTANT: To assist in keeping a record of important numbers and times, an IES Deployment
Form is provided in Appendix E of this manual. Make a copy of this form for each IES prior to
deployment and fill in the blanks during launch operations. This form has been used at URI-GSO and
found to be valuable at IES recovery time when trying to reconstruct what happened at deployment time,
e.g., “where did we put the IES and what is its release code”?
8.1.1
Launch Precautions
•
•
•
•
The IES can be launched using an A-frame, crane, or any lifting mechanism that
allows you to lift the entire instrument, including the anchor (see the following
section), off of the deck and then swing the entire assembly over the side and into the
water. A 5/16" (8mm) diam. fiberglass pin supports the IES anchor. This pin has a
breaking strength of 300-400 kg. The integrity of this assembly should be checked
by first raising the IES and anchor off the deck and checking for any slippage of the
release block parts, before moving the system over the water. In this way, if there is
any failure of the delicate release block parts, the anchor will fall to the deck and not
in the water. Have a fully armed release block assembly ready to install in case of
problems.
As stated above, the weakest release block part has a breaking strength of 300-400
kg. Even though the anchor will weigh about 50kg, this limit can easily be exceeded
if there is any jerking of the lifting line during launch. If the lifting line is a steel
cable this problem is significantly exacerbated; a one meter loop of nylon line should
be inserted between the steel cable and the quick release hook to act as a shock
absorber.
If the IES acoustic release has been accidentally activated during previous operations
it will not be obvious since the 4-sec. pinger does not become active unless current is
flowing through the release block via the sea water path. Immediately before
launch, momentarily connect the anode to the cathode of the release block… if the
4-sec. pinger comes on, the release relay has been accidentally activated and the IES
must be RESET. To RESET the IES simply turn it OFF, then ON, and wait for the
double ping that indicates proper resumption of the mission (refer to Chapter 2.2.2).
This action will not alter the internal clock, mission configuration, or the data files,
so the deployment can continue. A record of this extra RESET will appear in the
IES###.log file.
It is also important to check the IES vacuum seal just before launch. You can see the
vacuum gauge (altimeter) thru the communications cable access hole. Confirm that
the gauge needle points to the green dot… if the needle has moved counterclockwise
toward the red dot, the launch should be aborted and the IES re-sealed.
8- 2
INVERTED ECHO SOUNDER MODEL 6.2
8.1.2 Selecting and Attaching the IES Anchor
Almost any kind of high density mass can be used as an IES anchor. A variety of salvaged objects
have been successfully used; auto engine blocks, sections of train rails, old ship’s anchor chain and leadembedded concrete blocks. Since the IES is usually deployed for long periods of time, corrosion between
dissimilar metals in the anchor assembly and attachment mechanism should be taken into consideration…
the integrity of the IES attachment point and the overall mass of the anchor should not be compromised due
to long-term corrosion properties.
The pressure sensing circuit in the IES is so sensitive that it will detect small changes (<1mm) in
the height of the IES from the sea floor… deterioration of the mooring system or its response to variable
bottom currents will contaminate the pressure measurement. This is the reason that long (>1.0 meter)
anchor lines should NOT be used. If an IES with a pressure sensor is to be deployed at a site with an
anticipated maximum bottom current flow greater than 0.6 knot (30cm/sec), a rigid mooring stand should be
utilized… consult URI-GSO for more information regarding this application.
When choosing and attaching the IES anchor, follow these general rules:
• Select an anchor that weighs between 100-120lbs (45-55 kg) in air and at least 88lbs (40kg) in
water.
• Use a 5/16” (8mm) diam. nylon or dacron anchor line that will position the IES 1.0 meter
above the seafloor.
• Attach the anchor line at the center of mass of the anchor so that the IES cannot pick up one
end of the weight. For example, if using salvaged anchor chain, clump the chain together so
that it reacts as a single mass… see Figure 8-1.
• Double wrap and tie the line tight around the anchor to minimize abrasion.
• Add security to all knots in the anchor line with plastic cable ties.
No
Yes
Figure 8-1 Using Salvaged Chain as an Anchor - Attaching the Anchor Line
CHAPTER 8 AT SEA OPERATIONS - IMPORTANT DETAILS
8- 3
8.1.3 Acoustic Tracking Operations
This section describes the use of the Acoustic Command Subsystem (ACS) during deployment
operations. Descriptions of the ACS subsystem and the commands themselves are provided in Chapter 5.
It is assumed here that the user understands the setup and the functions of ACS commands as described in
Chapter 5 and that some type of acoustic tracking system (receiver & line scan recorder) is available on the
ship.
Using the ACS, there are two methods of determining the location of an IES on the sea floor:
• Sending the XPND (transpond) command will initiate the IES transpond mode. In
this mode the IES will immediately reply with a 12.0kHz ping whenever it detects a
12.5kHz interrogation ping from the ship. Using an EdgTech model 8011A or
Benthos model DS-7000 deck box in the ranging mode, the slant range from ship to
IES can be determined… but not bearing. If the ship is equipped with a hullmounted transducer that can transmit the 12.5kHz interrogation pings, the operator
can maneuver the ship while continually updating the slant range… bearing can then
easily be determined. Alternatively, if a lowered hydrophone is used, a minimum of
three slant ranges should be measured, each from a different (GPS-measured) ship
position. Knowing the depth of the IES, these measurements give the IES position.
• Sending the BEACON command will initiate 20 minutes of BEACON mode… a
12.0kHz ping at an 8 second rate. This mode cannot be used to determine range, but
can be used to determine relative bearing by maneuvering the ship and monitoring
the line scan recorder. When the ship is on a straight-line course, the line to the IES
(fixed on the bottom) is perpendicular to the course line at the point of closest
approach, as indicated by a minimum-time in the line-scan trace. The BEACON
mode is normally used during IES recovery operations when the ship can only listen,
i.e., does not have the capability of transmitting transpond pulses while maneuvering.
Immediately after launching the IES, put the deck box transducer in the water (if the ship lacks a
suitable hull-mounted transducer) and send the XPND command. Set up the deck box in continuous
ranging mode with 12.5kHz as the output frequency and 12.0kHz as the receive frequency. The
interrogation pulse should be >20 milliseconds long. The slant range will be displayed on the deck box
during the IES descent. When the IES reaches the bottom, the slant range indicated should stablize and be
close to the water depth. DON’T FORGET: the transponder will be quiet during travel time
measurements!.. note the measurement schedule when using acoustic commands… and remember to
disable the transpond and telemetry functions with the CLEAR command before departing the site. If
you do forget to disable these functions the model 6.2 IES will disable them at midnight (by the IES
clock).
Note: Software is available to convert an inexpensive laptop computer into a line scan recorder that works
well for these acoustic tracking operations. It is available from Chaplin Marine Instruments, Sherborn,
MA, 01770, USA. Inquire about TRAX-4 software at their web site: www.cmari.com
8- 4
INVERTED ECHO SOUNDER MODEL 6.2
8.1.4 Acoustic Telemetry Operations
The Model 6.1 is equipped with an acoustic telemetry scheme to verify the correct operation of its
measurement systems immediately after it is deployed. A similar scheme is used to collect data from the
IES in lieu of recovering the instrument, i.e., during a deployment.
To use the IES acoustic telemetry option, the following additional equipment and software are required:
Benthos Inc, Model DS-7000 Acoustic Transceiver Deck Box configured for 4 channels
(IES & PIES applications) or 8 channels (C-PIES application).
The Model DS-7000 must also have special firmware installed to transmit IES codes.
Contact Benthos, Inc. Falmouth, MA, USA for pricing.
The shipboard telemetry receiver uses software from The MathWorks (Matlab 7 for
Windows) to interface with the DS-7000 deck box and display the incoming data. Matlab
programs to implement IES acoustic telemetry are available from URI-GSO.
Telemetry operations are rather complex and cannot be summed up in a few paragraphs… refer to
Chapter 10 “Advanced Acoustic Telemetry Option” for a description of the technique and
instructions on how to use it.
After the IES is on the bottom, perform the following test to determine that the travel time
measurements are correct.
• Send the TELEM command to the IES.
• Verify that the IES responds with its ‘two ping’ command acknowledgment… if it
does not, send TELEM again, and again, until the correct reply is received.
• If you know the depth at the IES site, you can calculate what the telemetry time
should be. For example, if the water depth is 3000 meters, the round trip travel time
that the IES measures will be 4 seconds (assuming sound speed at 1500m/sec).
• Note the lockout time for each IES deployed. If the telemetry number is in error and
is a time close to the lockout time, it means that the IES echo detector is too sensitive
to ocean noise or the IES output power is too high. In either case, adjustments
should be made before leaving the IES at the site. Of course, telemetry values much
larger than expected, given the water depth, indicate that the echo detector is not
sensitive enough or the IES output power is too low. In either case, if additional
telemetry tests confirm a problem, the IES should be recovered and adjustments
made… see Chapter 2.3.3 and 3.6 for related topics.
Sending the CLEAR command and verifying the 2-ping acknowledgment will acoustically disable
TELEM mode. If you forget to disable the TELEM mode before leaving the deployment site, the IES will
disable the function at midnight, IES time.
CHAPTER 8 AT SEA OPERATIONS - IMPORTANT DETAILS
8- 5
8.2 RECOVERY
The IES is a small package that gets left in a big ocean. Besides the obvious tools used to relocate
and recover an IES, e.g., reliable shipboard navigation and acoustic systems, as well as diligent record
keeping, a number of relocation and recovery aids are built into the instrument. This section of the manual
outlines the use of these devices during recovery operations… refer to other sections of the manual for
descriptions of the devices. A summary of IES relocation and recovery aids:
• Acoustic Command Subsystem (ACS)
• Burn-wire release mechanism
• VHF radio beacon and xenon flasher module (RELOC Module)
• flag and reflective tape
• floating recovery line
8.2.1 Acoustic Commands
After arriving at the deployment site:
• Listen for the IES travel time measurement pings and determine the IES clock
offset… remember that the ACS responses will be blocked during travel time
measurements… so note how the clock error will affect the IES measurement
schedule and the ACS operations. Remember also that there is a short time delay
resulting from the sound propagation time through the water.
• Send the XPND command and determine the slant range to the IES… if it is much
greater than the water depth, maneuver the ship until it is suitably near the IES.
• Send the RELEASE command and verify the acceptance of the command by hearing
the six pings at 2-second intervals. The burn wire mechanism will take about 15-20
minutes to drop the anchor. If there is only a two ping response, check your records
to be sure that you are sending the correct code! Two ping responses mean that the
IES ACS is working fine but is not recognizing the command as a release
command… double check your records and the code entered into the deck box.
• Once the release command has been accepted and the burn wire release is activated,
the IES will start to ping at a 4 second rate with its maximum power output.
Monitoring the ship’s line scan recorder, you can see when the IES leaves the
bottom. The model 6.1 IES will rise at about 60-65 meters/minute (depends on the
weight of batteries), so knowing the water depth, the time of arrival at the surface
should be roughly predictable.
8.2.2 Burn-wire Release Mechanism
In the deep ocean, where the sea water temperature is about 0-5° C, the burn-wire release takes
about 15-20 minutes to drop the IES anchor… slightly faster where the water is warmer or more salty. The
IES must sense the current flowing in the burn-wire before it begins its 4-second rate, 12kHz beacon.
8- 6
INVERTED ECHO SOUNDER MODEL 6.2
8.2.3 RELOC Module
When the IES releases from the sea floor, it will invert and a tilt switch will turn ON the RELOC
module. The standard RELOC module consists of a radio beacon (156.875MHz (marine band, channel 77)
– 1 second long pulses, 3 seconds apart) and a xenon flasher (1 million candlepower - about 1 second flash
rate) with a light sensitive switch.
An inexpensive, hand-held, radio direction finder can be obtained at:
L-Tronics, Inc.
Santa Barbara, CA, USA 93111
(tel: 805-967-4859)/, web address: www.ltronics.com/portable.htm
Model: Little L-Per VHF receiver tuned to channel 77 ~$500
A sophisticated, IES-compatible direction finder with a ship’s mast antenna can be found at:
Taiyo Inc, Japan web address: www.taiyomunsen.co.jp
Model# TDL-L1620A RDF.
8.2.4 Flag and Reflective Tape
The IES is equipped with an orange flag with reflective edges (23cm x 46cm) that stands about a
meter above the sea surface. With the IES’s reflective tape and xenon flasher, it is, in some ways, easier to
recover the IES in the dark than in daylight.
8.2.5 Floating Recovery Line
The IES has a 10 meter polypropylene line and float attached to the hard hat bridle. This line will
float on the surface and a grappling hook can be thrown across it from the recovery ship to bring the IES
alongside. The recovery line should not be used to lift the IES aboard but should be pulled taught from the
ship so that the bridle loop is exposed. A hook attached to a lifting mechanism should then be attached to
the bridle and the IES lifted aboard by the bridle. During lifting (and launching), use the recovery line as a
control line to prevent the IES from swinging and twisting.
CHAPTER 9 MAINTENANCE
9- 1
Chapter 9
MAINTENANCE
9.1 PRESSURE SENSOR
If the IES is equipped with the pressure measurement option, the plastic pressure fitting (oil
reservoir) projecting from the titanium pressure opening in the glass sphere must be cleaned and the oil
supply in the sensor plumbing must be replenished after every deployment. Following the simple
procedures detailed below can prevent marine organisms and/or silt from blocking the sensor port and sea
water reaching the internal metal parts.
WARNING: Do not remove the threaded titanium fitting (pressure port) from the glass sphere
or allow it to rotate! The sphere and the sensor plumbing must be pressure tested if the titanium fitting is
disturbed.
9.1.1 Cleaning & Filling the Pressure Port
Use a 7/16” (12mm) wrench to remove the plastic oil reservoir fitting from the pressure port; do
not remove the threaded titanium fitting or allow it to rotate (hold it with a 7/8” [23mm] wrench).
Thoroughly empty and clean the fitting and port entrance with a cotton swab to remove any sea water, silt or
marine growth. Next, refill the port entrance with oil by using a hypodermic syringe to inject Dow-Corning
fluid 350-CS into the pressure port until the fluid is in a puddle on the top of the port, level with the sphere's
surface. After adding the fluid, poke the syringe into the port to break any bubbles that may have formed
during the filling process; add more oil if necessary. Fill the oil reservoir in the plastic pressure fitting in
the same manner. Quickly flip and install the reservoir fitting into the port. Oil, without air, should ooze
from the end of the fitting tube as you tighten the fitting. Be sure that the excess oil does not seep into the
o-ring area under the titanium fitting. The reservoir fitting should be tightened by hand leaving the
reservoir tube facing away from the vacuum port. A pictorial of these operations is shown in Figure 9-1.
(Oil)
Dow Corning
350 - CS
Glass sphere
Medical
syringe
oil
reservoir
Pressure port
Pressure sensor
Fill pressure port and reservoir
with oil until a puddle forms.
Eliminate air bubbles with a
clean wire.
Figure 9-1
Install reservoir, allowing excess
oil to flow out. Repeat the process
if air bubbles are visable in reservoir
tube. Rotate reservoir fitting until
tube points away from vacuum port.
Filling the Pressure Port
9- 2
INVERTED ECHO SOUNDER MODEL 6.2
9.1.2 Pressure Sensor Calibration
A calibrated dead-weight tester should be used to verify the accuracy of the pressure sensor
between deployments. For this test, the plastic fitting on the pressure port must be removed and an
appropriate high-pressure fitting (Parker # 1M3SC2 male connect to ‘o’ring pipe thread) installed between
the pressure port and a dead-weight tester. Before performing a calibration test, be sure that the IES is
properly configured as follows:
• sealed in its glass sphere
• at a stable temperature for more than 6 hours
• is correctly oriented with the acoustic transducer facing UP
• the correct pressure and temperature offsets are installed (see Chapter 3.5)
• no air in the pressure plumbing system
• the dead-weight tester must be at the same height as the pressure sensor, or a hydrostatic
offset must be introduced
Attach the external communications cable to the IES and go to the IES Self Test Menu. Use
selection “D” to acquire pressure measurements. The IES reported pressure should indicate within 0.015%
of full scale the known pressure applied to the sensor by the dead weight tester. Apply pressures over the
full scale range, being careful not to exceed the full scale value. If the pressure data reported in the record
are in error, contact Paroscientific Inc. for information on re-calibrating the pressure sensor at the factory.
Contact information is available from their web site: www.paroscientific.com
URI-GSO does not maintain a re-calibration facility.
9.2 INSTRUMENT HOUSING
Although there is little that can render the hardhats unusable, it is a good idea to look over each of
the parts prior to a deployment. The hardhats are extremely flexible and should not crack.
It will be obvious when a glass sphere is no longer fit for deployment. However, a small amount
of chipping, or spalling, may occur around the inner edges of the hemispheres in response to high pressure
during testing or operation. This is a normal stress relieving mechanism of the glass and has only minimal
effect on its strength. In general, if the glass will hold a vacuum, it will be safe from low-pressure leaks; if
any chips along the seal do not extend more than 1/5 of the thickness of the seal, the sphere should be safe
to use to 4000 meters depth. Of course, if there are any doubts, the safest procedure is to pressure test the
sphere without the electronics.
9.3 GLASS PENETRATORS
Examine each cable connected to the glass penetrators for cracks, cuts and deterioration of the
neoprene rubber. Replace any suspicious-looking parts; the consequence of a failure of the penetrators or
attached wires is so severe, it is not worth taking any chances. It is normally not necessary to pressure test
the sphere after changing a penetrator. The integrity of the penetrator o-ring seal is easily visible from
inside the sphere.
For even greater peace-of-mind, run a high voltage megohm test on the glass penetrators in a
bucket of salt water. Insert dummy plugs into the penetrator cables. Immerse the outside of each
hemisphere (with penetrators & cables) in a tub of salt water and measure the resistance between an
electrode in the water and the penetrator terminal inside the glass. Since the penetrators on the pinger
hemisphere carry such large voltages (2500 volts), a high voltage megohmeter should be used.
At URI-GSO, we test the IES penetrators after every two deployments using a 5000Volts
megohmeter and reject any that show a resistance of <100MegOhms.
CHAPTER 9 MAINTENANCE
9- 3
9.4 RELEASE BLOCK
A detailed drawing of the "burn wire" release mechanism is shown in Appendix D.1. A diagram
of the release block assembly procedure is in Appendix D.2. It is very important that every detail of this
assembly procedure is followed precisely.
Some additional important notes on the release mechanism:
•
•
•
•
Even though the cathode wire does not get destroyed during the release activity, it is
a good idea to replace it every 2-3 deployments. Some users report that the contacts
in the cathode (female) connector relax after repeated use and reliable connection is
lost.
Be sure that there is 1/8" (3mm) of play between the end of the fiberglass pin and the
cathode wire… no more, no less. Under high pressure the release block compresses
more than the pin, so the pin could be jammed at release time if this clearance is not
maintained.
Before assembling the release block, when you have all the parts together, it is a
good idea to simulate the release activity; moving all the parts through their release
anticipated paths. This will confirm that there is no error in parts size.
USE ONLY URI-GSO PARTS - ANY SUBSTITUTION MAY RESULT IN THE
LOSS OF THE INSTRUMENT !!
9.5 Loading New Firmware
IES firmware upgrades may become desirable to improve performance, add features or to add
some custom functions for a specific project. IES firmware upgrades will be sent to you in the form of a
IESe***.APP file on a floppy disk. The *** will indicate a year, month and day, such as IESe1_ 9_11.APP
for September 11th 2001. This file will be transferred to the IES using a communications program from
your IES User’s Software Disk (Motocross.exe) as follows:
1. Run MotoCross.exe (it’s on your IES User’s Disk) and connect to the IES at 57600 baud (see
MotoCross File menu - Communications Settings to change baud rate of PC). See Chapter 2
for IES communications details.
2. RESET or power cycle the IES, press the <space> bar and proceed to the Main Menu.
3. Select ‘P’ (this is a hidden menu selection) to get to the PicoDOS mode prompt: c:\>
4. From the MotoCross Toolbar ‘Transfer’ Menu, select ‘Load CPM68K’
5. In the MotoCross window, find & select the new firmware file that was sent to you named:
‘IESe***.APP’
6. After the new firmware is in place, the transfer window will close and a “G” appears at the c:\>
prompt), press <enter> and the new IES application will start.
7. Be sure to verify that the new firmware is in place by examining the IES banner header that is
displayed immediately after RESET. The IES version date should match that in the
documentation shipped with the new firmware (same year, month and day as in the filename
IESe***.APP).
9- 4
INVERTED ECHO SOUNDER MODEL 6.2
THIS PAGE INTENTIONALLY LEFT BLANK
CHAPTER 10 ADVANCED ACOUSTIC TELEMETRY
10- 1
Chapter 10 - Advanced Acoustic Telemetry Option
(for PIES and C-PIES Hardware Configurations)
If a Benthos DS-7000 Acoustic Deck Unit with a 4-channel receiver is available (8-channel for CPIES applications), the IES Model 6.2 advanced telemetry option may be utilized. In addition to the deck
unit, the appropriate URI-GSO telemetry receiver & display programs, running on Matlab 6 release 13 (or
above) are required to implement IES advanced telemetry.
When the IES is deployed and configured for advanced telemetry there are two data reporting
protocols that can be remotely activated (acoustically, via the DS-7000 deck box): burst telemetry and file
telemetry. When the IES receives the ‘TELEM’ command, only one of the protocols will be activated,
depending on the time relative to the start of the mission, as follows. After the IES mission is started, burst
telemetry will be available until the IES has collected enough data (three full calendar days) to implement
the data processing (de-tiding) routines. After enough data have been collected to make data processing
meaningful, the IES makes file telemetry available exclusively. Both protocols use the same acoustic
technique and general format (called pulse delay telemetry - PDT) to transfer the data from the IES to the
surface. Both techniques are outlined as time lines in Figures 10-1, 2 & 3. Refer to these figures during the
following discussion.
10.1 PDT Telemetry Technique
The idea of sending information by encoding data as the delay in arrival time between two
acoustic pulses has been used for years. The method has had a number of names… it is referred to here as
pulse delay telemetry (PDT). The primary feature of PDT that makes it attractive relative to other encoding
techniques, e.g. bit, rate, FSK or spread spectrum encoding, is its very low power requirement and high
reliability. The primary drawback, relative to the other techniques mentioned, is its low speed or data
throughput.
With its adjustable resolution, PDT is inherently reliable (just slow it down until it works!) and,
when using multiple frequencies, the technique is relatively immune to multipath acoustic interference.
In the IES application, the low data-rate issue is solved by preprocessing the data in situ to
produce mean values for a 24-hour calendar day. Hence, depending on whether the application is a PIES or
C-PIES configuration, a block of data representing a full day’s measurements (year-day, tau, pressure,
current speed and heading), can be transferred from the sea floor to a surface ship, in 24 or 30 seconds
respectively.
10- 2
INVERTED ECHO SOUNDER MODEL 6.2
Note: The following text describes the telemetry protocol for C-PIES configuration (data includes tau,
pressure, current speed & heading. The protocol for PIES configuration (data includes tau & pressure
only) is essentially the same with the data records being shorter. The C-PIES records are outlined in the
figures, and the PIES records are simply truncated, i.e., the speed data are eliminated and the record frame
shortened appropriately.
10.2 IES Data Processing for File Telemetry
The data processing techniques used by the Model 6.2 during its deployment period (in situ) and
transmitted by file telemetry are nearly identical to those historically used in the laboratory at URI-GSO
after the IES is recovered. GSO has compared the products of both processing routines and found there to
be no substantial difference from routinely good data. A brief description of the steps used to process tau,
pressure and current meter data in situ follows:
10.2.1 tau data: The 24 measurements of travel time, collected every hour, are de-spiked and
sorted at the end of each hour. The values are then windowed within +/- 3 standard deviations of the
median (keeping the central 99.73%) and the 1st quartile value of that list is saved until the end of the 24
hour calendar day. At the end of the day, the 24 hourly values are again despiked, sorted, 99.73%
windowed, resorted and that median value is saved to be written to the telem.dat file at the end of the
following day… hence, this tau is centered on the previous 72 hours (time-centering chosen to be same as
for pressure).
10.2.2 pressure data: Pressure is measured 1,2, 3 or 6 times per hour depending on the
schedule selected by the user. At the end of each hour the value(s) is(are) despiked and sorted. The values
are then 99.73% windowed around the median, resorted, and that median value saved in a 72 element array
of hourly values that span three calendar days (the data from any partial day at the beginning of the
deployment are discarded). At the end of each calendar day, after the array of 72 hourly values is filled, a
Godin (25h, 25h, 24h) detiding filter is applied and the detided average pressure, centered on the previous
72 hours, is written to the telem.dat file. The 72 element array is then shifted right, removing the oldest
data and making room for the next 24 hourly pressure values.
10.2.3 current meter data: water speed data in rectangular coordinates (U,V == east & north
components) are processed individually through the same algorithms used on the pressure data as described
above. The data are detided using the same Godin (25h, 25h, 24h) filter and also centered on the previous
72 hours. U and V values are written to the on board data storage but are converted to polar coordinates
when written to the telem.dat file. For acoustic telemetry the current measurement is in speed (cm/sec) and
heading (compass angle, in degrees, increasing clockwise from North).
CHAPTER 10 ADVANCED ACOUSTIC TELEMETRY
10- 3
10.3 IES Schedule for PDT Operations
The IES wakes up from low-power sleep every 10 minutes and performs all data collection tasks
that are scheduled. An IES data collection day ends after the 23:50:00 data collection tasks are complete.
At that time all the data collected during the previous day, currently residing in temporary RAM storage,
are written to the non-volatile FLASH memory card and the previous 24 hours of travel time, pressure and
current data are processed (see IES Data Processing for File Telemetry above) and stored in the telem.dat
file along with the year-day number corresponding to the center of the preceding 72 hour period. The detiding routines require three complete and contiguous calendar days of data to be collected before any data
processing occurs. Hence, no processed data are stored in the telem.dat file until four 23:50 hour marks
have occurred.
10.4 PDT Record Framing
The time of arrival of the marker pulse (10.0 or 11.0kHz) at the receiver is recorded and the
differences between that time and the arrival times of the five following pulses (11.5, 12.0, 12.5, 10.5,
13.0kHz) are scaled to represent five data values. As depicted in the time line figures, the five pulses
representing the data values delayed from the marker must always fall within specified windows. If they
do not fall within these specified time windows the receiving software will reject them as invalid data
points. The five pulses representing data values relative to the marker pulse will never overlap in time.
The receiving software will start receiving a data record with the detection of the marker pulse (10.0kHz or
11.0kHz) and must then receive data as a sequence of pulses… 11.5kHz, then 12.0kHz and then 12.5kHz,
etc… any out-of-sequence arrivals will not be accepted by the receiving software.
10.5 PDT Receiver Data Logging
Once a receiver program is invoked, the data received will be saved in an appropriate output
file… burst.dat if converting burst telemetry data or filet.dat if converting file telemetry data. The data in
both files are composed as records. For burst telemetry each record includes the sample number, the
corresponding tau value, the pressure value and the speed & heading values. For file telemetry each record
corresponds to a line in the IES’s telem.dat file and includes the year-day, tau (acoustic travel time
measurement), pressure, speed and heading. The converting receiver software calculates the delays
between the marker pulse and each of the five following pulses and converts the delays to the appropriate
engineering units as outlined in figures 10-1, 2 & 3.
10- 4
INVERTED ECHO SOUNDER MODEL 6.2
10.6 Receiving: Burst PDT vs File PDT
As stated above, the IES utilizes two modes of PDT telemetry: burst and file. The timing and the
protocol of both telemetry modes is identical… the difference between burst and file telemetry is in the
processing and scaling of the data prior to transmission, i.e., the resolution of the data values. The
following sections describe the difference between the two data transfer modes.
10.7 Burst Telemetry Report
Burst telemetry is primarily used as a diagnostic tool to verify that the IES hardware is operating
properly after it has been deployed on the sea floor. Burst telemetry reports full data values… poor signal
resolution, but no ambiguity in the value of the measurement.
For fast evaluation of IES performance, the burst telemetry receiver software converts the travel
time and the pressure data as meters of depth. For example, if the travel time measurement schedule is 4
pings every 10 minutes, the burst telemetry (if it has been activated with the ACS ‘TELEM’ command) will
report the four travel time values, accurate to 1 meter of depth. The most recent pressure measurement will
be converted to depth in meters and the same value will be reported in all four PDT burst telemetry frames.
(If the pressure option is not enabled the pressure value reported will be zero in all four frames.)
sample#
HEADING
range: 1-25
(1 count = 80msec)
PRESSURE
MARKER
10.0kHz
TAU
range: 0 - 400
(.133 degree = 1 msec)
SPEED
range: 0 - 9 seconds
(1.5msec tau = 1msec)
range: 0 - 250cm/sec
(.0833cm/sec = 1msec)
11.5kHz
12.0kHz
12.5kHz
10.5kHz
13.0kHz
14 sec
6 sec
2 sec
3 sec
3 sec
Note: 0.25 second quiet zone between data words
PIES record frame = 24 seconds
TIME
MARKER
range: 0 - 7000000 decaPascal
(500 decaPascal = 1msec)
C-PIES record frame = 30 seconds
Figure 10-1 C-IES Burst Telemetry – Record Framing
Omit speed and heading values and make frame = 24 sec. for PIES telemetry
11.0kHz
CHAPTER 10 ADVANCED ACOUSTIC TELEMETRY
10- 5
10.8 Burst Telemetry Checklist
Assuming that the IES clock has not reached 23:50:00 hours four times since the last RESET and
that the IES has been launched and is on the sea floor… the following operation will determine if the IES
echo detector and pressure sensor is working properly… this is burst telemetry:
1.
2.
3.
4.
5.
6.
7.
Prior to the next travel time burst, use the Benthos DS-7000 acoustic deck unit to
send the appropriate ACS ‘TELEM’ command to the IES. Make sure that the DS7000 transducer extends below the keel of the ship so it is not shadowed from the
IES.
Verify that the IES replies with the standard two ping response (see IES User’s
Manual, Chapter 5).
Connect the DS-7000 AUX connector serial cable to the COM1 port of the laptop
computer. Switch the DS-7000 to ‘REMOTE’ mode.
Using the Windows Explorer program, delete the burst.dat file (if it exists) in the
c:\matlab\telemetry\data directory. Create these directories if they do not exist.
Start Matlab 6, release 13 or above. From the Matlab command window change to
the c:\matlab directory and run the PburstPDT.m program. This will initialize the
DS-7000 and the computer as a burst telemetry data receiver. Watch the DS-7000
display change as the channels are set up.
When the DS-7000 deck unit has completed initialization, the Matlab workspace
window will display “ Waiting for marker (10.0kHz)…” in the Matlab command
window. The receiving program will remain at this point until the IES has finished
its travel time measurement burst, pressure measurement and begins to transmit this
information via the burst telemetry scheme.
Observe the Matlab command window… it should step through the detection of the
four different receiver frequencies, 10.0, 11.5, 12.0, 12.5, 10.5 and 13.0kHz and loop
to the next record frame… again waiting for a 10.0kHz marker pulse.
10- 6
INVERTED ECHO SOUNDER MODEL 6.2
8.
The received data will be converted to year-day, travel time and pressure and saved
in the c:\matlab\telemetry\data\burst.dat file. The data will also be converted to
depth and reported in the Matlab command window. Evaluate the data received, i.e.,
is the proper depth reported? The program converts the incoming data to sample#,
depth from travel time, depth from pressure and saves the raw travel times and
pressure data in a file. If the data look good, given the known water depth, send the
‘CLEAR’ command with the DS-7000. You can now leave the site confident that
the IES is working properly. If the data are not valid, try to evaluate whether the
problem is in the acoustic link (DS-7000 gain adjustment?… receiver hydrophone
depth?… ship noise?) or if the IES itself is malfunctioning and collecting faulty data.
If the former, make the adjustments and return to step 1 of this operation. If the
problem is with the IES, wait for another burst telemetry and confirm the analysis
before deciding to recover the IES for repairs. The ship itself can be a target for the
IES echo detector, so small errors in travel time on the scale of the ship’s draft
should be ignored. Also, the reported depth from pressure will usually be in error by
~ 10-40 meters until the pressure sensor equilibrates with the bottom temperature
(requires ~20 hours).
9. If you experience false marker pulses or other acoustic signals at inappropriate times
you should reduce the gain of the DS-7000 deck unit. To adjust the gain of all six
channels of the DS-7000, edit the BurstPDT.m script file and change the variable
“gain”… one place, at the top of the file. The default at this date (2/11/03) is “gain =
3” for all six channels.
10. Change the name of the burst.dat file to include the PIES serial number and move it
to an appropriately named archive directory.
CHAPTER 10 ADVANCED ACOUSTIC TELEMETRY
10- 7
10.9 File Telemetry
File telemetry is used to transfer processed, scientifically significant data… data collected in lieu
of recovering the IES to access the data. The data transfer process involves two different protocols; MSB
and LSB. The MSB (most significant bits) record, similar to the burst telemetry record, reports the full data
values. The resolution in MSB record values is not high enough to show scientifically significant
variability but will eliminate any ambiguity in the accompanying high resolution (LSB) records.
File telemetry LSB records report the least significant bits of the daily mean values of travel time
(modulo 0.5seconds), pressure (modulo 2000 decaPascals = 2 meters) and water speed (modulo
40cm/sec)… that is where the signals of interest are embedded. A single MSB record will be sent at the
start of each file telemetry data block of 27 days to remove the ambiguity due to the modulo operator
rollover.
To summarize, file telemetry LSB records provide optimized signal resolution, but the user must
use the MSB record information to provide (add) the most significant bits for overall accuracy. The
following discussion outlines the process.
File telemetry will transmit all of the data stored in the IES’s telem.dat file starting at the end
(most recent data) of the file and proceeding backwards in time. A data block transfer will start with an
MSB and an LSB transmission of the first telem.dat record and continue with only LSB transmissions of
the next 26 records (28 transmissions x 30seconds = 14 minutes) and then stop for one minute. This
pause allows time for the shipboard personnel to evaluate the data transfer and, if necessary, send the
CLEAR command to stop the data transmission… allowing time for adjustments to be made, e.g., change
the receiver gain settings, adjust the depth of the receiver transducer or move back to the deployment site.
After the 1-minute pause and before sending the next 27 records, the IES will check to see if the TELEM
command has been disabled by the CLEAR command. If the TELEM command is still active, file
telemetry will continue where it left off… repeating the MSB record first and the one-minute pause every
27 records until the entire telem.dat file is transmitted.
The IES will synchronize the beginning of each data block transmission with the start of the next
minute of its clock… this starts a new data block every 15 minutes (re: from the start of the first data block)
for CPIES configuration.
NOTE: Telemetry for the corresponding PIES configuration proceeds the same way except takes less time:
A 34 day block of data gets transmitted in [ 34(LSB) + 1(MSB)] x 24 secs = 14 minutes and, after the 1
minute pause, synchronizes with the 15th minute.
10- 8
INVERTED ECHO SOUNDER MODEL 6.2
File Telemetry (cont’d)
If the entire telem.dat file has been transmitted, the acoustic command system is reset which clears
the telemetry flag and the job is finished. Once the TELEM command has been CLEARed (by finishing
the job or by a received CLEAR command), the IES will return to its data acquisition schedule. Any
measurement bursts that would have been scheduled during the file telemetry operation do not take place
and their travel time and pressure data values will be zero. [Note: For subsequent in situ data processing,
the IES discards these zero values.]
The IES’s daily data processing session, which updates the telem.dat file, occurs after the day’s
last data acquisition tasks are complete, i.e., after 23:50:00. The file telemetry session must not interfere
with this essential function, so the file telemetry process is locked out after any data block is finished after
23:30:00, i.e., the telemetry is locked out for 15 to 30 minutes prior to 00:00:00. In other words, if a file
telemetry session is in progress and the 1 minute pause occurs between 23:30:00 and 00:00:00, the
telemetry session will not resume after the pause. However, the file pointer will be saved and if the
TELEM command is re-sent after the 00:00:00 tasks are complete, the file data telemetry will continue
from the saved point in the telem.dat file.
If the TELEM command is disabled with the CLEAR command, the file pointer will be saved for
24 hours (re: the start of the telemetry session). If the TELEM command is re-sent within this 24 hour
period, the data transfer will continue from where it left off, otherwise (after 24 hours) the pointer will be
returned to the end of the telem.dat file and the most recent data will again be transmitted first. Regardless
of the position of the file pointer, the telem.dat file will remain in place with additional data being
appended each day. Since the file telemetry access is ‘last-in-first-out’, if you return months later, you
only have to collect the data accumulated since the most recent telemetry collection.
The telem.dat file is created when the system initially starts its mission. At that time two records
are written to the file; a time stamp record and a "telemetry file empty" record which has the same format
as a data record but the values are: year-day=375, tau=0 and pressure=0. Since the telemetry file is read
backwards, this record will flag the end of the telemetry file data. With this file it is easy to see the end of
the telemetry session when the data are being plotted as they are received.
CHAPTER 10 ADVANCED ACOUSTIC TELEMETRY
10- 9
File Telemetry (cont’d)
HEADING
year-day#
range: 1-400
(1 count = 5msec)
PRESSURE
MARKER
10.0kHz
TAU
range: 0 - 400
(.133 degree = 1 msec)
SPEED
MARKER
range: 0 - 7000000 decaPascal
(500 decaPascal = 1msec)
range: 0 - 9 seconds
(1.5msec tau = 1msec)
range: 0 - 250cm/sec
(.0833cm/sec = 1msec)
11.5kHz
12.0kHz
12.5kHz
10.5kHz
13.0kHz
14 sec
6 sec
2 sec
3 sec
3 sec
11.0kHz
Note: 0.25 second quiet zone between data words
PIES record frame = 24 seconds
TIME
C-PIES record frame = 30 seconds
Figure 10-2 C-PIES File Telemetry – MSB Record Framing
(Omit speed & heading values and make record frame = 24 secs. for PIES telemetry)
year-day#
PRESSURE
MARKER
11.0kHz
TAU
HEADING
range: 1-400
(1 count = 5msec)
range: 0 - 400
(.133 degree = 1 msec)
SPEED
MARKER
modulo 2000 decaPascal
range: 0 - 2000 decaPascal
(0.1428 decaPascal = 1msec)
modulo .500 sec
range: 0 - 500 msec
(.0833msec tau = 1msec)
11.5kHz
12.0kHz
12.5kHz
10.5kHz
13.0kHz
14 sec
6 sec
2 sec
3 sec
3 sec
range: 0 - 40cm/sec
(.0133cm/sec = 1msec)
Note: 0.25 second quiet zone between data words
11.0kHz
PIES record frame = 24 seconds
TIME
C-PIES record frame = 30 seconds
Figure 10-3 C-PIES File Telemetry – LSB Record Framing
(Omit speed & heading values and make record frame = 24 secs. for PIES telemetry)
Figure Notes:
All values will be plotted individually in Matlab graphics windows as the FilePDT program runs.
The horizontal axis will be the number of marker pulses that have been received. Any missing data will
leave a gap in the respective plot… missing markers cause loss of one day’s values for all variables, but the
plot continues to the next day’s values without a gap.
10- 10
INVERTED ECHO SOUNDER MODEL 6.2
10.11 File Telemetry Checklist
Assuming that the IES clock has registered 4 midnights (23:50:00 = end of data collection day)
since the last RESET and that the IES has been launched and is on the sea floor. The following operation
will collect the daily mean values of travel time and pressure from the IES telemetry data file… this is file
telemetry:
1.
Prior to the next travel time burst, use the Benthos DS-7000 acoustic deck unit to send the
appropriate ACS ‘TELEM’ command to the IES.
2. Verify that the IES replies with the standard two ping response (see IES User’s Manual,
Chapter 5.
3. Connect the DS-7000 serial cable to the COM1 port of the receiver laptop computer. Switch
the DS-7000 to ‘REMOTE’ mode.
4. Using the Windows Explorer program, delete the Cfile.dat or Pfile.dat data files (if they exist)
in c:\matlab\telemetry\data.
5. Start Matlab 6, release 13 or above. From the c:\matlab\telemetry directory run the
CFilePDT.m or PFilePDT.m program. This will initialize the DS-7000 and the computer as
a telemetry file data receiver. Watch the DS-7000 display change as the channels are set up.
6. When the DS-7000 deck unit has completed initialization, the program display will have
stopped at the “Waiting for marker (10.0 or 11.0kHz)…” line. The receiving program will
remain at this point until the IES has finished its travel time measurement burst, pressure
measurement (if scheduled) and begins to transmit the data in the IES telem.dat file.
7. Observe the Matlab command window… it should step through the detection of the six
different receiver frequencies, 11.0, 11.5, 12.0 and 12.5kHz and loop to the next record
frame… again waiting for a 11.0kHz marker pulse.
8. The received data will be plotted in a Matlab graphics window. Evaluate the data received,
i.e., is the waveform smooth?… are the data changing appropriately? This program converts
the incoming data to year-day count, travel time in seconds (modulo 0.500), pressure in 10Pa
(modulo 2000) and saves the raw timing results in file c:\matlab\telemetry\data\Cfile.dat.
(or PFile.dat for PIES)
9. If the data look reasonable, let the receiver program run until the entire IES telem.dat file is
transmitted. If the data do NOT look good, wait for the one minute pause in the telemetry
transmission (every 15 minutes, or 27 records (34 for PIES)) and send the ‘CLEAR’
command with the DS-7000 to halt the telemetry transmission. Evaluate potential problems
(DS-7000 gain adjustment?… receiver hydrophone depth?… ship noise?), make the
adjustments and return to step 1 of this operation.
10. To adjust the gain of all six channels of the DS-7000, edit the CFilePDT.m script file and
change the variable “gain”… one place, at the top of the file. The default at this date
(2/11/03) is “gain = 3” for all six channels.
11. Change the names of the Pfile.dat or Cfile.dat files to include the PIES serial number and
move them to an appropriately named directory.
CHAPTER 10 ADVANCED ACOUSTIC TELEMETRY
10- 11
Additional Telemetry Operations Notes
10.11.1 Telemetry Session Interrupt – Saving the File Pointer
It may become necessary to interrupt a file telemetry session before all of the desired data have
been received. This may occur because the ship has drifted too far from the site for reliable reception, the
acoustic receiver needs adjusting or weather related issues dictate a pause in telemetry operations. In any
case, a provision has been implemented to pause a telemetry session, save (for 24 hours only) the position
in the data file and restart the transmission from the saved position. This works as follows:
1. Once file telemetry has been initiated the data transfer will pause periodically as outlined in
previous sections to allow the operator to stop the transmissions (send the CLEAR command). If
the telemetry session is stopped, the file pointer will be saved for 24 hours from the start of the
initial transmission.
2. If the TELEM command is re-sent within the 24 hour period, the data transfer will continue from
the saved file position.
3. If the entire data file is transmitted, the file pointer will be reset to the end of the file and the 24
hour timer will be cleared. The next TELEM command will initiate a new session.
4. If a session is paused multiple times, file pointers will be saved only during the 24 hours from
start of the session. After 24 hours, any subsequent TELEM command will initiate a new session
with the file pointer at the latest data. In other words, the 24 hour timer does not get restarted
with each TELEM command.
10.11.2 Telemetry Session Interrupt – Pause @ 2330 hours (for 15-30 minutes)
This feature is outlined in a section above.
10- 12
INVERTED ECHO SOUNDER MODEL 6.2
10.11.3 Telemetry After Failed Release
In standard operations, acoustic telemetry file data transfers will occur middeployment… typically there will not be a telemetry session immediately prior to recovering the
instrument. However, a provision has been added to insure that, in the unlikely case that the IES does not
leave the sea floor after the release command has been sent, the data can be recovered even if the
instrument is not.
Instrument programmed (firmware) prior to March 2004:
After the IES release command has been sent and acknowledged, the instrument initiates a 4second acoustic tracking beacon that, for IESs programmed prior to March 2004, continues until the IES is
turned OFF or RESET. The IES enters a low power state and can no longer accept acoustic commands.
Telemetry is not possible.
Instruments programmed (firmware) after March 2004 follow these steps:
1. After a RELEASE command has been acknowledged and the burn-wire anchor release mechanism
has been activated, the 4-second beacon will continue until the end of the third full hour (re the
IES clock).
2. At the beginning of the fourth hour the 4-second beacon will cease and the IES’s acoustic
command subsystem (ACS) will be reset, enabling it to accept further commands. The burn-wire
anchor release mechanism will NOT be reset and will continue its attempt to release the IES from
its anchor.
3. The IES will wake up every ten minutes and if it detects that the ACS has received a TELEM
command it will start a file telemetry session as outlined in previous sections.
4. If file telemetry continues until the entire data file is transferred, the IES will restart the 4-second
beacon, enter a low power state and NOT accept any further ACS commands. The 4-second
beacon will continue until the batteries are exhausted.
5. If, when the IES wakes up, it detects a RELEASE command, it will restart the 4-second beacon,
reset the three hour timer and loop back to step 1 above.
CHAPTER 11 Acoustic Tracking & Telemetry – At Sea Operations
Chapter 11
11- 1
Acoustic Tracking & Telemetry – At Sea Operations
11.1 Telemetry Cruise Preparations
This chapter is divided into three parts in the form of task lists that should be
performed:
1. Prior to the cruise – as part of cruise preparations
2. Just prior to arriving at the IES deployment site
3. At the start and during the telemetry operations
11.1.1 Hardware & Software Requirements (part of cruise preparations)
The following hardware is recommended to conduct IES acoustic tracking & telemetry operations:
Benthos DS-7000 Acoustic Transceiver configured for eight receiver channels and
programmed to transmit URI-GSO command codes (special order from Benthos).
Appropriate cable/connector to interface with the DS-7000 Auxiliary Port RS-232
communication output.
Data Tap Module (B&B Electronics Model No. 9PCDT) with appropriate RS232 cables as
shown in Figure 11-1.
Two computers: one for direct RS-232 communications with the DS-7000 and one for eavesdropping on these communications to monitor incoming signal strength.
NOTE: We set up the second laptop for double duty: TRAX4 display and telemetry noise
monitoring. However, this creates a problem; the TRAX4 must operate in MS-DOS mode, so
for greatest convenience, you need to find an RS-232 terminal emulation program (like
PROCOMM ) that will also run in MS-DOS mode.
The following software is recommended to conduct IES acoustic tracking & telemetry operations:
Note: The Matlab elements (**.m files) on this list are available from URI-GSO without charge.
Matlab Version 7.01 version 13 or higher (available from MathWorks. Inc.)
DS-7000 telemetry setup, receive and data logger:
o PPDTb.m – Receiver/logger for PIES burst & file telemetry
o CPDTb.m – Receiver/logger for C-PIES burst & file telemetry
o PPlotPDT.m – Data display for PIES file telemetry
o CPlotPDT.m – Data display for C-PIES file telemetry
o TelemPlot.m - Subroutine for both of the display programs
o Telem_plot.m – Additional subroutine used by TelemPlot
o RenamePDT.m and DeletePDT.m – Data file management utilities
o cf.m – DS-7000 configuration utility (closes any open ports & files for restart)
o RS-232 terminal emulator (Hyperterminal, Procomm, etc.)
DS-7000 acoustic tracking:
o TraxSet.m – Sets up the DS-7000 for acoustic tracking mode
o TRAX4 Software Package – Available from Chaplin Marine Instruments
(www.cmari.com).
o DS-7000 AUX port adapter (available at cmari.com)
o TRAX4 converter module (available at cmari.com)
11- 2
INVERTED ECHO SOUNDER MODEL 6.2
11.1.2 Shipboard Equipment Setup (part of cruise preparations)
1. Assuming an MS-Windows platform, create your project and data folders. For example, if you name
your project NEGoMex2005, you would create the folders: c:\NEGoMex2005\telemetry\data
2. Copy all of the Matlab *.m files listed above into the folder …\telemetry
3. In Matlab701/toolbox/local, edit startup.m so Matlab.exe will go to your project path when it is started:
for our example project (NEGoMex2005), you would add the following to startup.m)
cd \
cd NEGoMex2005\telemetry\
4. With the Matlab editor, go to the bottom of the receiver files (PPDTb.m & CPDTb.m) and change the
project name in the paths of the various data destinations.
5. Depending on the depth of the work area, change the default GAIN value (see the top of the receiver
files). Use the following rule of thumb:
GAIN
1-2
2-3
3-4
4-5
DEPTH
1-2 km
2-3 km
3-4 km
>4 km
Note: This is just the default GAIN… it can be changed at startup and during operations.
6. With the Matlab editor, go to the display files (PPlotPDT.m & CPlotPDT.m) and change the project
name in the path of the data source. Note: Both of these programs use TelemPlot.m and Telem_plot.m
which do not require any data path modifications.
7. With the Matlab editor, go to the telemetry utilities RenamePDT.m and DeletePDT.m and change the
project name in the paths to your data folder sources and destinations.
8. Set up your hardware as shown in Figure 11-1.
CHAPTER 11 Acoustic Tracking & Telemetry – At Sea Operations
Figure 11-1 IES Acoustic Tracking & Telemetry Hardware Setup
11- 3
11- 4
INVERTED ECHO SOUNDER MODEL 6.2
11.2 Preparations Prior to Individual Sites
Note: The following operational procedures assume that you are using the Benthos DS-7000
over-the-side acoustic transducer to communicate with the IES. This means that you are not able to move
the ship while the transducer is in the water. If you are using the ship’s hull-mounted transducer and can
move during IES operations, you can ignore the instructions dealing with ship’s drift and just keep the ship
positioned at the site (providing the ship’s propulsion system is not too noisy).
URI-GSO has developed a form to log a telemetry session… see section 11.2.1. Make a copy of
this form for each site to be visited. After you fill out the top portion of the form (prior to arrival at the
site) you will know how much time the telemetry operation will require. It is important to know this
information if you plan on drifting during the data transfer… you may have to make multiple passes if the
telemetry file is very big or the drift rate is high enough to push you out of range (>1.5 mile) before the
process is complete.
1. Put the DS-7000 in REMOTE mode and run Traxset.m to set up the DS-7000 for 12.00kHz listening on
channel 1 (all other channels will be OFF). The output power will be set to maximum (7) and the GAIN of
channel 1 will be set to maximum (8)… these are default values and should be changed to suit the
conditions (see below).
2. After arriving at the IES site, make sure the ship’s propellers are stopped and lower the DS-7000
transducer to a depth that is below the ship’s keel. Monitor the ship’s drift speed and direction during the
following operations.
3. Confirm that the instrument is, in fact, still there by:
Listen for the IES sample and note the time of the 1st ping of a burst. This will indicate the drift of the
IES clock and hence, tell you when telemetry transmissions will start & pause.
Send the CLEAR command and listen for the 2-ping response. This confirms that the IES acoustic
command system (ACS) is working properly.
Note: If you have problems with the IES accepting commands, especially in shallow (<2km) water, lower
the output power. To change the DS-7000 output power, press the MODE SELECT button until you get to
SETUP mode. Then press MISC (the ^ arrow) and you will arrive at a menu that will allow you to change
the output power. (Note: The DS-7000 gain steps are not in dB but in some Benthos scale???) (Important
note: The internal battery of the Benthos DS-7000 must be disconnected for this to work… if the battery is
connected the output power is always max… a bug in the DS-7000 design!). Usually lower output power
(1-3) and moderate gain (4-5) work best.
4. Let the ship drift until you have a clear idea of the effects of wind and current. Once you know this
information, you can determine if you can collect all the data in one pass or will require multiple passes.
Move the ship to a position that will allow maximum exposure time over the IES site during the telemetry
transfer. For best results, keep the ship within 1.5 miles horizontal of the target site.
11.2.1 Telemetry Log Form
Print a copy of the following page for each scheduled telemetry site and fill in the appropriate
section of the form prior to arrival at the site.
CHAPTER 11 Acoustic Tracking & Telemetry – At Sea Operations
11- 5
Inverted Echo Sounder - Model 6.2A Telemetry Log
Fill out this section prior to site:
Project/Site_____________________________
IES S/N
____________
Year-day # ___________
Operator:___________
Date: _______________
Warning: no telemetry between 23:30 - 00:00 GMT = = ___:30 – ___:00 LOCAL
PIES Firmware rev: ___________
cPIES Firmware rev:___________
TELEM cmd: __________
RELEASE cmd: _________
Deployed (yr-day) _____
Total # of records [(yr-day)-(deploy-day)-3] =_________
Site depth __________m
Tau = ___________sec.
Yr-day range: _____________
Telemetry duration: PIES: (#records)/34 x 15 minutes = __________min.
cPIES: (#records)/27 x 15 minutes = __________min.
Arrive at site @ _______________ GMT
1st ping @ ______________________ GMT
CLEAR cmd: 2-ping reply? _____ y/n
Drift: _________ Heading: ___________
Position re site: start ____________________
finish ____________________
TELEM cmd sent @ ____________ GMT
ACS replies @ _________ kHz
Start telemetry @ _____________ GMT
DS-7000 GAIN (Matlab setting) ______
Conditions/modifications during transmission:
CLEAR cmd required? ___ y/n (required ONLY if entire telemetry file was NOT
transmitted)
Routine IES tau sampling resumed @ 1st ping _________________ GMT
Simultaneous CTD? _____ y/n
CTD data file name _____________
Tau rollovers? (y/n) ___ Data quality ________
Press rollovers?(y/n) ___ Data quality ________
C-PIES only => Speed Data Quality _________
NOTES:
11- 6
INVERTED ECHO SOUNDER MODEL 6.2
11.3 Starting and Maintaining a Telemetry Session
1. Two Matlab sessions, running simultaneously on a single computer, are required; one to receive and log
the data and the other to plot the data. Start the receiver program first. The plotter program can be started
at any time… it will plot whatever is in available in the data file.
2. At times, if a data value is missing or does not make any sense, the plotting program will stop and return
to the Matlab prompt. If this happens, simply restart the display program (PPlotPDT or CPlotPDT). No
data will be lost, however, a gap may appear in the plot. Note: The horizontal index number that appears
on the plot is an indication of the number of valid data frames that the receiver has detected… it is not an
accurate indication of the number of frames that have been transmitted by the IES or when the transmission
pauses will occur. The best indication of when pauses will occur is to note the year-day number at the start
of the transmission and monitor the yr-day number progression… CPIES will pause every 27 days and
PIES will pause every 34 days.
3. If you get lots of MSB markers, that’s a sure sign that the gain is too high. Simply enter <ctrl+c> to
stop the program then run cf.m to close the comm port. Restart the receiver program and enter a lower gain
value.
4. On the noise indicator laptop, the ideal gain settings will show 3-4 returns for every data ping. More
than that; reduce the gain… less than that; monitor for missed pings. Use the lowest gain possible to
minimize false signals. Hint: A gain of 2-3 will work at a range of 1.5 mile at 3km depths in calm seas.
5. Be aware of the acoustic influences on your transducer, e.g., depth sounders, altimeters, bow thrusters,
ship-positioning systems, water hoses running over the side, dolphins, air bubbles from wherever, etc. Use
the noise monitor computer display to detect & minimize these noise sources. For example: We found
during KESS 2005 on the R/V Revelle, while using the ship’s transducer, air bubbles from the props would
block acoustic signals when the ship was backing down.
CHAPTER 12 Aanderaa Acoustic Doppler Current Sensor Option
12- 1
Chapter 12 Aanderaa Acoustic Doppler Current Sensor Option
The IES Model 6.2 can be configured to measure horizontal current velocity (i.e., speed and
direction) at a single point up to 50 meters above the sea floor. This feature has been developed and fieldtested to 6000-meter depth.
12.1 General Description
An Aanderaa Model 3820R Doppler Current Sensor (DCS) can be added to the IES Model 6.2 as
shown in Figure 12-1. This sensor head is the same device used in Aanderaa’s Model RCM11 Current
Meter. For this application, it has been modified for remote control and data storage.
floating recovery line
10 meters
17" glass flotation
sphere
5 meters
Aanderaa Doppler current
sensor, model 3820R
p/n 0973820R
deep water stud
p/n 0973886
50 meter x 8mm cable
p/n 0973883E
50 meters
URI-GSO
Inverted Echo Sounder
(pressure sensor option)
1 meter
Figure 12-1
expendable
anchor plates + platform
IES with Doppler Current Sensor (DCS) – Deployed View
12- 2
INVERTED ECHO SOUNDER MODEL 6.2
General Description (continued)
An auxiliary RS-232 communications port, standard on the Model 6.2 circuit board, provides an
interface with any sensor that conforms to ‘smart sensor’ communications protocols… in this case, the
Aanderaa DCS. Power to the DCS is provided by the IES battery pack and switched via the auxiliary COM
port, through a glass sphere bulkhead connector, to the 50-meter cable. Current measurements are
synchronized with the IES’s travel time and pressure measurements and all scheduled by the IES real time
clock. DCS data are stored on the IES flash memory card in a format compatible with the IES travel time
and pressure measurements.
The Aanderaa model 3820R provides velocity, heading, tilt and temperature sensors. The device,
once switched ON by the IES, controls its own sampling ensemble. Data are output in engineering units
(cm/sec, degrees heading, etc.) after a number of measurements are averaged. Further DCS details can be
found in Aanderaa’s “Operating Manual - Doppler Current Sensor 3900R”.
12.2 Doppler Current Sensor Specifications
Current Speed: (from vector averaged velocity)
Range:
0 – 300 cm/s
Resolution:
0.03 cm/s
Accuracy:
Absolute:
±0.15 cm/s
Relative:
±1% of reading
Statistical precision:
0.5 cm/s (standard deviation)
Current Direction: (vector averaged)
Range:
0-360°° magnetic
Resolution:
0.35°°
Accuracy:
±5°° for 0-15°° tilt
±7.5°° for 15-35°° tilt
Temperature:
Range:
Accuracy:
Resolution:
-10 to +43°°C
±0.08°°C
0.01°°C
Tilt:
Accuracy:
±1.5°°
Compass:
Accuracy:
±3°°
RS-232 output signal:
4800, 8, N, 2
Acoustic Frequency:
2MHz
Acoustic Power:
25W in 1ms pulses
Beam Angle:
±1°° (main lobe)
CHAPTER 12 Aanderaa Acoustic Doppler Current Sensor Option
12- 3
12.3 DCS Setup Menu
The DCS can be configured, scheduled and tested via the IES User’s Menu interface. When the
DCS option is installed in the Model 6.2 IES, an additional setup menu will become available from the
general mission setup menu… see selection ‘K’ in Figure 12-2.
Figure 12-2 C-PIES Mission Setup Menu - Note Options List, Selection ‘K’
Selecting ‘K’ on the IES Mission Setup Menu brings you to the DCS Setup Menu.
Figure 12-3 C-PIES DCS Setup Menu
The DCS Sensor Setup Menu allows the user to:
Schedule current measurements, offering the same options as the pressure sensor
measurements, i.e., every 10, 20, 30 or 60 minutes. The schedules for pressure and
current can differ. The DCS measurements can also be disabled.
Modify the DCS measurement parameters. The IES transfers a set of operating
parameters from a configuration file (A*.cfg), stored on the IES flash card, to the nonvolatile memory of the DCS. This file is composed at URI-GSO and should not be
modified by the user without contacting an applications engineer. Warning: There are
many configuration options listed in the Aanderaa DCS 3900R Operating Manual that
are NOT compatible with the IES application.
View/Confirm the DCS measurement parameters. The DCS measurement parameters
stored in the sensor are retrieved and displayed.
12- 4
INVERTED ECHO SOUNDER MODEL 6.2
12.4 The DCS Configuration File
As of this date (July 2005) the DCS configuration file for IES Model 6.2 C-PIES is named A3.cfg and
reads as follows:
Set_Property_Averagebase(300)
Set_Property_Current_Type(Rectangular)
Set_Property_Compensation_Compass(On)
Set_Property_Compensation_Tilt(On)
Set_Property_Compensation_Upstream(On)
Set_Property_Output_Comprehensive()
Set_Property_Output_Format(Engineering)
Set_Property_Output_Polled(Off)
Set_Property_Pingrate(1200)
The above Set commands, unless otherwise noted, stores data to the DCS flash memory. The
flash memory cannot be overwritten more than 10000 times, hence, these commands are only used during
setup and are not used during data logging operations.
A brief description of each command follows. For a comprehensive description of these and
additional commands refer to the Aanderaa Operating Manual for the Doppler Current Sensor 3900R.
12.4.1 Set_Property_Averagebase(300) Set the number of pings that will serve as the base for a
current speed and direction measurement. The Averagebase can vary between 1 and 300 ping sets. One
ping set consists of two pings. The Averagebase will also affect the interval between each output in nonpolled mode.
12.4.2 Set_Property_Current_Type(Rectangular) Sets whether the output is reported in polar
coordinates (speed/direction) or rectangular coordinates (north/east) format.
12.4.3 Set_Property_Compensation_Compass(On) Sets whether the estimated current should be
compensated for compass readings or not. “On” implies that currents are reported in coordinates relative to
magnetic North.
12.4.4 Set_Property_Compensation_Tilt(On) Sets whether the estimated current should be
compensated for tilt readings or not. “On” implies that the true horizontal components of current are
calculated.
12.5.5 Set_Property_Compensation_Upstream(On) Sets whether the DCS should sense and
compensate for upstream currents (i.e.,the DCS will ping toward the current flow). If this property is OFF,
the DCS will ping its transducers in a predetermined pattern (TR1 -> TR2 -> TR3 -> TR4 -> TR1, etc.)
CHAPTER 12 Aanderaa Acoustic Doppler Current Sensor Option
12- 5
12.6 The DCS Configuration File (cont’d)
12.6.6 Set_Property_Output_Comprehensive() The output will include the following when the DCS
has this property set:
Current speed and direction
Water temperature
Signal strength
Compass
Tilt
Ping count
12.6.7 Set_Property_Output_Format(Engineering) Specifies the output converted to engineering
units, e.g., cm/sec as opposed to raw data values.
12.6.8 Set_Property_Output_Polled(Off) Sets whether the DCS results must be polled (requested) or
automatically output when available. In non-polled mode, the DCS will collect as many pings as the
averagebase is set to. When the ping sets are collected, the DCS will calculate and output the current
values. While calculating and outputting the result, the DCS will halt the ping generator. This means the
DCS will halt for about 1 second each time it outputs data.
12.6.9 Set_Property_Pingrate(1200) Sets the ping rate in pings/minute. If Pingrate = 0, the ping is
manual, i.e., must use the Do_Ping() command. The ping rate can be between 4 and 1200 pings per
minute. The ping rate has a resolution of 250useconds. The current drain on the battery is a function of
ping rate as follows:
Current drain = 5mA x ping rate, (pings/sec)
Thus, for pingrate = 1200 the battery drain during current measurements = 5 x 1200/60 = 100 mAmperes
Repeat Warning: The above commands should not be modified without consulting an instrumentation
development engineer at the University of Rhode Island – Graduate School of Oceanography
Tel: 401-874-6505.
12- 6
INVERTED ECHO SOUNDER MODEL 6.2
12.5 DCS Testing With the IES
When the DCS option is installed in the Model 6.1E IES, an additional test selection will be added
to the general self-test menu… see selection ‘E’ in Figure 12-4.
Figure 12-4 C-PIES Self Test Menu - Note Selection ‘E’
Selecting ‘E’ on the Self Test Menu will initiate a single DCS measurement. This takes about 40
seconds and the data record will be displayed in the following format (when the DCS is configured as
outlined in the previous section):
12.6 DCS data record:
<LF>yr/mo/da<space>hr:min:sec<TAB>s/n<TAB>val1<TAB>val2……<TAB>val8
field key:
s/n
val1
val2
val3
val4
val5
val6
val7
val8
DCS serial number
current speed, North component, cm/sec
current speed, East component, cm/sec
water temperature, °C
signal strength, in dB re 1023 (val = 20*log10(raw value/1023))
compass direction, degrees magnetic (0 when x-axis north)
tilt North, degrees (tilt toward the north)
tilt East, degrees (tilt toward the east)
ping count, 0-300 (number of ping sets used in one average)
Notes: All data values are in ASCII text. Each record is written on a single line with a time stamp as shown.
12.7 DCS error record: This is the only error message available and indicates a missing or short data
record. It usually indicates that there is no response from the DCS sensor.
<LF>yr/mo/da<space>hr:min:sec<space>********** NO DCS DATA AVAILABLE **********
The test described above will indicate the general functionality of the DCS but does not indicate
the proper operation of the Doppler flow sensor electronics unless the sensor is in a calibrated flow tank or
has a test unit attached. A DCS testing device is available from Aanderaa Instruments. Test Unit 3731
clamps over the sensor head and simulates current speed and direction. See Anderaa’s web site
http://www.aanderaa.com and datasheet #D320 for further details regarding this test device.
CHAPTER 12 Aanderaa Acoustic Doppler Current Sensor Option
12- 7
12.8 C-PIES Energy Budget – Battery Requirements
With the ping rate at 1200 and the IES measuring current every 10 minutes, the DCS adds 6.0 mA
to the average current drain from the IES 7.0Volt system battery. This is in addition to the requirements for
standard IES data acquisition.
Refer to the IES Model 6.1E User’s Manual, Chapter 3.3 for a chart that assists in the battery life
calculation. The C-PIES system battery capacity is 240 Ampere-hours… this capacity is not shown on the
chart but, since the calculations are ratio metric, you can use the 120Amp-hr scale to scale your calculation.
For example: In the example shown in Chapter 3.3, the average current drain is 3.2 mA. Adding 6.0 mA
for the DCS, the average drain becomes 9.2 mA. If we divide this in half (4.6 mA) and reinterpret the 120
Amp-hr scale to be a 240 Amp-hr scale, we see that we can get about 3 years with a 240 Amp-hr battery.
Of course you can get a full 5 years by measuring current every 20 or 30 minutes.
12.9 The C-PIES mooring assembly
As shown in Figure 1-1, the C-PIES requires a special mooring platform to avoid affecting the IES
pressure gauge sensing the tilt of the 50-meter mooring line. This is the same platform used for standard
IES deployments where the bottom current could exceed 35 cm/sec. The platform is made of uncoated
steel and weights about 65 lb (30 kg). The additional iron anchor (100 lb or 45 kg) is required to firmly
seat the IES in the mooring stand after the assembly has landed on the bottom. Both the platform and the
anchor are left behind when the C-PIES is released from the bottom. The total system weight is about 270
lb (123 kg) in air. Without the anchor/platform, the system has about 65 lb (30 kg) of buoyancy in
seawater.
12.10 Deploying the C-PIES
Attach the mooring anchor/frame to the IES as shown in Photo 12-1. The C-PIES assembly is
deployed recovery line first with the ship underway at about 1 knot. Let the recovery line, floatation
sphere, DCS sensor and connecting cable stream behind the ship, holding the anchor/frame/IES on deck,
attached to the crane. When these components are streaming behind the ship, lift the frame with a quickrelease hook as shown in Photo 12-2 (do not lift from the IES), lower the C-PIES to the water surface and
trip the quick-release hook. The mooring will fall to the seafloor at about 72 meters/min.
12.11 Post-Deployment Confirmation of DCS Operation
The standard Model 6.1E IES is equipped with an acoustic telemetry feature that allows the user to
confirm proper operation of data acquisition electronics after the system is on the seafloor. (See Model
6.1E IES User’s Manual, Chapter 8.1.4) When the DCS option is installed, there will be an additional 3ping (@ ½ sec rate) signal from the C-PIES after the standard telemetry pings if the DCS data is NOT
available, i.e., if the current meter is not responding. In other words, if you do NOT hear a three-ping
signal after the standard 2-ping telemetry signal, you can assume that the DCS is operating properly.
12.12 C-PIES Recovery
The recovery of the C-PIES assembly is identical with that of standard IES except that it will rise
from the sea floor at about 92 m/min. When lifting the C-PIES aboard the ship, the lifting line should be
hooked on the lifting line of the IES. DO NOT LIFT THE C-PIES ON BOARD USING THE DCS
SENSOR CABLE!
12- 8
INVERTED ECHO SOUNDER MODEL 6.2
Photo 12-1 Anchor/Platform Attachment to C-PIES
Photo 12-2 Lifting Point for C-PIES Deployment
Appendix A
A.1 Nautilus-style Glass Sealing Precautions
A.2 IES Schematics
A.2.1 IES-Power Conditioner
A.2.2 IES-Preamp & Output Driver
A.2.3 IES-Echo Detector
A.2.4 IES-PIC Decoder & Release Relay
A.2.5 IES-Ref. Oscillator & Dividers
A.2.6 IES-CF1 Interface
A.2.7 IES- 17” Battery Pack
A.3 IES Test Accessories Schematics
A.3.1 Echo Simulator
A.3.2 Signal Insertion Cable
A.3.3 Release Simulator
A.3.4 Battery Tester
THIS PAGE INTENTIONALLY LEFT BLANK
NAUTILUS MARINE SERVICE GmbH
Handling Procedures for VITROVEX
Glass Instrument Housings.
You have purchased a concept in deep sea
instrument housings which is completely
4. No O-rings are used. NEVER USE
different to the common metal or synthetic
GREASE or OIL as a sealing aid.
materials. After a period of familiarisation,
Surfaces must be meticulously clean.
you will highly appreciate the host of advan-
Wipe with residual free solvent
tages that glass offers for many applications.
(e.g. toluene) and do not touch again
before closing.
It is necessary to emphasise the differences
Sealing is done glass-to-glass with
in handling the glass cylinders and spheres.
outside sealing strip. Sealant strip is
mechanically stabilised with sealant
1. Glass is sensitive to impact, always handle
tape.
with best possible care. Plastic protective
covers should be installed. Using Perspex
maintains transparancy.
5. For installing and fixing instruments inside,
it is suggested that glass glues are used.
They are commercially available, they
2. Glass housings are only strong against
reliably bond metal or synthetics to glass.
PRESSURE, not tension or shear or torsion.
Do not install in instrument platforms where
We are glad to support you in special
they are subjected to such forces. Thermal
engineering questions.
shock is to be below 100°C.
Sealing Material
3. Evacuation of the housings is recommended
Sealant Strip TERROSTAT VII Iso.Butylrubber,
for three reasons:
(grey) 20x2mm (for frequent opening
and closing), or
.
settle the parts firmly.
TERROSTAT 81 Butylrubber (black),
.
avoid inside condensation,
20x2 mm (for permanent sealing)
.
avoid excess inside pressure when the
Sealant Strip 3M SCOTCHRAP 50
instrument is heated up, for instance when
50,8x0,254 mm, 30,4 m long
it is exposed to sunlight. Air would try to
seep out and then cause a leak in the seal.
Blumenthalstr. 15
Tel.: +49 (0)421 20754-0
Telefax: +49 (0)421 20754-20
28209 Bremen
Email: [email protected]
THIS PAGE INTENTIONALLY LEFT BLANK
TP37
RELEASE BATT
+14Vdc
BATTERY CONNECT
Q10
IRF5305S
D10
R134
R130
1M
D11
D12
OMIT
VN0106
D14
D15
R131
1M
R132
1K
C85
.001uF
LT1120
C83
10uF 16V
R139
1M
SMB5818
1.0
10uF 16V
OMIT
C60
0.1uF
ACS_BOOST_ENA
R116 2.2K
R74
1.0
R75
1.0
R76
TP33
BOOST
R115 330K
R117
1.0
R73
1.0
U31_5V
R170
ON/OFF
LOCAL ON
REMOTE
R144
100
0.500
R145
1M
TP35
AUX PWR
AUX_PWR_SW
AUX_PWR_ENA
ACS_BOOST_SW
R171 2.2K
R143
IRF7317
IRF7317
R148 330K
U33
1.0
TP40
COMM PWR
COMM_PWR_SW
COMM_PWR_ENA
R135
U15_5V
U39
1.0
Q12
IRF5305S
S2
U14_5V
R172 330K
ACS_BOOST_ON
10K
1.0
VCMP_5V
U26
U23:A
R133
EXT_SWITCH
R149
C86
0.1uF
MAX472CSA
TP39
SYSTEM BATT
+7Vdc
GND
R140
1M
C84
SMB5818 (6 each)
TP38
+5VREL
U31
R137
U30
RELEASE_BATT
TP41
+5VREL
R141
1.0
R138
100
1M
D18
D16
D17
R136
100
Q11
D13
0.500
R147 2.2K
IRF7317
SYSTEM_BATT
R146
100
L6 CTX20-4
R142
D7 SMB5818
D6 SMB5818
PA_POWER
1.0
U32
F
IQ/SELECT
C82
47uF 35V
MAX472CSA
REL_CURR_SENSE
C75 10uF 16V
Q8
IRL540NS
MAX1771CSA
R111
100K
DISCHARGE
C76
0.1uF
R65
1.0
C58
0.1uF
R67
1.0
R70
1.0
R66
1.0
R68
1.0
R126
1.0
R77
1.0
U23_3V
U25_3V
R157
1.0
U21_3V
U22_3V
U27_3V
U17_3V
C87
0.1uF
R155
1.0
R156
1.0
R159
1.0
R160
1.0
U32_3V
R114
1.0
R105
TP34
+3.3V
U33_3V
U35_3V
U23:C
51K
MM74HC4049M
DA8
U34_3V
R118
C77
0.1uF
1.0
U18_3V
R107
10K 1%
R110
.10
DA9
MA159ACT
+3.3V
C73
47uF 35V
C74
47uF 35V
C52
10 5W
Q7
IRL540NS
SYS_CURR_SENSE
CHARGE
PA PWR
R106
154K 1%
U24
ACS_BOOST_ON
RELEASE_ON
SPARES
MA159ACT
U23:G
U18_3V
R109
1M
U23:D
MM74HC4049M
U23:E MM74HC4049M
U23:F MM74HC4049M
WU
University of Rhode Island
Graduate School of Oceanography
THIS PAGE INTENTIONALLY LEFT BLANK
TP3
+V1
R2 100
+5VREL
+V1
C2
0.1uF
C3
10uF 16V
Vn = Vrms noise with input diodes D1/D2 shorted
TP2
+V2
R1 100
C4
0.1uF
C1
10uF 16V
R4
61.9K 1%
R5
470K
T1
C6
R6
.047uF
R8
100
MA159ACT
R14
221K 1%
R13
221K 1%
C9
OMIT
10K
MIC860
C11
0.1uF
R17
3.3K
U14_5V
U21
C65
0.1uF
1
S1
2
G1
3
S2
4
G2
PING_TRIG
U17 IRF7314
C56
.001uF
R63
2.2K
R64 100K
MA159ACT
R58
10K
R59
10K
IRF7317
IRL540NS
Q6
SMBJ51A
D4
T2
CMI-5036
C57
0.1uF
U13
C50
10uF 16V
PLB150
U16 IRF7317
RELEASE_BATT_SW
D5 SMB5818
ACS_BOOST_SW
S1
CK7101
STBY
XDUCER
TP25
+OUT
Q5
IRL540NS
XMT
PA_POWER
8
7
6
5
1
2
D3
SMBJ51A
R57 100
43pF
D1
D1
D2
D2
TP24
-OUT
D2
PA_CAP_MONITOR
C55
1
S1
2
G1
3
S2
4
G2
D1
1N4002
MIC4424BM
R72 100K
JP5
PING_BLOCK
8
D1
7
D1
6
D2
5
D2
JP0
R84
820
R60 100
C53
0.1uF
C54
50pF
PA_OUT
TP28
XMIT/LISTEN
DA5
RDD104-S
5.6K
R83 330K
U14
R71 22M
R20
C17
0.1uF
R82 2.2K
+PA_DRIVE
-PA_DRIVE
R62
2.2K
MIC860
C13
0.1uF
CF1_XMT/LISTEN
TP27
+DRIVE
DA4 MA159ACT
DA6 MA159ACT
R61
100K
100K
+V1
1200pF
C7
10uF 16V
DA7
MA159ACT
PIC_XMIT/LISTEN
U15
R21
+24dB
Vn = 2.6mV
22pF
QUIET GND
F
U15_5V
C16
75K
+V1
MIC860
TP1
TP26
-DRIVE
AMP3
1200pF
C14
R19
+V1
R12
5.6K
C10
620pF
C15
R18
5.6K
R9
470K
R10
100K
DA1
100K
TP7
R16
.001uF
L1
250mH
R11
470K
22pF
TP6
AMP2
+7dB
AMP1
+17dB
Vn = .10mV
+V1
.047uF
Triad SP-66
100
Q1
MMBT5089
MMBT5089
C5
C12
R15
C8
1K
R7
R3
240
Q2
F
TP5
TP4 Preamp
+18dB
University of Rhode Island
Graduate School of Oceanography
R104 10 5W
IES - PREAMP & OUTPUT DRIVER
C51
47,000uF 25V
D8 SMB5818
WU
THIS PAGE INTENTIONALLY LEFT BLANK
R29
+5VREL
VD1
100
R41
C22
C21
10uF 16V
R22
0.1uF
VD1
100
TP9
WB
TP8
LIMIT
C31
3000pF
C30
omit
R35
24K
L2
5.6K
.01uF
VD1
R26
10K
MIC7211
R30
C23
R24 100
75K
.01uF
omit
R37
470K
50mH
TP11
Q3
12.0_DET
FMMT491A
R38 10K
R33
100K POT
R32
221K 1%
C25
0.1uF
TP19
A/D_OUT
MIC860
4
6
VD1
12
TP12
FIXED_T
R40
165K 1%
C41
C42
180K
L4
VD1
A/D CONNECT
R45
221K 1%
omit
3
8
TP13
12.5NB
470K
TP18
include for Wave-IES only
IQ/SELECT
10
9
VD1
U9:E
50mH
14
VCC
7
GND
C46
0.1uF
VD1
TP14
Q4
12.5_DET
FMMT491A
MIC860
R49 10K
R43
470K
C39
0.1uF
C38
.033uF
MIC7211
12.5KHZ
TP21
12.5KHz
GND
TP15
TP16
C43
0.1uF
ECHO
3000pF
VD1
C37
0.1uF
11
13
1
C33
0.1uF
R42
221K 1%
8-80pF
C40
R44
100K POT
VD1
R51
TBD
12.0KHZ
5
C29
C28
0.1uF 0.1uF
R48
C26
0.1uF
MIC7211
C32
.033uF
R39
470K
MIC860
R36
221K 1%
TP20
12.0KHz
C45
0.1uF
VD1
221K 1%
R46
SYSTEM_BATT
R50
TBD
VCMP_5V
50mH
R47
221K 1%
TP17
A/D_BUFF
TP10
12.0NB
VD1
MIC860
R23 51K
221K 1%
C27
10uF 16V
C34
L3
C24
0.1uF
R31
221K 1%
R25
221K 1%
3000pF
2
VD1
R28
C35
VD1
C20
R27
8-80pF
R34
C18
0.1uF
C19
10uF 16V
PA_OUT
180K
C36
University of Rhode Island
Graduate School of Oceanography
THIS PAGE INTENTIONALLY LEFT BLANK
RN1
220K SIP
DA3
S16-4148
ACOUSTIC COMMAND
CODE SWITCHES
____ BEACON ____
JUMPER
WEIGHT
JP2: 1-4
1
JP2: 2-3
2
TP29
TELEM_2
R89
+5VREL
R54
100
3.3K
TELEM_2
R88
10K
RELEASE
DA2
R87
BEACON
3.3K
PIC_XMIT/LISTEN
R86
10K
TRANSPOND
TP22
ACS BOOST ENA
S16-4148
R53
TELEMETRY
3.3K
__ TELEMETRY __
JUMPER WEIGHT
JP4: 1-4
1
JP4: 2-3
2
____ RELEASE ____
JUMPER
WEIGHT
JP1: 1-12
1
JP1: 2-11
2
JP1: 3-10
4
JP1: 4-9
8
JP1: 5-8
16
JP1: 6-7
32
TP23
XMT/LISTEN
C49
10uF 16V
__ TRANSPOND __
JUMPER
WEIGHT
JP3: 1-4
1
JP3: 2-3
2
ACS_BOOST_ENA
R52
10K
R55
U12
1K
R150
Y1
32.768kHz
1.0 3W
RELOC
C48
68pF
PIC16C622
PING_TRIG
C44
0.1uF
TELEM_1
C47
68pF
K1
R56
RELEASE_BATT
100K
R151 240
ISO1
MOC212-M
R119
3.3K
DA12
U31_5V
RELEASE_FLAG
12.5KHZ
U25
MA159ACT
DA10
12.0KHZ
D9
RED LED
RELEASE_BATT_SW
680K
-RELEASE
1
S1
2
G1
3
S2
4
G2
MA159ACT
8
D1
7
D1
6
D2
5
D2
R112
51K
U20 IRF7317
U23:B
MM74HC4049M
RELEASE_ON
R152
+RELEASE
RELEASE_LATCH
RELEASE_UNLATCH
RESET_ACS
R81
10K
R153
10 5W
C78
0.1uF
MIC4424BM
R113
51K
DA11
University of Rhode Island
Graduate School of Oceanography
MA159ACT
DS4E-SL2-DC6V
IES - PIC DECODER & RELEASE RELAY
R108 2.2K
WU
THIS PAGE INTENTIONALLY LEFT BLANK
U32_3V
U34_3V
R158
100
U34
R164
R162
1M
PAROS CONNECT
R163
1M
DA14
MA159ACT
TP44
U35:A
U35:B
Press. PERIOD SELECT
100
PRESS_PERIOD
MM74HC393M
MM74HC393M
MM74HCT4020M
U33_3V
TP43
U35_3V
TP45
U37:A
COUNT_RESET
U37:B
U36
SYSTEM_BATT
R168
R166
1.0
330K
Temp. PERIOD SELECT
TEMP_PERIOD
R161
1M
U38
MM74HC393M
MM74HCT4020M
PAROS_ENA
R165 2.2K
MM74HC393M
IRF7317
R169
1.0
TP36
4MHZ_ENA
R177
U42
C94
.001uF
C92
0.1uF
C96
10uF 16V
LT1120A
R176
100K
U40
1.0
C89
R178
1M
R179
1M
C95
1.0uF 16V
R173
Y4
4.0 MHz
C90
100pF
C88
L7
120uH
C93
FREF_4MHZ
22pF
10K
HA7210IB
0.1uF
22pF
R174
470
University of Rhode Island
Graduate School of Oceanography
IES - REF. OSCILLATOR & DIVIDERS
WU
R100
U27_3V
BT1
3.0V
WATCHDOG TIMER = 12.5 minutes
C80
0.1uF
R128
3.3K
+
VBATT
R129
3.3K
U29
R85
100
R101
100K
REL_CURR_SENSE
10M
SYS_CURR_SENSE
U17_3V
R99
U22
10K 1%
DA13
R127
1M
S3
RESET
C79
.56uF
MAX6301CSA
+3.3V
R79
1.0
C61
0.1uF
C62
U28:A 10uF 16V
TELEM_2
R121
100K
PERSISTOR
CF1
TELEM_1
U28:E
R78
1.0
C70
1.0uF 16V
R80A
100K
MAX146ACAP
C69
0.1uF
C71
.047uF
R91 R93 R94
OMIT
<-- note quiet ground
R97
R10253.6K 1%
C68
0.1uF
(3) 100K 1%
RELEASE_LATCH
TELEM_1
PING_BLOCK
MM74HC4049M U28:F
TP32
4MHz
FREF_4MHZ
U28:B
-PA_DRIVE
U18
MM74HC4049M
U28:C
PRESS_PERIOD
+3.3V
2.2K
COMM_PWR_ENA
CDP68HC68PIM
100K
R120
R123
DISCHARGE
TEMP_PERIOD
+PA_DRIVE
COUNT_RESET
MM74HC4049M
MM74HC4049M
CHARGE
RELEASE_UNLATCH
4MHZ_ENA
U21_3V
ECHO
PA_CAP_MONITOR
RELEASE_BATT
SYSTEM_BATT
TEMPERATURE
SENSOR
R103
YSI 44032
TP30 Vref
F
C72
0.1uF
F
TP31
SPARE
909K 1%
499K 1%
499K 1%
C66
0.1uF
U28:D
RELEASE_FLAG
OMIT
R90
R92
R95
R96
WD Reset
R122A
100K
SYSTEM_BATT
10K 1%
F
MA159ACT
C81
.001uF
R98
RESET_ACS
JP6
TP42
TRIGGER
CF1_XMT/LISTEN
AUX_PWR_ENA
IQ/SELECT
PAROS_ENA
R122
IRQ5
1M
R80
U23_3V
3.3K
U22_3V
R124 OMIT
DB9F
Y3
1.8432MHz
C63 MAX3100CEE
22pF
COMM_PWR_SW
U41
U25_3V
R175
10k
AUX_PWR_SW
C59
U28:G VCC
GND
C91
1
8
0.1uF
Q9
OMIT
R125 OMIT
0.1uF
+3.3V
R154 2.2K
University of Rhode Island
Graduate School of Oceanography
IES - CF1 INTERFACE
-RELEASE
+RELEASE
DB9M
1.0
U27
PAD
C64
22pF
R167
EXT_SWITCH
EXTERNAL CABLE
WU
THIS PAGE INTENTIONALLY LEFT BLANK
13
J1:14
14
11
J1:11
+5V
R20
R38
100K
R42
100K
J1:8
8
10K
D6
R17
1.0M
11
9
8
6
U6:B
D5
U8_5V
4
U6:C
8
9
11
10
10
SET
D
CLK
RESET
1N4148
Q
U5:B
13
12
1
2
U6:A
3
5
R37
10K
CD4001
R10
47K
J1:5
J1:6
MIC+
5
C6
.001uF
R6
5K
Q3
2N3904
R7
1M 1%
C3
100nF
R5
2.2M
C5
0.1uF
C2
Q1
2N3904
.022uF
74HC14
1
C?
0.1uF
U1:A
SET
D
CLK
RESET
Q
15
3
D2
1
8
3
470K
R3
1M 1%
1N4148
U1:D
74HC14
9
10
100
R18
VCC
GND
1K
2
U7:C
14
7
6
CD4001
VCC
GND
J1:20
17
J1:17
18
J1:18
10
11
T1
4
27
J1:27
28
J1:28
29
J1:29
34
ECHO OUT
3
6
33
12
30
15
U10_5V
31
U3:F
1
VCC
8
GND
J1:33
TRIAD SP-67
U3:E
14
J1:34 +
2
.01uF
U3:D
CD4001
U1:E
6
1
C9
4050
9
U11_5V
U12_5V
0 OHM
4
U3:C
4
14
VCC
7
GND
R24
U3:B
7
74HC14
11
J1:19
20
SCOPE TRIGGER
1K
R19
6
U3:A
U1:B
74HC14
8
U5:C
7
U7_5V
TRIG. LED
19
2
2
U2:A
4013
82
LEVEL ADJUST
TP1
VOX TRIG
3
74HC14 1N4148
R4
R15
Q0
Q1
Q2
Q3
Q4
Q5
Q6
Q7
Q8
Q9
3
2
4
7
10
1
5
6
9
11
1
2
3
4
5
6
7
8
9
10
11
12
1
10
R2
100K
C1
22uF
RESET
VCC
16
Q
R36
TP5
U5:A
74HC4049
D1
2
100uF 10V
C&K A112
R14A
100K
5
R8
3.9K
R12
1M
S2
U7:A
R9
10K
C14
0 1 2 3 4 5 6 7 8 9
U5:D
9
+5V
C4
0.1uF
COMMON
Q5
VP0106
.015uF
C15
0.1uF
U11
+5V
12
Q10
1N4148
6
5
3
4
4
4017
470K
C7
U7:B
1M
Q
GND
A
C&K A112
U9_5V
4013
14
VCC
7
GND
RESET
15
S1
U2:B
12
8
CLK
CE
0 1 2 3 4 5 6 7 8 9
R14
100K
J1:23
2.2K
R11
D4
TP7
U5:E
R16
VCC
16
A
COMMON
R22
14
13
12
Q10
3
2
4
7
10
1
5
6
9
11
7
22
J1:22
GND
9
7
5
4
6
13
12
14
15
1
2
3
8
4017
U10
U12
10240Hz
J1:21
23
CLK
CE
Q0
Q1
Q2
Q3
Q4
Q5
Q6
Q7
Q8
Q9
16
Q0
VCC
Q1
Q2
Q3
Q6
Q7
Q8
Q9
Q10
Q11
Q12RESET
Q13
14
GND VCC
14
VCC
21
5
9
CLK
GND
12.5KHZ
10
J1:9
8
J1:7
12.0KHZ
1N4148
J1:10
10
1
LXO-20480Hz
7
GND
8
74HC393
12
J1:12
CLK QA
QB
QC
QD
8
14
13
14
J1:13
14
3
4
5
6
OUT
4020
GND VCC
J1:24
24
1
C17
0.1uF
U6_5V
7
26
CLR
U5_5V
1
2
3
4
5
6
7
8
9
10
11
12
J1:26
R
2
U4_5V
Y1
7
25
U9
2
3
4
5
6
7
S1A FREQ. SELECT
9
OUT
GND
VCC
16
SPG8640AN
P3
P2
P1
P6
P5
P4
C16
0.1uF
U8:A
TP9
20.480kHz
100
U2_5V
U3_5V
J1:25
+5V
R43
11
TP8
GND
J1:30 +
SPEAKER
_
J1:31
MIC-
J1:1
J1:2
TP4
VBatt
D7
1
1N4148
2
TP3
Isys
5
6
7
8
1.0
Vin
Vout
Ref
Shutdwn
Compout
FB
-Input
GND
LT1120A
ON/OFF
BT1
+9V
330K
U4
R35
C11
+
TP6
GND
TP2
+5V
R33
4
3
2
1
R34
1.0
R32
1M 1%
C13
.001uF
Q4
2N4126
C12
.22uF
10uF 16V
R31
975K
R29
4.7M
LOW BATTERY
J1:4
4
J1:3
3
C10
33uF 10V
U1:C
+5V
5
R26 1.0
R28 1.0
R41 1.0
Q2
VP0106
R30
2.2K
R39 1.0
R40 1.0
R21 1.0
SPARES:
14
U8:B
6
12
U2_5V
U3_5V
U4_5V
U5_5V
U6_5V
U7_5V
R23 1.0
R13 1.0
R27 1.0
R25 1.0
R1 1.0
U1:F
13
U8_5V
U9_5V
U10_5V
U11_5V
U12_5V
12
74HC14
15
J1:15
16
J1:16
32
J1:32
13
CLK QA
QB
QC
QD
15
U5:F
12
CLR
11
10
9
8
13
U6:D
U7:D
University of Rhode Island
Graduate School of Oceanography
IES Model 6.1 - ECHO BOX
C8
0.1uF
B
1 August 2000
EchoBOXB.SCH
_
N. WU
11
THIS PAGE INTENTIONALLY LEFT BLANK
1
1
2
2
3
3
4
4
5
5
6
6
7
7
8
C
J1
PUSH
BUTTON
8
CURRENT
METER
9
10
15
1
14
2
13
3
12
4
9
BNC
OUTPUT
6
11
7
8
J1
DB-15M
33 Ohm
10 Watt
URI-GSO BATTERY TESTER
100
200
300
400
500
0
5
10
R1
C
S1
2 pole - 10 position switch
DC milli A
9
10
Ampere-Hour Capacity (system/release)
SWITCH
POSITION
1
2
3
4
5
6
7
8
9
10
120/60
Vdc
14.5/12.5
180/60
I mA Vdc
350
14.5/12.5
240/60
I mA Vdc
350
14.5/12.5
I mA
350
14.5/12.5
350
14.5/12.5
350
14.5/12.5
350
0.0
0.0
7.4/6.0
200
7.4/6.0
200
7.4/6.3
200
7.4/6.3
200
7.4/6.3
200
7.4/6.3
200
7.4/6.3
200
7.4/6.3
200
7.4/6.3
200
7.4/6.3
200
7.4/6.3
200
7.4/6.3
200
7.4/6.3
200
7.4/6.3
200
0.0
0.0
7.4/6.0
200
7.4/6.0
200
0.0
0.0
0.0
0.0
7.4/6.0
200
0.0
0.0
0.0
0.0
7.4/6.0
200
7
PUSH TO
TEST
6
8
9
S1
10
5
4
3
2
1
BNC
OUTPUT
IES Battery Tester
Testing Notes:
1. Connect a DVM to the BNC output and set to Voltage measure.
2. V1/V2: V1 value indicates open circuit Voltage (no push button test).
3. V1/V2: V2 value indicates the minimum value for a new battery when loaded (button pressed).
4. The I ma value indicates the minimum current delivery capacity when loaded (button pressed).
5. If the battery has passivated, press the button intermittently (2 seconds ON, 10 seconds OFF), until
the minimum values in the table are reached. DO NOT HOLD THE BUTTON ON.
URI PN _______
Scale: none
Rev 2
gfc 10.26.05
Sheet 1/1
URI/GSO Physical Oceanography
THIS PAGE INTENTIONALLY LEFT BLANK
Appendix B
B.1 Paroscientific Pressure Sensor Specifications
THIS PAGE INTENTIONALLY LEFT BLANK
Appendix C
C.1 Bliley Frequency Reference Crystal Specifications
THIS PAGE INTENTIONALLY LEFT BLANK
Appendix D
D.1 Release Block Part Numbers
D.2 Release Block Assembly Instructions
D.3 Mooring Parts:
• IES anchor weight, 50lbs.
P/N _____________
• PIES mooring platform, steel
P/N 50-27A
• Mooring stand rust guard
P/N 37-23
• Mooring stand lifting line
P/N _____________
THIS PAGE INTENTIONALLY LEFT BLANK
Appendix D.1
Release Block Parts
VSA BC
cathode assembly,
p/n 56-19
XSA BC
anode assembly,
p/n 56-20
Notes:
1) See dwgs p/n 56-14a, 14b, 14c for detailed
assembly instructions.
release block,
pin holder,
p/n 50-01
release block,
plug holder,
p/n 50-02
chain, p/n 45-01_2
Under
screw, nylon
p/n 44-25
(2 places)
OUTSIDE VIEW
screw, nylon
p/n 44-25
(2 places)
IES - Exploded Release Block Parts
release pin,
p/n 50-05
URI PN 56-14
Scale: none
URI/GSO
Rev 0
gfc 11.17.03
Sheet 1 of 4
Physical Oceanography
Appendix D.2
Release Block Assembly Instructions
1
3
2
3/8"
Insert anode (small wire)
into plugholder with connector
fllush with edge, Pull
through with pliers.
Do not hit connector
on hard surface.
Bend inconel wire up
90 deg. toward release
block sharply with
heat shrink tubing
exposed 3/8"
4
Slide fiberglass pin
over wire using
larger hole
5
Assemble pin holder
onto plug holder with
pin in slot.
Holding pin snug against
pin holder, bend wire
out 90 deg. sharply.
6
7
Cut wire as shown
relative to pin
Remove pin holder
and rotate pin 90 deg.
Bend wire down sharply
at 90 deg.
Bend wire down sharply
at 90 deg. as shown
Sheet 2 of 4
gfc 11.17.03
PN 56-14a
9
8
Wrap wire around
pin as shown
Rotate pin back,
feed wire into
secondary hole.
11
10
Bend wire up sharply
at 90 deg.
Insert cathode (large wire)
into plug holder until
flush with edge.
12
Mount pin holder
to plug holder with nylon
#10 - 24 x 1/2 hardware,
including stainless steel
links.
13
14
Insert screw (nylon) on right
side only. Wrap wire around
screw 90 deg. Insert second screw
on left side. Wrap wire
around screw 180 deg. and trim to
length. Tighten both screws.
Sheet 3 of 4
gfc 11.17.03
PN 56-14b
Cathode - PN 50-01
See note 5
Anode - PN 50-02
Release pin
PN 50-05
Pin Holder
(PN 50-01)
Plug holder
(PN 50-02)
Pre-Deployment Checklist:
1.) Connectors are flush with surface.
2.) Cathode wire clearly obstructs pin movement.
3.) All wiring bends are sharp.
4.) No damage to exposed connectors.
5.) There MUST be 1/8" (+/- 1/32) movement between the
cathode wire and the release pin. The pin holder
will compress 1/8' at full deployment depth (10.000 psia),
potentially jamming the pin, which would prevent
the instrument from returing to the surface.
Sheet 4 of 4
gfc 11.17.03
PN 56-14c
Appendix E
E.1 IES Deployment Form
E.2 IES Recovery Form
THIS PAGE INTENTIONALLY LEFT BLANK
Inverted Echo Sounder - Model 6.2
Deployment
IES #_____________
Site/Project____________________________
Date:___________
ACS function
TELEM:
XPND:
BEACON:
RELEASE:
CLEAR:
Benthos DS-7000 Command
______
______
______
______
__76__
TT Measure Rate: _______ pings every _________ minutes
Depth: _____________ meters ÷ ____ m/min = sink time =
If cPIES: DCS s/n _____________
_______min.
DCS cable s/n_____________
Recovery Devices:
Internal radio/flasher Channel# _____
PIES stand
Flag
Attached & Working?
_____
_____
_____
Launch Site: (type of fix ____________________________ )
_____________________________________ °LAT
_____________________________________ °LONG
IES clock offset from GMT @ launch ____________ seconds (+early/- late)
Attach anchor, suspend & check slippage? ______________________
Time of launch (GMT) ________________
(Local) ________________
ACS replies @ ___________kHz
Reached bottom @ ____________________
Bottom TT measure burst @ _____________
Burst Telemetry @: ____________
SAMPLE#
1
2
3
4
ACS CLEAR when leaving site ___
NOTES:
Tau
__________
__________
__________
__________
DS-7000 GAIN: _____
Pressure
__________
__________
__________
__________
Distance:__________
Speed
__________
__________
__________
__________
Direction
__________
__________
__________
__________
THIS PAGE INTENTIONALLY LEFT BLANK
Inverted Echo Sounder - Model 6.2
Recovery
IES #_____________
Site/Project____________________________
Date:___________
ACS function
TELEM:
XPND:
BEACON:
RELEASE:
CLEAR:
Benthos DS-7000 Command
______
______
______
______
__76__
TT Measure Rate: _______ pings every _________ minutes
Depth: _____________ meters
Transpond slant range @ release:
_____________ m
Release command time
_____________
Leave bottom time
_____________
Surface time
_____________
On board time
_____________
IES OFF time
_____________
IES clock offset from GMT @ recovery ____________ seconds (+early/- late)
Radio working?
Flasher working?
NOTES:
____
____
THIS PAGE INTENTIONALLY LEFT BLANK
Appendix F
F.1 Refurbishing Kits
Release re-arming kit,
P/N 10-06
anode
P/N 13-06
link
P/N 45-01
pin
P/N 50-05
anchor line
P/N 37-15_93
nylon screw
P/N 44-25
Glass Sphere seal up kit
P/N 10-04
2” wide tape (1 roll, 100ft)
P/N 38-15
soft sealing tape (1 roll, 25ft)
P/N 38-16
Lithium Battery kits (circuit board and battery cells for system/release)
120/30 Amp-hour kit (12 cells)
P/N 12-14
120/60 Amp-hour kit (16 cells)
P/N 12-15
180/30 Amp-hour kit (16 cells)
P/N 12-16
180/60 Amp-hour kit (20 cells)
P/N 12-17
Tool kit
P/N 10-07
vacuum port wrench: Allen, 2.5mm
9/16’ nut driver (2 each) P/N 42-10
5/16 nut driver
P/N 42-12
‘O’-ring kit
P/N
pressure port
thru-the-glass-cable
vacuum port:
glass seal
screw seal
P/N 42-08
P/N 48-02, Parker P/N 2-015
P/N 48-04, Parker P/N 2-016
P/N 48-03 Parker P/N 2-011
P/N 48-06
IES Test Accessories Kit
Echo simulator
Signal insertion cable
Release simulator
P/N 10-02
P/N 11-14
P/N 11-15
P/N 11-16
Spare mechanical parts kit
P/N 10-05
nylon hardware: 1.25”x3/8”-16 bolts with washers and nuts (2)
nylon hardware: 2.00x3/8”-16” release block mount bolt (1)
spare release block – complete assembly (1)
anchor line: 5/16” diameter x 93” length Dacron (2)
plastic cable ties (6)
Appendix F.2 Replacement Parts
The following individual parts and assemblies are available. Contact URI-GSO for pricing… refer to the
URI part number.
Radio/Flasher module with high-band VHF (156.875MHz)
P/N 12-03
Radio/Flasher module with low-band VHF (43.528MHz)
P/N 12-09
Radio/Flasher module (with ARGOS receiver)
P/N 12-11
internal communications cable (standard RS-232 cable, 9-pin female/female) P/N 54-11
external communications cable (6ft, 10ft, 25ft)
P/Ns 51-05, 06, 07
battery circuit board assy
P/N 12-13
external connector plugs:
ON/OFF
P/N 32-53
RS232
P/N 32-54
thru-the-glass cable assembly
P/N 13-12
pressure port (titanium)
P/N 50-13
oil resevoir assy (plastic)
P/N 50-19
vacuum port (titanium)
P/N 50-18
release block cathode
P/N 13-05
O-ring grease
P/N 38- 18 or 19 (Dow Corning 4 compound or Parker O
Lube Grease)
pressure system oil
P/N 38-17 (Dow Corning 350-CS)
lifting belt (bands and grip)
P/N 11-13 (P/Ns 50-22 and 50-20)
transducer guard
P/N 50-07
release block guard
P/N 50-06
flag holder (arm & mounting nut) P/Ns 50-08 and 50-12
flag
P/N 52-09
recovery float
P/N 50-15
desiccant
P/N 37-06
Stable mooring platform for deployment with pressure sensor at sites with high bottom
current (> 50cm/sec)
P/N 50-27
Memory cards: (16 – 512Mbyte)
standard 16MByte
P/N 20-53
nylon bolts and nuts:
1”x3/8”-16 bolt
P/N 44-11
1.25”x3/8”-16 bolt
P/N 44-12
2”x3/8”-16 bolt
P/N 44-13
3/8”-16 nut
P/N 44-14
3/8” washer
P/N 44-15