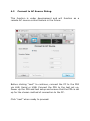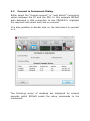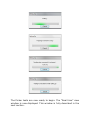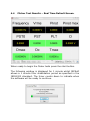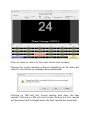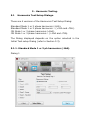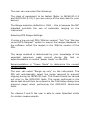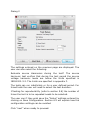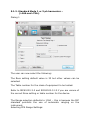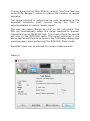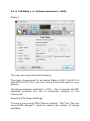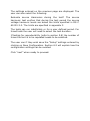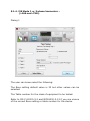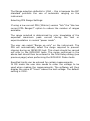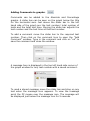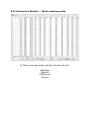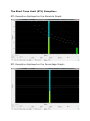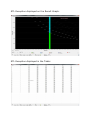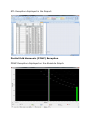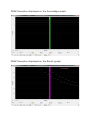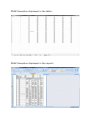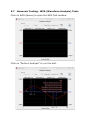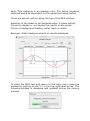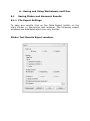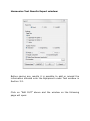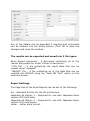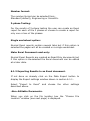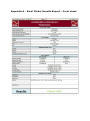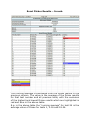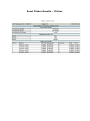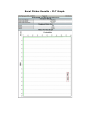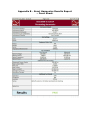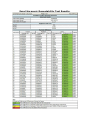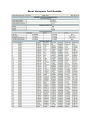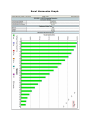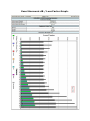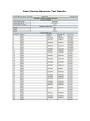
1
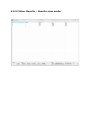
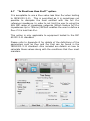
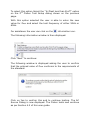
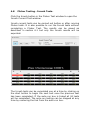
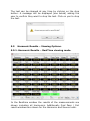
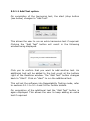
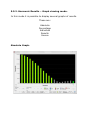
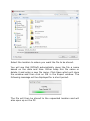
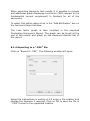
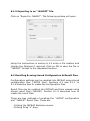
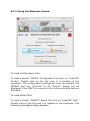
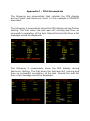
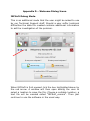
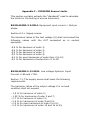
IECSoft
IEC 61000
Flicker and Harmonics
Testing Software.
USER MANUAL
ABOUT THIS MANUAL
IECSoft is a self contained executable software program for use
with the N4L PPA55xx series power analyzers.
The software is used for Flicker and Harmonic testing to the
IEC61000-3-2/3-3 and IEC61000-3-11/3-12 standards. This
includes the equivalent JIS (Japanese Industrial standard)
versions of these standards.
Accordingly, this manual first describes the general features
and specification of the software as a whole; and then
describes the individual functions in detail.
Each function is described in turn, in its own chapter, with
details of the principles on which it is based, how to use it, the
options available, display options etc.
Revision: 02
This manual is copyright © 2004-2015 Newtons4th Ltd. and all
rights are reserved. No part may be copied or reproduced in
any form without prior written consent.
27th February 2015
CONTENTS
1
Introduction – general principles of operation .............
1.1
2
Getting started ......................................................
2.1
3
IEC Soft Welcome Dialog ..................................
Equipment Under Test Dialog ............................
Test Set Up Dialog ...........................................
Flicker Testing .......................................................
4.1
4.2
4.3
4.4
4.5
4.5.1
4.5.2
4.5.3
4.5.4
4.5.5
4.6
4.7
4.8
4.9
5
Download2.2 ..................................................
Installation .....................................................
Initial Configuration ................................................
3.1
3.2
3.3
4
Introduction....................................................
Flicker Test Setup Dialog ..................................
Connect to AC Source Dialog .............................
Connect to Instrument Dialog ............................
Flicker Testing - Real Time Default Dialog............
Flicker Results Viewing Options ..........................
Flicker Results - Realtime view mode ..................
Flicker Results - IFS Graph view mode ................
Flicker Results - PST Graph view mode ...............
Flicker Results - Table view mode ......................
Flicker Results - Results view mode ....................
Flicker Testing - "Ignore PLT Results?" Option ......
Flicker Testing - "Is Ztest less than Zref?" Option .
Flicker Testing - Inrush tests .............................
Saving Flicker Results ......................................
Harmonic Testing ...................................................
5.1
5.1.1
5.1.2
5.1.3
5.1.4
5.2
5.3
5.4
Harmonics Test Setup Dialog .............................
Harmonics standard mode, 1 or 3 phase .............
Harmonics standard mode, 1 or 3ph High Current
Harmonics JIS mode, 1 or 3 phase .....................
Harmonics JIS mode, 1 or 3 phase High current ...
Connect to AC Source Dialog .............................
Connect to Instrument Dialog ............................
Harmonics Test Dialog......................................
5
Harmonic Testing (continued) .................................
5.5
Harmonic Results Viewing Options .....................
5.5.1 Harmonic Results in Realtime viewing mode ........
5.5.1.1 Add Test Option ...........................................
5.5.2 Harmonic Results in Graph view mode ................
5.5.3 Harmonic Results in Table viewing mode .............
5.6
Harmonic Results - STL and POHC Exceptions ......
5.7
Harmonic testing WFA Tests ..............................
5.8
Harmonics - Repeatability testing .......................
5.9
Saving Harmonic Results ..................................
6
Saving and Using Worksheets and Files .....................
6.1
6.1.1
6.1.2
6.1.3
6.1.4
6.1.5
6.2
6.2.1
6.2.2
6.3
Saving Flicker and Harmonic Results ..................
File Export Settings..........................................
Exporting results to an Excel document...............
Harmonics dB / Loss Factor Graph Option............
Exporting to a ".CSV" File .................................
Exporting to a ".N4LEIC" File .............................
Recalling stored Configuration and Result Files .....
Using the Welcome Screen to load in Files ...........
Using Drag "n" drop to load in Files ....................
Clearing the IECSoft file storage area on PC’s ......
APPENDICES.
Appendix A
Excel Flicker test Report / Results
Appendix B
Excel Harmonic test Report / Results
Appendix C
PPA Screenshots
Appendix D
Welcome Dialog assistance Icons
Appendix E
Definitions:
Tmax and d(t).
Dmax.
Short Term Limit (STL) Exception.
Partial odd Harmonic (POHC) Exception.
Appendix F
IEC61000 Source Limits
Appendix G
IEC61000-11 - References to Ztest & Zref
Appendix H
Help and Assistance
1 - Introduction – general principles of operation.
1.1
Introduction
IECSoft is a self contained executable software program written
in C++ using the Microsoft win32 graphics set.
IECSoft has the ability to connect to a PPA55x1 or PPA55x0 via
RS232, USB and LAN. The software includes all measurement
modes to reflect instrument operation.
The ability to export directly to excel, .CSV or .N4LIEC is
supported by IECSoft.
IECSoft version v2.1t and Firmware version v2_118 were used
to compile this User Manual.
2 - Getting Started
2.1
Download
As with all N4L software, it is available free to download from
our website. See www.newtons4th.com/support for more
details, once registered and your account is activated you will
have access to the software downloads section. The latest PPA
firmware releases can also be found on our website.
2.2
Installation
At N4L we develop software that enables the engineer to be up
and running and performing tests as soon as possible. With this
in mind we have avoided the use of the .net environment and
used the Microsoft win32 graphics set.
As such, installation is simple. All that is required is to
download the .exe from the N4L website and extract the
software to the desired location on your hard drive.
Alternatively the software can be run directly from USB
memory stick.
3 – Initial Configuration.
3.1
IEC Soft Welcome Dialog.
Double click on the IECSoft Icon to start the software. The
start-up screen will be displayed as follows:
This section will explain how to use the software using a new
configuration. Section 6.2 will explain how to recall and use
saved configuration and test result files. This includes details of
the “drag n drop” option to initialise the IECSoft software.
Select “New IEC Config”
3.2
Equipment Under Test Dialog.
The following window will now be displayed.
When the above window is first displayed all values are shown
as N/A.
The user has the choice to leave all or some of the values as
N/A or to enter their choice of details. There is also the facility
to enter any extra comments in the notes section.
The information entered here will be displayed in the final
report. These details can be updated on completion of testing
before the final report is created.
Click “next” when ready to proceed.
3.3
Test Setup Dialog.
The user now needs to choose from Standard International test
mode or Japanese JIS mode.
Then one of the choices of Flicker or Harmonic tests needs to
be selected. The software will automatically go to the next
window when a test is selected.
Section 4 of this manual will describe the selection of the
Flicker testing options shown in the above window. Section 5
will describe the selection of the Harmonic testing options.
Note:
Should the user wish to change the selected Test or mode
(standard or JIS) they can return to the above window by
clicking on the “Select mode” option on the Flicker or Harmonic
Test setup screens.
4 - Flicker Testing
4.1
Flicker Test Setup Dialog.
The example used in this manual is a “1 Phase Flicker” Test.
This option was selected on the previous screen.
Note: There are 2 setup screens. Each screen looks the same
for all types of Standard mode and JIS mode Flicker tests.
On screen 1 the default settings are:
Measurement: Voltage
Testing Tmax: Normal
Range selection: 100A – this is because the IEC standard
prohibits the use of automatic ranging on the instrument.
Selecting PPA Range Settings:
If using a low current PPA (30Arms version) “tick” the “Use low
current PPA Ranges?” option to reduce the number of ranges
available.
The range selected is determined by prior knowledge of the
expected maximum peak current during the test or
experimentation in normal “power mode”.
The user can select “Range up only” on the instrument. The
PPA will automatically select the range required to prevent
clipping during an IEC61000 test. This check should be carried
out prior to the IEC61000 tests. The range confirmed in the
above test should then be entered in the Test Setup dialog (see
previous page) when performing the IEC61000 Flicker tests.
Click “next” when ready to proceed.
Test Setup dialog 2 displays settings from the first setup screen
plus the default settings for PST and PLT.
The default test time above is 2hours (120 minutes) and is
derived from the PST and PLT selection (10 x 12 = 120
minutes).
The user can select the length of the PST and PLT test times.
The user should now choose the appropriate settings for the
tests they intend to make. PST can be set in 0.5 minute steps,
e.g. 2.5 minutes.
The user can if they wish save the settings entered by clicking
on “Save Configuration”. Section 6.2 will explain how the
configuration settings can be recalled.
It is important to remember that the range selection should be
made according to the expected peak current of the device
under test.
Refer to section 4.6 for details of the “Ignore PLT results?”
option.
Refer to section 4.7 for details of the “Is Ztest less than Zref?”
option.
Selecting the “Auto Inrush Test” option will display the Inrush
test window a few seconds after displaying the Realtime
Default Screen.
Selecting “Auto Start” will automatically start the flicker testing
once the Realtime Default screen is displayed.
Click “next” when ready to proceed.
4.2
Connect to AC Source Dialog.
This function is under development and will function as a
remote AC source control feature in the future.
Before clicking “next” to continue, connect the PC to the PPA
via LAN, Serial or USB. Connect the PPA to the test set up.
Power up the PPA and test setup and ensure that the PPA is set
up for the chosen method of connection to the PC.
Click “next” when ready to proceed.
4.3
Connect to Instrument Dialog.
Either select the “manual connect” or “auto detect” connection
option between the PC and the PPA. In this example IECSoft
auto detected a LAN connection to two PPA5530’s. Highlight
the required instrument and click on connect.
It is also possible to double click on the instrument to connect
to it.
The following series of windows are displayed for several
seconds whilst IECSoft sends the setup commands to the
instrument.
The flicker tests are now ready to begin. The “Real time” view
window is now displayed. This window is fully described in the
next section.
4.4
Flicker Test Results – Real Time Default Screen.
When ready to begin the flicker tests press the start button.
The following window is displayed for 1 minute whilst IECSoft
allows a 1 minute filter stabilisation period as specified in the
IEC61000 standard. The timer counts down to indicate when
the software will be ready to continue.
Cancelling the Test.
The user is able to cancel the test if required. Click on cancel
and the cancel window is displayed.
Click OK to cancel the filtering and return to the “Real time”
results window.
Skipping the filter setup period.
There is the option to skip this delay. Clicking on “skip” will
result in the following window being displayed. This states that
for testing to comply with the standard the stabilisation period
is compulsory. Any test results are considered to be invalid.
Flicker testing begins.
The processing filters message will disappear and the software
will start to run the tests. The test period is defined by the
previously selected values for PST and PLT.
The total test period and the present total elapsed time are
shown to the bottom right hand corner of the test window. The
selected PST time period and present elapsed times are also
displayed. The number of PST tests selected and the actual
number of the present PST test are also displayed. In the
above example 12 PST tests have been selected with a test
period of 10 minutes each. This will give a total test period of
120 minutes / 2 hours.
Whilst the test is running the user is able to change the viewing
mode to view the IFS / PST graphs or the results in table
format.
On completion of the tests a “Test Complete” message is
displayed as shown below. The option is available to disable
this message.
The test can be stopped at any time by clicking on the stop
button. A message will be displayed (see next page) asking the
user to confirm they want to stop the test. Click on yes to stop
the test.
The following are also available to the user in the flicker test
window.
Phase Selection buttons:
These can be found along the bottom of the Flicker Test dialog
but are only available when running 3-phase tests. The Flicker
test dialog defaults to displaying results for Phase 1 but these
buttons can be used to display the results for Phase 2 or Phase
3 instead.
Print Screen Facility:
Dialog boxes or Result windows displaying this icon can be
printed by clicking on the Icon.
A print screen Format box is displayed (see below). Select the
required format and press ok to continue.
The document will be displayed in the specified Excel format on
the PC to allow the user to save a copy of the document if
required. Use the print option in Excel to print the document.
4.5
Flicker Results – Viewing options.
4.5.1 Flicker Results – Realtime view mode.
The above example of the realtime window demonstrates how
IECSoft uses colour coding to highlight whether the results
were within the limits defined in the standards or not.
Measurements shaded black are for user reference.
Measurements that have defined limits are shaded green if
they are within the limits or red if the fail to meet the limits.
Measurements shaded orange indicate that the result is
approaching the limit but is still within the specified limit. For
results stated in percentages this is 1%. For the remaining
results they turn orange if the result is within 0.1 of the limit.
Realtime view displays a final PASS / FAIL result once the
testing is completed. This is also colour coded but only green or
red representing Pass or fail.
4.5.2 Flicker Results – IFS Graph view mode.
When a flicker test involves 2 or more PST’s, the IFS graph can
display the results for any 2 of the PST’s.
The PST’s displayed are selected using the Left PST and Right
PST drop down menus shown above. The actual PST results
displayed on the graph are shown on the drop down menu bars
and on the vertival axis of the graph.
The slider bar is used to move the Time axis so that the results
for any particular period during the test can be viewed on the
graph.
4.5.3 Flicker Results – PST Graph view mode.
Only one PST graph can be displayed at a time on the PST
graph. The left and right arrow keys (see below) are used to
select the PST to be displayed on the graph.
It is also possible to display an additional graph “PST SUM”.
The actual PST that is displayed on the graph is displayed
between the arrow keys.
4.5.4 Flicker Results – Table view mode.
The measurements with defined limits are shaded green it they
are within the limits or red if they are outside of the limits.
Measurements shaded orange are values that are close to, but
still within the specified limit. For results stated in percentages
this is 1%. For the remaining results they turn orange if the
result is within 0.1 of the limit.
4.5.5 Flicker Results – Results view mode.
4.6
“Ignore PLT Results?” Option.
This option is selected by ticking the “Ignore PLT results?” on
the Flicker Test Setup dialog screen 2 (see below). This is
selected when the IEC standard states there is no requirement
for evaluation of PLT.
When this option is selected the PLT result is no longer
highlighted in Red, Amber or green in the Realtime view
window or in table view mode.
On the Flicker results tab of the Excel report no value is now
shown for PLT, the value is replaced by N/A.
4.7
“Is Ztest less than Zref?” option.
It is acceptable to use a Ztest value less than Zref when testing
to IEC61000-3-11. This is permitted as it is sometimes not
possible to dissipate the heat emitted with the full Zref
reference impedance. In order to not limit the user to using the
N4L IMP range of impedance networks (Which feature full Zref
impedances up to 75Arms) IECSoft enables the user to define a
Ztest if it is less than Zref.
This option is only applicable to equipment tested to the IEC
61000-3-11 standard.
Please refer to Appendix G for details of the definitions of the
parameters such as Ztest and Zref that can be found in the
IEC61000-3-11 standard. Also included are details on how to
calculate these values along with the conditions that Ztest must
maintain.
To select this option Select the “Is Ztest less than Zref?” option
on the 2nd Flicker Test Setup dialog shown on the previous
page.
With this option selected the user is able to enter the new
value for Ztest and select the test frequency of either 50Hz or
60Hz.
For assistance the user can click on the
information icon.
The following information window is then displayed.
Click “Next” to continue:
The following window is displayed asking the user to confirm
that the entered value of Ztest conforms to the requirements of
the standard.
Click on Yes to confirm this and to continue testing. The AC
Source Dialog is now displayed. The Flicker tests now continue
as per Section 4.2 of this user guide.
In the event that the high current tests fail the window shown
above will be displayed. Details of the failure will be displayed
along with asking the user if they wish to calculate the system
impedance “Zsys” for the phase that failed test. If more than
one phase fails, a message will appear for each failed phase.
However, only one failure window is displayed at a time. Once
the user responds to the first window, that window will close. If
another phase has failed the window for that phase will appear.
Click “No” and the test complete message is displayed.
Click “Yes” and the following window appears displaying the
calculated value for Zsys. Click “OK” and the test complete
message is displayed.
Note: The calculated value for Zsys will also be displayed on the
front page of the excel report. An example is shown below.
4.8
Flicker Testing - Inrush Tests.
Click the Inrush button in the Flicker Test window to open the
Inrush Current Test window.
Inrush current tests can be carried out before or after running
Flicker tests. It is also possible to run the Inrush tests without
completing a Flicker Test. The results can be saved as
described in section 6.1 but only the Inrush results will be
exported.
The Inrush tests can be completed one at a time by clicking on
the start button to begin the next test once the previous test
has been completed. If the auto-run box is ticked all 24 tests
will be completed. The auto-run testing can be stopped at any
time by removing the tick from the auto-run box.
Note: Click on “Clear” to clear the stored results of any
previous Inrush tests. If the previous test results have not
been cleared when you click on “Start” testing will begin from
the first test number with no displayed result.
In auto-run mode it is possible to set up a delay period
between the completion of one test and the start of the next.
This is achieved by ticking the “Pause between tests?” Box and
entering the required delay in the “Time between tests in
seconds” box. This option can be selected, deselected or the
pause period changed but not whilst a test is running. If
running in Auto-Run mode, deselect Auto-run and wait for the
present test to end. Now make the required changes to the
“Pause between tests” options. Reselect Auto-Run and click on
“Start” to resume the Inrush tests. This gives the user the
facility to allow the unit under test to “cool down” if required
between Inrush tests.
When an Inrush test starts a “WAIT” message is displayed for
several seconds, the message changes to “START” to instruct
the user to ensure the unit under test is powered up. No
message is displayed during the test but a “STOP” message is
displayed on completion of the test to instruct the user that the
equipment can be powered down if necessary. A “WAIT”
message is then displayed for a few seconds before the test is
shown has completed. There is the option to set an audible
beep to be emitted during the START and STOP periods to aid
users who are unable to view the messages in the software
window. The beep is enabled or disabled in the menu along the
top of the Inrush test window. The Unit under test can be
“cooling down” during the WAIT periods.
During the tests, the number of the actual test being made will
be shown in the main Inrush test window and at the top of the
screen. The test will be highlighted in yellow but so will any
tests that are above limits.
The screen shot below shows all tests completed with the
highest and lowest results highlighted in red and blue.
Click on close to return to the main flicker test window.
Closing the inrush window without completing all 24 tests will
result in the following message being displayed.
Clicking on YES will exit Inrush testing and clear the test
results. Clicking on NO will exit Inrush testing but the results
will be saved and included when the test results are exported.
4.9
Saving Flicker Results.
There are a number of options for saving the results of flicker
tests. Section 6.1 provides details of the options available and
how to save the results in these options. It is also possible to
edit the DUT results before creating the final report.
Please refer to Appendix A for an example of the Excel Results
report for Flicker testing.
5 - Harmonic Testing.
5.1
Harmonics Test Setup Dialogs.
There are 4 versions of the Harmonics Test Setup Dialog:
Standard
Standard
JIS Mode
JIS Mode
Mode 1 or 3 phase harmonics (≤16A).
Mode 1 or 3 phase harmonics – (>16A and ≤75A).
1 or 3 phase harmonics (≤16A).
1 or 3 phase harmonics – (>16A and ≤75A).
The Dialog displayed depends on the option selected in the
Initial Test setup Dialog (refer to Section 3.3).
5.1.1. Standard Mode 1 or 3 ph harmonics (≤16A).
Dialog 1
The user can now select the following:
The class of equipment to be tested (Refer to IEC61000-3-2
and IEC61000-3-12) if you are unsure of the test class for your
device).
The Range selection defaults to 100A – this is because the IEC
standard prohibits the use of automatic ranging on the
instrument.
Selecting PPA Range Settings:
If using a low current PPA (30Arms version) “tick” the “Use low
current PPA Ranges?” option to ensure the ranges displayed in
the software reflect the ranges in the 30Arms version of the
PPA.
The range selected is determined by prior knowledge of the
expected maximum peak current during the test or
experimentation in normal “power mode” on the PPA.
Experimentation in "Power Mode" to determine the correct
current range:
The user can select “Range up only” on the instrument. The
PPA will automatically select the range required to prevent
clipping during an IEC61000 test. This check should be carried
out prior to the IEC61000 tests. The range confirmed in the
above test should then be entered in the Test Setup dialog (see
previous page) when performing the IEC61000 Harmonics
tests.
For classes C and D the user is able to enter Specified Limits
for certain measurements.
Dialog 2
The settings entered on the previous page are displayed. The
user can also select the following:
Evaluate source Harmonics during the test? The source
harmonic test verifies that during the test period the source
voltage harmonic levels are below the limits specified in
IEC61000-3-2. The limits are specified in appendix F.
The tests can run indefinitely or for a user defined period. For
timed tests the user will need to select the test duration.
If testing for reproducibility (refer to section 5.8) the number of
times the test is to be repeated needs to be selected.
The user can if they wish save the “Setup” settings entered by
clicking on Save Configuration. Section 6.2 will explain how the
configuration settings can be recalled.
Click “next” when ready to proceed.
5.1.2. Standard Mode 1 or 3 ph harmonics –
(>16A and ≤75A).
Dialog 1
The user can now select the following:
The Rsce setting default value is 33 but other values can be
selected.
The Table number for the class of equipment to be tested.
Refer to IEC61000-3-2 and IEC61000-3-12 if you are unsure of
the correct Rsce setting or table number for the device.
The Range selection defaults to 100A – this is because the IEC
standard prohibits the use of automatic ranging on the
instrument.
Selecting PPA Range Settings:
If using a low current PPA (30Arms version) “tick” the “Use low
current PPA Ranges?” option to reduce the number of ranges
available.
The range selected is determined by prior knowledge of the
expected maximum peak current during the test or
experimentation in normal “power mode”.
The user can select “Range up only” on the instrument. The
PPA will automatically select the range required to prevent
clipping during an IEC61000 test. This check should be carried
out prior to the IEC61000 tests. The range confirmed in the
above test should then be entered in the Test Setup dialog (see
previous page) when performing the IEC61000 Flicker tests.
Specified Limits can be entered for certain measurements.
Dialog 2
The settings entered on the previous page are displayed. The
user can also select the following:
Evaluate source Harmonics during the test? The source
harmonic test verifies that during the test period the source
voltage harmonic levels are below the limits specified in
IEC61000-3-12. The limits are specified in appendix F.
The tests can run indefinitely or for a user defined period. For
timed tests the user will need to select the test duration.
If testing for reproducibility (refer to section 5.8) the number of
times the test is to be repeated needs to be selected.
The user can if they wish save the “Setup” settings entered by
clicking on Save Configuration. Section 6.2 will explain how the
configuration settings can be recalled.
Click “next” when ready to proceed.
5.1.3. JIS Mode 1 or 3 phase harmonics (≤16A).
Dialog 1
The user can now select the following:
The class of equipment to be tested (Refer to JIS C 61000-3-2
and IEC61000-3-12) if you are unsure of the test class for your
device).
The Range selection defaults to 100A – this is because the IEC
standard prohibits the use of automatic ranging on the
instrument.
Selecting PPA Range Settings:
If using a low current PPA (30Arms version) “tick” the “Use low
current PPA Ranges?” option to reduce the number of ranges
available.
The range selected is determined by prior knowledge of the
expected maximum peak current during the test or
experimentation in normal “power mode”.
The user can select “Range up only” on the instrument. The
PPA will automatically select the range required to prevent
clipping during an IEC61000 test. This check should be carried
out prior to the IEC61000 tests. The range confirmed in the
above test should then be entered in the Test Setup dialog (see
previous page) when performing the IEC61000 Flicker tests.
For classes C and D the user is able to enter Specified Limits
for certain measurements.
In JIS mode the user also needs to enter the voltage to be
used when making the measurements. The software will then
display the value of “Vnom” above the test voltage. The default
setting is 230V.
Dialog 2
The settings entered on the previous page are displayed. The
user can also select the following:
Evaluate source Harmonics during the test? The source
harmonic test verifies that during the test period the source
voltage harmonic levels are below the limits specified in JIS C
61000-3-2. The limits are specified in appendix F.
The tests can run indefinitely or for a user defined period. For
timed tests the user will need to select the test duration.
If testing for reproducibility (refer to section 5.8) the number of
times the test is to be repeated needs to be selected.
The user can if they wish save the “Setup” settings entered by
clicking on Save Configuration. Section 6.2 will explain how the
configuration settings can be recalled.
Click “next” when ready to proceed.
5.1.4. JIS Mode 1 or 3 phase harmonics –
(>16A and ≤75A).
Dialog 1
The user can know select the following:
The Rsce setting default value is 33 but other values can be
selected.
The Table number for the class of equipment to be tested.
Refer to JIS C 61000-3-2 and IEC61000-3-12 if you are unsure
of the correct Rsce setting or table number for the device.
The Range selection defaults to 100A – this is because the IEC
standard prohibits the use of automatic ranging on the
instrument.
Selecting PPA Range Settings:
If using a low current PPA (30Arms) version “tick” the “Use low
current PPA Ranges?” option to reduce the number of ranges
available.
The range selected is determined by prior knowledge of the
expected maximum peak current during the test or
experimentation in normal “power mode”.
The user can select “Range up only” on the instrument. The
PPA will automatically select the range required to prevent
clipping during an IEC61000 test. This check should be carried
out prior to the IEC61000 tests. The range confirmed in the
above test should then be entered in the Test Setup dialog (see
previous page) when performing the IEC61000 Flicker tests.
Specified Limits can be entered for certain measurements.
In JIS mode the user also needs to enter the voltage to be
used when making the measurements. The software will then
display the value of “Vnom” above the test voltage. The default
setting is 230V.
Dialog 2
The settings entered on the previous page are displayed. The
user can also select the following:
Evaluate source Harmonics during the test? The source
harmonic test verifies that during the test period the source
voltage harmonic levels are below the limits specified in
IEC61000-3-12. The limits are specified in appendix F.
The tests can run indefinitely or for a user defined period. For
timed tests the user will need to select the test duration.
If testing for reproducibility (refer to section 5.8) the number of
times the test is to be repeated needs to be selected.
The user can if they wish save the “Setup” settings entered by
clicking on Save Configuration. Section 6.2 will explain how the
configuration settings can be recalled.
Click “next” when ready to proceed.
5.2
Connect to AC Source Dialog.
This function is under development and will function as a
remote AC source control feature in the future.
Before clicking “next” to continue, connect the PC to the PPA
via LAN, Serial or USB. Connect the PPA to the test set up.
Power up the PPA and test setup and ensure that the PPA is set
up for the chosen method of connection to the PC.
Click “next” when ready to proceed.
5.3
Connect to Instrument screen.
Either manually connect or auto detect the connection between
the PC and the PPA. In this example IECSoft auto detected a
LAN connection. Highlight the connection and click on connect.
It is also possible to double click on the instrument to connect
to it.
The window below is displayed for several seconds.
The first window below is displayed for a short period of time
whilst the software sends the necessary commands to prepare
the instrument. The message is updated (see second window
below) and then disappears when ready to continue. The
Harmonics test screen will then be displayed automatically.
There is the option to skip this delay but as stated above for
testing to comply to the standard this stabilisation period is
compulsory. The user is able to cancel the test if required.
5.4
Harmonics test Screen.
Phase Selection buttons:
These can be found along the bottom of the Harmonic Test
dialog but are only available when running 3-phase tests. The
Harmonic test dialog defaults to displaying results for Phase 1
but these buttons can be used to display the results for Phase 2
or Phase 3 instead.
This example is a “standard” 1-phase harmonic test. Class A is
selected, running a timed test of 2 minutes including the
testing of source harmonics.
Click on Start to run the test.
The test will now start to run with the data in the RealTime
window being updated. The “Time Left” and “Elapsed Time“
figures will reflect the selected running time of the test.
Whilst the test is running the results can also be viewed in
graph or table format.
On completion of the tests a “Test complete” message will be
displayed as shown below.
Click Ok to clear the message.
The user can choose not to display this message if they wish.
The test can be stopped at any time by clicking on the stop
button. A message will be displayed (see below) asking the
user to confirm they want to stop the test. Click on yes to stop
the test.
5.5
Harmonic Results – Viewing Options.
5.5.1. Harmonic Results – RealTime viewing mode.
In the Realtime window the results of the measurements are
shown including all harmonics. Additionally final Pass / Fail
result windows are shown for the Harmonic and Source tests.
5.5.1.1 Add Test option.
On completion of the harmonics test, the start /stop button
(see below) changes to “Add Test”.
This allows the user to run an extra harmonics test if required.
Clicking the “Add Test” button will result in the following
window being displayed.
Click yes to confirm that you want to add another test. An
additional test will be added to the test count at the bottom
right of the Realtime window. The “Add Test” button changes
back to “Start”. Click on “start” to run the additional test.
This will set the software into Repeatability Testing mode, refer
to sections 5.1.1 to 5.1.4 and 5.8 for further details.
On completion of the additional test the “Add Test” button is
again displayed. This allows the user to keep adding an extra
test if required.
5.5.2. Harmonic Results – Graph viewing mode.
In this mode it is possible to display several graphs of results.
These are:
Absolute
Percentage
Individual
Results
Source
Absolute Graph.
Percentage Graph.
The vertical axis on the Percentage Graph defaults to display
100% when the results obtained are less than 100% of the
limit. The axis would automatically be adjusted to display the
maximum value for results that are above 100% of the limit.
In this example a line is drawn on the graph to display the 90%
of limit level. Depending on the scaling of the axis similar lines
will be shown for the 150% and 200% of limit levels.
Individual graph.
This graph displays the results for a single harmonic.
The harmonic that the graph represents is displayed near the
base of the graph.
The
and
keys are used to select the actual harmonic to
be displayed on the graph.
Results Graph.
Source Graph.
Selection of Parameters displayed on the graphs.
On the Absolute and Percentage graphs it is possible to select
which parameters are displayed on the bars of the graph.
Moving the curser over the graph area and then right clicking
on the PC mouse results in the “Display” option appearing on
the graph, move the cursor over “display” results in the display
parameters being displayed. Now select the parameters to be
displayed on the graph.
Only one parameter can be changed at a time. It is necessary
to right click on the graph area again and follow the above
procedure for each parameter to be changed. The graph
changes automatically when a parameter is selected or deselected.
The 4 parameters that can be changed are Average, Current,
Maximum and Minimum. The default setting for the graphs is
Minimum de-selected and the other parameters all selected.
Adding Comments to graphs:
Comments can be added to the Absolute and Percentage
graphs. A slider bar can be seen on the graph below the title
for the horizontal axis. Just above the slider bar to the left
hand side of the graph are the test number/ total number of
tests and the total test time. Moving the slider bar adjusts the
test number and the test time at that test number.
To add a comment move the slider bar to the required test
number. Then click on the comment Icon to open the “Add
Comment” window. Type in the comment and click on “ok” to
save the comment and close the window.
A message Icon is displayed in the top left hand side corner of
the graph window for any test number with a saved comment.
To read a stored message move the slider bar and stop on any
test when the message Icon appears. To view the message
point the PC mouse over the message icon. The message will
be displayed just below the message icon for 5 seconds.
Harmonics graph playback mode:
When this button (green arrow) is pressed the software will
playback the harmonic test results stepping through the tests
one at a time. Any of the graph viewing modes can be
replayed. Whilst replaying the test the icon changes to the red
square, playback can be stopped at any time by clicking on the
button.
Customised Amplitude and Harmonic Ranges:
The user can customise the settings for the amplitude and
harmonics ranges on certain graphs. The table below indicates
the ranges that can be customised on each of the graph
options.
Absolute
Percentage
Individual
Results
Source
Amplitude Range
Yes
No
N/A
Yes
Yes
Harmonic Range
Yes
Yes
N/A
Yes
Yes
To change the Amplitude Range remove the “tick” from the
Amp Range auto box and then enter the new Max: range value.
Click on “Redraw” to display the graph using the new range.
These settings can be found at the base of the graph.
The Harmonic Range defaults to display Harmonics from 2 to
40. To display a different range of harmonics on the graph
remove the “tick” from the Harmonic Range auto box. Enter
the number of the minimum and maximum harmonics to be
displayed. Click on “Redraw” to display the graph using the
new range of harmonics.
5.5.3 Harmonic Results – Table viewing mode.
In Table viewing mode results can be seen for:
Absolute
Results
Difference
Source
5.6
Harmonic Results – STL and POHC Exceptions.
It certain circumstances it is acceptable for the harmonics to
exceed the specified limits. These incidents are called
exceptions.
This section explains these exceptions and demonstrates how
they are displayed if they occur during the IECSoft tests.
There are two of these exceptions. These are called:
Short Term Limit (STL) Exception
Partial Odd Harmonic (POHC) Exception
The definitions of the above exceptions can be found in section
6.2.3.4 of the IEC 61000-3-2 Standard. They are also included
in Appendix E of this user guide.
When an exception occurs the final result for the harmonic test
would still be shown has a pass but the exception would be
displayed on the graphs and in the tables. The following screen
shots show examples.
Note: The following examples are for reference purposes only.
They have been simulated to allow the user to easily identify
when an exception occurs and where it will be displayed in the
results produced when using the IECSoft software. Normally
data would be displayed for all harmonics on the tables and in
the graphs.
The Short Term Limit (STL) Exception:
STL Exception displayed on the Absolute Graph:
STL Exception displayed on the Percentage Graph:
STL Exception displayed on the Result Graph:
STL Exception displayed in the Table:
STL Exception displayed in the Report:
Partial Odd Harmonic (POHC) Exception
POHC Exception displayed on the Absolute Graph:
POHC Exception displayed on the Percentage graph:
POHC Exception displayed on the Result graph:
POHC Exception displayed in the table:
POHC Exception displayed in the report:
5.7
Harmonic Testing - WFA (Waveform Analysis) Tests
Click on WFA (above) to open the WFA Test window.
Click on “Perform Analysis” to run the test.
Note: This response is an example only. The actual response
obtained would be dependent on the equipment being tested.
There are several options along the top of the WFA window:
Selection of the phase to be displayed when 3 phase testing.
Choose to display or not display the results on the graph.
Choice of background shading, either black or white.
Example: White background with no results displayed.
To close the WFA test and return to the main menu close the
window by clicking on the “X” in the top right hand corner. The
following window is displayed and updated during the closure
process.
5.8
Harmonics – Repeatability testing.
Repeatability tests can be made in any of the harmonic test
options. The user can select the number of tests to run to
check that repeatability tests are within limits.
The number of tests is selected on Test Setup screen 2 (refer
to sections 5.1.1 to 5.1.4).
An additional page is created in the final report that details the
results of the repeatability tests.
For each harmonic the two closest readings are displayed. The
difference between these readings is then compared to the
allowance limit. The table below is used to determine if the
result for each harmonic is a pass or fail.
Allowance
Good
OK
Poor
Fail
Maximum Difference allowed in Amps
The difference is less than 50% of the allowance
The difference is between 50% of the allowance and 75% of the allowance
The difference is between 75% of the allowance and 100% of the allowance
The difference has exceeded the allowance
On completion of the selected number of Repeatability tests it
is possible to add additional tests one at a time using the “Add
Test” option. Details of the “Add Test” option can be found in
section 5.5.1.
The Repeatability results in the final report will be updated to
include any additional tests. For example, If 10 tests were
initially made the closest 2 tests would be displayed in the
report. If an extra 2 tests were added using the “Add Test”
option then IECSoft would compare the results for all 12 tests
and the use the results for the closest 2 tests in the report.
If only 1 test was originally requested then on selecting an
additional test the repeatability test results will be created and
added to the final report.
The second “Test Setup” dialog box (refer to sections 5.1.1 to
5.1.4) is updated to reflect the new total number of tests.
5.9
Saving Harmonic Results.
There are a number of options for saving the results of
Harmonic tests. Section 6.1 provides details of the options
available and how to save the results in these options. It is also
possible to edit the DUT results before creating the final report.
Please refer to Appendix B for an example of the Excel Results
report for Flicker testing.
6 - Saving and Using Worksheets and Files.
6.1
Saving Flicker and Harmonic Results.
6.1.1 File Export Settings.
To save any results click on the Data Export button on the
main Flicker or Harmonics test window. The following export
windows are displayed which are very similar.
Flicker Test Results Export window:
Harmonics Test Results Export window:
Before saving any results it is possible to add or amend the
information entered onto the Equipment under Test window in
Section 3.2.
Click on “Edit DUT” above and the window on the following
page will open:
Any of the details can be amended if required and comments
can be entered into the Notes section. Click OK to save the
changes and close the window.
The results can be exported and saved into 3 file types:
Excel Report document - A document containing all of the
results and graphs for either Flicker or Harmonics.
“.CSV file” – A file containing the result data that can be
viewed using “notepad”.
“.N4LIEC” file – A file containing all of the data that can be
recalled into IECSoft using the “Load IEC Test” option on the
welcome screen.
Export Settings:
The Page size of the Excel Reports can be set to the following:
A4 – Standard A4 size for the UK and Europe.
Japanese A4 Option 1 – Required for use with Japanese Excel
version 2013 and later.
Japanese A4 Option 2 – Required for use with Japanese Excel
version 2010 and earlier.
Letter – Letter style format.
Number format:
The number format can be selected from:
Standard (default), Engineering or Scientific.
3-phase Testing:
For the results of 3-phase testing the user can create an Excel
report for each of the 3 phases or choose to create a report for
only one or two of the phases.
Single worksheet option:
Normal Excel reports contain several tabs but if this option is
selected the pages will all be created on a single worksheet.
Make Excel Document read-only:
Normal Excel Reports are created as Read Only documents but
if this option is de-selected the Excel document can be edited
at a later date.
6.1.2 Exporting Results to an Excel document.
If not done so already click on the Data Export button to
display the Export settings window shown in section 6.1.1.
Select “Export to Excel” and choose the other settings
described above.
-Non–Editable Documents.
When you click on the file location box the “Choose File
Location” window (see next page) is displayed.
Select the location to where you want the file to be stored.
You will see that IECSoft automatically gives the file a name
based on the date and time. Either keep this file name or
delete it and enter a new file name. Click Save which will close
the window and then click on OK in the Export window. The
following message will be displayed for a short period.
The file will then be stored to the requested location and will
also open up on the PC.
Note: If you click on OK without entering a file location the
following error message is displayed. Click on Ok and enter the
file location as described above.
-Excel documents that have been made editable.
In the Export window remove the tick from the “Make Excel
document read-only” option. Click on Ok, the Excel file will then
open on the PC.
Note: This file is not automatically saved so the user must save
the file once any editing is complete.
6.1.3 Harmonics dB / Loss Factor Graph Option.
When exporting Harmonic test results it is possible to include
and additional graph displaying Loss factor (With respect to the
fundamental current component) in Decibels for all of the
harmonics.
To select this option place a tick in the “Add dB Graphs” box on
the harmonic Export window.
The Loss factor graph is then included in the exported
Fluctuating Harmonics Report. The graph can be found at the
end of the results and graph on the Harmonic Results tab of
the report.
6.1.4 Exporting to a “.CSV” file.
Click on “Export to .CSV”. The following window will open:
Using the instructions in section 6.1.2 enter a file location and
change the filename if required. Click on OK to save the file in
“.CSV” format to the requested location.
6.1.5 Exporting to an “.N4LEIC” file.
Click on “Export to .N4LEIC”. The following window will open:
Using the instructions in section 6.1.2 enter a file location and
change the filename if required. Click on OK to save the file in
“.N4LEIC” format to the requested location.
6.2 Recalling & using stored Configuration & Result files.
Configuration settings can be recalled into IECSoft using stored
configuration files (.IECFG files). Sections 4.1 and 5.1.1 to
5.1.4 describe how to create the configuration files.
Result files can be recalled into IECSoft and then viewed using
stored result files (.N4LEIC). Section 6.1.5 describes how to
create the result files.
There are two methods of recalling the “.IECFG” configuration
and “.N4LEIC” Result files. These are
1) Using the IECSoft Welcome screen.
2) Using Drag “n” drop.
6.2.1 Using the Welcome Screen.
To Load Configuration Files.
To load a stored “.IECFG” Configuration file click on “Load IEC
Config”. Double click on the file once it is located on the
computer. The configuration settings will then be recalled into
IECSoft and the “Connect to AC Source” dialog will be
displayed. Click NEXT to connect to the instrument and perform
the tests.
To Load Result files.
To load a stored “.N4LEIC” Result file click on “Load IEC Test”.
Double click on the file once it is located on the computer. The
following message window appears:
Click on “No” and the Realtime window will appear displaying
the save results. The software will not be connected to the
instrument but the user can view the saved Flicker or Harmonic
results in the various formats and export the results again if
required.
Click on “YES” and the connection window is displayed:
Select the required Interface option and ensure the instrument
is set to the same option. For LAN interface click on search and
select the IP address of the instrument. For Serial and USB
select the appropriate COM Port. For serial interface
connections only ensure the Baud Rate in the connection
window and on the instrument are set to 19200.
The Flicker or Harmonic Test results are then recalled into
IECSoft and displayed in Real Time view mode. The graphs and
results table can be viewed by selecting the viewing option on
the menu along the base of the window.
To run an additional Harmonic test click on the “Add Test”
button. The software will then run another harmonic test and
then include the results with the previously save results.
In Flicker mode click on “clear” to reset the flicker window.
Click on start to run the test using the previous settings.
6.2.2 Drag “n” drop.
The shortcut for the link to the IECSoft “.exe” file can be stored
on the PC desktop.
Drag an “.IECFG” Configuration file across the IECSoft Icon.
IECSoft will then automatically start up and load the
configuration settings from the stored file. The “Connect to AC
Source” dialog will be displayed. Click NEXT to connect to the
instrument and perform the tests.
Drag an “.N4LEIC” Result file across the IECSoft Icon. IECSoft
will then automatically start up and display the “continue”
message. The procedure described in section 6.2.1 can be
followed to continue testing or view the saved results.
6.3 Clearing the IECSoft file storage area on PC’s.
When the results for a flicker or Harmonics test are exported
into an Excel document, copies of the graphs created for the
reports are also stored on to the PC.
The storage area can be found at:
My pictures / N4L / IECSoft.
Users may want to periodically clear this storage area as the
folder size can become rather large especially on PC’s
dedicated to running IECSoft software.
Note: The graphs in this storage area that are associated with
any Excel report that the user wishes to keep should be
retained. Otherwise they will disappear when the report is next
loaded into Excel.
If the N4LEIC file was retained for the test associated with the
report then it is possible to re-export the data to create a new
report and graphs.
Appendix A - Excel Flicker Results Report – Front sheet.
Excel Flicker Results – Inrush.
The running average is calculated from the Dmax results in the
previous column. The value is the average of the Dmax results
for that test number and all previous tests, with the exclusion
of the highest and lowest Dmax results which are highlighted in
red and blue in the above table.
E.g. in the above table the “running average” for test 24 is the
average value of Dmax for tests 1, 3-16 and 18-24.
Excel Flicker Results – Flicker.
Excel Flicker Results – PLT Graph.
Appendix B - Excel Harmonics Results Report
– Front Sheet.
Excel Harmonic Repeatability Test Results.
Excel Harmonic Test Results.
Excel Harmonics Graph.
Excel Harmonic dB / Loss Factor Graph.
Excel Source Harmonic Test Results.
Excel Source Harmonics Graph.
Excel Harmonic WFA Test Results.
Appendix C – PPA Screenshots
The following are screenshots that indicate the PPA display
during Flicker and Harmonic tests. In this example a PPA5530
was used.
The following 2 screenshots show the PPA display during Flicker
testing. The first when the test was still running and then on
successful completion of the test. Should the test fail then a fail
message would be displayed.
The following 2 screenshots show the PPA display during
Harmonic Testing. The first when the test was still running and
then on successful completion of the test. Should the test fail
then a fail message would be displayed.
Appendix D – Welcome Dialog Icons.
IECSoft Debug Mode.
This is an additional mode that the user might be asked to use
by our Technical Support staff. Should a user suffer technical
difficulties the data file created contains additional information
to aid the investigation of the problem.
When IECSoft is first opened, tick the box highlighted above by
the red arrow. A window will then open asking the user to
select a location to save the file. Choose a suitable location; a
text file will be created called “IECSoft_comms”. Then just
continue to use the software in the usual way.
IECSoft Information Icon.
Clicking on this icon displays details of this version of IECSoft.
Website Support Link
Clicking on this icon opens a link to the Support Resources
Section Of the Newtons4th Ltd website.
Appendix E – Definitions.
The section contains definitions for the following:
Tmax and d(t).
Dmax.
Short Term Limit (STL) Exception.
Partial odd Harmonic (POHC) Exception.
Tmax and d(t)
The parameter Tmax is an abbreviation for “t d(t) > 3.3%”. At
the end of the test it is the largest value of “t d(t) > 3.3%”
which is tested against the limit.
So if there are two changes between steady states (see table
C.2 on p31 of BS EN 61000-3-3:2013) dt is the sum of the two
of them; but if there are two changes separated by periods of
steady state then it is the larger dt value which is reported.
The Standard BS EN 61000-3-3:2013 describes Tmax and d(t)
as follows:
“Tmax maximum time duration during the observation period
that the voltage deviation d(t) exceeds the limit for dc
Note 1 to entry: During a voltage change characteristic the
time duration Tmax is accumulated until a new steady state
condition is established.
Note 2 to entry: The Tmax limit evaluation in this standard is
generally intended to evaluate the inrush current pattern of the
equipment under test. Thus, as soon as a new steady state
condition is established, the Tmax evaluation is ended. When a
new voltage change occurs that exceeds the limit for dc, a new
Tmax evaluation is started. The maximum duration that d(t)
exceeds the limit for dc for any of the individual Tmax
evaluations during the observation period, is used for the
comparison against the Tmax limit, and is reported for the test”
Dmax
The standard BS EN 61000-3-3:2013 describes Dmax as
follows:
– the maximum relative voltage change dmax is expressed as a
percentage of the nominal voltage.
Section 5 Specifies the limits as:
– the maximum relative voltage change dmax, shall not exceed
a) 4 % without additional conditions;
b) 6 % for equipment which is:
– switched manually, or
– switched automatically more frequently than twice per day,
and also has either a delayed restart (the delay being not less
than a few tens of seconds), or manual restart, after a power
supply interruption.
Short Term Limit (STL) exception.
In the IEC61000-3-2 standard, section 6.2.3.4 defines an STL
exception as:
The average values for the individual harmonic currents, taken
over the entire test observation period shall be less than or
equal to the applicable limits.
For each harmonic order, all 1,5 s smoothed r.m.s. harmonic
current values, as defined in 6.2.2, shall be either:
a) less than or equal to 150 % of the applicable limits, or
b) less than or equal to 200 % of the applicable limits under
the following conditions, which apply all together:
1) the EUT belongs to Class A for harmonics;
2) the excursion beyond 150 % of the applicable limits
lasts less than 10 % of the test observation period or in
total 10 min (within the test observation period),
whichever is smaller, and
3) the average value of the harmonic current, taken over
the entire test observation period, is less than 90 % of the
applicable limits.
Harmonic currents that are less than 0,6% of the input current
measured under the test conditions, or are less than 5mA,
whichever is greater, are disregarded.
This means that the harmonic values for class A need to be:
less than 150% (this is a MAX pass, no matter what) OR less
than 200% for less than 10% of the test (MAX:10 mins) AND
for the average for that harmonic to be less than 90% of the
limit. (The STL Exception).
Partial odd harmonic Exception (POHC).
In the IEC61000-3-2 standard, section 6.2.3.4 defines a POHC
exception as:
For the 21st and higher odd order harmonics, the average
value obtained for each individual odd harmonic over the full
observation period, calculated from the 1,5 s smoothed r.m.s.
values according to 6.2.2, may exceed the applicable limits by
50 % provided that the following conditions are met:
• the measured partial odd harmonic current does not exceed
the partial odd harmonic current which can be calculated from
the applicable limits;
• all 1,5 s smoothed r.m.s. individual harmonic current values
shall be less than or equal to 150 % of the applicable limits.
NOTE: These exemptions (the use of the partial odd harmonic
current for the average values and the 200 % short
term limit for single 1,5 s smoothed values) are mutually
exclusive and cannot be used together.
Essentially meaning the AVERAGE harmonics values for Class A
can exceed the 100% limits provided that:
a) The Partial Odd Harmonics Current value of the odd
harmonics from the 21st onwards (21, 23, 25, 27 … 39)
does not pass the POHC limit.
b) No individual average passes 150% of that Harmonic’s
limit.
Section 3.16 of the standard states that the POHC value is
calculated as follows:
Where “In” is the current value (I) of the harmonic (n)
Partial Odd Harmonic Current is calculated from the Current
Values, Partial Odd Harmonic Current Limit is calculated from
the Limit Values in Table 1 (Class A) in section 7.4
The STL Exception and POHC exceptions cannot occur at the
same time. This is because for a POHC exception the average
needs to be over 100% whilst a STL exception requires it to be
below 90%.
Appendix F – IEC61000 Source Limits.
This section contains extracts the “standards” used to calculate
the limits for the testing of source harmonics.
BS EN 61000-3-2:2014. Equipment input current < 16A per
phase.
Section A.2.c. Supply source.
The harmonic ratios of the test voltage (U) shall not exceed the
following values with the EUT connected as in normal
operation:
-0,9
-0,4
-0,3
-0,2
-0,2
-0,1
%
%
%
%
%
%
for
for
for
for
for
for
harmonic of order 3;
harmonic of order 5;
harmonic of order 7;
harmonic of order 9;
even harmonics of order from 2 to 10;
harmonics of order from 11 to 40.
BS EN 61000-3-12:2011. Low voltage Systems. Input
Current >16A and <75A.
Section 7.1. The supply source shall meet the following
requirements:
The harmonic ratios of the output voltage U in no-load
condition shall not exceed:
⎯
⎯
⎯
⎯
⎯
⎯
1,5 % for harmonic of order 5;
1,25 % for harmonics of order 3 and 7;
0,7 % for harmonic of order 11;
0,6 % for harmonics of order 9 and 13;
0,4 % for even harmonics of order 2 to 10;
0,3 % for harmonics of order 12 and 14 to 40;
Note: The above limits were also used for JIS testing
with and input current > 20A.
JIS C 61000-3-2: 2011. Input Current <20A.
A.2.c. Power supply for measurement.
The voltage ratio to fundamental harmonic included in the
power supply for measurement shall not exceed the following
values with the EUT connected as in normal operation:
-0.9%
-0.4%
-0.3%
-0.2%
-0.2%
-0.1%
for
for
for
for
for
for
harmonic of order 3
harmonic of order 5
harmonic of order 7
harmonic of order 9
even harmonics of order from 2 to 10
harmonics of order from 11 to 40
Appendix G
IEC61000-11 - References to Ztest & Zref.
3.3 Conditional Connections.
Connection of equipment which requires the user’s supply at
the interface point to have an impedance lower than the
reference impedance Zref in order that the equipment
emissions comply with the limits in this standard.
NOTE Meeting the voltage change limits is not the only
condition for connection; emission limits for other phenomena
such as harmonics, may also have to be satisfied.
6. Suffixes and their applications.
Zsys is the modulus of the impedance of the system to which
the equipment may be connected in order to meet a particular
limit. A number after the subscript identifies a particular
calculation.
Zref is the reference impedance.
Zact is the modulus of the actual impedance of the supply
existing at the interface point.
Zmax is the modulus of the maximum value of the supply
impedance at which equipment meets all the limits of this
standard.
Ztest is the modulus of the test circuit impedance at which the
emission test is performed and dctest, dmax test, Pst test and Pit
test are measured values.
6.1.1 Test impedance – Ztest
The test impedance Ztest may be lower than Zref, particularly
for equipment having a rated input current >16 A. To find the
optimal test impedance, two conditions shall be met.
– firstly, the voltage drop, _U, caused by the equipment shall
be within the range 3 % to 5 % of the test supply voltage;
– secondly, the ratio of inductive to resistive components of
Ztest given by Xtest / Rtest shall be within the range 0,5 to 0,75
(i.e. similar to the ratio of the components of Zref).
NOTE The 3 % to 5 % condition ensures that the relative current changes
of the equipment in the real network
situation will be nearly the same as those during the test.
6.1.3 Evaluation against Zref
If Ztest is not equal to Zref, the measured values shall be
recalculated using the following formulae:
The values dc, dmax, Pst, Plt are similar to those which would be
obtained by measurements using Zref as the conditions placed
on Ztest in 6.1.1 ensure that the modulus values of Z test and Z
ref are approximately "in phase" and that the measured
voltage, Pst and Plt values can be converted to equivalent
values with reasonable accuracy by multiplying them by the
ratio:
Provided that the conditions for dc and dmax are met with Ztest,
d(t) shall be deemed to be satisfied.
6.2.2 Calculation of the maximum permissible system
impedance.
The following evaluation procedure shall be applied if the
equipment emissions cannot meet the technical requirements
of IEC 61000-3-3 and therefore the equipment cannot be
declared compliant by the manufacturer in accordance with
6.2.1. In such a case the equipment shall only be connected to
a supply having a system impedance lower than Zref.
To calculate the lower system impedance, Zsys, the values of
dc, dmax, Pst and Plt calculated according to 6.1.3 shall be used
in the following formulae.
For manual switching:
The minimum of the four calculated values of Zsys is the
maximum permissible system impedance, Zmax which the
manufacturer shall declare in accordance with clause 4.
In consideration of voltage changes caused by manual
switching, it is only required to calculate Zsys1 and Zsys2; Zmax
is the minimum of the two values.
Provided that the conditions for dc and dmax are met with Ztest,
d(t) shall be deemed to be satisfied.
Appendix H – Help and Assistance.
If you require any further assistance with the operation of
IECSoft please do not hesitate to contact your local distributor
or N4L on [email protected]