1
AUTOMATION OF SEMICONDUCTOR
PROCESSING EQUIPMENT
by
VIJAY VUPPALADADIUM, B.E.
A THESIS
IN
ELECTRICAL ENGINEERING
Submitted to the Graduate Faculty
of Texas Tech University in
Partial Fulfillment of
the Requirements for
the Degree of
MASTER OF SCIENCE
IN
ELECTRICAL ENGINEERING
Approved
August, 1999
/}M-
37Z.
ACKNOWLEDGEMENTS
CM-^-
f
I am deeply indebted to my advisor, Dr. Micheal Parten, for his most valuable
guidance and colossal support during my education at the Texas Tech University. Thank
you for being patient and understanding. I thank Dr. David Mehrl and Dr. Sunanda
Mitra, thesis committee members, for their excellent cooperation and interest in this
project. A special thanks to the Department of Electrical Engineering for giving me this
valuable opportunity to study at Texas Tech University.
I wish to extend my deepest gratitude to my grandparents, Mr.Nageshwara
Sharma and Mrs. Padmavati, my parents Mr. Venkat Rathnam and Mrs. Meena Kumari,
for their love, encouragement and blessings throughout my entire life. I thank my little
sister, Sirisha, for her affection and well wishes.
I would like to thank my uncle Dr. Naga S.Bushan and my aunt Mrs. Jyothi
Bushan for their guidance and encouragement during my stay at Lubbock.
I am extremely thankful to Mr. Amit Deshpande, and Mr. Vishal Agrawal for their
timely help. A special thanks to Mr.Tasnim Murad Hossain for his help and cooperation.
Finally, I thank all my friends for their support, encouragement, and well wishes.
Thanks for the memorable moments and friendship.
n
r'^n^V\-
TABLE OF CONTENTS
ACKNOWLEDGEMENTS
ii
ABSTRACT
vi
LIST OF TABLES
vn
LIST OF FIGURES
viii
CHAPTER
I.
INTRODUCTION
1
IL
APPROACH FOR AUTOMATION
5
2.1 Introduction
5
2.2 Approach and Requirements
6
2.2.1 DAQ (Data Acquisition) Boards
7
2.2.2 External Interface Boards
8
2.2.3 Lab VIEW Control Program
9
2.3 An Approach to Control Program
10
2.3.1 Setup stage
11
2.3.2 Monitor Stage
17
2.3.3 Shutdown Stage
18
2.4 Flow of Data
m.
18
IMPLEMENTATION OF AUTOMATION APPROACH ON A
PLASMA ETCHER
21
3.1 Introduction to the Plasma Etcher
21
3.1.1 Process Chamber
23
111
a'^^c
3.1.2 Chamber Housing
23
3.1.3 Upper Electrode
25
3.1.4 Substrate Plate
25
3.1.5 RF generator
25
3.1.6 Plumbing System
26
3.1.7 Gas System
27
3.1.8 Vacuum System
30
3.1.9 Pressure Monitoring System
31
3.1.10 Power Supplies
31
3.1.11 Optical Setup
31
3.2 DAQ Boards Used For Plasma Etcher
IV.
34
3.2. lMetrabyteDDA-06 Analog Output Board
34
3.2.2 National Instmments PC-LPM-16 Analog Input Board
35
3.3 External Interface Board
38
3.4 RF Tuning Network
39
3.5 LabVIEW Control Program for the Plasma Etcher
41
3.5.1 Setup Stage
43
3.5.2 Monitor Stage
54
3.5.3 Shutdown System
58
IMPLEMENTATION OF AUTOMATION APPROACH ON A
PLASMA DEPOSITION SYSTEM
61
4.1 Introduction to the Plasma Deposition System
61
4.1.1 Gas and Compressed Air system
IV
65
4.1.2 Vacuum System and Reactor
65
4.2 Lab - PC+ DAQ Board for the Deposition System
67
4.3 Gas Control System and Sequencer Box
69
4.4 Control Program for Deposition System
71
V.
MEASUREMENTS
74
VI.
CONCLUSION
80
REFERENCES.
.82
APPENDIX
83
ABSTRACT
This thesis describes a methodology to Automate Semiconductor Fabrication
Equipment. The current processing Industry makes use of stand-alone equipment with
built-in Microcontrollers, which are hardcoded or programmed using EPROMs to
accomplish that particular process. The cost of building such systems is expensive.
Automation of these systems is time consuming and difficult. These systems require a lot
of user intervention during processing.
This thesis presents a comprehensive insight into a generic approach of
Automation of a process. A methodology has been discussed to automate a machine
using DAQ (Data Acquisition Boards) and Extemal Interface Boards controlled by
LabVTEW, a graphical programming language tool. This approach of automation is
implemented and verified on two processing systems, namely a Plasma Etcher and a
Plasma Deposition System.
The project explains the specifications of the hardware needed and describes a
modular approach to design the LabVIEW control program. It explains how this
approach can achieve improved process performance by efficient monitoring and
controlling of the process parameters for increased yield and productivity. The
advantages of this methodology of automation are discussed along with applications.
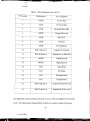
VI
LIST OF TABLES
3.1
Optical Emission Lines For Endpoint Detection
33
3.2
Pin Configuration of DDA-06 Analog output Board
36
3.3
Pin Configuration ofPC-LPM-16 Analog Input Board
37
3.4
Gas Number Assignment
51
3.5
Equations for Gases
57
4.1
Pin Configuration of Lab-PC+.
.68
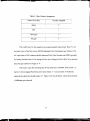
5.1
Setpoint and Runtime Values for Pressure
74
5.2
Setpoint and Runtime Values for the Mass Flow Controllers
75
vu
LIST OF FIGURES
2.1
Block diagram of an automated system
5
2.2
DAQ Boards (a) D/A DAQ Board (b)A/D DAQ board
7
2.3
Extemal Interface Board
8
2.4
Different stages of setup stage
12
2.5
Example to show bundling and CASE selection
13
2.6
Writing a value to an output port
14
2.7
Analog Number Out.vi
15
2.8
Analog Output Update Chanel.vi
15
2.9
Writing a value to a Digital Port
16
2.10
Digital Out.vi
16
2.11
write to digital port .vi
16
2.12
VI used to read in an Analog Input
17
2.13
VI used to read Digital Input
18
2.14
Flow Chart of Process Control
20
3.1
The automated Plasma Etcher System
22
3.2
Cross Section of Process Chamber
24
3.3
RF Generator
28
3.4
Plumbing System
29
3.5
Mass Flow Assembly
30
3.6
Optical Setup
32
3.7
Diagram of operation of DDA-06
35
viu
3.8
Diagram of operation of PC-LPM-16
35
3.9
Extemal Interface Boards
38
3.10
Tuning Network
40
3.11
Control Program Flow Chart
42
3.12
Front Panel of Plasma Etcher Program
44
3.13
Different Frames of the Setup stage
45
3.14
Frame for the Timer
46
3.15
Gas Selection VI (a) Front Panel (b) Block Diagram
47
3.16
Pressure and Time selection screen
48
3.17
Frame No.'O' of the Initialize System.vi
48
3.18
Frame Number ' 1' of the Initialize System.vi
49
3.19
Setting of Gas Flow Rates and Activation of Solenoids
50
3.20 Binary Values for Gras Solenoids
52
3.21
Frame Number'3'
53
3.22
Monitor Stage
55
3.23
Acquire Runtime Data.vi
56
3.24
Diagram of Validate Data.vi
57
3.25
Shutdown System.vi
58
3.26
Purging with Nitrogen
59
3.27
Control Program.
60
4.1
Deposition System
62
4.2
Plasma Depositioner Assembly
63
4.3
Electrical Cabinet
64
IX
4.4
Radial Flow of Gas
66
4.5
Operation of Lab PC+
67
4.6
Gas Control System
70
4.7
Gas selection.vi
71
4.8
Pressure Initialization
72
4.9
Frame no ' 1' of Initialize System.vi
73
5.1
The front Panel when the parameters are stabilized
76
5.2
Pressure Stabilization
77
5.3
Flow Rate Stabilization
78
5.4
Spectrometer Reading
79
A. 1 Mass Flow Controller Wiring Diagram
84
A.2
85
Gas Control Circuitry
CHAPTER I
INTRODUCTION
Growing technological requirements and the widespread acceptance of
sophisticated electronic devices have created an unprecedented demand for large-scale,
complex, integrated circuits. Meeting these demands has required technological advances
in materials and processing equipment, and an increased emphasis on effectively utilizing
the computer to aid the process of manufacturing integrated circuits.
The IC manufacturing process involves many physical and chemical processing
steps such as; oxidation, photolithography, epitaxy, ion implantation, chemical vapor
deposition, etching and diffusion. To create an IC, these processes have to be repeated
many times [1]. IC fabrication requires the use of electromechanical, optical and
electronic equipment and materials capable of precisely maintaining close tolerances and
small geometries.
VLSI processing requires that the process parameters, like gas flow rates, pressure
and RF power be tightly monitored and controlled. In any typical fabrication equipment
with minimal automation, the process parameter settings have to be controlled manually.
Any changes in process parameters leads to variation in the results that are unacceptable
for sub micron device geometries. Manual control of process parameters and equipment
may induce errors that are cost prohibitive in todays wafer labs.
As wafer size increases and the critical dimensions decrease, stringent
requirements are imposed on processing. It is desirable to process every wafer under
identical conditions. Process yield has increased wdth the evolution of single wafer
•^KiRmHBrv
1 ^ ^ ^ " - "
processing systems that are fast replacing batch reactors where several wafers are
processed together. Due to the nature of single slice processing, machine dynamics may
change from second to second and from wafer to wafer. It becomes necessary to monitor
all the run time data such as pressure changes, flow rate changes, RF power, and other
parameters.
With changing technology, newer recipes for processing are developed at
increasing frequency for smaller device sizes and to increase the yield. The fabrication
systems must be able to implement the new recipes without many changes in the system
setup. Hence for a successful, high yield process, automation and control of
semiconductor fabrication equipment is necessary. With the evolution of single wafer
processing systems and using microprocessor-based hardware and software, real time
monitoring and control systems have been developed to ensure that wafers are processed
properly at every step. An automated wafer fab increases productivity and cycle time
through manufacturing by as much as 50% and reduces the cost of manufacturing and
labor.
The current processing industry makes use of automated equipment for each
process. The processes use stand-alone equipment with built-in microprocessors or
application specific microcontrollers, which are hardcoded or programmed to accomplish
that particular process. If equipment for an other process has to be automated then again a
process of designing an entire stand-alone system takes place. The disadvantages of using
such systems are: they are expensive to manufacture; it consumes a lot of time to
program the devices for such systems; and the user has little control of the internal
system. In todays rapidly changing environment, manufacturers want to be able to
improve the processes continually. This can require being able to alter the monitoring and
control of the individual process. To accomplish these changes, a generic approach for
monitoring and control of processes and equipment is desired. The main emphasis of this
work is to develop a methodology for automatic monitoring and control of fabrication
equipment using readily available hardware and software while still providing tight
control over the process parameters for increased yield and productivity.
The challenge is to achieve improved processing performance by monitoring and
controlling parameters using readily available and modifiable systems. This can be done
by using a data acquisition (DAQ) and control system with LabVIEW, a graphical
programming language (GUI) tool. Data acquisition is the process of bringing a real
world signal, such as voltage, into the computer for processing, analysis, storage or other
manipulation. Each process is characterized by certain parameters like gas flow rate,
pressure inside the chamber, temperature and RF power. Using a PC- based DAQ and
control system run by LabVIEW, it is possible to control the equipment with a hardware
and software system that can be easily understood and modified.
LabVIEW can command DAQ boards in the computer to read analog input
signals (A/D conversion), generate analog output signals (D/A conversion), read and
write digital signals. So using a data acquisition system and generic LabVTEW code, that
can be easy modified, automation of equipment for any process can be implemented
instead of using embedded devices and stand alone automation.
The advantages of such a generic approach are that system monitoring and control
are easier to understand and modify because of LabVTEW's flexibility and ease of
programming. Excellent control can still be maintained, over process parameters because
of the real-time feedback control system. This system can be implemented without losing
the integrity and the safety parameters of the equipment.
This generic approach, i.e., using LabVIEW controlled DAQ system for
automation, has been realized and implemented on two semiconductor processing pieces
of equipment, namely, a Plasma Etcher and a Plasma Deposition system. The
methodology, results and applications are discussed in the ongoing Chapters.
Chapter n explains the approach for Automation. It discusses the requirements of
DAQ Boards and Extemal Interface Boards, along with the tools that have to be used in
automation.
Chapter m explains the implementation of the Generic approach on a Plasma
Etcher and Chapter FV explains the implementation of the approach on a Plasma
Deposition System. Both the chapters explain the DAQ Boards Used, their specifications,
and the design of extemal interface boards. The LabVIEW code used for automation is
also explained in both the chapters. Chapter V discusses the Measurements taken. Chapter
VI discusses the merits of such an automation approach and its applications.
' ^
CHAPTER II
APPROACH FOR AUTOMATION
2.1 Introduction
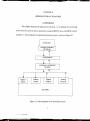
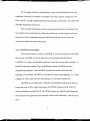
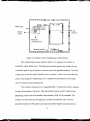
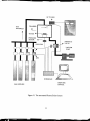
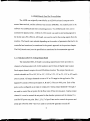
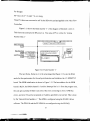
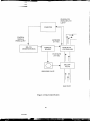
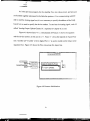
This chapter discusses an approach to automate, i.e. to enhance the monitoring
and control of a process and its parameters using an IBM-PC and a LabVIEW control
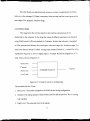
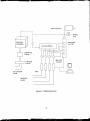
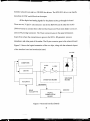
program. A block diagram of a general processing system is shown in Figure 2.1.
COMPUTER
LabVIEW CONTROL
PROGRAM
DAQ BOARDS
EXTERNAL INTERFACE
BOARDS
jm
Digital
Inputs
Analog
Inputs
Digital
Outputs
Analog
Outputs
MACHINE
Figure 2.1 Block diagram of an automated system.
A processing machine may require digital input signals or analog input signals
from the computer and it can send out digital signals or analog signals or both, back to
the computer. Digital signals are used to control the energizing of components like
solenoids and relays on the machine. Analog inputs to the machine may be setpoint
vohages to throttle valve controllers, or mass flow controllers (MFCs). Analog outputs
from the machine can be feed back signals like gas flow rates from MFCs or signals from
other transducers. An example of digital input signal to the computer is a set point from a
temperature sensor.
2.2 Approach and Requirements
To properly control the process, an interface is needed to allow the computer and
machine to communicate with each other efficiently without making many modifications
to the machine. LabVTEW is an excellent GUI software tool that can be used as a control
program. The first step in developing a controller is to determine the parameters that need
to be controlled. The corresponding components on the machine, must be identified
along with their voltage and current specifications, like MFCs for gas flow rate, throttle
valve controllers to control pressure in the chamber of a processing equipment, solenoids
and their voltage ratings, etc.
The signals sent out by the computer are digital but the machine may accept
analog and/or signals. At the same time, the machine sends analog and/or signals as
inputs to the computer. Therefore, DAQ (data acquisition) boards that have the capability
to do D/A (Digital to Analog) conversion and A/D (Analog to Digital) conversion are
needed.
MJWI
OTHHI
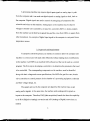
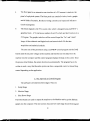
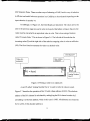
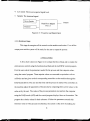
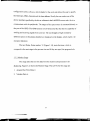
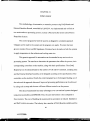
2.2.1 DAO (Data Acquishion) Boards
The D/A DAQ board must accommodate the right number of D/A channels with a
good bit resolution, sampling rate and extra lines of digital input/output. The D/A
channels are used to control the analog inputs to the system. The extra lines of digital
outputs are used to control the energizing of components like solenoids and relays. Figure
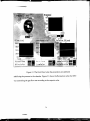
2.2 (a) shows the diagram of operation of a D/A board. The A/D DAQ board is used to
read in the analog input signals into the computer. It should have the right number of A/D
channels to accommodate all the parameters that affect the process. Figure 2.2 (b) shows
the diagram of operation of an A/D board.
1
Set Point Values
From LabVIEW
Software
k.
w
D/A Board
•
^
Analog
Channels
Digital Ports
Voltages
(a)
Values Displayed On the
Analog
Input Signals
A/D Board
CnmniitP.r
(b)
Figure 2.2 DAQ Boards (a) D/A DAQ Board (b) A/D DAQ board
The DAQ boards should have an option for the user to select the voltage ranges of
incoming and outgoing signals to some degree.
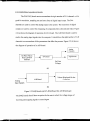
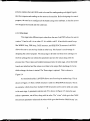
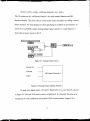
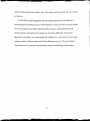
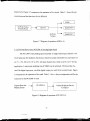
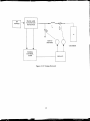
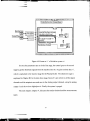
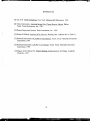
2.2.2 External Interface Boards
In most cases, the signals sent out by the computer are 5 volts or maximum of 10
volts. But a machine may use components like solenoids and relays, which operate at a
DC or AC voltage that is far greater than TTL voltages and currents provided by DAQ
boards. Hence, to energize these switches and high voltage rated components on the
machine, and to buffer the DAQ card signals, an extemal interface board, is needed. The
driver circuits for the interface should be designed taking the specifications of the
components on the machine into consideration. Figure 2.3 shows the data flow.
Computer with
LabVIEW Program
SOLENOIDS,
RELAYS,
TRANSDUCERS
V^
DAQ Boards
Driver Circuit
INTERFACE BOARD
SETPOINTS
READ
PARAMETERS
1
SIGNAL
TERMINATION
BOARD
r^
Signals from other
comiDonents
Figure 2.3 Extemal Interface Board
GROUND
mm^
A\\ the signals should be routed through a signal termination board to avoid the
complexity of wiring. For example, the computer can send a setpoint voltage to a Mass
Flow controller through a signal termination board and also read the flow rate value from
that MFC through the same board.
With this kind of hardware setup, the communication between the computer and
the machine can be established very efficiently and the user will have tight control over
the process. With the interface found and DAQ boards selected, the next step is to
develop the software to control the process.
2.2.3 LabVIEW Control Program
The control program is written in LabVIEW. It controls the parameters that effect
the process. LabVIEW is short for Laboratory Virtual Engineering Workbench.
LabVIEW is a program development application, much like commercially available C or
BASIC development systems. The only difference between LabVTEW and other
programming languages is that LabVIEW is graphical in nature, while the other
languages are text based. LabVTEW uses a graphical programming language, G, to create
programs in a flow chart like form, eliminating a lot of syntactical details [4].
LabVIEW is a powerful and very flexible instmmentation and analysis software
system that runs on PCs, Apple Macintoshes, Sun SPARC stations and HP 9000/700
series workstations running HP-UX. LabVTEW programs are called Virtual Instruments
(Vis), because their appearance and operation imitate actual instmments. It has two main
parts:
rsass
a.
The front panel is an interactive user interface of a VI, because it simulates the
panel of a physical system. The front panel can contain Switches, knobs, graphs
and all kinds of numeric. Boolean or string controls (user input) and indicators
(resuh of program).
b.
The block diagram is the VTs source code, which is designed using LabVTEW's
graphical tools. A VI can have a number of sub Vis which are like Functions in a
C Program. The graphic tools have all the control loops like "for" and "while"
loops, all the arithmetic and logical tools and some in-built Vis for data
acquisition and statistical analysis.
The user sets all the parameters using a LabVIEW control program and the DAQ
boards send the set point voltages to the machine and feed the mn time data from the
machine into the computer and the control program displays the data on the screen. Once
the process time finishes, the system shut downs automatically. The program has to be
written in such a way, that the entire system can have a sequential control or closed loop
control depending on the application.
2.3 An Approach to Control Program
The software is divided into three stages. They are:
1. Setup Stage,
2. Monitor Stage,
3. Shut Down Stage.
The DAQ boards are used to output the setpoints to the Machine and to get the fedback
signals into the computer. The next section discusses how each stage should be designed
10
and also explains the LabVTEW tools to be used for reading analog and digital Signals
into the computer and sending out the same to the machine. Before designing the control
program, the user has to configure all the boards using driver software, so that the system
can recognize the boards and their addresses.
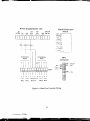
2.3.1 Setup stage
This stage takes different input values from the user. LabVIEW allows the user to
create a VI and to call it in an other VI. It is called a subVI. It has inbuilt control loops
like WHILE loop, FOR loop, CASE stmcture, and SEQUENCE stmcture. LabVIEW
allows the user to use one loop inside an other loop. This feature is an advantage in
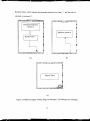
designing the control program. The setup stage is divided into three more substages. In
the first substage the user selects the parameters and sets the values along with the
process time. These values are bundled and passed onto the next stage, where the DAQ
boards are initialized and the values are written to the output Ports (substage 2). In the
third substage, the timer is started. The Timer stage is optional. This is shown in
Figure 2.4
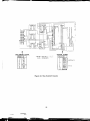
As mentioned earlier, LabVIEW allows use of one loop in another loop. This is
shown in Figure 2.5. Here a CASE stmcture is used in a SEQUENCE stmcture. This is
an example, which shows how multiple CASE stmctures can be used to send out values
to the next stage. A parameter selection sub VI is shown in Figure 2.5 where the user
selects a parameter, out of four, along with its value. The "wires" which go to the CASE
structure are parameter values and the wires which go to the ftinction 'Build Array' are
11
Boolean values, which indicate the parameter selected by a binary " I' and the one not
selected, by a binary'0'.
UiM'f;^ q q P t|^| Q
iQj^^^tiiiMimmm'-
DDDGDDIl^[2[0/1]kPPOPQPO^
Parameter Selection
Screen.vi
Initialize system.vi
Bundle Values
i
mi
[DDDDDDDDDDOn
(a)
i
D P t l D • DC
(b)
'Q'Q'P a o a ' q ^ l 4 [Q 4 ] ^ p o a ' ) f t " a " n " g T
Start the Timer
• Wf . • ri-fT. • - W /
Vrt. . .Ti-f. • • .*rTT , >T^ . VW. • . WT^ , , iV^i , g n r t i i a r f f T • "'^-it-iV[mmm^nmmmwBn'mma^tXaaiitnit
(c)
Figure 2.4 Different Stages of Setup Stage (a) Substagel (b) Substage2 (c) Substage3
12
^jjam
Q U O Q U u
q^^i 0 [ 0 . 4 ] ^ p
TiJ^
Build Array
P a
a
a"~g
:oB
^ • ^ • ^ ^
3t—J*fl
g
^
-•CASE
Boolean
Values
Stmcture
i
Parameter
selection sub VI
i
Bundling of Data
•
g o
D O
g o
l-IB
tJ_fc
^ *
a
g
a
a
•
a
r^iiii
•
p
•
a
o
Figure 2.5 Example to show bundling and CASE selection
Then, these Boolean values which are either lor 0 are given to a ftinction in
LabVIEW, called 'Build Array'. The build array ftinction appends any number of array
or element inputs in top to bottom, to create an array with appended elements. This array
is then given to ftinction called 'Boolean Array to number', which converts this Boolean
array to long integer by interpreting it as 2's complement representation of an integer
with 0
th
element as least significant bit.
This number is then given to a 'Logarithm Base 2' ftinction tool, which computes
the log of the number to the base 2. This final number is given to the CASE structure.
Depending on the value of the number, that particular CASE will be evaluated. The
number of CASE stmctures will depend on, number of parameters used. Then the
parameter number (CASE number) and value are bundled together and advanced into
13
mmmm
next Sequence frame. There are other ways of selecting a CASE, but this way of selection
is efficient and usefial when an operation in a CASE has to be evaluated depending on the
input selection in another VI.
In Substage 2 of Figure 2.4, the DAQ Boards are initialized. The values set by the
user in the previous stage are used to write to the ports. But before writing to the port, the
value must be converted to an equivalent value in volts. This is done using a ftinction
called 'Formula Node'. This is shown in Figure 2.6. The left side of the node has the
incoming value (P) and the right side of the node has outgoing value in volts or millivolts
(PS). The floor ftinction tmncates the value to a decimal value.
D/A Channel #
Base Address
of the D/A
Value of a
parameter
"IPS
PS = floor[
M^^^^m
);
mMMM'^ V^^!^
rmmfmiiiiiiMffi
!:'M' 1" y' y " 1'" "
Analog Number
Out.Vi
Figure 2.6 Writing a value to an output port.
A sub VI called 'Analog Number Out.vi' is used to write the value to a port.
Figure 2.7 describes the operation of this VI with a Base address of H330. The absolute
address of the D/A channel is calculated by multiplying the D/A channel number by 2
and adding it to the base address, which in this case is 330H. All addresses are sixteen bit.
So for a D/A #4 the absolute address is
14
^s
0330H + [(4*2) =008H] = 0338H or 0000 0011 0011 1000 b.
This VI makes use of a 'call library ftinction', that calls standard libraries and DLL
ftinction libraries. The 16-bit value is written at the sixteen-bit address by calling a shared
library ftinction. For some boards, for which specifying base address is not necessary, an
inbuilt VI in LabVIEW, called 'Analog Output Update channel.vi' is used. Figure 2.8
shows the necessary inputs to this VI.
B ase Address [H 33011
^iit§
Ulb
lib
I D / A tt 10-5]
Idul^h
Ulb
i tiife I Error
•Jib
15^
V a l u e [0 - 40951
^^Bf^———Figure 2.7 Analog Number Out.vi
Device No.
Channel
AO Update Channel.vi
Value
Figure 2.8 Analog Output Update channel.vi
To send out a digital signal, a VI called ' Digital Out.vi' is used. This VI is shown
in Figure 2.9. This sub VI is used to write to a digital port. It is basically the same as an
Analog Out.vi with a difference that instead of D/A channel number, integer 0-N is
15
iTj;K.-._
mini w
Base Address of
the DAQ Board
Value to be sent
out. in Binarv
Port No.
Digital Out.vi
10-1001
Figure 2.9 Writing a value to a Digital Port
assigned to each PORT. A binary value is written to a port An example, where base
address is H330 is shown in Figure 2.10. In cases where it is not necessary to specify the
base address, another VI called ' write to digital port .vi' is used. The function diagram is
shown in Figure 2.11
Digital Port
[Base Address [H330]
II »ife II
Error
I Ulb
: i f a l i lb
^
uie
UI b I U I b
II »*^ 1
Byte [HO - HFF1
Figure2.10 Digital Out.vi
Device No.
Channel
Write to Digital
Port.vi
Pattern
Figure 2.11 write to digital port .vi
16
Once the Boards are initialized and values are written to output ports, the Timer
turns on, in the substage 3 (If time is necessary in the process) and the control goes to the
next stage of the program, 'Monitor Stage'.
2.3.2 Monitor Stage
This stage takes the mn time data from the machine and processes it for
displaying on the computer. In this stage the values of different parameters are obtained
using DAQ boards (A/D) and checked for Tolerance. If either the tolerance is exceeded
or if the process time finishes, the control goes to the next stage, the 'shutdown stage'. To
read in the data an inbuilt VI called 'Analog Input Sample Channel.vi', is used. This VI is
explained in Figure 2.12. If it is a digital input, a VI called 'Read from Digital Port.vi' is
used. This is shown in Figure 2.13
Device No.
Channel
AI Sample Channel.vi
Hiffh Limit
Samnle
Low Limit
Figure 2.12 VI used to read in an Analog Input.
The terminals for this VI are:
1. Device No.: the number assigned to the DAQ device during configuration.
2. Channel: The analog channel, which will be used for data acquisition. This is a string
type variable.
3. High Limit: The expected level of the signals.
17
Mi
4. Low Limit: The lowest expected signal level.
5. Sample: The measured signal.
Device Number
Channel
Read From Digital
Port .vi
Pattern
Figure 2.13 VI used to read Digital Input
2.3.3 Shutdown Stage
This stage de-energizes all the controls on the machine and writes 'O's to all the
output ports and the system will be ready for the user to repeat the process.
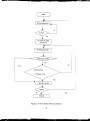
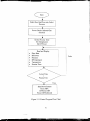
2.4 Flow of Data
A flow chart is shown in Figure 2.14 to depict the flow of data and to explain the
entire process control using the hardware described and the LabVIEW control program.
First the user selects the parameters needed for the process and their setpoint values,
using the control program. These setpoint values are converted to equivalent volts or
millivolts and are given to their corresponding controllers on the machine through the
DAQ boards (D/A). The user sets the timer and the process is started. The controllers on
the machine adjust the parameters of the process by comparing their current value, to the
value set by the user. The values of the process parameters are read into the computer
using the DAQ boards (A/D) and the control program displays them on the monitor. The
program also checks values for their tolerance. If either the parameters exceed their
tolerance value or if the process time finishes, the system is shut down by making the
18
setpoint values going to the machine, zero. The system will be ready for the user to make
an other run.
A LabVIEW program designed using this modular approach will be efficient in
monitoring and controlling a process. With these kind of tools and Vis to send out signals
from the computer and to read in signals into the computer, using DAQ boards and
interface boards, automation of an equipment can be done efficiently. This generic
approach to automation was implemented and verified on two semiconductor-processing
systems, namely a Plasma etcher and a Plasma Deposition System. The next chapters
discuss how the two systems were automated using this methodology of automation.
19
Start
Set the parameters
Set Timer & Start
the process
Read the parameters
No
Shut down system
Yes
FINISH
Figure 2.14 Flow Chart of Process Control
20
SBBBBS^^
CHAPTER m
IMPLEMENTATION OF AUTOMATION APPROACH
ON A PLASMA ETCHER
3.1 Introduction to the Plasma Etcher
An Autoload Single Slice plasma reactor (ASPR) [2], Plasma Etcher, was
originally manufactured by Texas Instruments, Inc. It has the capability of processing a
single slice at one time. It has a non-symmetric parallel plate capacitively coupled planar
reactor, where the power is applied to the top electrode and the bottom electrode is
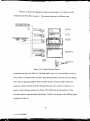
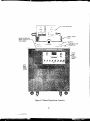
grounded. The discharge is created between these two plates. The ASPR consists of a RF
generator cabinet, Process Chamber, remote vacuum pump and a computer controlled
automation system as illustrated in Figure 3.1. The original monitoring and control
system has been replaced with a PC-based system.
The process chamber provides a controlled process environment for plasma
etching. The chamber consists of an enclosure, powered electrode plate and substrate
plate. The process gases flow from top to bottom through the chamber. The electrical
system of the power supplies, RF tuning assembly, remote RF console, the DAQ system.
The plumbing system provides for the various gases, an exhaust system and chamber
vacuum control. The gases are controlled by Solenoid valves and the amount of gas flow
21
RF TUNING
GAS
MANIFOLD
COMPUTER
CONTROL
GAS SUPPLIES
Figure 3.1 The automated Plasma Etcher System
22
is controlled using mass flow controllers. The by-products during etching are removed by
the exhaust system. The pressure is controlled by software actuation of a throttle valve.
The ASPR was originally designed to be controlled by an ASD/99 A on-board
computer and a manual data terminal. The control software was stored in EPROMs. Thus
the modifications to the control program were time consuming and inconvenient. Hence,
it is interfaced with a PC and DAQ boards which proved to be efficient. Before
discussing the DAQ Boards and interface boards, a brief explanation of the system is
given.
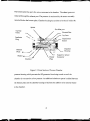
3.1.1 Process Chamber
The process chamber assembly consists of the upper electrode assembly, the
chamber housing and the substrate plate. The process chamber electrode assembly
consists of a parallel plate electrode design with the radial gas flow from the top to
bottom of the chamber. The ion and electron production between the electrodes in the
chamber housing and the gas flow determine the etch characteristics. The upper electrode
is powered by the RF generator, it provides the electrical field between the electrodes that
ionizes the gases to produce the ions and electrons. The cross section view of process
chamber is shown in Figure 3.2
3.1.2 Chamber Housing
The chamber housing consists of the bottom plate, which is the lower enclosing
surface of the process chamber, an optical window, and a window for end point detection.
23
The bottom plate has ports for various accesses to the chamber. Th exhaust gases are
removed through the exhaust port. The pressure is monitored by the sensor assembly
mounted below the bottom plate. Chamber housing has an inlet to let the air inside the
spaces
Gas Inlet port
Top Plate
Clamp
Electrode Plate
Top Cover
Insulator
Ring
Capacitance
Sensor
Chamber
Housing
Bottom
Plate ^
Heater.
Heater
Plate
Insulator
Capacitive sensor
Connector
Figure 3.2 Cross Section of Process Chamber
pressure housing which prevents the RF generator from being turned on until the
chamber is evacuated to a low pressure. An additional aluminum spacer is added between
the bottom plate and the chamber housing to facilitate the addition of an extemal heater
in the chamber.
24
vnn^
3.1.3 Upper Electrode
The feature that separates the ASPR from the conventional parallel plate plasma
reactors is the use of porous, non-flat upper electrode. The multiple process gas enters
through the upper electrode. The upper electrode assembly consists of a number of
spacers fastened together. It is insulated from the rest of the chamber using dielectric
rings. The spacers help in changing the plate to electrode distance.
The process gases enter the chamber through the gas filter block. The gases flow
through the central passage between the spacers and the upper electrode. The upper side
of the electrode has a gas plenum chamber to equalize the flow from multiple orifices.
The gas orifices are radially distributed with greater density towards the center. The
upper electrode is connected to a RF generator through the ASPR tuning network for the
maximum power transfer of power.
3.1.4 Substrate Plate
The substrate plate holds the wafer during the process. A heater can be placed
below the substrate plate to increase the temperature of the wafer.
3.1.5 RF generator
The HFS-1500D RF generator is manufactured by RF Power Products, it has a
maximum output of 1500 Watts at a frequency of 13.56 MHz [2]. The RF generator is
composed of power supplies, an oscillator, a buffer amplifier, a power amplifier and a
tuning network. The oscillator of this generator is a crystal controlled oscillator that
25
drives a buffer amplifier. The buffer stage reduces the effect of loading and also provides
some intermediate amplification. The buffer amplifier drives the power amplifier for
more amplification in the output stage. The RF power is coupled to the reaction chamber
through an automatic RF matching network. The purpose of this network is to provide
compensation for the RF chamber impedance in an attempt to match the chamber load to
the 50 n impedance of the transmission line. A directional coupler is provided at the end
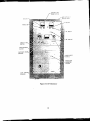
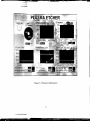
of the PA stage to sense both the incident and reflected power. The front panel of the RF
generator is shown in Figure 3.3.
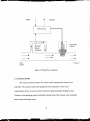
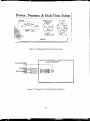
3.1.6 Plumbing System
The plumbing system provides for the gas system, which supplies the process
gases to the chamber, a vacuum system and the chamber pressure monitoring assembly.
Figure 3.4 shows the plumbing system. The flow rate for the process gases are monitored
by the MFCs. The setpoint is an analog signal (0 to 5 VDC) from the D/A board. The
MFC produces an analog signal (0 to 5 VDC) proportional to gas flow, which is read into
the computer through the A/D board. The DAQ boards are explained in later sections.
The process gas is piped in through the floor of the etcher directly to the mass flow panel.
If the solenoid valve is open, the gas flows into the MFC to an air operated bellow valve.
If the bellow valve is enabled, the gas flows through the process gas manifold to another
air-operated valve located on the top of the process chamber. This allows the gas to enter
the chamber. Chamber gases are exhausted through a vacuum pump. The actual flow in
SCCM (standard cubic centimeters per minute) can be read on the computer using
LabVIEW control program.
26
mS^BWSSK
3.1.7 Gas Svstem
The gas system provides for four gases Ar, CF4, H2, O2, which can be used alone
or in a mixture for the etching process. The gases pass through electrically operated
solenoid valves, a mass flow controller (MFC), a normally closed pneumatic bellow
valve, a process gas manifold, and a normally open pneumatic bellow valve on the top of
the chamber. The flow rates of gases are controlled by the MFCs. On entering the MFC,
the gas stream is divided into two parallel paths, one path is directed through the thermal
sensor tube and the other passes through a bypass. The two are rejoined to pass through
the control valve. The bypass forces a proportional flow through the thermal sensor tube.
The thermal sensor converts the gas flow into a voltage.
As shown in the Figure 3.5, the valve, the thermal sensor and the valve controller
form a closed-loop control system. The input signal from the computer varies from 0 to 5
volts, which controls the valve from a fully open to fully closed position. The difference
between the voltage from the thermal sensor and the input signal is used to adjust the
valve position and, thus, the flow rate of the gas.
27
INCIDENT RF
POWER METER
RF OF:
POWER OM
OL RESET
'ST.
PA TUT'INC
AUTO/MAN UAL
SWITCH
LOCAL/REiMOTE
SWITCH
INCIDENT POWER
CONTROL
OSCILLATOR
TUNING
PROCESSOR
OPERATOR
SWITCH
LINE CIRCUIT
BREAKER
Figure 3.3 RF Generator
28
m^
AIR MANIFOLD
O
o
6
PROCESS
CHAMBER
PURGE
GAS
SOLENOID
VALVES
GAS MANIFOLD
o
o
THROTTLE
VALVE
(y Cy CyQ
BELLOW
VALVES
VACUUM
VALVE
yMU.'.M.'.i.i.
.IV
Usm-i;
TO VACUUM
PUMP
MFC
PROCESS
GASES
Figure 3.4 Plumbing System
29
INPUT
OUTPUT
Valve Driver
Q
SOLENOID
VALVE
Thermal
Sensor
Assembly
GAS
INLET
OUTLET
Figure 3.5 Mass Flow Assembly
3.1.8 Vacuum Svstem
The vacuum system consists of a remote vacuum pump and a throttle valve
controller. The vacuum system first pumps down the chamber to remove any
contaminants, then it is used to remove the process gases during the etching process.
Variation in the pumping speed is achieved with the help of the exhaust valve controller
that controls the throttle valve.
30
3.1.9 Pressure Monitoring Svstem
Constant monitoring of the chamber pressure is necessary for the etching process.
This is done by a MKS manometer, which is a pressure transducer and an exhaust vaK e
controller. The MKS manometer converts the pressure inside the chamber into voltage.
This is then compared with setpoint in the exhaust valve controller, depending on the
difference the exhaust valve opens or closes. A vacuum switch allows the MKS
manometer to be exposed to the chamber when the chamber is under vacuum. The
sensitive manometer cannot be exposed to atmospheric pressure, because the diaphragm
may get spoiled, thus making the vacuum switch necessary.
3.1.10 Power Supplies
The electric circuits in the plasma etcher are powered by three power supplies. A
24 VDC supply is used for the solenoid and the relays, 5 VDC power supply is used to
power the MFCs and a regulated +15VDc and -15 VDC is used for the tuning network
controlling card in the matching network [2].
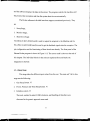
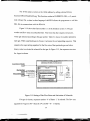
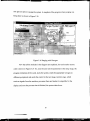
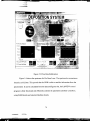
3.1.11 Optical Setup
The optical setup is used for analyzing the light emissions from the plasma reactor
system. The major components of the optical setup are a spectrometer EG&G PARC
model 1229, detector interface model 1452A, fiber optic bundle and a host computer (see
Figure 3.6) The light is collected and sent to the spectrometer that separates the different
wavelengths of light. The detector determines the intensity of different wavelengths of
31
mmm
light, which are sent to the computer via a GPIB board. The resolution of the
spectrometer depends on the spectral response and calibration of the system. There is a
grating inside the spectrometer that defracts the light into its component wavelengths and
directs them to a focusing mirror. The mirror reflects the light out of the assembly. The
light detector, which is mounted on the exit of the assembly, has an array of 512 photo
diodes that sense the light coming from the spectrometer. With the help of an external
LIGHT
SOURCE
FIBER OPTIC
BUNDLE
SPECTROMETER
.•:.:.:.x-:-:.>x<5:v;%!:W3
.•.„.::::-S'^mii/S
MICROMETER
SCREW
NITROGEN
HEAT
SINK
LIGHT
DETECTOR
DETECTOR
INTERFACE
HOST COMPUTER
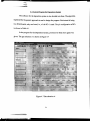
Figure 3.6 Optical Setup
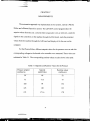
Micrometer screw, the spectrometer can be tuned to different ranges so that wavelengths
from 200nm to 1 lOOnm can be measured. This type of setup makes it very easy for the
user to decide on the endpoint detection by looking at the optical emission lines and their
32
1
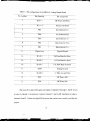
wavelengths. Table 3.1 shows the optical emission lines used for endpoint detection. It
shows the Etchant gas to be used for a particular type of material, the emitted species and
its corresponding wavelength.
Table 3.1 Optical Emission Lines Used for endpoint Detection
Material
Etchant Gas
Emitting Species
Wavelength (nm)
Silicon
CF4 /02
F (Etchant)
704
SiF4 (Product)
440, 777
Si02
CHF3
CO (Product)
484
Si3N4
CF4/02
N2 (Product)
337
CN (Product)
387
N(Product)
674
F(Etchant)
704
CO (Product)
484
OH (Product)
309
H (Product)
656
0 (Etchant)
777,843
Resist
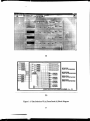
02
The next topics discuss about the hardware and software required to automate the
plasma etcher.
33
3.2 DAO Boards Used For Plasma Etcher
The ASPR was originally controlled by an ASD/99 on-board computer and a
manual data terminal, and the software was stored in EPROMs. Any modification in the
software was a difficult and time-consuming process. Two DAQ boards were used to
automate the plasma etcher. A DDA-06, D/A board, was used to send analog signals to
the etcher and a PC-LPM-16, A/D board, was used to read in the analog signals from the
machine. The boards were selected depending on the number of parameters that had to be
controlled and monitored, as mentioned in the generic approach in the previous chapter.
The DAQ boards used, met the specifications mentioned in the automation approach.
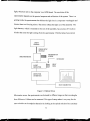
3.2.1 Metrabvte DDA-06 Analog Output Board
The metrabyte DDA-06 board is an analog output board, which provides six
channels of analog output with 12-bit resolution and 24 lines of digital input/ output.
Each output channel occupies its own I/O address location. The output channels are
switch selectable to OV to lOV, OV to -5V, -2.5V to 2.5V, -5V to 5V, -lOV to lOV and 420mA current. All output channels are set to OV to 5V range in this application. The
digital I/O consists of three ports (ports A, B and C). They are 8-bit ports. Each of the
ports can be configured as an input or output port. Analog output channels 0 through 3
are used to control the set points for the flow rates of four process gases. Analog output
channel 4 is used to control the set point for the chamber pressure and the channel 5 is
used for RF power set point. Bits 1,2,5,6,7 of port B are used to control the process and
purge gas solenoids. Bits 4 and 5 are used to turn the RF generator on and off
34
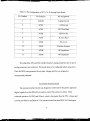
respectively. Figure 3.7 summarizes the operation of this board. Table 3.2 shows the pin
connections and the functions for the DDA-06.
•
Set Point Values
From Software
^
w
^
DDA-06
w
c^* n^..,*
•
Analog
Digital Port B
Digital Port C
X'oltages
Figure 3.7 Diagram of operation of DDA-06
3.2.2 National Instruments PC-LPM-16 Analog Input Board
The PC-LPM-16 [6] Analog input board has 16 single-ended input channels with
12-bit plus sign bit resolution. Each input channel is jumper selectable to accept inputs of
±2.5\', +5V, OV to 5V, OV to lOV. All input channels have been set to 0\' to 5\' for this
application. A maximum sampling rate of 50KHz can be achieved. The board also has
one 8 bit digital input port; one 8 bit digital output port, and 16-bit counter/timers. Figure
3.8 summarize the operation of this card. Table 3.3 shows the pin assignments and the pin
functions for the PC-LPM-16 card.
Signals from the
Plasma Etcher
PC-LPM-16
^
p
\'alues Displayed On the
Computer
Figure 3.8 Diagram of operation of PC-LPM-16
35
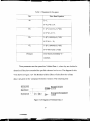
Table 3 2 Pin configuration of the DDA-06 Analog Output Board
Pin Number
Pin Function
Pin Assignment
D/A #5
RF Power Set Point
D/A f^ 4
Pressure Set Point
PB7
Gas Solenoid (H;)
PB6
Gas Solenoid (O2)
PB5
Gas Solenoid (Ar)
PB2
Gas Solenoid (CF4)
PBl
Gas Solenoid fN;)
Digital com
Digital Ground
D/A # 3
O2 Flow Rate Set Point
14
D/A # 2
H: Flow Rate Set Point
16
D/A#l
CF4 Flow Rate Set Point
8
11
12
i
1
1
\
.
17
GND
Analog Ground
18
D/A # 0
AT Flow rate set Point
24
PC5
25
PC4
!
RF Power Off
RF Power On
The mass flow rates of the gases are inputs to channels 0 through 3, the RF power
is input to channel 4, the pressure is input to channel 5. and the RF impedance is input to
channels 8 and 9. Neither the digital I/O ports nor the counters are currently used for this
project.
36
Table 3.3 Pin Configuration of PC-LPM-16 Analog Input Board
Pin Number
Pin Function
Pin Assignment
1
AIGND
Analog Ground
2
ACHO
.Ar Flow rate
5
ACHl
CF4 Flow Rate
7
ACH2
H2 Flow rate
1
9
ACH3
O2 Flow Rate
11
ACH4
RF power
13
ACH5
Chamber Pressure
15
ACH8
RF Impedance
17
ACH9
RF Impedance
\
'
By using these A/D and D/A interface boards 6 analog parameters are set and 8
analog parameters are monitored. The boards have to be configured before using them.
The LabVIEW code generates the set point voltages and they are assigned to
corresponding channels.
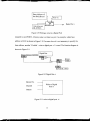
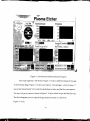
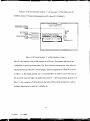
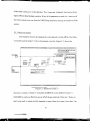
3.3 Extemal Interface Board
The extemal interface board was designed as mentioned in the generic approach
Digital signals from the DDA-06 are used to control the solenoid switches. These
solenoids operate at 24 VDC and 250mA, which is far greater than the TTL voltages and
currents provided by the DDA-06. The interface board has three ECG 2013 Dariington
37
wmmmm
transistor array drivers and two 74LS245-line drivers. The ECG 2013 drivers can handle
more than 24 VDC and 600 mA on the output.
All the digital and analog signals for the plasma etcher go through the board.
There are two 37 pin D- subconnectors: one for the DDA-06 and the other for the PCLPM-16 board, to connect them to the interface board, one 50 pin stick header connector,
and one 40 pin edge connector. The 50-pin connector goes to the signal termination
board, from where the connections are given to the MFCs, RF generator, pressure
transducer, and other parts of the etcher. The 40-pin connector goes to the solenoid board.
Figure 3.9 shows the logical connection of the two chips, along with the schematic layout
of the interface board and termination board.
24 VDC
COMPUTER
DDA-06
INTERFACE BOARD
SOLENOID
BOARD
PC-LPM-16
SETPOINTS
GROUND
READ
PARAMFTFR
SIGNAL
TERMINATION
BOARD
Figure 3.9 External Interface Boards
38
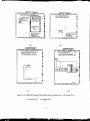
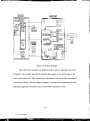
3.4 RF Tuning Network
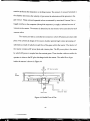
To minimize the reflections in the RF power due to the impedance mismatch
between the ASPR's capacitive impedance and the RF generator's output impedance, a
tuning network is necessary. The tuning network is designed to transform wide range of
resistive and reactive impedances to the 50 ohms desired by the RF generator. The tuning
network employd here is an L configuration, which includes two capacitors and an
inductor as shown in Figure 3.10. The tuning network has a shunt capacitor Cp to handle
the loading, a fixed inductor and a series capacitor Cs for tuning. The capacitors are ser\ o
motor driven simultaneously to allow the instant tuning. To accomplish the automatic
tuning of the system, a phase detector and a magnitude detector are used. The signal from
the phase detector controls the servo motor of the series tunign capacitor, and the signal
from the magnitude detector controls the servo motor driving the shunt capacitor. Both
the detectors operate simultaneously to transform the impedance of the load to 50 ohms.
39
'ma^Bm
RF
POWER
PHASE AND
MAGNITUDE
DETECTOR
A^^^
SERVO
MOTORS
CHAMBER
TUNING
CONTROL
CARD
RELAYS
Figure 3.10 Tuning Network
40
mm
3.5 Lab VIEW Control Program for the Plasma Etcher
The software should be in such a way that it is flexible and modifiable. The input
parameters that the user has to select are the following:
Selection of a gas Ar, CF4, H2, O2.
Set the gas flow rate.
Set the pressure.
Set the RF power
Set the total time for the process.
The user has to monitor the following parameters in a plasma chamber.
Pressure.
Power.
Flow rate.
Impedance.
Process time left.
Figure 3.11 shows the flow chart for the automation Program for the etcher. The
program is designed according to the algorithm mentioned in the generic approach. The
user sets all the parameters and the D/A DAQ board sets the set point voltages to the
machine and the A/D DAQ board feeds the mn time data from the machine into the
computer
41
^
•n
rma^
Select Gas, Gas Flow rate. Select
Pressure
Power On the Selected Gas
Solenoid
I
Set the Process Time
Set Temperature
Set RF Power
Read and Display
Flow Rate
RF Power
Pressure
RF Impedance
Temperature
Process Time
Shut Down System
Close MFC
RF Power Off
Power Off Solenoids
Figure 3.11 Control Program Flow Chart
42
False
wrr
mat
9
and the software displays the data on the screen. The program controls the machine until
the process time completes and then the system shut downs automatically.
The Etcher software is divided into three stages as mentioned previously. They
are
1. Setup Stage,
2. Monitor Stage,
3. Shut Down Stage.
The DDA-06 (D/A DAQ board) is used to output the setpoints to the Machine and the
PC-LPM-16 (A/D DAQ board) is used to get the feedback signals into the computer. The
pin configuration and the functioning of these boards are already. The front panel of the
Plasma Etcher program is shown in Figure 3.12. The source code is shown at the end of
this chapter. The individual blocks in the code are explained first and finally the
integration is showed.
3.5.1 Setup Stage
This stage takes the different input values from the user. The main sub Vis for this
stage are the following:
1. Gas Setup Screen. Vi
2. Power, Pressure and Time Setup Screen. Vi
3. Initialize system. Vi
The tools, method to select CASE structures, and bundling of data that were
discussed in the generic approach were used.
43
SHM
m^
' 'f'Xi'A
j f '
Plasma Etcher
j'''^'"-
RF liTipedafK^e
" ^
TimeRemaH .
loo.O-
10.0-
200.0^400.0
. 500.0.
,
/ 600.0 !
412.0
sec
^ryPbwer ^ ^ ] f
*-«-L
500.0
600.0
S82.3
6ratfig||
MeasuKJ RF Irr^Kdafx*
Chant)ef Press'jfe (mToff]
GasFlc».'R^e-;^f fscoTi)
^ > '
400-1
!^rNeas«fa(lBFPowef
BFPoweiSfitPoB^
'.
• .•' -X s ' v
i
Me3S(ied6as Flow Rate
fiiSS
! Gas Flw Rate Set Pcwt
iiimijiiijiiMi
1
iiititji^WWWWWiWwiHiWilWiWtWW^
i
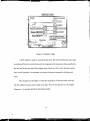
Figure 3.12 Front Panel of Plasma Etcher Program
The setup stage has 5 sub-frames. Figure 3.13 shows different frames (0 through
3) of the Setup Stage. Figure 3.14 shows the frame 4. The substagel, which is frame '0'"
uses a Gas Setup Screen VI, to read the selected gas number and the flow rate setpoint.
The user will get a screen as shown in Figure 3.15 (a) to select the gas and the flow rate.
The block diagram (source code) of the gas selection screen.vi is shown in
Figure 3.15(b).
44
^am
srra/^' sr^^E^
I /9ljsrf i^^s /^A->t^ /7.^/Vf Stf^jgp
g g g g o-O-q^i i [o .4] kP-°-° n a a n
jy-/
\
es
Bundle Pressure
& Po^Mcr D a t a
!i g H o g g H
f»ir?i
rrtj
(a)
(b)
SETUP STAGE
SETUPSTA6E
q, n B q n a.^| 3 [p .4] ^p..5jiiLQ_s_Q.
Q D O O i P ^ a ^ l 2 [0 4]^[l a d::& O ^ tj
VSefD^Moukt
for
* ^ M V \ K « « MM^kn^V>%(\ n « MJ«^>^V>^^4X K X MM ^ K ^ ^ ' N ' ^ ^ «^ X M J« ^«^'VN«^«\ (^
Mode
OH
•UBBBBBfiDB
< ^
GPIB
STAT
Error
?!+
I
a
ncitTitxxx3a»:KKxxxxx9«.'«:i
^ ^ 1 ^ " ^ ,,
[<
g D D D D o 0 Q g o G D'^Q"'D''D D D C
itffl
B a p o o B d a B a a gtrEra b o D
(c)
(d)
Figure 3.13 Different Frames of the Setup stage (a) Frame No. 0 (b) Frame No. 1
(c) Frame No. 2
(d) Frame No. 3
45
mtmm
S^rUf'ST^AGr
.y y Q a_Q„H_q^| 4 [o..4]^p a • a a a a p
Figure 3.14 Frame for the Timer
The gas number and the flow rate are bundled together in frame 1 and advanced
into frame 2. In frame no. 1, the power, pressure and the etch time are specified by the
user. The Power and Pressure data are also bundled and advanced into frame no.2. The
screen for selection is shown in Figure 3.16.
Frame No.2 receives Gas Number, gas flow rate, power and pressure and these
are passed to an another VI called. Initialize system.vi. As the name implies, this VI
initializes the system and plugs in the setpoint values. Figure 3.17 shows frame number
'0' of the diagram for the initialize system.vi. The total number of frames in this VI are
four. Frame '0' sets digital Port A, Port B, Port C as output ports. Different pins of these
ports are used to activate the gas solenoids. The base address for the DDA-06 card is
3 3 OH.
46
Selup Scie«n I t l vi
'^//jf^^f/^/
(a)
VA%MAWVW\VVWlfliVVkV.'.
(b)
Figure 3.15 Gas Selection VI (a) Front Panel (b) Block Diagram
47
•K
e^
Power, Pressure & Etch Time Setup
RF Power!
i.
-•
E^:h Tffne.
C h a t t e l Pressur&i
250.0 5«3.0 750.0
- < ^ 10K3.0 I
IZi^D
24CK) ^1
SCO >J3(KK.
Wf/y^
*l
\
IMLJWc^;
0 3yD0
iOOO
:sec
ACCEPT
''^
rfrrfrrfrrrrtfrriri
mMMiawif<H<(iriirirf rirrMrnr f fHtntiummmutMiMm
UtMtttU^
Figure 3.16 Pressure and Time selection screen
iQDCcaaaDCCDoq^lOfO
3]^^ii.B t ; t ; r ; 3 ; : ? s g t ; Q
a J J
/yXjuj-y />/<><' t f y / ^ ^ y ' j f ' / l v ^
Bc-.eAdd-ess of DDA-06
I-33G
iFlovM RatesDataj
Pressure t Powef Dat
r—
Gas Number
>. "^^*! >- ;>;<>
'!<t--. j i j - e
P-x.e-
[PCTTA OutpuH r o l -
PoftB OutpUi .-[iil-—
C '^
[PofTC Oulputi TEil-
l a o Q n c j a a Q a D Q O O Q D D a o o n D o n o Q a c Q a
Figure 3.17 Frame No.'O' of the Initialize System.vi
48
da
m
<^H
Figure 3.18 shows the frame number ' 1 ' for the same \ T This frame sets the
chamber pressure. The governing equation is PS= floor (P/l.22466663).
iQaacaoaDDDQOC^|1[0
.TtV/y^r"
3 ] ^ ) n q q g c g p c a c q q a
/y^^rj^e^Fvs.-u'Tr'
BaseAddressof DDA-OGj
FOT
DA«4
Flow Rate Data
^[es$L.re 5< Power Data
Gas Number
Convert the Pressure Set Point to a
Number to be written to the DA port
H
pp»«»aai»»»atsa^a»'
PS = floof(4095-(49"P/113755)),
Analog Nunber Out.Vi
Q D g o DP a o a D D O D D a c Q a a o a o o Q D D o c D a "
Figure 3.18 Frame Number ' 1 ' of the Initialize system.vi
Here P is the setpoint value of the pressure in milli torrs. The pressure and power are
'unbundled' to get the pressure alone. The 'floor' ftinction tmncates any value after the
decimal point and makes PS a whole integer. The pin assignment for DDA-06 is shown
in Table 3.2. The analog number out.vi commands DDA-06 card to convert the value of
PS into milli volts and make it available between D/.\ ^4 (Pin2) and analog ground GND
(Pin 17). For a setpoint of 100 milli torrs, the value of PS will be 94 and 94m\' will be
available between Pin 2 and Pin 17 of DDA-06.
49
m
ig
The 16-bit value is written at the 16-bit address by calling a shared library
function DlPortWritePortUlong. This ftinction resides in DLPORTIO. DLL, a Dynamic
Link Library file, written in other language. LabVIEW allows the programmer to call this
DLL file to communicate with the DDA-06.
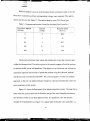
Figure 3.19 shows the frame number '2' of the Initialize system.vi. The gas
number and flow rates are unbundled here. This frame has four sequence stmctures,
which get selected according to the gas number. Table 3.4 shows the number allotted to
each gas. When a particular gas is chosen, it activates the corresponding sequence. That
sequence has a governing equation for the flow rate of that particular gas and also a
binary value to activate the solenoid for that gas. In Figure 3.19, the sequence stmcture
for Argon is shown.
g D p O: g :a.:Q::0:;;o o D:o :cU 2 [0.3]^f o P o g o a Q O D D Q a a
Sef//)e ffxi.^fA^iyffjfes ^/ic&yjJ^ff ffj:fye,^
BaseAddressof DDA-06
x330
PortB
Flow Rate Data
Q
Gas Number
7U^
Pressure & Power Data
f
nn_h
f
Digital Out.vi
Wf.. fr^ . .^rf.. fr^ . . ^ ^ . , .>w . .-frr.. .Vf*. rrf.. .Vr*.. h^. .W*., nm
rr4.. Nw . .\r*.. m^ . .trf.. ^ ^ . .*-* • > H . .TTT. , .Vw . TT*. . *»*. *w€.. .Vw.. frr.. .VF*.
»*
Wi
Figure 3.19 Setting of Gas Flow Rates and Activation of Solenoids
If Argon is chosen, sequence number '0' of frame '2' is selected. The flow rate
equation for Argon is FS = floor (8.19* (10.848 * F + 14.0267)).
50
s
Table 3.4 Gas Number Assignment
Name of the Gas
Number Assigned
Argon
0
CF4
I
1
Hydrogen
2
Oxygen
3
1
The coefficients for this equation were experimentally determined. Here F is the
set point value of the flow rate in SCCM (Standard Cubic Centimeters per Minute). The
mV equivalent of FS is made available between DA # (Gas Number) and GND (ground)
by Analog Number Out.vi. For setting the flow rate of Argon, DA # 0 (Pin 18) is selected
since the gas number for Argon is '0'.
The binary value for activating the Ar Gas solenoid is 100000b. From Table 3.2,
the bit 5 of 8-bit digital Port B has to be set to binary ' 1' to activate the Ar Solenoid,
while all the other bits should remain '0'. Figure 3.20 lists all binary values for activation
of different gas solenoids.
51
Argon Gas
0
0
PB7
0
PB6
PBS
PB4
0
0
PBS
PB4
0
0
PBS
PB4
0
0
PBS
PB4
0
PB3
0
0
0
PBO
PBl
PB2
CF4 Gas
0
0
PB7
PB6
0
PB3
1
0
0
PB2
PBO
PBl
Hydrogen Gas
1
0
PB7
PB6
0
PB3
0
0
0
PBl
PB2
PBO
Oxygen Gas
0
1
PB7
PB6
0
PB3
0
PB2
0
0
PBl
PBO
Figure 3.20 Binary Values for Gas Solenoids
The sub VI, Digital Out .vi', is used to write to a digital port. The other sequence
stmctures for other gases in Frame '2' are similar except for the governing equation for
the flow rates. Each sequence has an equation and its binary value for activating its
solenoid. The equations for other gases are given below.
For CF4:
FS= floor (8.19 * (2.1S * F + 5S.2));
For Hydrogen:
FS= floor (8.19 * (8.SS * F -100.8));
52
mm-
For Oxygen:
FS= floor (8.19 * (S.8387 * F +1S.9S4));
These FS values are converted to mV by the DDA-06 card and applied to the Mass Flow
Controllers.
Figure 3.21 shows the frame number ' 3 ' of the diagram of Initialize system.vi.
This frame sets and turns the RF power on. This value of PS is written by 'Analog
Number Out.vi.'
POOODDaoDoaocui3rQ
Sc^ //}e R'F Powe^ a/tdActn^s^
3iLioaDoaaoD
Gc'/ierativ
.ddress of DDA-OG
'330
Flow Rate Data
1 ^
;ure ^ Power Data
miJJftBMMUKM
Gas Number
Flow Rai.e
Converl the Power Set Point to a
number to be written to the DA
output port
TurnRF
Power On
t> 10000
Pressure
•"owe.f
Figure 3.21 Frame Number ' 3 '
The next frame, frame no.3, in the setup stage (See Figure 3.13), sets the DAQ
mode for the spectrometer for the end point detection and initializes the AT-GPIB/TNT
board. The GPIB initialization is shown in Figure 3.13. The base address for the GPIB
board is H2C0, the DMA channel is S and the Intermpt line is 11. Once the program mns,
the user gets a prompt if there is any error, like error connecting to driver, GPIB bus
errors, and error if board is not present or if address specified is not correct. This is done
by the 'General Error handler.vi'. The GPIB is configured using the NI-488.2 driver
software. The DDA-06 and the PC-LPM-16 are configured using the NI-DAQ
53
^•ei
configuration utility software, which checks for the cards and allows the user to specify
the Intermpts, DMA channels and the base address. Finally the user makes use of the
device numbers specified by the driver software in the LabVIEW source code, for it to
communicate with the peripherals. The output of the spectrometer is connected directly to
the port of the GPIB. The GPIB consists of a bi-directional bus that has the capability of
sending and receiving signals from a device. The wavelengths of light emitted by
different species in the plasma chamber are displayed on the display, which enables the
end point detection.
The next frame, frame number '4' (Figure 3.14), starts the timer, which is
compared in the next stage to the process time and if they are equal, the program halts.
3.S.2 Monitor Stage
This stage takes the mn time data from the machine and processes it for
displaying. Figure 3.22 shows the Monitor Stage. The sub Vis for this stage are:
1. Acquire Run Time Data.vi
2. Validate Data.vi
54
:_,—. .._....
IHl
^^^^^^^MttH
zm^i^mama^Zii,^.-
Optical Spectroscopy
i?-ri..-.« • j :
J RF Impedance
_2=.
••<! « i ? i
"1
Gas Fow Rate
^f*
Chamber Pressure (mTo
Flow Rate ToilToOOJloOGU?
CliD
jf»^^»*f*f*»rrrrrfA9fffA
RF Power (Watts)
pressure Toll25GGG000.0G_2l
L
•4'\
Power Tolll0000000.00
Etch Timer
mr^
fit ' fl?B??riB[?ffTYYfWTrff
CUD
PUT A DIALOG H£P£
TO SIGNIFYAN EGROP
OCCUPED...
system stopinnnf
mmmmmmmmmmmm
Figure 3.22 Monitor Stage
A shift register is used to count down the time. The time from the previous stage
is subtracted from the current time and it is compared with the process time specified by
the user and if they are equal the program stops. Since the 'tick count' ftinction counts
time in milli seconds, it is necessary to convert the time to seconds by dividing with
1000.
The Acquire run time data.vi is the data acquisition VI for the etcher software.
The PC-LPM-16 card is used to read in the data. This VI uses the sub VI 'AI Sample
Channel.vi', to acquire data from the plasma etcher.
wei
Figure 3.23 shows the diagram of acquire mntime data.vi. The device number
assigned to the PC-LPM-16 card is 1. The channel numbers for different input
Oewie Ncmibsr -De&yed
fy/M-DAQAv WiTKhivs
RF Power
Pressure
Pcocess Gas Convert to Channel
^Dl-
Flow Rate
hjncticm o/^^e vsk/ss o/f/^e
m
RFImpedance
Grating
Spectral Clusler
7X-7
Figure 3.23 Acquire Runtime Data.vi
parameters are shown in Table 3.3. The high limit is set to S.O volts and the Low limit is
set to Ovolts. A formula node is used for each input parameter. Formula nodes for the gas
flow rates are grouped together inside a CASE stmcture. The gas number selects the
sequence with the formula node for that particular gas. The 'convert to channel.vi', is
used to convert the gas numbers to a string. The coefficients for the equations in the
formula nodes are experimentally determined. The flow rate equations for different gases
are listed in Table 3.S.
56
m
mm
•ffm
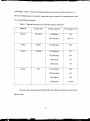
Table 3.S Equations for the gases
Gas
Ar
Flow Rate Equation
X = I;
0=9.2l*X-1.19;
CF4
T=(I*(10/4096)-5)*100;
0=T* O.S-27.75,
H2
T=(I*(10/4096)-S)*l00;
O=T*0.11+ 12;
O2
T=(I*(10/4096)-5)*100;
0=T* 00171292-2.7328;
Pressure
O=(0.961001/1000000) *I +
0.000S39;
These parameters are then passed into Validate Data.vi, where they are checked to
determine if they have exceeded the specified tolerance level or not. The diagram for this
VI is shown in Figure 3.24. The Boolean variables (Tme or False) from the validate
data.vi are given to the 'compound Arithmetic' ftinction. The remaining time
iParameter
Paramter Graph
CMU
jSet Point
Tolerance
t>J> 1^
Tolerar-ice E x c e e d e d ?
x r
Figure 3.24 Diagram of Validate Data.vi
57
^mm
of the timer is also given to this ftinction. This 'compound .Arithmetic' ftinction performs
logical OR on these Boolean variables. If any of the parameters exceed the tolerance or if
the etcher system times out, then the WTHLE loop terminates causing the shutdown of the
system.
3.S.3 Shutdown Svstem
The shutdown System de-energizes the solenoids and switches off the Mass Flow
Controllers and the sends 0 \^olts to the pressure controller. Figure 3.2S shows the
C O C C D G 3 D G Q O O D C 0 0 3 D C O C O O C l < ' i r Q 2 > | J C : 3 D a O D a O C a : d D C 3 C C D n a C ~ C i
Thij Sequence wil write Zero Volli
To Each D/A Channel
3 n - ^ H r;
bate address
! 3'; e A :>drej5
•;:o
Ar flow rate channel
=:-:3
value[0-4095)
-.:tnz±
t-:or:
Tre-rm-wXKV w m vtxnt
irz'r
"7
y y
K„t,
5]^?aDCQc3gl
?
4
m^
DacjcoDCincjD
hoefr:r|
C J D g D D a G C D D a D D O O Q D Q O C O D D a O Q D O Q D D D n a O S D C J C C n C J C - Q g j c n D i
Figure3.25 Shutdown System.vi
Shut down System.vi. Frame '0' initializes the DDA-06 card as before. In frame T ,
bOOOOOOOO is written at Port B to power off all the gas solenoids. There are 5 frames in
this Frame itself, in which the D/A channels are reset. Once the svstem is shut down, the
58
mmm
wsm-
user gets an option to purge the system. A snapshot of the program when purging was
being done is shown in Figure 3.26.
Shut Down System.vi
Shutting Down
M-'-M « """^f""r""f'^^"
Percertt Comgiet^
2aQ' i '4tfiPiao
Purge System with Niirogen?
^^'If 80, how long?; ^^
y'>rfy ••/>^^fy>v>-^
0.0
\ :
so f ^t^i'K•>^>>*»»Mrt^*v*>^vv*\w
Purge Sj|!tt>»ni nwith tlitrogeit
^v*rtrtrt^nrtrtft^i^<%vy»)i^^rtiW^^v%sv
• yv>'w^rtiw»jwiv).<.vs^
erf or in {no ©FIOFJ ":'P'-'' ' mim%ui
•s-S
1 statu*
code """" status
code"
\ rK» errof ^ *!.•*-»
1 1 I 'fioeKorj,;'iQ
**''*'^"*"'-"" ''^ ^ u » « « ^
|*ource^,-„„
-' ,
1
«
j....'.rts,,>-rt»>jix!iS^!^'byurt
•,..•...
I1
jl2"'S'^^'5'"^'''2T" '., " ^
i i
jM '"''-''"-
i <
![^f?i®iB5y*io
Figure 3.26 Purging with Nitrogen
Now that all the modules in the diagram are explained, the entire etcher source
code is shown in Figure 3.27. So, once the user sets the parameters in the setup stage, the
program initializes all the cards, starts the system, sends the appropriate voltages to
different peripherals and sends the control to the next stage, monitor stage, which
receives signals from the machine, processes them and makes it compatible for the
display and once the process time is finished, the system shuts down.
59
•wHi^^rv
H>i^
t:'Ci::t:'::::.y '
SHLTDOWN
u
orr
^nt:':\!xiniP~
'~'"Y\d
Figure 3.27 Control Program
Thus, the Control program was designed using the generic approach discussed in
Chapter n. This modular approach of designing the program is easy and changes to the
code can be made easily. This methodology of automation was successftiUy implemented
on the Plasma Etcher. The next chapter, Chapter IV, discusses the implementation of the
automation approach on an other system called Plasma deposition system.
60
HI
CHAPTER IV
IMPLEMENTATION OF AUTOMATION APPROACH ON
PLASMA DEPOSITION SYSTEM
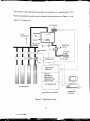
4.1 Introduction to the Plasma Deposition System
The generic approach explained in Chapter II was also used to automate an other
equipment, a Plasma Deposition system [3]. This plasma reactor system is designed to
deposit a variety of types of films at high speeds onto large numbers of semiconductor
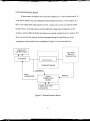
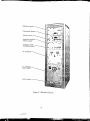
slices. The block diagram of the system is shown in Figure 4.1. The signals to select the
gases, certain controls like selecting the vacuum valves, raising the chamber cover, these
signals come from a sequencer box which will be explained ftirther. Even though it is
called a deposition system, it can also etch and ash wafers. Ashing is a process of
removing photoresist on wafers. There are two modes of operation on the system. One is
manual mode and the other is automatic mode. In manual mode, all the controls (toggle
switches) are on the electrical cabinet. In the automatic mode the system is controlled by
signals from the computer. Before discussing the DAQ Boards, Extemal Interface boards
a brief explanation of the system setup is given.
The reactor system is comprised of three major assemblies, the plasma
depositioner assembly, the electronic cabinet and the vacuum pump. The reactor system
is comprised of subsystems that ftjnction to perform deposition, etching or ashing
processes. The subsystems are Gas and compressed air system, vacuum system, RF
power generator system, the reactor, sequencer, and pressure control system. Heating and
cooling systems are optional. The optical spectroscopy is not used in the automation. The
61
^mm
other systems of the depositioner assembly are explained in the ongoing topics. The
Plasma depositioner assembly and the electrical cabinet are shown in Figure 4.2 and
Figure 4.3, respectively.
RF TUNING
GAS
MANIFOLD
GAS SUPPLIES
ELECTRICAL CABINET
Figure 4.1 Deposition System
62
COMPUTER
CONTROL
m
S
ta
RF MATCH BOX
SAFETY TOUCH
RING
REACTOR PRESSURE
GAUGE (ATM TO 20
TORR RANGE)
REACTOR
EKERGENCY STOP
PUSHBUTTON
TYLAN
MASS
'FLOW
CONTROL
PANEL
AUTO
TUNE
POWER
SUPPLY
Figure 4.2 Plasma Depositioner Assembly
63
J —
SEQUENCER DRAWER
TEMPERATURE DRAWER
I•,3
CONTROL DR.\;,'ER
AUTOMATIC PRESSURE
CONTROL DRAWER
AUTOMATIC POWER
CONTROLLER DRAWER
RF GENERATOR
RF GENERATOR
POWER SUPPLY
POWER CHASSIS
Figure 4.3 Electrical Cabinet
64
•iii^
4.1.1 Gas and Compre«;sed Air Svstem
The ftinction of the gas system is toftarnishvarious gases at selected rates to the
reactor chamber. The system consists of necessary piping, valves, mass flow controllers,
and gauges to control and monitor the process of etching and deposition. At the
depositioner assembly, each process gas is controlled by a solenoid valve, and monitored
by a flow meter and pressure gauge. The solenoid valves are actuated by toggle switches
(manual mode) or by signals from the sequencer box, activated by the computer, which
intum operate the air valves to permit gas to flow into the manifold. There is also
provision for Nitrogen gas to purge the chamber.
Compressed air is supplied to the unit at 70 psi. The compressed air performs
three ftanctions. It raises and lowers the reactor cover, operates the air valves that control
the pump out rate of the reactor operates the air valves that control the application of
input gases to the chamber. Compressed air enters and evacuates the reactor cover control
air cylinder through a piping arrangement containing two solenoid valves and an
adjustment needle valve. An air cylinder controls the reactor cover. It can also be
controlled through a signal from the computer. Also a toggle switch LID UP/DOWN
(manual mode) controls the lid. When the switch is in the up position air goes into the
cylinder causing the piston inside it raise the lid. In down position the cylinder is
gradually vented from the cylinder causing the lid to lower over the reactor chamber.
4.1.2 Vacuum System and Reactor
The ftjnction of the vacuum system [3] is to establish the flow rate of the reactant
gases over the substrates, control the pressure in the chamber, and remove the gaseous
65
reaction products after deposition or etching process. The amount of vacuum ftarnished in
the chamber determines the velocity of gas across the substrates and the pressure in the
gas mixture. Three solenoid-operated valves are actuated by associated Vacuum VaK es
toggle switches or the computer (through the sequencer), to apply a selected amount of
vacuum to the reactor. The amount is determined by the throttle valves associated to each
vacuum valve.
The reactor provides a controlled environment in which RF plasma processes take
place. The cylindrical design of the reactor chamber permits high volume processing of
substrates as result of radially inward flow of the gases within the reactor. The interior of
the reactor contains a RF power plate and a heater plate. The RF power plate is the means
by which RF power is coupled into the reactant gases. Three circular windows enable the
operator to observe the RF glow discharge inside the reactor. The radial flow of gas
inside the reactor is shown in Figure 4.4
RF
Genera.t:or
RF
Plate
Vacuum
Figure 4.4 Radial Flow of Gas
Source
Gas
•i
4.2 Lab - P O DAO Board for the Deposition Svstem
In automating this equipment, two Lab - PC+ DAQ boards [6] are used The Lab
- PC+ is a low cost multiftanction analog, digital, and timing I/O board for the PC. The
Lab - PC+ contains a 12-bit successive approximation ADC with eight analog inputs,
which can be configured as eight single-ended or four differential channels. The Lab PC+ also has two 12-bit DACs with voltage outputs, 24 lines of TTL-compatible digital
I/O, and six 16-bit counter/timer channels for timing I/O.
The Lab - PC+ contains six jumpers and one DIP switch to configure the PC bus
interface and analog I/O settings. The DIP switch is used to set the base I/O address. Two
jumpers are used as intermpt channel and DMA selectors. The remaining four jumpers
are used to change the analog input and output circuitry. The first PC+ board is
configured as devicel and the second one as device2. For device 1 the Base I/O address
is Hex240 and Hex280 for the other. The DMA channel is 3 for both the devices and the
intermpt line is 5 for both the devices. Channels ACHO through ACH7 are for analog
inputs. The Figure 4.5 shows the operational diagram of Lab-PC+. Table 4.1 shows the
pin configuration of PC+ board.
Computer
— ^
4
Lab-PC+
1—•
DACO
1—•
DACl
^
w
<
^
W
< —
Figure 4.5 Operation of Lab PC+
67
Ports B &C
Analog Input
Signals
^i^
Table 4.1 Pin Configuration for Lab-PC +
Pin Number
Pin Function
Pin Assignment
1
ACHO
AT flow Rate
2
ACHl
CF4 Flow Rate
3
ACH2
Hydrogen Flow Rate
4
ACH3
Oxygen Flow rate
5
ACH4
RF Power
6
ACH5
Pressure
7
ACH6
RF Impedance
10
DACO (device 1)
Setpoint for pressure
12
DACl (device 1)
Setpoint for Ar Flow rate
11
AGND
Analog Ground
13
DGND
Digital ground
14
PAO
Argon Relay
15
PAl
CF4 Relay
16
PA2
Hydrogen Relay
17
PA3
Oxygen Relay
10
DACO (device 2)
Setpoint for CF4 flow rate
12
DAC1( device 2)
Setpoint for H2 flow rate
1
The digital I/O consists of three ports (ports A, B, C). They are eight-bit bi-directional
ports. The analog output channel DACO on devicel is used to control the pressure
setpoint for the chamber pressure. The output channel DACl is used for controlling Ar
gas flow rate setpoint. Similarly, the DACO and DACl channels on device2 are used for
controlling CF4 and Hydrogen gas flow rate setpoints. The port A is used to trigger the
relays to switch on the gas solenoids.
4.3 Gas Control System and Sequencer Box
The sequencer box originally had RAM chips and EPROMs [3], which had to be
programmed for each mn to perform operations in sequence (etch, ash, deposit). It was
tedious and has been replaced with solid state relays actuated from the computer. The
sequencer box is a control device designed to drive the solenoids in the depositioner
assembly and actuate other signals. It has a 5 VDC power supply and solid state relays.
The DAQ boards residing in the computer send the signals to turn the relays on or off.
Each relay controls the application of 115 VAC to a depositioner ftinction (solenoid
valve). The sequencer box is used if automatic operation is needed.
Figure 4.6 shows the operation. In plasma etcher the driver circuit was used to
switch the solenoids, on or off. The deposition system uses 120 VAC to operate the
solenoids. The sequencer box helps in this operation. The digital outputs from the PC+
are used to trigger all valves and solenoids via the relays in the sequencer box. The
sixteen control relays have input rating of 5 VDC and output rating of 5 VDC. This
output is used to trigger the next stage, the solid-state relays. The solid state rely is DC
controlled and uses SCR switching. When these relays are switched on, they send 120
VAC to the solenoids causing them to turn on.
69
mm?''fmfmAtm
FLOW RATES
FROM MFCs TO
Lab PC+
COMPUTER
CONTROL
SIGNALS
FROM Lab PC+
SETPOINTS
(0-5 VDC)
\t
RELAYS
(SEQUENCER BOX)
MASS FLOW
CONTROLLERS
TERMINAL
BOARDS
FLOW RATE
(0-5 VDC)
BELLOW
VALVE
SOLENOID VALVE
GAS INLET
Figure 4.6 Gas Control System
70
~.^.^.m
4.4 Control Program for Deposition System
The soflrware for the deposition system is also divided into three. The algorithm
explained for the generic approach is used to design the program. But instead of using
two DAQ boards, only one board, i.e., a Lab-PC+ is used. The pin configuration of PC+
isshovminTable4.1.
In the program for the Deposition System, provision for three more gases was
given. The gas selection.vi is shown in Figure 4.7
'.; y''y/;'//ffi''i!0^fwmx&/^
60.0'
\msi
mji
Hydrg«»j
f?
^iSM"
^r
isao zoacf
'"/n,
rrrrrrrrrrfyrrrryri'i'yy
iao
Ow^Bttf
laao 140.0 leat)
3ao
2Q.0
«XQ
i'.
KJ.0 .yU 60.0 ,.i:^.70.0
ao.Q|
j'?^"
•Mfy,ff,ti-fMJyyf^y,ft»fn
JI
***»*«>**y****M'jfft»*»^»>*y*'*»*^*-
80.0
»»
-
;/ aao
Uf^
m
%y'4'y/^'r'/
'•J''
Figure 4.7 Gas selection.vi
71
loo.o
•ip
As in the previous program, the Gas number, flow rate value, power, and pressure
are bundled together and passed to the Initialize system.vi. For communicating with PC
and to send the Analog signal out, it is not necessary to specify the address of the DAQ
board, but we need to specify the device number. To send out the Analog signal, a sub VI
called 'Analog Output Update Channel.vi', explained in Chapter n, is used.
Figure 4.8 shows frame '0' i.e. initialization of Pressure. It shows the equafion
and the device number, in this case it is ' 1 ' . Frame ' 1 ' shows the setpoint of Argon Flow
rate. Another sub VI called 'write to digital Port.vi' is used to switch on the relays in the
sequencer box. Figure 4.9 shows the Flow rate screen for Argon Gas.
jt g o tt d Q D Q D o g o o t ^ | g p 2]^| a p p a n n a o a fl-OJi.
fdf/ {/}e D'h3/i}def fh?ss(ffe
Flow Rate Data
I gas ! a
Pressure Sc Power Data
Gas Number
Convert the Pressure Set Point to a
Number to be written to the DA port
Q
ONE M
:
= 25
&
'QO
fldfadttdQddDaattbddbDOooDQDa-
Figure 4.8 Pressure Initialization
72
^s
Pl!"l
mm
DoaDO00ODDGDa^|im2]MQDDQnQDnn0D~°
Fe/ //)dfff,5SFiwfid^;!: ^Ac^d/ff ^AV^'AV
Flow Rate Data
Gas Number
riowHst'?
Pressure ?c Power Data
uiiiuiiiiiiiiia
D. - .
^
DODDODODDDDDaDDDDOOaDOaaDaDDaDQ
Figure 4.9 Frame no ' 1 ' of Initialize system.vi
So once the parameters are set in the first stage, the control goes to the second
stage to get the feed back signals from the machine into the 'Acquire mntime data.vi',
which is explained in the monitor stage for the Plasma Etcher. The shutdown stage is
explained in Chapter HI. In the shut down stage, binary O's are written to all the digital
channels and the setpoints are made zero to the Analog output channels, using the analog
output.vi and the write to digitalport.vi. Finally the system is purged.
The next chapter, Chapter V, discusses the results obtained and the measurements
taken.
73
CHAPTER V
MEASUREMENTS
The automation approach was implemented on two systems, namely a Plasma
Etcher and a Plasma Deposition system. The LabVIEW control program takes the
setpoint values from the user, converts them to equivalent volts or millivolts, sends the
signals to the controllers on the machine through the D/A Board, reads the parameter
values from the machine through the A/D board and displays it for the user on the
computer.
For the Plasma Etcher, different setpoint values for the pressure were set and their
corresponding voltages to the throttle valve controller were measured. These values are
tabulated in Table 5.1. The corresponding mntime values are also shown in the table.
Table 5.1 Setpoints and Runtime Values for the Pressure
Pressure setpoint
(millitorrs)
Setpoint
(millivolts)
Runtime values
(millitorrs)
50
46
52
75
71.3
75
100
94
102
125
120
123
175
171.6
178
74
• J
mmmss^i
Different setpoint values in seem (Standard Cubic centimeters) were set for the
Mass Flow Controllers and their corresponding voltages were measured. The mntime
values are shown in the Table 5.2. The data is taken by using CF4 (Freon) gas
Table 5.2 Setpoints and mntime Values for the Mass Flow Controllers
Flow Rate setpoint
(SCCM)
Setpoint
(Volts)
Runtime values
(SCCM)
0
0
0.01
40
1
43
80
2
82.7
120
3.1
123
160
4
164
The deviation between input values and mntime data is less than 5 percent and
within the tolerance level. Provision is given in the control program of both the systems
to monitor the RF power and Impedance. The objective is to implement and validate the
automation approach and be able to operate the systems using DAQ Boards, extemal
interface boards controlled by LabVIEW. The control program is written in a modular
approach, so the user can make necessary changes to it and accommodate the control of
extra parameters on the system.
Figure 5.1 shows the front panel of the plasma deposition system. The snap shot is
taken when the system stabilized the Pressure and gas flow rate. Normally the mntime
data stabilizes within a very short period of time. It is possible to view the dynamic
changes in the parameters too. Figure 5.2 is taken when the throttle valve controller w as
75
imn
Twm
V
7:45.23
Si!^ j ^
1781.79
V''"^'"'^•^^'•'^^^^'^easured RF Irnpedamje
""v;-^/
^: ChaniserPisslie ( f n T a i f e # ^ % . 6a$FbwRale-CF4
Measured RF Power
.RFPower Set Point-
(EH
I
a
Pie^Aif^SetPdnt
VWSW»>*»J00wU
^ ieasured Gas Fbw Rate
- BatFfow Rale Set Poffit^^lH
fmwmvwMMOOaOWWQMOMWmmOWOMMMMWWMMOOOMOOOOOOM
Figure 5.1 The front Panel when the parameters are stabilized
stabilizing the pressure in the chamber. Figure 5.3 shows the fluctuations when the MFC
was controlling the gas flow rate according to the setpoint value.
76
mmimmmtmmmimmtmmmm
•imv'.
'•mtmif
vO»/, „'<;>
aMMMIMNIMMMMIIiHMMWI
••'.ifXcK
PE4SMA ETCHER
y"i "wyjMMmwm—
RF Impedance!
10.0-1
^ 1 ? 0 j^m
0
60af9^68E? ; i : ^ 5:5244
.Mil p ^ ^ y y -
Gratir^'^ 15000
3315.70 seel
::: M^uredRFImpedance
Wi^ww>w»ww*>»*w7i|ii;>»^!ww»-1
;;<j;^^gv;'-
RFPowg (Watlsll
: mm
j.^»/
Chan^f.fiessu'e ImTorf] " r ' "l^'iiaiFiA'R3te'-CF4 (jcciril!
6:13,16
;Sa$FiDiiiBateSetPoin{
^fe::i«e|etPaftr
••^m^
•MMi^MiiMiMMMMitttlilOl
'•f^'^.
Figure 5.2 Pressure Stabilization
77
^ v i C N ^
>•»>•*
^i?<*
? 3 S ^ ^ ^ ^ ^ ^
'•yy:vvy7;-!y^-^y^wfym;^SSi.
^ " ^
r^*t-
^:i^
SYSTEM
^ " ^
y^^y^'4^^ fM9M^,
v./. v*^^^---
2000.0 \
y
/
y.jfi
y
i'y^yyyyy/
•'
>m
.
-»
W//^^'y^y,H'fmy
. MO
36C00 .
^'V^0-'j
^
^
i ^ y y « i ^ i y ^
:!^fer^:*o84o Wkf^"^k
*
(
iBBKi^'ft
<f<«^;
409:30
•Measured RF fisnpedance
«^"
RFPowrJWattsJ
Chamber Pressure fmforr] ; ; t l ^ . : ^ f S a f f e
1000 0
30000-
fe
CFf (^cmj,,^ ^
'>nooo-
i
O. -ic
Measurei RF Power
RFPw^ef Set Point--
B
lejsu-e'] i-Tci.^.iie
>3eir'0fi
n*MmeMOMOOMWWaoe«ooMBv^
B
,;a)$FbwRi£'SetWtn(
•**iw»*M*A»W"fl*'''W<«ij"
WMMfMMMlffMptpAJifcnMpM
[ESS^B
mpytOBBBBBI^tttmiu jmi.iuj J JUii
Figure 5.3 Flow Rate Stabilization
Figure 5.4 shows the spectmm of a He-Neon Laser. The spectmm has a maximum
intensity at 632.8nm. This proved that the GPEB is able to read the informationfromthe
spectrometer. It can be concluded from the data and figures that, the LabVIEW control
program is fiiUy fiinctional and efficiently controls the parameters and their controllers,
using DAQ Boards and external Interface boards.
78
Figure 5.4 Spectrometer Reading
79
CHAPTER VI
CONCLUSION
This methodology of automation, to control a process using DAQ Boards and
External Interface Boards, controlled by LabVIEW, was implemented and verified on
two semiconductor processing systems, namely a Plasma Etcher System and a Plasma
Deposition System.
The control program for both the systems is designed in a modular approach.
Changes can be made to the system and the program very easily. Provision has been
given to monitor Power and RF Impedance. Provision has to be made on both the systems
to apply temperature to the substrate and cooling water too.
This generic approach for automation can be extended to any semiconductor
processing system. The user has to determine the parameters that affect the process, their
corresponding controllers on the machine, along with their specifications. Then DAQ
Boards have to be selected based on the number of A/D and D/A channels, sampling rates
and the External Interface board has to be designed according to the specifications of the
controllers on the machine. Finally the control program has to be designed making use of
the tools and the approach discussed. Improved processing performance can be achieved
by using such a setup and the user will have efficient control over the process.
This idea of automation has many advantages over conventional systems designed
using microcontrollers and EPROMS. First, the user intervention is less compared to
those systems. The cost of building the system and its automation is reduced. Installation
and fault location are easier. The industry has a number of DAQ Boards available and the
80
T
ES9Sa
user will have ample choice to make a proper selection. Measurements and resuhs can be
obtained with a high accuracy and precision.
The methodology developed has been implemented on a project called 'Web
Interface Design For A Plasma Etcher,' by Mr. Tasnim Murad Hossain, where the
setpoint values for the parameters are set from a web page and the controlling of the
system is done from the Internet.
This approach should be implemented not only on Semiconductor Processing
Equipment but also on systems like, Hybrid Electric Vehicle, Fuel Cell, where results and
measurements can be obtained with high accuracy and efficiency.
The advantages of such a generic approach are that system monitoring and control
are easier to understand and modify, because of Lab VIEW'S flexibility and ease of
programming. Excellent control can be maintained over process parameters, because of
the real-time feedback control system. This approach can be implemented without losing
the integrity and the safety parameters of the equipment.
81
•v
REFERENCES
[1] Sze, S.M. VLSI Technology New York: McGraw-Hill Publication, 1996.
[2] Texas Instmments. Autoload Single Slice Plasma Reactor Manual Dallas,
Texas: Texas Instmments, Inc., 1981.
[3] Plasma Deposition System, Texas Instmments, Inc , 1985.
[4] Robert H. Bishop. Learning With Labview. Reading, MA: Addison-Wesley Pub Co.
[5] National Instmments. PC-LPM-16 User Manual. Austin, Texas: National Instmments
Corporation, 1990.
[6] National Instmments. Lab-PC+ User Manual. Austin, Texas: National Instmments
Corporation, 1990.
[7] Manos, D.M.; Flann, D.L. Plasma Etching An Introduction, San Diego: Academic
Press Inc., 1991.
3
82
i-js?v»M.«-••«•«•. .<..Mi i!g:8a«r:!jjaaapjg!2.--
^PH
APPENDIX
83
1l
"•mmm
Power Supply Board - TB4
5V
W R T N -1W
-^15V
15V
RIN
?4V
RTN
24VATM
SW SVtf
24V
Signal Distribution
Board
rpif
1
Vello"**/
3
rvd
yellow
yi-lltjvv
blue
9
p*irpffr o^rartfji!
yi^llov^/
q r e: f n
To Di<dributiQn
1.
a
j
To t)5st(iljuit©h
Hoard
g»rt 7 9
i^»
.^ 3
A
MH:I
MFC2
1
titylvel red cjtR red gr»
?
!'
0
A
3
€';d
10 1?
ftV
Flow
cfn —rfic5!nrn?>'iur
,—Lii,—»r..i -
10
12
ryiFC
Connector
H "XV^^^^^f^^-N-A-^
( U li
•
A
ofg
1
MFO
TS1
blu
3
MJ ()1
Figure A. 1 Mass Flow Controller Wiring
84
•c^
Sctpauii
y~- •—Com
jgrn •
10
MftsL-J
it*d
ISv
Kw
—1—/~^
•*
50 49
DDAOG
20
..4
-J—4
'?
1
M
Hi^„t-iU
J
J:
= =rU
?4:
y ^
_u:-
i.< >•••••——»
J<D
I .
3
.i.><w
40
59
r i _
15"^
1.3
1/
13
7.1
n
li
35
I 19 37 \
h
-i^
J!5 3 /
r 1
f
SIGNAL CONN,
t
SOLENOID COf^M.
?\m ID
iS-
<!i
20
* U I - U J - rCO 7.013
PINi?
1
4
7
111
:f
•24V
Ml
A^l)
-.Alfj
sjig Ci.urs
ID
MFC1
MFQ
MFQ
c
CM2?! 1
A1^ i
3
12
^5
Figure A.2 Gas Control Circuitry
85
SETPOlPrs
FLC'A'
MFt:4
Atiz Corr
9m
PERMISSION TO COPY
In presenting this thesis in partial fulfillment of the requirements for a
master's degree at Texas Tech University or Texas Tech University Health Sciences
Center, I agree that the Library and my major department shaU make it freely
avaUable for research purposes. Permission to copy this thesis for scholarly
purposes may be granted by the Director of the Library or my major professor.
It is understood that any copying or publication of this thesis for financial gain
shall not be allowed without my further written permission and that any user
may be liable for copyright infringement.
Agree (Permission is granted.)
Student's Signature
Disagree
(Permission is not granted.)
Student's Signature
mm
mamm
Date
Date