1
THE EVALUATION OF
GRANT/YSI 3800
WATER QUALITY MONITOR
ENVIRONMENT AGENCY
042403
NRA
N.R.A.
Instrument Evaluation Centre
Fobney Mead : Rose Kiln Lane
Reading t RG2 OSF
E v a lu atio n
Centre
THE EVALUATION OF A GRANT/YSI 3800 WATER QUALITY MONITOR
A.J.Chappell BSc
Contents
Executive Summary
1.
Introduction
2.
Major findings
2.1 Implications for use
2.2 Instrument performance
2.3 Comments on use, construction, and documentation
2.4 Comments from field use
2.5 Manufacturer's comments
^
3.
Details of instrument evaluated
4.
Test Results
5.
Test procedures
6.
Definitions, abbreviations and references
Acknowledgements
Appendix : Calculations and reference measurements.
NRA\eval.03:1\93
1
Executive Summary
This report describes the evaluation of a Grant/YSI 3800 multi-parameterjwater
quality meter. It is designed for field use and measures dissolved oxygen,
temperature, pH, turbidity, conductivity, and ammonium.
The instrument responded well at .different flow rates, and the ammonium probe
was the only sensor to exhibit any response change with flow.
Water temperature affected the accuracy of all the censors except turbidity
and temperature.
The estuary results imply that the instrument could be used to support or
replace the oxygen and chloride titration carried out during a regular
monitoring run.
The ammonium probe response time changed considerably during the drift test,
increasing to approximately 30 minutes to obtain a stable reading. The
calibration of all the probes was stable throughout the test.
The storage cup for the sonde does not reflect the quality and price of the
instrument and is difficult to remove, especially when wet.
On a number of occasion the instrument software locked up, and could only be
reset by opening the logger and switching a dip switch on the main circuit
board.
The instruction manual is poorly organised and difficult to use.
Grant/YSI are still developing some aspects of the instrument particularly the
ammonium probe.
N R A \ e v a l . 0 3 : 1\93
3
1.
Introduction
This report describes the tests carried out to establish the reliability of
data produced by a Grant\YSI 3800. Tests have been carried out on a single
instrument taken new from those supplied to Thames Region for field use.
The Grant\YSI 3800 meter is a multi-parameter instrument used for field
monitoring of water quality. It has six sensors to measure temperature,
dissolved oxygen (%) , pH, conductivity, turbidity, and ammonium. From this
data values for dissolved oxygen (mg/1), ammonia, and salinity are derived.
The tests completed and reported here studied the effect of water flow rate,
water temperature, water salinity, and instrument drift in one month. The
tests were carried out on all instrument parameters in natural water taken
from the river Kennet at the NRA National Evaluation Centre at Fobney Mead,
and in the Thames Estuary. The instrument output was compared to analysis by
the NAMAS accredited laboratory at Fobney Mead.
The tests were carried out over four months to the end of November 1993 to a
test protocol agreed by Grant\YSI and the NRA. Further tests are being made
on an instrument with a different ammonium probe after recent developments by
Grant\YSI.
N R A \ e v a l .'03 : 1 \ 93
2.
Major findings
This section provides a summary of the test results and,includes subjective
comments about the instrument. Comments arising from field use of 30 other
instruments in Thames region are also noted here. For details of the
instrument performance during the test refer to section 4.
2.1 Implications for use
The results of these tests can be used to give an estimate of the measurement
uncertainty of the instrument for sampling measurements. If this is taken as
three times the standard deviation of the drift test (to give 95% confidence
values) we get the following values.
Dissolved Oxygen
Temperature
pH
Conductivity
Turbidity
± 6 %sat
± 0.2'C
± 0.2
± 39 pS/cm
± 3 NTU
(typically
(typically
(typically
(typically
(typically
100%)
15°C)
pH 8)
SSOpS/cra)
2 NTU)
Since the ammonium probe requires a long time to obtain a stable reading, and
because of the known interference from potassium and sodium then an
uncertainty value can not be produced for the ammonium and ammonia values.
Pollution officers' experience shows that the ammonium probe is useful for
special surveys where it is continuously immersed, but quickly becomes useless
for routine sampling tests because of the response time.
The results from the flow test show that the sonde does not need to be kept
moving to obtain an accurate DO reading. Also the variations caused by
temperature between +5 and +25’C are smaller than the values above.
The conductivity and pH readings are both corrected to a temperature of 25°C,
optional for the conductivity. The laboratory readings are corrected to 20°C
and this difference may cause some confusion and can generate differences of
11% of reading in conductivity values.
The values obtained for D/0, pH, and salinity, during a normal monitoring trip
into the Thames estuary were within the measurement uncertainty of the
laboratory and the uncertainty of titration carried out on the boat. Since the
instrument is easy to use it could reasonably replace or support the titration
measurements of oxygen and chloride.
When the problems associated with the ammonium probe are solved then regular
calibration and servicing using traceable and approved techniques could lead
to accurate and reliable measurements using this instrument.
2.2 Instrument performance
Water Flow rate
Only the ammonium probe showed any significant variation with flow, the other
probes performed well in this test especially the dissolved oxygen which was
significant better than most non - stirred DO probes. For use in high flows
a sinker weight is necessary because the sonde tends to swing on its cable and
lie horizontal on the water surface.'
NRA\eval.03:1\93
5
The dissolved oxygen showed a slight increase at flows greater than 0.3 m/s,
but the variation was less than 1% throughout the test which is less than the
reference uncertainty. This is significantly better than most non - stirred
DO meters.
The temperature difference varied by 0.1°C during the test which is similar
to the reference uncertainty.
The pH difference varied by less than 0.1 during the test.
The conductivity difference varied by less than the measurement uncertainty
during the test.
The turbidity sensor reading increased during the test, but this was not
related to the water flow. The reason is unknown, but it could be due to
fouling, air bubbles forming on the probe surface, or cavitation around the
sonde head.
The total ammoniacal nitrogen difference varied significantly from -1.7 mg/1
at 0 m/s to -2.4 mg/1 at 0.35 m/s. (The water was doped to approximately
8.6 mg/1 by addition of ammonium chloride).
Water temperature
The turbidity and temperature probes showed no significant change with
temperature, however the other probes all changed with temperature.
The dissolved oxygen % reading varied between 95,1 %sat at 4.6°C and 88.3 %sat
at 30.2°C, in aerated water. There is an apparent reduction in output of
0.14 %sat/°C. This is larger than the aanufacturer's specification of ±0.3%
between 5 and 45°C.
After conversion to mg/1 the reading difference compared to the theoretical
value for saturated water varied from -1.13 mg/1 at 9.2*C to -0.54 mg/1 at
45.1°C, and it increases with temperature by approximately 0.01 mg/1 per °C.
This is also outside the manufacturer's specification of ±0.6% reading between
5 and 45*C.
The temperature difference decreases slightly with temperature, however since
this is within the uncertainty of the reference system then it is not
significant.
The pH reading difference compared to laboratory values changed from +0.47 at
9.2*C to +0.07 at 45.4°C.
The conductivity difference compared to laboratory values varied from +6 iiS/cm
at 9.2*’C to +42 jiS/cm at 45.4°C. The difference increases with temperature
above 20°C
The turbidity difference varies between +1.0 NTU at 30.2°C and +3.4 NTU at
19.8°C. There does not seem to be any significant variation with temperature.
The total ammoniacal nitrogen difference compared to laboratory values varied
from -2.0 mg/1 at 19.8°C to -0.0 mg/1 at 45.40C. (The water was dosed to
approximately 7.5 mg/1 by addition of ammonium chloride).
N R A \ e v a l .03:1\93
6
Fouling and Drift - intermittent immersion
The only fouling observed during the test was a grey film which developed on
the ammonium probe membrane. This contributed to the slow electrode response,
and its removal only partially restored the probe.
There was no significant drift of any determinant, but the time needed to
measure ammonium\ammonia increased from a few minutes to approximately 30
minutes, which is not suitable for field use.
The details for each sensor are given below
The dissolved oxygen probe did not drift significantly compared to regular
Winkler tests. A drift of -4 % on the % saturation range show by the
instrument is probably due to a change in the atmospheric pressure during the
test, this would not cause a problem during normal operation if it is
calibrated each day. The average difference (error) and standard deviation
(random error) compared to winkler test is -0.46 +0.26 mg/1.
The temperature was stable within measurement uncertainty during the test. The
average difference (error) and standard deviation (random error) compared to
a type E thermocouple is +0.09 ± 0.05°C.
The pH difference compared to laboratory values fluctuated by less than 0.2
but showed no drift during the test. The average difference (error) and
standard deviation (random error) compared to laboratory analysis is
+0.007 ± 0.07.
During the test the conductivity difference compared to laboratory values
fluctuated from +51 |iS/cm to -10 jiS/cm with no apparent drift during the test.
The average difference (error) and standard deviation (random error) compared
to laboratory analysis is +14.7 ± 13.1 pS/cm.
The turbidity difference compared to on line measurements fluctuated between
0 and +5 NTU but showed no drift during the test. The average difference
(error) and standard deviation (random error) compared to on-line measurements
is +1.2 ± 1.0 NTU.
The variation of total ammoniacal nitrogen measurements compared to laboratory
values indicate the variations in the ammonium electrode combined with the
calculations of ammonia within the instrument. The total ammoniacal nitrogen
differences fluctuated between -1.5 mg/1 and +2.7 mg/1, and show no
significant drift during the test (The water was dosed to approximately 8 mg/1
by addition of ammonium chloride) . The average difference (error) and standard
deviation (random error) compared to laboratory analysis is
-0.02 ± 0.98 mg/1.
HOWEVER these readings were taken after the instrument reading had settled and
so hides the significant change of response time which occurred for the
ammonium measurements. At the start of the test the reading settled within 5
minutes, but near the end of the test it took approximately 30 minutes to
settle which would not be practical for field use. This was discussed with
Grant who suggested fouling of the electrode. A thick grey film had developed
over the membrane and the settling time was reduced to approximately 15
minutes when this was removed using de-ionised water from a wash bottle. At
the end of the test the response had increased again to approximately 20
minutes. Since the settling time was not measured during the test these values
are estimates.
NRA\eval.03:1\93
7
Salinity
The instrument was taken on a regular monitoring run to the lower Thames
Estuary, the differences observed berveen the instrument readings and the
laboratory results are within the laboratory uncertainty. From this comparison
it is not possible to find any effects of salinity on the instrument.
2.3 Comments on use, construction and documentation
The instrument generally robust and veil made, but there are a number of
things which cause problems in normal use.
The probes are protected by a tight fitting plastics cup which fits over the
outside of the sonde and is sealed by an O-ring. When a good water tight seal
is made it is very difficult to remove the cup, more so when wet, and the
water inside was spilt on a number of occasions. This is impracticable and
will sometimes make it difficult or impossible to use the instrument on a
river bank without help to remove the cup. The screw on cup now being
developed is preferable.
On a number of occasions the instrument software "locked up” and did not
respond to any keystrokes. This had to be rectified by opening the logger and
resetting it using a switch on the main circuit board. The batteries are also
changed by opening the logger. Both operations need to be carried out where
the circuit board can be protected from damp, dust, splashes, etc.
When transported by car the instrument switched itself on, this has also been
observed by pollution officers. This could be caused by vibration and may
indicate a problem with the board mount or the switches, and could result in
batteries failing. A rigorous vibration test may provide some useful
information for the manufacturer about this problem.
The manual contains a lot of information about the instrument, software, and
available probes. Unfortunately it is very badly organised with most of the
useful information contained in 2 sets of addenda approximately 50 pages long
(including addenda to the first addendum !). As a result the manual is very
difficult to use. There is no information about cross sensitivities of the
sensors, this is important since ammonium ion selective electrodes are known
to be sensitive to potassium and sodium which would give a false positive
reading in sea water an order of magnitude greater than an ammonium response.
The logger has been designed to IP65 (ie dust proof and splash proof) , but as
there is a risk that it could be accidentally immersed in a river this may be
inadequate. IP67 (ie dust proof and can withstand immersion to lm deep ) would
be more appropriate.
2.4 Comments from field use
This is a summary of work carried out by M Loewenthal, which is reported
separately, and of comments from pollution officers.
The manual is regarded as poor, difficult to use, and tends to make use of the
instrument seem more complicated than is the case. This has made one to one
training necessary when issuing instruments.
The ammonium probe is not highly regarded but it is the most demanded sensor
as it is an important environi&ental substance. It has been used successfully
NRA\eval.03:1\93
£
for in number of surveys.
For survey work there is a requirement for more versatile logging facilities,
particularly for a delay of start facility or some form of timer control to
start and stop logging.
There have been a number of comments about the batteries. These mainly concern
the need to open the logger to change batteries. Rechargeable batteries are
also requested.
2.5
Manufacturer's comments
Grant Instruments provided the following comments on the report :"We have separated out sensor performance and Indicated our understandings
based on the findings of this report and our own observations.
It was,
however, not possible to interpret all the results without detailed knowledge
of the experimental procedure. It should be noted that tests were carried out
on a single logger and sonde and the results cannot be viewed as indicative
or definitive for the product line as a whole. Overall we believe that the
report is thorough in its approach and will turn out to be reasonably
favourable with regard to the 3800 performance.
A)
Sensor Performance
i)
Dissolved Oxygen Sensor
We do not fully understand how the temperature dependence of the DO
probe accuracy was assessed. We would assume that the instrument was
calibrated in air at 100% and that water sparged with air was measured
directly with the sonde. In this case the meter should read 100% when
the water is at the calibration temperature.
The highest value
reported was 95% saturation.
Could some of the error be due to
inadequate saturation and equilibration of the water as temperature was
varied? We believe that the variation associated with temperature and
drift with time would be eliminated by carrying out the recommended
calibration immediately before making measurement.
The DO drift observed seems reasonable but it is unlikely that all 4%
drift would be due to atmospheric pressure alone.
ii)
pH Sensor
The offset between the instrument and laboratory measurement with
changes in temperature could be due to the instrument being set for
automatic buffer temperature correction during calibration, which is
incorrect if non-Grant/YSI pH calibration solutions are used.
This
would cause an estimated error of approximately 0.2pH.
It should also be noted that the temperatures are not compensated to
25°C as indicated in our manual and the NRA report. Our manual is in
error on this point and will be corrected.
iii)
Turbidity Sensor
The scattered measurements with changes in water flow rate are almost
certainly due to air bubbles from the air saturated-water in the flow
tank forming on the sensor. The bubbles would not be present in still
water or water taken to the laboratory because the sample would deaerate in transit.
iv)
Ammonium Sensor
The problem of increased response time in use is being investigated and
NRA\eval.03:1\93
9
an alternative sensor is currently on laboratory and field trials and
to date no increase in response time has been noted. We also wait for
results of NRA trails on the new probes.
In both cases YSI recommend storage of the ammonium probe in
'confidence solution'. The observed variations in ammonium recording
with flow have been observed but not to the extent indicated in the
report. It may well be that the error is due to slow response observed
on this probe.
v)
Conductivity Sensor
Salinity - we were glad that these tests were made and that the results
indicate the instrument is useful in brackish water.
B)
Other Points
i)
Lock-up
We do not understand the reported lock-up and we have not received
other reports with version 4 firmware which is current in all NRA 3800
loggers. We would like you to make further tests on a different logger
to see if the symptoms persist.
ii)
Screw on
We agree
on rigid
February
iii)
Battery Access
Two alternative proposals to overcome the need to open logger case are
being investigated with the view to designing one which can be ordered
for retrofitting.
iv)
Batteries
YSI are investigating use of alkaline rechargeable batteries for use in
the 3800.
We will keep you informed on our findings and would
encourage the NRA to test these or similar batteries.
v)
Instruction Manual
We acknowledge the comment made on the shortcomings of our user manual.
An updated and revised manual will be produced to overcome the
criticisms and we plan to have this available in March 1994.
vi)
Waterproofing
The logger is water resistant to IP65 (proof against low pressure jets
of water) . For proofing against immersion we recommend fitting the
logger in an IP66 waterproof case. We have recently quoted for 50 such
cases after producing a prototype.
Sonde Cap
entirely with your point on the plastic transit cap. A screw
cap has been designed and will be available from the end of
and can be ordered for retro-fitting at €82 less NRA discount.
CONCLUSION
This report covers a wide range of tests and experiments on the 3800
Water Quality Logger and could obviously be the basis of further
investigation.
The following four experiments are not very time
intensive and could be fairly definitive in determining if some of the
problems encountered were due to the particular 3800 user.
a)
With a different 3800, transfer the sonde from confidence
solution to river water spiked with lOmg/L ammonium and check the
time required for stabilisation on a sonde containing one of the
Analytical Sensors ammonium probes supplied recently.
N R A \ e v a l .03:1\93
10
b)
Run a separate logger over a 4/5 week basis to see if any lock-ip
occurs.
c)
Re-run the effect of temperature change on dissolved oxygen
accuracy, but sparge the water more vigorously with air and for
longer periods of time prior to recording and reading, making
sure that the sparged va:er reads close to 100% saturation at the
air calibration temperature.
We take the opportunity to thank the NRA for investing time and effort in
obtaining a better understanding of water quality measurement in the field.
It is from this type of basic work that we at Grant/YSI can further develop
and improve our instrumentation in line with your requirements."
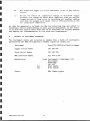
3.
Details of Instrument evaluated
The instrument tested was selected at random from a batch of instruments
purchased by the NRA and supplied to Thames region for normal use
Instrument
Grant/YSI 3800 Water Quality Logger
Logger Serial Number
381 200 444
Sonde Serial Nunber
381 500 505
NRA reference Number
31L 444 S 505
Manufacturer
Tel
Fax
Grant Instruments (Cambridge) Ltd
Barrington
Cambridge
CB2 5QZ
0763 260811
0763 262410
NRA Thames region
Source
NRA\eval.03:1\9 3
11
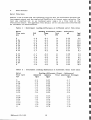
4.
Test Results
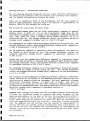
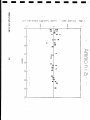
Water Flow Rate
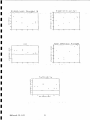
Tables 1 and 2 below and the following figures shov zhe difference between
instrument output and the analytical results at different water velocity.
test was carried out in an isolated water sample in a flow tank at
evaluation centre. See appendix A for details of the calculations involved
an estimate of uncertainties.
Che
The
the
and
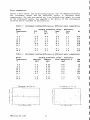
Table 1 : Instrument reading difference at different water flow rates
Reading difference (Grant - Reference)
Turb
Temp.
PH
NTU
•c
Water
Flow rate
m/s
D/0
%
0
0.04
0.10
0.17
0.20
0.26
0.32
0.35
-1.8
-1.9
-1.9
-2.0
-2.0
-1.8
-1.6
-1.4
-0.1
-0.1
-0.2
-0.1
-0.1
-0.1
-0.1
-0.2
26
36
36
39
39
i3
51
58
0.30
0.32
0.33
0.34
0.35
0.36
0.37
0.33
9.4
11.9
12.5
13.0
13.6
12.1
8.7
8.3
0.35
0.30
0.24
0.15
0.10
0.04
0
-1.7
-1.9
-2.0
-2.0
-2.2
-2.0
-2.6
-0.1
-0.1
-0.2
-0.2
-0.2
-0.1
-0.1
61
63
64
63
54
58
70
0.30
0.31
0.31
0.31
0.31
0.31
0.32
5.9
5.9
6.1
8.3
14.0
19.6
31.9
Cord
Table 2 : Instrument reading difference at different: water flow rates
Water
Flow rate
m/s
Reading difference (Grant - Reference)
Ammonium
Ammonia
Total ammoniacal Nitrogen
mg/1
mg/l
mg/l
0
0.04
0.10
0.17
0.20
0.26
0.32
0. 35
-2.5
-3.0
-3.2
-3.2
-3.3
-3.4
-3.4
-3.3
0.27
0.26
0.25
0.25
0.27
0.28
0.30
0.25
-1.7
-2.1
-2.2
-2.3
-2.4
-2.4
-2.4
-2.3
0.35
0.30
0.24
0.15
0.10
0.04
0
-3.2
-3.3
-3.2
-3.1
-3.0
-2.9
-2.6
0.23
0.24
0.24
0.25
0.29
0.28
0.31
-2.3
-2.4
-2.3
-2.2
-2.1
-2.0
-1.8
NRA\eval.03:1\93
12
D i s s o i ved Oxygen %
T e ^ o e r a i j r e
«
■
«
■ •
•» •
•
9- 9
Total
■
f
Conduct i v i ty
corrected10 75oeoc
Q +
A r r o n i a c a i Ni t r o g e n
«
•
« •
•
**
*«
T u "b
id i
•
•
-
•.
‘
9
9 9
t y
ik
4
•
m
«■
%
•
•
4
•
1
5o*«o"vs
N R A \eval.03:1\93
13
*
■
. . . . . . .
■
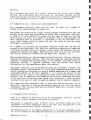
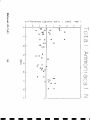
Water temperature
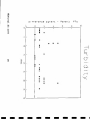
Tables 3 and 4 below, and the following figures, show che difference between
the instrument output and the analvtical results at different water
temperatures. The test was carried out in an isolated water sample in a tank
at the evaluation centre. See appendix A for details of the calculations
involved and an estimate of uncertainties.
Table 3 : Instrument reading difference at different water temperatures
Water
Temperature
WC
D/0
%
Reading difference (Grant - Reference)
Turb
D/0
Temp.
NTU
mg/1
•c
pH
4.6
9.2
19.8
30.2
40.4
45.4
*4.9
-8.2
-9.3
-11.7
-9.8
-9.3
-0.8
-1.1
-1.0
-0.9
-0.7
-0.6
0.0
0.1
0.1
-0.1
-0.2
-0.2
2.3
2.2
3.4
1.0
1.3
1.3
0.46
0.47
0.41
0.20
0.09
0.07
45.1
19.8
-8.6
-5.5
-0.5
-0.6
*0.1
-0.0
3.0
3.0
0.14
0.53
Table 4 : Instrument reading difference at different water temperatures
Water
Temperature
•c
Reading difference (Grant - Reference)
Ammonium
Amaonia
Total ammoniacal N
mg/1
mg/1
ng/1
Gcnd
4.6
9.2
19.8
30.2
40.4
45 .4
-1.3
-2.8
-3.0
-1.5
-0.5
-0.3
0.23
0.28
0.37
0.26
0.19
0.26
-0.8
-1.9
-2.0
-0.9
-0.2
-0.0
7.8
5.8
9.1
16.7
28.6
42.5
45.1
19.8
-1.8
-3.0
0.12
0.74
-1.3
-1.7
21.1
9.1
co n d u c ti v i ty
correctedto25oegC
d i^ fe ^ n c *
Cor o ni • T/C)
Deg C
Te m p e ratu re
lO'*
NRA\eval.03:1\93
0*7 C
%
D isso lved
Ox;, g e n
mg/ I
C rani
rea o in ^
D i s s o I ved Oxygen
i
9f
*"
Total
C o r » r >C
*
LflOJ
dm
oH
ai11wr«oc*
8 ■’
T u r b idi t y
N R A\eval.03:1\93
15
am m oniacal
N itro g e n
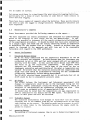
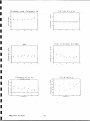
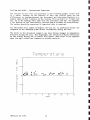
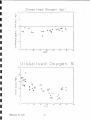
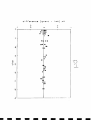
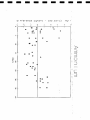
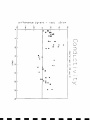
Fouling and drift - intermittent Immersion
The results of this test are presented in the following graphs, rather chan
in a Cable, because of the quantity of data. The results given are the
differences in reading between the instrument and laboratory analysis of a
sample taken within 3 minutes of the reading. This was done 2 or 3 times each
day. Up to 20 readings were made with the instrument each day. See appendix
A for details of the calculacions involved and an estimate of uncertainties.
The author should be contacCed if numerical data is required.
All the probes were stable throughout the test but, as previously stated, the
response of the ammonium probe slowed considerably during the test.
The drift in the dissolved oxygen % sat data follows changes in atmospheric
pressure during the test. This highlights the necessity of daily calibration
of the sensor during use to reduce this effect. This drift Is not apparent
when the mg/l values are compared to winkler analysis.
em nerat ure
o
(3
Q)
o
0 .5
O
w
c
10
L
0>
w
<D
U
c
(1)
<1)
U—
«+—
"0
- 0 .5
NRA\eval.03:1\93
16
O x y g e n
mg/
I
difference
Cgrant
D i s s o l v e d
days
Gr a n t
out put
96sat
D i s s o Iv e d Oxygen
days
NRA\eval.03:1\93
17
%
1
1 as
0
s
H
a
iso
0
0
1
0
B
B Ei
B
0
S s
B
□ B
M
0
H
B
Sa
E H
S
a
ca
HK
to M
13
-
N
1
0
B
3
Lab}
4
S
H
H
-
S
S
mg / l
1
o t a I A m m o n ia c a
NRA\eval.03:1\93
C9r a nt : c a l c
difference
S
■
difference
1
C9 r a nt
0 EE
B E S3
s
a ©
0
ia
0 E a s
0H
a
_
as
Ba
E
t 38
3
days
a
eg
G
cB
c) a
s
8 a
roa
a
ta M
cJ3
a 3
-
lab}
1
pH
I
di f i ' e r e n c e
( g r a n t .ca ic
-
Lab :ca l c^
mg/ I
o
1
vO
U>
H E
1
0
a
b
c B )
IS ]
M
S
a
M
q
m
B
5E
>
a
1
3
H
H
vO
Q
DJ
<in w
o
H
B
S
a
c s
S
3
O
D
a
a
DJ
s s
I
El a
E
B
3
B
S 3
1
3 E
difference
1
CQr a n ^
'is
8
e
E
SB
HR
0
(3
-
Lab.caIc)
1
a
ro
lj
1 □
ca
1
1
0
ra
H
3
a
e
'a
a
a
a
s
days
E
0
Ammon i um
8 0
a
b
E
(j
0 B
H H
0
a
mg/I
a
a
_
a
a a
a
8
' 0
E
0
i
NRA\eval.03:1\93
to
o
difference
C9r a nt
-
Panel)
FTU
difference
Cgrant
-
lab}
uS/cm
B fi
0Car
0H
o
n
&
B £3
n
o
a
□
a
(\> C~
5Aep
W
C-3C-3
CXB
£ O
r+
on
o.
n;
<
o
f— b
o
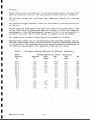
Salinity
Table 5 below shows the difference in readings obtained between the grant\YSI
3800 and laboratory results. The uncertainties quoted below are estimates.
The salinity values are calculated from laboratory analysis of chloride
levels.
The dissolved oxygen reference values are from winkler titration carried out
on the boat.
The pH reference measurements were made with a Russel electrode within a CSP
system, there were no corrections made for salinity in either the reference
measurements or the 3800 measurements. Because of this it is not possible to
attribute the trend show in these results to changes in the instrument.
The conductivity reference values have an uncertainty of ±3 mS/cm.
Ammonium measurements are not Included because the electrode response time was
too long, and because of the large interference caused by sodium and potassium
in the sea water. The turbidity results are omitted because of uncertainty in
the reference measurements. The temperature probe was not tested.
Table 5 : Instrument reading difference at different salinities
Water
Salinity
%o
Reading difference (Grant
Salinity
Cond
D/0
%o
raS/cm
%
37.6
37.6
36.7
34.3
29.3
26.7
20. 8
15.5
12. 0
9.0
9.0
-3.2
-3.2
-3.2
-3.3
-0.5
6.1
1.4
0. 0
0. 2
0. 1
0.3
5.6
3.4
2.4
1.4
NRA\eval.03:1\93
-
2.2
-0.7
-
0. 8
0.4
-1.7
0.8
1.3
0.3
-2.9
-
0.2
-0.9
0.8
1.6
0.8
3.2
2.1
2.2
2.3
-0.3
2.6
0.1
3.2
-
4.0
-
0.2
1.4
0.7
21
2. 6
2.1
1.0
1.3
0.9
Reference)
D/0
mg/1
0.2
0.4
0.4
0.4
0.4
0.4
0.3
0.3
0.3
0.4
0.3
0.3
0.3
0.2
0. 2
0.2
pH
0.6
0.6
-0.5
-0.4
-0.4
-0.3
0.2
0.2
0.1
-
-
-
0.0
0.1
0.1
0.0
0.1
0.2
5.
Test procedures
Water Flow Rate
The probe was calibrated according to manufacturer’s instructions ie dissolved
oxygen was calibrated at 100%, turbidity at 0, 200 and 800 FTU, pH at 4,7,and
10, and ammonium at 1 and 100 mg/l. The additional temperature and
conductivity calibration points for ammonium were not set. Temperature and
conductivity were not calibrated since they are factory set.
The sonde was then be placed in the large flow tank containing an isolated
sample of river water. The flow rate was varied from 0.04 to 0*37 m/s,
measured by an electromagnetic flow meter.
Ammonium Chloride was added to the tank to give approximately 10 mg/l
ammonium, and it was aerated throughout the test to naintain the DO level at
100% . The temperature was monitored by a Type E thermocouple and samples were
taken during the test for analysis by a NAMAS accredited laboratory of pH,
conductivity, total ammoniacal N, and turbidity.
Water temperature
The dissolved oxygen probe was calibrated in air, according to the
manufacturer's instructions, and the ammonium probe was calibrated at 1 and
100 mg/l. The optional ammonium calibration points to correct for temperature
and conductivity were not set.
The sonde was placed in a tank of recirculated river water to which was added
Ammonium Chloride to give approximately 10 mg/1 ammonium, and which was
aerated throughout the test to maintain the DO level at 100%, The water
temperature was stabilised at the following temperatures and the instrument
outputs noted : 4.6°C, 9.2°C, 19.8°C, 30.2*C, 40.4*C, and45.4°C. The test was
repeated at two decreasing temperatures.
The temperature was monitored by a Type E thermocouple and samples were taken
at each temperature for analysis by a NAMAS accredited laboratory of pH,
conductivity, total ammoniacal N, and turbidity.
Fouling and Drift - intermittent Immersion
The probe was calibrated according to manufacturer's instructions ie dissolved
oxygen was calibrated at 100%, turbidity at 0, 200 and 800 FTU, pH at 4,7, and
10, and ammonium at 1 and 100 mg/l. The additional temperature and
conductivity calibration points for ammonium were not set. Temperature and
conductivity were not calibrated since they are factory set.
The sonde was then regularly immersed (up to 20 times) in class 1 river water
then returned to its storage condition on each working day for one month. In
order to generate a measurable level of ammonium it was necessary to trap a
sample of water and add a known amount of ammonium chloride. The temperature
was monitored by a Type E thermocouple and samples were taken during the test
for analysis by a NAMAS accredited laboratory of pH, conductivity, total
ammoniacal N, turbidity, and dissolved oxygen.
The trend in levels of D/0, temperature, pH, conductivity, ammonium
concentration, and turbidity of the water were monitored using standard water
quality instruments.
The sonde was also occasionally immersed in the fish breeding ponds at Fobney
N R A \ e v a l .03:1\93
22
Mead, and was used once in estuarine conditions at Crossness. During the last
week=of-the-test the^ sonde was-placed^in-the=intermittent immersion tank- a:
Fobney to be immersed automatically up to 10 times because of the pressure of
time .
Salinity
The instrument was taken on a normal monitoring run into the Thames estuary.
It was mounted in a bucket with a continuous supply of river\sea water taker,
from the normal monitoring supply pumped into the boat. Measurements were made
in water with salinity levels varying from 36%o to l%o and were compared to
laboratory analysis of samples taken at the same time. Winkler titration were
carried out on the boat as part of the regular monitoring, along with chloride
titration.
Laboratory analysis provided values for pH, conductivity, chloride, anc
ammonium concentration. The reference salinity values were calculated fron
laboratory chloride analysis.
6.
References
A Chappell and M Loewenthal : Test protocol for Grant/YSI 3800 water qualitv
meter.
M Loewenthal : Evaluation report on Grant 3800 water quality meter.
I Baldwin : Protocol for investigation of ion selective ammonium electrodes
and their applications in field measurement.
BSI : BS6068:section 2.15 (1986)
electrochemical probe method.
Determination of
dissolved oxygen
D Neville et al : NRA evaluation reports on DO meters.
Acknowledgements
Thanks must be given to Mr M.Loewenthal and the AWQMS staff, and to the
Laboratory staff at Fobney Mead.
NRA\eval.03:1\93
23
Appendix : Calculations and Reference measurements
Dissolved Oxygen
For rag/1 values the reference measurements are made by Winkler titration. The
uncertainty is assumed to be ±0.5mg/l from observation.
For %sat values the water is aerated to 100%, or to other values, by bubbling
air or Oxygen\Nitrogen certified mixtures through river water. The uncertainty
is assumed to be ±3% from observation.
Saline Dissolved Oxygen
For mg/1 values the reference measurements are made by Winkler titration. The
uncertainty is assumed to be ±0.5mg/l from observation.
The %sat values are obtained by calculating the oxygen solubility from the
temperature and the chloride values using the tables given in BS6068, then
calculating the % saturation from the winkler values. The chloride levels were
obtained by laboratory analysis of the samples submitted.
Temperature
The reference measurements were made using a type E thermocouple with the cold
junction compensation within a Schlumberger IMP data acquisition unit. The
uncertainty is taken as ±0.1°C.
PH
The pH is compared against laboratory measurements made using an automated CSP
pH meter. During the drift test the readings were confirmed by comparison with
the monitor panel. The traceable uncertainty is ±20% of reading.
Conduc tivity
The conductivity is compared against laboratory measurements made using an
automated CSP conductivity meter. The laboratory readings were given as
conductivity at 20°C, this adjusted to 25°C for comparison with the instrument
values using a temperature coefficient for the water of 1.91% per “C. The
traceable uncertainty of the laboratory values is ±20% of reading.
Salinity
The salinity values of sea and estuarine water were calculated from laboratory
measurements of chloride in samples submitted for analysis by the following
relationship:
SALINITY = CHLORIDE x 1.80655
Turbidity
Turbidity was measured in the laboratory using a Hach 2000 turbidimeter, and
these results were used to check the values obtained in the temperature and
flow tests. For the drift test the turbidity readings were compared against
a pHox 750L on-line turbidimeter.
NRA\eval.03:1\93
24
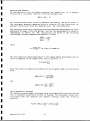
Ammonium and Ammonia
An equilibrium is _set up between ammonium and ammoniagas in an aqueous
solution by a reversible reaction involving hydrogen ions.
NH< - jVtf3 + H'
The relationship between ratios of ammonium and ammonia, and pH are known so
the instrument measures ammonium directly using an ISE then calculates the
ammonia concentration from the ammonium level, pH, and temperature.
The reference values were calculated from the laboratory measurements of Total
ammoniacal Nitrogen (TotN) and pH (pH), and the site measurements of absolute
temperature in Kelvin (T) . The calculations are based on the following
relationship between ammonium and ammonia in water :
1 ^ 1 _ lO P "
10'
|m/;|
where
2 7 2 9 lo
69£_+0
c ==_£_/_££_
^1 1 0 5 - 0 . 0 0 0 0 7 1 T
The flow injection system adds alkali to the sample before measurement and the
level of ammonia in the sample after that is given by A :
A =TotNx 17
14
Hence the levels of ammonium and ammonia in the original sample are calculated
from :
1 7 X l0 „ J
1 8 x l O p"
and
18
ioc
Total Ammoniacal Nitrogen
The laboratory measurements were made using an automaced flow injection system
with a traceable uncertainty of ±20% of reading. The instrument values were
calculated from the ammonium and ammonia readings using the following
equation:
TotN= ( IJOT; I x - ^ i ) + { \NH, I x — )
18
NRA\eval.03:1\93
25
3
17