1
The Evaluation of a pHOX Model 962 Hand-Held Dissolved
Oxygen Meter
wrc
Fk
R&D 220/28A
NRA
THE EVALUATION OF A pHOX MODEL 962 HAND-HELD DISSOLVED OXYGEN
METER
D A Neville, M M I Harman, P D Whalley and A Chappell
Research Contractor:
WRc pic
Henley Road Medmenham
PO Box 16 Marlow
Buckinghamshire SL7 2HD
National Rivers Authority
Rivers House Waterside Drive
Almondsbury Bristol BS12 4UD
Evaluation Report 220/28/T
National Rivers Authority
Rivers House
Waterside Drive
Almondsbury
BRISTOL
BS12 4UD
Tel: 0454 624400
Fax: 0454 624409
© National Rivers Authority 1993
All rights reserved. No pan of this document may be reproduced, stored in a retrieval
system or transmitted, in any form or by any means, mechanical, photocopying, recording
or otherwise without the prior permission of the National Rivers Authority.
Dissemination Status
Internal: Restricted
External: Restricted
Statement of use
This evaluation repon is one of a series produced by the NRA National Evaluation Facility
in conjunction with WRc. The performance of an individual item of equipment is described
in terms of both laboratory and field tests. Information concerning the reliability,
applicability and cost of ownership of instruments is provided where possible.
Research Contractor
This document was produced under R&D Contract 220 by:
WRc pic
Henley Road Medmenham
PO Box 16 Marlow
Buckinghamshire
SL7 2HD
Tel: 0491 571531
Fax: 0491 579094
WRc Reference: NR 3432/4245
NRA Project Leader
The NRA’s Project Leader for R&D Contract 220:
Tim Reeder - Thames Region
Additional Copies
Further copies of this document may be obtained from Regional R&D Co-ordinators or the
R&D Section of NRA Head Office.
CONTENTS
Page
EXECUTIVE SUMMARY
1
KEYWORDS
1
1.
INTRODUCTION
3
2.
DETAILS OF EQUIPMENT EVALUATED
5
3.
MAJOR FINDINGS AND COMMENTS
7
4.
EVALUATION PROCEDURES
9
4.1
4.2
4.3
4.4
4.5
4.6
4.7
4.8
4.9
4.10
4.11
Sensor stabilisation
Battery life
Effects of low battery power
Effect of flow at the sensor surface
Effect of immersion depth
Effects of Interferents
Calibration
Accuracy tests
Response time tests
Salinity correction/compensation
Field assessments
9
9
9
10
10
10
11
11
12
12
12
5.
OBSERVATIONS
15
5.1
5.2
5.3
5.4
5.5
5.6
Documentation
Design and Construction
Installation
Commissioning
Maintenance and Downtime
Ease of Use
15
15
16
16
16
16
6.
RESULTS
17
7.
INSTRUMENT BEHAVIOUR
29
8.
MANUFACTURER'S COMMENTS
31
9.
COST OF OWNERSHIP
33
ACKNOWLEDGEMENTS
35
DEFINITIONS AND ABBREVIATIONS
37
220/28/T
i
C O N TEN TS (continued)
Page
REFERENCES
39
APPENDIX A
LABORATORY ANALYSIS OF FIELD DATA
41
APPENDIX B
FIGURES
45
APPENDIX C
MANUFACTURER’S SPECIFICATION
49
220/28/T
ii
LIST O F TABLES
6.1
6.2a
6.2b
6.3
6.4
6.5
6.6
6.7
6.8a
6.8b
6.8c
6.8d
6.8e
6.8f
6.9
6.10
6.11
6.12a
6.12b
6.13a
6.13b
6.14
6.15
220/28/T
Page
Instrument stabilisation readings for different temperature changes
Power consumption
Battery Characteristics
Effects of different power supply voltages on instrument readings
Instrument readings for different Flows at the sensor surface
Instrument readings at different Depths
Instrument Readings for two Interferents
Instrument readings for commonly employed Calibration techniques
Instrument readings at different Dissolved Oxygen levels - Test 1
Instrument readings at different Dissolved Oxygen levels - Test 2
Instrument readings at different Dissolved Oxygen levels - Test 3
Instrument readings at different Dissolved Oxygen levels - Test 4
Instrument readings at different Dissolved Oxygen levels - Test 5
Summary of Accuracy Data
Response time tests - Oxygen Sensor
Response time test - Temperature Sensor
Instrument Readings for different levels of Salinity
Field Data - Class 1A River
Field Data - Class 3 River
Instrument Readings for daily Calibration Check - Class 1A River
Instrument Readings for daily calibration check - Class 3 River
Systematic and Random Errors for daily calibration check
Systematic and Random Errors for field Data
iii
17
18
18
19
20
20
21
21
22
22
23
23
24
24
25
25
25
26
27
28
28
29
29
220/28/T
EXECUTIVE SUMMARY
This report describes the results of an evaluation of a pHOX 962 Hand-held Dissolved Oxygen
meter. The evaluation was undertaken by the NRA (Thames Region) at the Evaluation and
Demonstration Facilities at Fobney Mead, Reading and Lea Marston, Birmingham according
to an evaluation protocol jointly devised by WRc and the NRA.
The pHOX 962 dissolved oxygen meter comprises a meter unit and separate oxygen probe
assembly. The meter unit is a neat and functional design based in a plastic-case.
The meter unit is both compact and light and presented no difficulties during operation. The
sophistication provided by the in-built software (particularly the use of the security protected
menus) means that the user is required to read the manual thoroughly before operation. Once
the user has become familiar with the controls the 'quick' guides provided with the
documentation allow the user to follow the required switch sequences with little difficulty.
The instrument display was clear and legible and incorporates a useful backlight for use in low
ambient light.
In two of the test procedures there appeared to some temperature affect on the instrument
readings.
The total error (quadrature sum of random and systematic errors) for five test concentrations
varied between 1.6% and 5.7%. It should be noted that Winkler determinations of these
solutions gave a total error of 6% to 25%. For the field evaluation the total error calculated
against Winkler determinations was 0.77 mg 1 "1 for Lea Marston and 0.44 mg 1” * for Fobney
Mead.
The instrument cost £695.00. No maintenance or repairs were required during the four month
evaluation.
KEYWORDS
Dissolved Oxygen, Evaluation
NRA Evaluation Report 220/28/T
220/28/T
1
1.
INTRODUCTION
This report describes the evaluation of a pHOX Model 962 Hand-held Dissolved Oxygen
Meter.
A discussion of the chemistry of oxygen in natural waters may be found in the protocol
document (Harman 1993). However a resume is given here to assist in the understanding of
the evaluation methods applied.
Following the principle of Henry's Law, the concentration of dissolved oxygen in a sample of
water is directly proportional to the partial pressure of oxygen in equilibrium with that water
sample at a constant temperature; assuming that air has an oxygen content of 20.94% v/v (and
is saturated with water vapour). In addition, the solubility of oxygen in w ater (or air) is
dependent on the concentration of other dissolved species within the water and atmospheric
pressure.
An instrumental procedure for the measurement of dissolved oxygen in water involves the use
of an electrochemical cell (often called an oxygen electrode or sensor), the response of which
is proportional to the thermodynamic activity of oxygen in solution.
Electrochemical sensors with membranes can be of two types; galvanic and polarographic. The
pHOX Model 962 is fitted with the Mackereth electrode, the most commonly used galvanic
electrochemical cell. The cell consists of a perforated silver cathode in the form of a cylinder
which surrounds a lead anode. An aqueous or gel potassium hydroxide solution (often
saturated with potassium hydrogen carbonate to eliminate interference from carbon dioxide)
acts as an electrolyte and fills the space between the cathode and the anode. T he electrolyte is
confined by a thin polythene or silicone membrane which is supported by the cathode. Oxygen
which diffuses through the membrane is reduced at the cathode to give a current proportional
to the partial pressure of oxygen. A detailed description of the theory of membrane-covered
oxygen electrodes is given in (Hitchman 1978).
Generally, the current output from the cell is converted to either a reading equivalent to the
percentage saturation of oxygen in water, or to the actual concentration in terms of mg O 2 1 ‘ ^
The evaluation was undertaken by the NRA (Thames Region) at the Evaluation and
Demonstration Facilities at Fobney Mead, Reading and Lea Marston, Birmingham in
accordance with an evaluation protocol jointly devised by WRc and the NRA. The protocol
allows the instrument to be assessed in a manner commensurate with typical use in the field.
The objectives of the assessment were as follows;
•
to assess the performance characteristics of hand-held dissolved oxygen meters currently
in use within the NRA,
•
to provide information on the appropriate application of the instruments, the correct
method of use, and calibration and maintenance procedures, and
•
to establish methods of use which optimise the performance and the quality of the data
obtained for the instruments presently in use and those currently commercially available.
220/28/T
3
2.
DETAILS OF EQUIPMENT EVALUATED
Manufacturer:
pHOX Systems Ltd
Iver Road
Shefford
Beds.
SG17 5JU
Supplier:
pHOX Systems Ltd
Iver Road
Shefford
Beds.
SG17 5JU
Tel:
Fax:
0462 817070
0462 814191
Instrument Description:
Model 962 Hand-held Dissolved Oxygen M eter
Seriai Number:
7511
Sensor Type:
Galvanic
The manufacturer’s specification for the instrument is described in Appendix C.
220/28/T
5
3.
MAJOR FINDINGS AND COMMENTS
This section provides a summary of the major findings and conclusions for the evaluation.
The pHOX 962 dissolved oxygen meter comprises a meter unit and separate oxygen probe
assembly. The meter unit is a neat and functional design based in a plastic case.
The meter unit is both compact and light and presented no difficulties during operation. The
sophistication provided by the in-built software (particularly the use of the security protected
menus) means that the user is required to read the manual thoroughly before operation. Once
the user has become familiar with the controls the 'quick' guides provided with the
documentation allow the user to follow the required switch sequences with little difficulty.
The instrument display was clear and legible and incorporates a useful backlight for use in low
ambient light.
When the probe is transferred from different temperature regimes the manufacturer states that
the probe should be allowed 1 minute per 2°C change before a reading is taken. This was
confirmed during the evaluation .
The instrument display is blanked, after a warning message, before the readings are affected by
a decrease in the power supply.
Only a very low flow was required (>0.10 m S"l) to achieve the expected 100% saturation
reading, however, once achieved there appeared to be some instability in the reading.
There is no effect on the readings by varying the immersion depth.
The total error (quadrature sum of random and systematic errors) for five accuracy test
concentrations varied between 2 and 4.5%. It should be noted that Winkler determinations of
these solutions gave a total error of 2.0% to 4.7%.
The manufacturer does not state a response time. It can be seen that the response for the
oxygen and temperature sensors are similar. This will mean that the response of the instrument
is not limited by either parameter.
The salinity correction on this instrument produced readings that were comparable with the
expected readings from published salinity tables (Weiss, 1974).
During the field trials there was no significant (95% confidence levels) drift at either of the
evaluation sites. The total error (quadrature sum of random and systematic errors) was
0.19 mg 1 "1 for Lea Marston and 0.31 mg l"1 for Fobney Mead.
The instrument did not require any maintenance during the four months of the evaluation.
220/28/T
7
4.
EVALUATION PROCEDURES
The evaluation and demonstration facility at Fobney Mead, Reading and Lea Marston,
Birmingham have been previously described (Baldwin 1991) as have the test procedures
(Harman 1992). A brief description of each test is provided for information.
4 .1
Sensor stabilisation
The instrument was calibrated according to the manufacturer's instructions. Following
calibration the instrument was switched off and the sensor assembly stored in its transit
container for at least 1 hour prior to the test.
The sensor was then placed in a 100% air-saturated solution under different temperature
regimes. Readings were taken after 10, 30, 60, 120, 180, 300, 600 and 1200 seconds
immersion.
Three different temperature change regimes were tested:
•
•
•
4 .2
Sensor stored at room temperature, test solution at 20 °C,
Sensor stored at room temperature, test solution at 5 °C.
Sensor stored at 5 °C, test solution at 5 °C.
Battery life
The power consumption was recorded whilst the instrument measured a 100% air-saturated
sample. Measurements were also taken using the display backlight.
In addition, note was also made of the make and type of battery fitted (for comparison with the
manufacturer's documentation) and the nominal battery voltage and capacity.
4 .3
Effects of low battery power
The battery (or batteries) were replaced by an adjustable stabilised power supply and oxygen
and temperature readings were taken at a range of reduced voltages.
The power supply voltage was adjusted downwards whilst observing the dissolved oxygen and
temperature readings and a note made of the supply voltage at which the readings changed or
became unstable.
The readings were taken with the instrument probe immersed in a 100% saturated sample. The
instrument was allowed adequate time to discharge any capacitance before the readings were
taken.
The voltage at which the 'low battery' indicator (if fitted) operates was noted.
220/28/T
9
4 .4
Effect o f flow nt the sensor surface
The effect of flow on the sensor was investigated by taking measurements from the sensor in
test solution at 100% air-saturation at a range of flow rates. The work was carried out in the
outside flow tank at Fobney. Flow was measured by a water current meter accurate to
± 0.03 m s- l. Two sets of measurements were taken at the following range of flow rates; 0.05
m s"l, 0.13 m s ‘ ^ 0 .1 9 m s ‘ l, 0.27 m s" l, 0.35 m s'* and 0.37 m s 'l
4 .5
Effect o f immersion depth
The effects of depth on the instrument sensor were measured using a specially constructed 2metre long, 0.2 m diameter PVC tube. The construction details have been described previously
(Harman 1992). The test column was filled with tap water and aerated to achieve a 100% airsaturated solution at room temperature.
The instrument was calibrated using the manufacturer's standard procedure and the sensor
immersed to the specified depth and allowed five minutes to reach equilibrium before readings
were taken. Continuous aeration maintained a flow of 0 to 0.03 m s'* past the sensors.
Two sets of dissolved oxygen concentration, % saturation and temperature readings were taken
at 0.3, 1.0 and 2.0 metres depth.
4 .6
Effects o f Interferents
The instrument was calibrated using the manufacturer's instructions.
The sensor was placed in twenty litres of 100% air-saturated de-ionised water. A reading was
taken once it had stabilised. To produce a solution with a residual chlorine level of 30 mg H ,
7.5 ml of (8% available chlorine) sodium hypochlorite solution was added. A second reading
was then taken.
For the temperature interference test the required temperatures were maintained by the control
system at Fobney. The actual temperatures were recorded using type E thermocouples. After
calibration of the sensor according to the manufacturer's instructions, readings were taken in
100% air-saturated water held at 10 °C (± 0.1 °C). The meter was switched off until the
control system raised the test temperature to 30 °C. The heated water was subsequently aerated
to 100% saturation and the reading recorded.
220/28/T
10
4 .7
Calibration
The instrument was calibrated in air according to the manufacturers instructions. Readings
were then taken in 100% air-saturated tap water and 100% air-saturated river water. The
instrument was then calibrated in 100% air-saturated tap water and th e measurements repeated.
4.8
Accuracy tests.
Test solutions were prepared by diffusing mixtures of the oxygen and nitrogen gas through tap
water. The gas mixtures had certified oxygen content of 0.00%, 8.80%, 15.30% and 28.80%
respectively. By dividing these values by the percentage of oxygen in air the theoretical
percentage saturation dissolved oxygen level could be calculated. These were 0.00%, 42.0%,
73.1%, and 137.5%. A fifth level, 100% air-saturation, was achieved by bubbling air through
tap water.
Prior to the test the dissolved oxygen concentrations were verified b y Winkler determination
(SCA 1979).
To reduce the effects of temperature variation between the various test solutions all tests were
carried out at ambient room temperature. However, in order to allow subsequent comparison
of the data, the temperature of each test solution was noted.
Prior to the test the instrument was calibrated for 100% air-saturation dissolved oxygen in
distilled water in accordance with to the manufacturer's instructions.
The sensor was placed in each of the test solutions, in ascending order of dissolved oxygen
concentration, and allowed to stabilise before the readings were taken. The sensor was then
placed in each of the test solutions, in descending order, allowed to stabilise and further
readings taken.
This test sequence was repeated five times.
The sensor was returned to its transit container for a period of at least 5 minutes between each
successive set test solutions.
Readings were taken for each measurand provided by the instrument (e.g. mg 1~1, % sat. and
°C) and the temperature of the various test solutions recorded using a graduated mercury
thermometer or type E thermocouple.
220/28/T
11
4 .9
Response tim e tests
4 .9 .1
O x y g e n sensor
The instrument was calibrated prior to the test using solutions prepared according to the
standard method. The temperature of the test solutions was 20 ± 0.1 °C.
The sensor was placed in each solution, in turn, and the time taken for the instrument to
register a measurement within 90% of the step change recorded, i.e. when the sensor was
removed from the 0% solution; the time required for the reading to reach 90% saturation and,
following stabilisation at 100%, and when the sensor was placed back into the 0% solution;
the time required for the reading to reach 10% saturation.
The test cycle was repeated 3 times.
4 .9 .2
Tem perature sensor
The instrument was calibrated prior to the test in accordance with the manufacturer’s
instructions.
The sensor was placed in two test solutions, 25 ± 0.2 °C and 5 ± 0.2°C in turn, and the time
taken for the instrument to register a measurement within 90% of the step change recorded,
The test cycle was repeated 3 times.
4.10
Salinity correction/compensation
Test solutions were prepared by the addition of 2, 5, 10, 20 and 40 g H NaCl in distilled
water. The solutions were maintained at 100% saturation throughout the tests. The sensor was
placed into each test solutions, and once stabilised, the concentration, % saturation and
temperature readings were noted. Readings were then made after adjusting the salinity
compensation control to the appropriate setting.
4.11
Field ossessments
At the beginning of the test the sensor was calibrated in accordance with the manufacturer's
instructions.
Once the instrument had been calibrated no further adjustment of the calibration took place
until the end of the field test.
The sensor was immersed into the continuous sample stream of a Class 1A river three times
220/28/T
12
each day for a period of 2 weeks. Percentage saturation, dissolved oxygen concentration and
temperature readings were recorded manually from the meter. The sensor was returned to the
transit container and the instrument switched off between readings.
Triplicate Winkler determinations were taken to coincide with the daily readings. The time at
which the Winkler samples were taken were noted to enable comparison of the results from
the standard water quality monitors installed at the particular site.
Each day the sensor was immersed in 100% saturated water and th e displayed result noted.
Independent temperature and atmospheric pressure readings were also taken.
The instrument battery condition was checked daily and replaced if necessary. Note was kept
of any necessary battery changes.
This procedure was repeated on a Class 3 river.
During the test the water was monitored for the following parameters: temperature, dissolved
oxygen , pH, conductivity, turbidity and ammonium (Class 3 river only).
Daily samples were also taken for laboratory analysis.
220/28/T
13
5.
OBSERVATIONS
5.1
Documentation
A 51 page A5 size instruction manual was supplied with the instrument.
The manual is very comprehensive and provides detailed information on the instrument and its
controls and instructions on the use of the security protected menus, calibration of temperature
and oxygen sensors, maintenance procedures, use of the in-built data logging facilities and a
general specification for the meter unit and the probe assembly. The manual is well written
and unambiguous and provides a very detailed description of the operational use of the
instrument. The need for an index in such a large manual has been offset by the use of contents
pages for each section.
A full description of the possible calibration procedures is provided for the temperature sensor
and a 2-point oxygen calibration covering air calibration and air-saturated water methods,
including diagrams to illustrate the apparatus recommended. Although an altitude correction
table has been included no correction table has been given for atmospheric pressure correction.
No data is provided for the effects of commonly known interferents and no discussion is given,
of instrument component, probe related and calibration related measurement errors.
The maintenance section of the manual provides information on cleaning and replacement of
the sensor assembly. Detailed drawings are provided to enable correct re-assembly of the
components.
A fault finding section is included in the manual, however, no detailed servicing instructions
or list of accessories and replacement parts is included.
Other minor omissions relate to the lack of dimensions of the probe assembly in the probe
specification section and the pre-determined period used for automatic cut-off of the backlight
function is not stated.
The manual includes general information on Health and Safety, however, no specific
information is given for the storage, use or disposal of chemicals that may be used during
calibration e.g. Winkler reagents, sulphite solutions etc.
5.2
Design and Construction
The pHOX 962 dissolved oxygen meter comprises a meter unit and separate oxygen probe
assembly. The meter unit is a neat and functional design based in a plastic case.
The various functions are provided by membrane switches on the front panel, some of which
have multiple functions. The instrument's internal software enables the use of security
protected menus (accessed via special keys) to prevent the unauthorised use of the calibration
220/28/T
15
mode.
The meter weighs approximately 1 kg including batteries. The IP rating of the instrument is
not stated.
A large LCD panel meter is fitted to the meter. The display incorporates a backlight facility.
The backlight will automatically switch off after a pre-determined period.
No facility is provided for housing the probe or lead during transit.
The probe is a membrane covered galvanic type sensor incorporating a thermistor for
temperature measurement and compensation, housed within the upper body of the probe
assembly.
5 .3
Installation
None Required
5 .4
Commissioning
None Required
5 .5
Mninlennnce and Downtim e
No maintenance was required during the four months of the evaluation.
5 .6
Eose o f Use
The meter unit is both compact and light and presented no difficulties during operation. The
sophistication provided by the in-built software (particularly the use of the security protected
menus) means that the user is required to read the manual thoroughly before operation. Once
the user has become familiar with the controls the ’quick' guides provided with the
documentation allow the user to follow the required switch sequences with little difficulty.
The instrument display was clear and legible and incorporates a useful backlight for use in low
ambient light.
220/28/T
16
6.
RESULTS
Table 6 .1
220/28/T
Instrument stabilisation readings for different temperature changes.
Temperature Change. (°C)
Time
(secs)
Dissolved
Oxygen
Sensor
Room Temperature —> 5°C
15
30
60
120
180
300
600
1200
75
90
94
97
97
99
100
102
Room Temperature —» 21°C
5
30
60
120
180
300
600
1200
104
104
104
104
104
104
104
102
5°C
15
30
60
120
180
300
600
1200
88
95
97
99
99
100
100
102
5°C
17
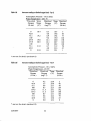
Table 6 .2 a
Table 6 .2 b
Power consumption
Meter Setting
V
OFF
ON
Backlight on
8.51
8.29
7.26
0.61
5.19
16.78 139.11
40.70 295.48
NOT STATED
Rechargeable Pack
7.2 V
1 Ah
NOT STATED
Effects o f different power supply voltages on the instrument readings.
Power
Supply
(Volts)
8.51
7.99
7.49
6.99
6.51
6.01
5.49
220/28/T
mW
Battery characteristics.
Battery Make
Battery Type
Battery Voltage
Battery Capacity
Replacement Interval
Table 6.3
mA
Instrument
Setting
%
sat.
106
106
106
106
106
106
-
18
mg I-1
°C
9.8
9.8
9.8
9.8
9.8
9.8
Display
Blank
17.3
17.3
17.4
17.4
17.4
17.4
-
Table 6 .4
Instrument readings for different flows at the sensor surface
Water Temperature - 10.3 (°C)
Flow
Rate
(m S-l)
0.35
0.30
0.24
0.16
0.10
0.05
0.00
0.04
0.09
0.13
0.19
0.29
0.37
Table 6.5
Dissolved Temp. Dissolved
Oxygen
Oxygen
(°C)
(mg H )
(% sat.)
10.7
10.6
10.5
10.5
10.5
10.4
10.2
10.6
10.8
10.8
10.9
11.0
11.1
11.2
11.2
11.2
11.2
11.2
11.2
11.2
11.2
11.2
11.2
11.2
11.3
11.3
100
100
100
99
100
98
96
100
102
102
104
104
106
Instrument readings at different immersion Depth
Water Temperature 17.9 °C
Depth Dissolved Temp. Dissolved
Oxygen
Oxygen
(m)
<°C)
(mg I"1)
(% sat.)
0.3
1.0
2.0
0.3
9.0
9.8
9.6
9.4
18.9
18.9
18.9
19.0
All Dissolved Oxygen levels were unstable
220/28/T
19
102
108
108
106
Table 6.6
Instrument readings for two different Interferents
Dissolved Temp. Dissolved
Oxygen
(°C)
Oxygen
________________________ (mg I"*)__________ (% sat.)
Toble 6 .7
Interferent
Level
Temperature
10°C
30°C
10.3
7.4
10.2
30.2
95
102
Chlorine
0 mg r 1
30 mg 1“
1
8.8
8.8
21.3
21.8
102
104
Instrument readings for commonly employed Calibration techniques
Sample
(100% saturation)
Dissolved Temp. Dissolved
Oxygen
Oxygen
(°C)
(mg I"1)
(% sat.)
River Water
River Water
Dechlorinated Tap Water
* calibrated in dechlorinated tap water
! calibrated in air
220/28/T
20
8.6
8.4
8.3
21.0
21.0
20.7
100
98
96
Table 6.8a
Instrument readings at dissolved oxygen levels -Test 1
Atmospheric Pressure - 102.0 (kPa)
Water Temperature - 19 °C_______________
*Dissolved
Dissolved Temp. Dissolved
Oxygen
Oxygen
(°C)
Oxygen
(% sat.)
(mg I- *)
(% sat.)
0
42.0
73.1
100
137.5
137.5
100
73.1
42.0
0
0.0
4.1
6.9
9.1
12.1
11.9
9.1
6.9
4.1
0.0
17.4
18.4
18.3
18.4
19.3
19.7
19.3
19.7
20.9
20.8
0
45
76
100
136
136
102
78
47
0
* see text for details (Section 4.8)
Table 6.8b
Instrument readings at dissolved oxygen levels -Test 2
Atmospheric Pressure - 101.7 (kPa)
Water Temperature - 22,1 °C______________
*Dissolved
Dissolved Temp. Dissolved
Oxygen
Oxygen
(°C)
Oxygen
(% sat.)
(mg 1"1)
(% sat.)
0
42.0
73.1
100
137.5
137.5
100
73.1
42.0
0
0.0
4.2
6.7
8.9
11.9
12.0
9.0
6.8
4.0
0.1
♦see text for details (section 4.8)
220/28/T
21
21.5
22.5
21.6
21.2
22.4
22.8
21.6
22.5
23.9
22.8
0
50
79
104
142
144
106
82
49
1
Table 6.8c
Instrument readings at dissolved oxygen levels - Test 3
Atmospheric Pressure - 101.3 (kPa)
Water Temperature - 20.1 °C
♦Dissolved Water
Dissolved Temp. Dissolved
Oxygen
Temp.
Oxygen
Oxygen
(°C)
(% sat.)
(mg
H
)
(% sat.)
(°C)
0
42.0
73.1
100
137.5
137.5
100
73.1
42.0
0
18.4
0.3
4.0
6.9
9.2
12.1
12.1
9.0
6.7
4.0
0.1
19.2
19.8
20.5
21.0
21.8
18.7
19.6
19.4
19.0
20.0
20.7
20.2
21.2
22.3
22.1
3
46
77
102
138
140
102
78
47
1
* see text for details (section 4.8)
Table 6.8d
Instrument readings at dissolved oxygen levels - Test 4
Atmospheric Pressure - 101.2 (kPa)
Water Temperature - 23.9°C
♦Dissolved
Dissolved Temp. Dissolved
Oxygen
Oxygen
Oxygen
<°C)
(% sat.)
(mg 1-1)
(% sat.)
0
42.0
73.1
100
137.5
137.5
100
73.1
42.0
0
0.2
3.7
6.4
8.7
11.5
11.3
8.7
6.4
3.6
0.0
* see text for details (section 4.8)
220/28/T
22
23.0
24.0
23.3
22.5
24.2
24.4
23.1
24.4
25.8
25.2
2
46
78
104
142
140
104
79
47
0
Table 6.8e
Instrument readings at dissolved oxygen levels - Test 5
Atmospheric Pressure - 101.7 (kPa)
Water Temperature - 26.0°C
♦Dissolved Water
Dissolved Temp. Dissolved
Oxygen
Oxygen Temp.
Oxygen
(°C)
(mg I '1)
(% sat.)
(% sat.)
(°C)
0
42.0
73.1
100.0
137.5
137.5
100.0
73.1
42.0
0
25.3
0.1
3.7
6.3
8.4
11.1
11.0
8.3
6.1
3.7
0.1
25.2
25.6
26.1
26.4
26.9
25.5
26.5
25.5
24.4
25.8
26.3
25.3
26.6
27.1
27.1
2
48
80
104
140
142
106
79
49
2
* see text for details (section 4.8)
Toble 6.81
Winkler Accuracy for the Test Solutions
♦Actual
Dissolved
Oxygen
(% sat.)
Instrument
Readings
Winkler
Readings
Random
Error
-1.1
-5.4
-5.5
-3.4
-2.5
Systematic
Error
1.10
1.58
1.65
1.90
2.67
Random
Error
-5.74
-8.42
-3.98
-1.88
-13.42
Systematic
Error
2.01
5.98
4.06
4.14
21.43
0
42.0
73.1
100
137.5
* see section 4.8 for details
220/28/T
23
Response time tests - Oxygen Sensor
Table 6.9
Step change low to high Dissolved Oxygen*
Step change high to low Dissolved Oxygen *
Time 1
(seconds)
Time 2
(seconds)
Time 3
(seconds)
22.68
36.59
21.12
29.84
19.78
30.94
* see text for details (section 4.9)
Table 6 .1 0
Response time Test - Temperature Sensor
Step change low to high Temperature (°C)*
Step change high to low Temperature (°C)*
Time 1
(seconds)
Time 2
(seconds)
Time 3
(seconds)
23.37
24.50
22.75
23.91
22.63
24.28
* see text for details (section 4.9)
Table 6 .1 1
Chlorine
(mg 1"1)
0
5
10
20
40
20
10
5
0
220/28/T
Instrument readings for different levels o f Salinity.
No
Saline Adjustment
Water Dissolved Temp. Dissolved
Temp. Oxygen
(°C)
Oxygen
(°C)
(mg l"1) _________ (% sat.)
18.1
17.9
18.2
19.0
19.4
19.9
19.9
19.9
20.7
9.4
9.5
9.4
9.4
9.2
9.3
9.3
9.4
9.2
18.3
18.1
18.4
19.1
19.6
20.1
20.1
20.1
20.9
100
100
100
102
100
102
102
102
104
24
Saline Adjustment
Dissolved Dissolved setting
Oxygen
Oxygen
(mg H )
(% sat.)
-
-
-
9.0
8.6
8.0
7.2
7.8
8.5
8.9
100
100
102
100
102
102
102
7
13
23
33
23
13
7
-
-
_
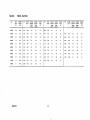
Reid Data-Class 1 A River
Table 6.12a
Instrument
Dissolved
Oxygen
(mg I '1)
Instrument
Dissolved
Oxygen
<% sat.)
Instrument
Temp.
<°C)
Time
11.48
11.4
98
8.7
18:00
11:50
11.48
11.6
100
8.9
103.4
12:42
12.02
11.8
100
7.8
103.7
11:25
12.10
12.3
03/02/93
8.2
103.9
11:53
11.90
04/02/93
7.8
103.4
12:26
05/02/93
7.1
103.5
08/02/93
9.0
09/02/93
Date
Water
Temp.
(°C)
Atmospheric
Pressure
(It Pa)
Time
28/01/93
8.6
100.8
15:53
29/01/93
8.8
101.7
01/02/93
8.3
02/02/93
Winkler
(mg I"1)
Instrument
Dissolved
Oxygen
(mg I '1)
Instrument
Dissolved
Oxygen
(% sat.)
Instrument
Temp.
CC)
11.38
11.4
98
8.7
14:37
11.62
11.4
99
9.0
16:52
8.4
14:11
12.33
11.8
100
8.4
104
7.9
14:23
12.00
12.1
102
12.1
102
8.2
17:11
11.90
11.9
12.00
12.2
102
7.9
16:35
11.80
12.07
11.19
12.8
106
7.2
15:52
103.4
11.36
11.69
11.8
102
9.1
8.7
103.!
10.48
11.49
11.8
102
11/02/93
7.8
102.9
12.55
11.78
12.3
10/02/93
7.1
103.0
12.08
11.98
12.7
220/28/T
Winkler
(mg/1)
Instrument
Dissolved
Oxygen
(mRl*1)
Instrument
Dissolved
Oxygen
(% sat.)
Instrument
Temp,
11.41
11.5
99
9.0
16:49
12.02
11.8
100
8.2
8.1
16:28
12.35
12.1
102
8.1
102
8.3
18:09
11.76
11.9
102
8.3
12.1
102
7.9
18:13
11.80
12.1
102
7.8
11,99
12,7
104
7.1
16:48
12.60
12.6
104
7.1
15:45
11.45
11.6
100
9.2
17:03
11.35
11.5
100
9.2
8.9
14:42
11.35
11.7
100
8.8
17:20
11.88
11.7
too
8.7
104
7.9
16:45
11.94
12.2
102
7.7
106
7.2
25
Time
Winkler
(m g l* 1)
CC)
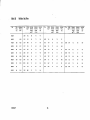
Table 6 .1 2b
Date
Field Data - Class 3 River
Water
Temp.
(°C)
Atmospheric
Pressure
WinkJer
( m g r 1)
(KPa)
Instrument
Temp.
(°C)
(mgr1)
Instrument
Dissolved
Oxygen
(% sat.)
Instrument
Dissolved
Oxygen
Time
Winkler
( m g r 1)
Instrument
Dissolved
Oxygen
( m g r 1)
Instrument
Dissolved
Oxygen
(% sat.)
Instrument
Temp.
7.62
8.0
70
9.1
102.8
13:57
7.62
8.2
72
9.6
15:2$
7.41
8.0
70
9.7
17/02/93
10.6
102.6
13:59
6.90
7.5
67
10.3
15:12
7.04
7.5
68
10.8
18/02/93
10.9
101.7
15:27
7.04
7.5
68
10.7
15:48
7.21
7.5
68
10.8
19/02/93
8.9
101.9
11:47
6.53
8.1
70
8.8
13:20
7.30
8.2
72
22/02/93
9.0
102.1
15:06
7.68
8.5
73
9,0
16:00
7.77
8,4
23/02/93
8.0
102.6
09:25
6.84
7.5
62
7.9
11:20
7.07
24/02/93
10.0
102.5
15:01
7.18
8.0
71
9.9
15:40
25/02/93
8.7
101.5
09:25
6.50
7.2
62
8.6
26/02/93
8.2
11:41
7.18
7.7
66
8.3
01/03/93
6.8
13:30
8.00
9.7
79
6.6
220/28/T
101.4
Time
Winkler
(m gl*1)
(°C)
15:00
15/02/93
16/02/93
Time
Instrument
Dissolved
Oxygen
(m g r )
Instalment
Dissolved
Oxygen
(% sat.)
Instrument
Temp.
(8C)
16:06
6.87
7.6
68
10.9
9.1
14:21
7,74
8.3
73
9.3
73
9.1
16:30
7.76
7.5
72
9.2
7.9
67
8.2
11:39
7.37
8.0
68
8.3
7.11
7.9
70
10.0
16:35
7.22
7.9
70
10.1
9:55
6.67
7.2
62
8.5
11:15
6.81
7.5
65
8.6
12:45
6.97
7.7
66
8.7
13:25
6.98
7.7
67
8.9
26
Table 6 .1 3a
Table 6 . 13b
220/28/T
Instrument readings for Class 1A - Calibration Check
Date
Time
28/01/93
29/01/93
01/02/93
02/02/93
03/02/93
04/02/93
05/02/93
08/02/93
09/02/93
10/02/93
11/02/93
15:46
11:43
12:34
10:45
11:45
12:20
11:59
11:29
10:40
12:49
12:00
Atmospheric Dissolved Temp.
Oxygen
Pressure
(°C)
(kPa)
(mg l ' 1)
10.3
11.1
11.0
12.1
11.3
11.2
11.5
11.3
10.0
11.4
11.5
108.8
101.7
103.4
103.6
103.9
103.4
103.5
103.4
103.1
102.9
103.0
14.5
11.7
11.9
8.5
11.5
11.8
10.8
11.7
16.2
11.1
10.4
Dissolved
Oxygen
(9b sat.)
102
102
102
104
104
104
104
104
102
104
104
Instrument reading for Class 3 river - Calibration Check
Date
Time
Atmospheric
Pressure
(kPa)
16/02/93
17/02/93
18/02/93
19/02/93
22/02/93
23/02/93
24/02/93
25/02/93
26/02/93
01/03/93
13:47
13:47
15:17
12:26
15:00
11:11
14:55
9:50
12:30
13:25
102.8
102.6
101.7
102.0
102.1
102.7
102.5
101.5
100.4
101.4
Dissolved Temp. Dissolved
Oxygen
Oxygen
(°C)
{% sat.)
(mg I '1)
12.0
10.9
11.3
11.0
12.2
11.8
8.7
11.9
11.4
14.3
27
7.6
12.9
11.5
13.8
7.4
9.3
8.7
8.2
9.7
3.8
100
104
104
108
102
102
102
102
100
110
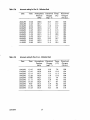
Table 6 .1 4
Table 6 . 1 5
220/28/T
Random and Systematic Errors for calibration data
Test
Class 1A River
Class 3 River
Mean
Random error
Systematic error (Bias)
Total Error
Sample size
103.3
3.3
1.0
3.5
11
103 A
3.4
3.1
4.6
10
Random and Systematic Errors for field data
Test
Class 1A River
Class 3 River
Random error
Systematic error (Bias)
Total Error
Sample size
-0.18
0.40
0.44
29
-0.68
0.36
0.77
27
28
7.
INSTRUMENT BEHAVIOUR
This following section describes the general performance of the instrument during the various
test procedures.
During the evaluation it was noted that all percentage saturation values above 100% were
reported to a resolution of 2%.
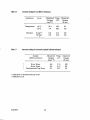
Table 6.1 shows the stabilisation of the percentage saturation readings for different
temperature regimes. It can be seen that in two of the test regimes a stable reading is not
achieved until after 5 minutes. The manufacturer states that the probe should be allowed 1
minute per 2°C change before a reading is taken. A temperature change of 15°C would
therefore require 7.5 minutes to stabilise. Where there was no temperature change the
readings still takes up to 5 minutes to stabilise for the lower temperature regime. At the higher
temperature the meter reading is stable after five seconds, although the level is higher than
would be expected. This suggests that there may be a temperature effect.
Given the stated battery capacity (Table 6.2b) and the power consumption (Table 6.2a) the
expected battery life can be calculated. This value, 60 hours, is well above that stated by the
manufacturer (20 hours).
The instrument display is blanked, after a warning message, before the readings are affected
by decreasing the power supply (Table 6.3). The manual states a shut down will occur at 5.5
volts, it was found to occur at 5.71 volts.
The effect of flow on the sensor performance is given in table 6.4. It shows that only a very
low flow is required (>0.10 m s'O to achieve the expected reading, however once achieved
there appeared to be some instability in the reading. The manufacturer does not state a
minimum flow rate.
Table 6.7 shows the effect of immersion depth on the instrument reading. It can be seen that
there is no effect on the readings, although the readings are higher than the expected 100 %
saturation.
Table 6.6 demonstrates the effect of the presence of two possible interferents on the meter
readings. At a temperature of 10°C 100% air-saturation (corrected for pressure) would be
achieved at a dissolved oxygen level of 11.30 mg I- *, whilst a t 30°C there would be
7.58 mg H dissolved oxygen present. At the higher temperature levels the meter reading is
correct whereas the lower temperature is incorrect. This supports the findings in the
stabilisation test that there may be some temperature effect on the readings.
The addition of sodium hypochlorite, to achieve a concentration o f 30 mg 1"! of residual
chlorine, had no effect on the displayed values.
Only minor disparities were noted between the different calibration techniques used (Table
6.7).
220/28/T
29
The instrument accuracy was tested on 5 separate occasions and compared with a range of
oxygen/nitrogen gas mixtures. These results are presented in tables 6.8a - 6.8e. The random
and systematic errors for the instrument and the Winkler determinations are provided in Table
6.8f. The total error (quadrature sum of random and systematic errors) for five test
concentrations varied between 2 and 4.5%. It should be noted that Winkler determinations of
these solutions gave a total error of 2.0% to 4.7%.
The variation in the Winkler titration for the nominal zero dissolved oxygen concentration
means that it is not possible to establish if hysterisis is an important factor with this
instrument.
The manufacturer does not state a response time. It can be seen that the response for the
oxygen and temperature sensors are similar. This will mean that the response of the
instrument is not limited by either parameter.
The salinity correction on this instrument can be seen to produce readings that are within the
tolerance limits of the instrument (Table 6.11 and Appendix C). The accuracy of these
readings can be confirmed by referring to previously published salinity tables (Weiss, 1974).
Table 6.13a shows the calibration check data for the Class 1A river. A correlation coefficient
calculated for this data against time shows that there is no significant (95% confidence limits)
drift with time. Table 6.13b shows the calibration check data for the Class 3 river. A
correlation coefficient calculated for this data against time shows that there is no significant
(95% confidence limits) drift with time.
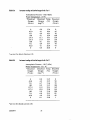
Table 6.14 shows the systematic and random errors for the calibration check data for the Class
1A and 3 river. This test should show if there is any drift in the calibration of the instrument.
This shows that the total error was 4.6% in the Class 3 river and 3.4% in the Class 1A river. If
this is compared to the Winkler determinations for the 100% saturation solution, it can be seen
that their total error is 4.5%. This would indicate that there is more variability in the Winkler
determinations than the instrument readings. The same statistical test was applied to the river
water results (Table 6.12a and 6.12b). In this case the readings were made in mg l'l. The
mean of the readings is not stated since there will be naturally occurring variation in dissolved
oxygen concentration over the test period. The results describe the variation of the readings
given by the test instrument as compared to that made by the Winkler determinations. The
total error was 0.77 mg 1 for the Class 3 river and 0.44 m g H for the Class 1A river. It can
be seen that the variations are small, particularly if the variability in the Winkler
measurements are assumed to be similar to those seen in the accuracy tests.
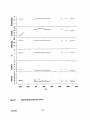
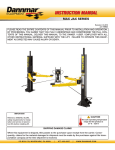
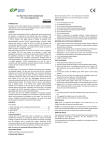
Data from automatic water quality instrumentation for the Class 1A and Class 3 river are
show in figures B1 and B2 respectively. Other water quality parameters were monitored by
daily sampling and laboratory analysis. These results are provided in tables A 1 and A2.
220/28/T
30
8.
MANUFACTURER'S COMMENTS
The instrument loaned for assessment was supplied with the incorrect carrying case; the
Model 962 dissolved oxygen meter is currently supplied with a water proof holster for use in
the field.
The user manual will be amended to incorporate more specific details of the instrument's
power supplies, e.g. battery packs etc.
In the section on instrument behaviour reference is made to the instrument resolution for
dissolved oxygen values above 100% saturation being only 2%. This feature was in fact, a
requirement in the specification for the NRA multiparameter hand-held meter which
unfortunately, had been carried over into the design of the Model 962. The software is
currently being changed to allow the instrument to display results to a resolution of 1%
throughout its' measurement range.
We- are already aware of the adverse temperature effect stated within the report and are
currently re-designing the head of the oxygen electrode to relocate the temperature sensors,
thereby eliminating the effect of the mass of the electrode body on the temperature
stabilisation.
Furthermore, since the loan of the model 962 for assessment we have undertaken further
development of the instrument which is now incorporated into the new pHOX corporate
enclosure to IP67 standard.
220/28/T
31
9.
COST OF OWNERSHIP
The pHOX Model 962 Hand-Held Dissolved Oxygen Meter
(including carrying case, all accessories and an alternative shoulder holster).
£695.00
The electrode cartridge
(One supplied, expected life, typically one year)
£32.00
Battery pack
(One supplied expected life dependant on usage, typically one year)
£35.00.
Membrane kit
(One supplied, expected life, typically 2 years)
£ 11.00.
220/28/T
33
ACKNOWLEDGEMENTS
The authors would like to thank;
•
the NRA staff at Fobney Mead and Lea Marston for their help in providing laboratory and
water quality data,
•
the analysis staff at WRc for providing calibration solutions, and
•
pHOX systems for the loan of the instrument.
220/28/T
35
DEFINITIONS AND ABBREVIATIONS
Error (of indication) of a measuring instrument (BS 5233): The indication of a measuring
instrument minus the true value of the measurement.
Response time (WSA/FWR 7-00-02): The time interval from the instant a step change occurs
in the value of the property to be measured to the instant when the change in the indicated
value passes (and remains beyond) 90% of its steady state amplitude difference.
Random Error: describes the way in which repeated measurements are scattered around a
central value. It therefore defines the precision of the instrument.
Systematic Error (Bias): is present when results are consistently greater o r smaller than the
true value. The magnitude and direction of systematic error will depend on the properties of
the sample (pH, temperature, turbidity and interfering species).
Drift: Change of the indicators of an instrument, for a given level of concentration over a
stated period of time under reference conditions which remain constant.
220/28/T
37
REFERENCES
Baldwin I G (1992) Instrument Performance Assessment Standard Test Protocols- Revision
A. NRA Project Report 220/9/T.
Baldwin I G, Harman M I and van Dijk P (1992) Evaluation of Multiple Parameter Hand-held
Meters. NRA Project Record 63/9/ST.
British Standards Institute (1986) Glossary of terms used in Metrology. BS5233.
British Standards Institute 1980 (1987) Methods of measurement of fluid flow: estimation of
uncertainty of a flow-rate measurement. BS 5844.
Harman M M I (1992) Protocol for Investigation of Hand-held Dissolved Oxygen Meters.
NRA Project Record 220/7/T.
Hitchman M L (1978) Measurement of dissolved oxygen. Chemical Analysis Vol 49.
HMSO (1981) Methods for the examination of waters and associated materials in waters.
International Standards Organisation (1985) Evaluation of the performance characteristics of
gas analysers. ISO 8158-1985(E).
WAA Process Systems Committee (1992) Water Industry Specifications, Information, and
Guidance notes. WSA/FWR 7-00-00.
Weiss R F (1974) Carbon Dioxide in Water and Sea water; The solubility o f a non ideal Gas,
Marine Chemistry, Vol 2, p203-215.
220/28/T
39
APPENDIX A
220/28/T
LABORATORY ANALYSIS OF FIELD DATA
41
Table A1
Dale
Water Quality Laboratory Analysis Class 1A River
Time
PH
Sulphate
as S 0 4
Conductivity
Copper
as Cu
Ammoniacal
N as N
Nitrite
as N
Chloride
as Cl
Calcium
as Ca
Magnesium
as Mg
Sodium
as Na
Potassium
as K
Nitrate
as N
mg r 1
pS cm ' *
Pg I ' 1
mg I '1
mg r *
mg I ' 1
mg I '1
mg I '1
mg r l
mg r l
mg r 1
28/01/93
16:15
8.0
35
538
<5
<0.05
<0.05
23
117
3
12
3
5.7
29/01/93
11:45
8.0
36
519
<5
<0.05
<0.05
24
118
3
12
2
5.1
01/02/93
12:40
8.1
35
535
<5
<0.05
<0.05
22
120
3
12
2
5.7
02/02/93
16:25
8.1
34
542
<5
<0.05
0.06
22
118
3
12
2
5.7
03/02/93
12:30
8.0
33
539
<5
<0.05
<0.05
5
114
3
II
2
4.7
05/02/93
12:30
7.9
44
534
<5
<0.05
<0.05
22
117
3
II
2
5.7
08/02/93
10:50
8.1
45
535
<5
<0,05
0.05
23
115
3
11
2
5.6
09/02/93
11:30
8.0
26
536
<5
<0.05
<0.05
23
118
3
11
2
5.8
10/02/93
14:15
8.1
31
538
<0.05
<0.05
31
11/02/93
14:05
8.1
31
539
<0.05
<0.05
23
220/28/T
<5
43
5.5
3
3
11
2
6.0
Table A2
Date
Water Quality Laboratory Analysis • Class 3 River
Time
pH
Sulphate
as S 0 4
Conductivity
Copper
as Cu
Ammoniacal N
as N
Nitrite
as N
Chloride
as Cl
Calcium
as Ca
Magnesium
as Mg
Sodium
as Na
Potassium
as K
Nitrate as
N mg/1
mg r*
fiS cm**
Mg I*1
mg I '1
mg r*
mg I '1
mg I '1
mg r 1
mg I '1
mg I '1
mg r 1
15/02/93
16:00
7.1
128
835
30.4
1.45
0.27
100
74
18
72
15
15.5
16/02/93
15:00
7.0
135
911
45.7
1.51
0.39
123
85
21
90
16
15.0
17/02/93
14:45
7.2
148
908
40.5
1.63
0.36
124
81
20
89
15
12.4
18/02/93
14:10
7.3
148
936
40.6
1.40
0.37
130
81
19
87
14
12.7
23/02/93
10:30
7.6
154
936
40.3
1.90
0.33
114
84
19
95
16
14.1
24/02/93
15:50
7.0
140
956
42.3
1.70
0.29
127
74
17
98
16
13.6
25/02/93
10:00
7.1
148
979
43.0
2.60
0.34
129
85
19
93
15
11.7
26/02/93
11:57
7.2
144
993
66.0
3.70
0.27
142
89
20
96
14
10.5
01/03/93
14:20
7.2
135
971
47.0
3.90
0.25
141
80
18
102
15
14.3
220/28/T
44
APPENDIX B
220/28/T
FIGURES
25 -q
g; 20
I
15
10
£
-
5
30
25
“T
20
^e
15
I
10
j
«•
V -i
**
7.
«. *
5
0
29/1/93
Figure B1
220/24/T
31/1/93
2/2/93
4/2/93
Water Quality Parameters Class 1 A River
47
6/2/93
8/2/93
1Q/2/93
12/2/93
Ammonium (nig/Q
Dissolved Oiygen (mg/t}
10 -i
10
5
0
Conductivity (|iSfcm)
900
pH
700
7-
6
Temperature (C)
10 i
9 87-
6
Turbidity (FTU)
5
40
-
-j
30 -
20
10
-
-
0
16/02/93
Figure B2
220/24/T
18/02/93
20/02/93
22/02/93
Water Quality Parameters Class 3 River
48
24/02/93
26/02/93
28/02/93
02/03/93
APPENDIX C
MANUFACTURER'S SPECIFICATION
Oxygen Measurement
RANGES:
0 - 200 % sat,
0 - 20.0 mg 1
ACCURACY ±1% of FSD
Temperature Measurement
RANGE:
0 - 45.0 °C
ACCURACY ± l % o f FSD
Instrument Environment
Temperature range
Not stated
Water Resistance
Not stated
Power Supply
Internal 6 x 1.2 volts re-chargeable batteries
Nominal 20 hours between re-charges
Probe
Response Time
(90% change )
220/28/T
<35 seconds
49