1
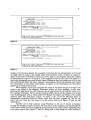
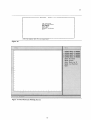
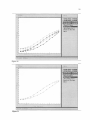
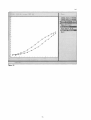
Article: Photosens: Automating Photographic Sensitometry in the Photograph
Conservation Laboratory
Author(s): Brian Lesser
Topics in Photographic Preservation, Volume 4.
Pages: 80-95
Compiler: Robin E. Siegel
© 1991, Photographic Materials Group of the American Institute for Conservation of
Historic & Artistic Works. 1156 15th St. NW, Suite 320, Washington, DC 20005. (202)
452-9545, www.aic-faic.org. Under a licensing agreement, individual authors retain
copyright to their work and extend publication rights to the American Institute for
Conservation.
Topics in Photographic Preservation is published biannually by the Photographic
Materials Group (PMG) of the American Institute for Conservation of Historic & Artistic
Works (AIC). A membership benefit of the Photographic Materials Group, Topics in
Photographic Preservation is primarily comprised of papers presented at PMG meetings
and is intended to inform and educate conservation-related disciplines.
Papers presented in Topics in Photographic Preservation, Vol. 4, have not undergone a
formal process of peer review. Responsibility for the methods and materials described
herein rests solely with the authors, whose articles should not be considered official
statements of the PMG or the AIC. The PMG is an approved division of the AIC but does
not necessarily represent the AIC policy or opinions.
1
Photosens: Automating Photographic Sensitometry in the Photograph
Conservation Laboratory
by Brian Lesser
Introduction
Photosens is a com uter program which allows a personal computer to automatically
record density data direct y from a Densitometer. The program records both density data
and other information about the photograph(s) being measured in a database and is also
capable of plotting, printing and carrying out sensitometric analysis of this data.
Photosens was developed under contract for the National Archives of Canada's
Photograph Conservation Laboratory to automate the laborious job of taking and recording
density readings manually, to speed up certain common sensitometric calculations, and to
plot test results.
P
The Need Photosens was Intended to Fill
The Archives conducts research into the stability of photographs and to evaluate
methods of photograph conservation. As part of this work the workers in the Photograph
Conservation Laboratory (and now the new Conservation Research Division) may take
several thousand density readings in a given month. Measuring the density of photographs
is one of the most important quantitative measurements of the photographs' condition and
is often done before, during, and after experiments are conducted on them. This is because
density corresponds to some de ree with the human visual perception of brightness and
gives a reasonable indication of t e amount of image-forming substance in the photograph.
The use of a small computer and a propriate software to make the density
measurement process more efficient was easi y justified sim ly by the number of hours
which could be saved by having a computer record and store t e data as the measurements
were taken. For example, it was not an unusual ractice to speed up the density reading
process by having a second person write down t e readings as they were taken. What is
more difficult to determine when planning a software project is what other features make
sense to add to the software. These "extra" features can give users of the system new
capabilities and make other jobs, such as plotting data, simpler and easier to do.
Unfortunately extra features may also actually reduce the effectiveness of a program if
they makes the program difficult to use. Thus while the need for some software may seem
obvious in some circumstances, determining exactly what that software should do and how
it should do it can make the difference between making laboratory work easier, more
efficient, and more flexible and actually making laboratory work less efficient and more
tedious. So it is worth spending a little time discussing not only how Photosens works and
what it does but also how it was designed and written in the first place.
a
f
K
K
Steps in Develo ing Software That Actually Helps Someone
In figure 1 nine typica steps in developing software of any reasonable complexity
are listed. The first step listed is a feasibility study to see whether it is worth while to even
consider using a computer and some software to solve a problem. In some cases investing in
a computer itself may not be an overly expensive proposition but when the related costs of
software development, the time needed to use the software and the time required to
maintain it are factored in, it may simply not be worth the investment. For most projects,
including Photosens, the feasibility study is usually conducted by the customer. In this case
the number of hours spent taking density readings in the Photograph Conservation
Laboratory left little doubt as to the value of computerizing the process.
P
80
2
Steps in Software Development
1) Feasibility Study
2) Problem Specification Phase/Program Specification
3 ) Program Design
4)Coding
5 ) Debugging
6 ) Testing and Verification
7) Documentation
8) Training and Ongoing Support
9) Maintenance
Figure 1
Of the remainin 8 steps on the chart the next one, program specification, is the most
important and wi 1 be explored in some depth here.
f
The Program Specification Process
Defining just what the program should do (and what it should not do) in a concise
and unambiguous wa is perhaps the most important step in software development. To do
this successfully usuaIyly means working with a customer and exploring their needs in depth.
In the case of Photosens many meetings were held with the staff of the Photograph
Conservation Laboratory and its director. Lists of desirable features for the software were
enerated and actual Archives’ work in ro ress, sam les, and reports were examined.
brom these discussions a picture emerge o the actua work practices the software was
designed to augment as well as an understanding of exactly what the software must do.
This process, which involved the continual refinement of the objectives of the
project through many meetings, resulted finally in the production of a written software
specification which was submitted to and approved by the Archives.
Figure 2 shows another reason a good software specification, designed to meet a
customer’s needs, is so important. If a specification is done badly, many changes will
inevitably be needed. Rewriting software as the production process proceeds can be a
prohibitively expensive proposition.
Without describing the entire specification, what follows is a brief description of
some of the design criteria for the software. Hopefully, this will illustrate how Photosens
was designed to meet the particular needs of a photograph conservation laboratory.
One of the first considerations that went into the specification was the need to deal
with the wide variety of work conducted at the Archives. The software had to be able to
acquire data from a wide variety of different types of photographs or experimental samples
being used in different projects. For example one research project might be under way
BB
81
P
3
Relative Cost to Make a Change
1000
--
~
---1
100
Relative
cost
to Make
a Change
/
-
Program
Specification
Program
Design
Coding
Figure 2: Relative Cost to Make a Change
-
Debugging
Testing and
Verification
Use
Adapted from Fairley, R., Software Engineering
Concepts. New York: McGraw-Hill, 1985.
which was measuring the effect of fingerprints on a wide variety of photographic materials,
another might be a project designed to check what marking materials could be safely used
on photographs and another might be the ongoing checking of the densities of old
photographs over time. Photosens had to be able to keep track of all the data for each
project in a way that did not restrict it from searching for information from any project.
Some of how this was done will be shown later. Just what critical information had to be
stored by Photosens for each project was discussed as well as the pros and cons of including
other information. One feature of these discussions was wei hing the time required to enter
and update information about a project versus the utility o having it in the database. The
cost of handling this data in the program - increased software complexity - and its
implications for the cost of the software and time of completion were all considered.
A table was prepared showing, for example, the various categories (fields) of
information for each project or experiment which it was felt had to be stored in the
database. Each column represented one type of information to be stored. The fields
included the experiment name where the name of each experiment or project would be
entered and the name of the operator who set up the experiment. In figure 3, data for some
fictitious ex eriments has been entered for each field except the comment field. Comments
are omitteg in this figure because of their length but they are intended as a way
B
82
4
6
B.
Thurgood
Collection Density
Tracking
No
4 1 1/91
Figure 3: Experiment table.
of describing the project or experiment at length. One field is particularly worthy of note
because its meaning may not be obvious. This is the archived field. Since the database could
grow to a very large size quickly as more and more data was read into it, a means was
needed to move whole projects (especially older ones) temporarily out of the database (off
the hard disk) to secondary storage. The archived field allows Photosens to remember what
experiments have been "archived" so they may be returned to the database if needed. In the
figure the word "yes" would indicate that a project has been removed from the database
and "no" that its data is immediately available.
Another requirement was that each photograph or experimental sample must belong
to a roject or experiment so that only the photographs that are part of a single project
coul be found in the database at one time if necessary. It was also desired to be able to
search for information on photographs or samples across many different experiments. How
this was done will be described later.
Another example of the needs of the Archives which was put into the specification
was the recognition that two different types of density readings are often taken and must be
treated differently. A sample photograph may have step wedges imaged on it. The densities
of each step are usually read to generate a characteristic curve for that photographic
material. Alternately an experimental sample without a step wedge or a photo raph might
only need density readings taken of certain locations on it with no intention o attempting
to generate a characteristic curve. These areas were referred to as patches. Figure 4 shows
two tables, one for step wedge information, and one for patches. The fields of these tables
show the information it was decided that Photosens had to store for each step wedge or
patch on any photograph or experimental sample. This is not the only data the program
actually stores for each step wedge or patch and says nothing about how the program works
internally. It only shows what information the program was expected to store. By specifying
these two types of density information, virtually any type of density reading may be taken
of almost any type of photograph.
cf
B
83
5
Step Wedge Table
Name
Filter
Dens@
Density Density
#,
#2
#3
Denslty
#4, #5,
m,...
Densrty
#20
#21
Patch Table
Name
X
Location
Y
status
Red
Location
Fitters
Density
Green
Density
Blue
Density
Visual
Density
Figure 4: The Step Wedge and Patch Tables.
r
Final1 , the last requirements for Photosens to be discussed here were that the
software be lexible and easy to use. By flexible it was meant that the software would be
adaptable to new situations as it was used in the future. An example of this is that if a new
photographic material becomes available sometime in the future it could simply be added
to the Photosens database without any need to modify the rogram. Saying that software is
easy to use or is "user friendly" is of course an ovenvorke theme but it was nonetheless a
requirement as Photosens was designed to be used by a variety of people including
conservators, summer students, and photograph conservation researchers.
The specification process spelled out all these and other requirements in detail in a
software specification document which was read and approved by the staff and director of
the Photograph Conservation Laboratory. Without this document there would have been
no common agreed on way to evaluate the success of the later stages of production of the
software.
After a software specification (figure 1) was agreed on the steps of program design,
coding, and debugging used to be done entirely away from the customer. A software
company or programmer would literally take away the software specification for some time
(months or even years) and return with the finished product. The customer would then test
and verify that the program worked as advertised. More recently there has been a trend in
software development to include the customer in discussions as the project proceeds. In this
case working parts of the program were shown to Brian Thurgood, Joe Iraci, and Rudi
Krall at the Archives as the project proceeded. This helped both to uncover some
programming errors early and more importantly made it possible to make some minor
design changes as work progressed to improve Photosens.
B
84
6
An Introduction to How Photosens Works and What it Does
Some of what Photosens was designed to do has been discussed including what type
of information it must store in terms of tables, but not how it does it. Without getting into
too much detail figure 5 shows how Photosens deals with the requirement to be able to
recall data for photographs for just one experiment or for many. Photosens uses a database
manager that permits organizing data into tables. It also allows certain fields or columns of
data to be indexed and searched efficiently, Indexed columns are often referred to as keys
and two types of keys are used in the Photosens database: foreign and primary keys. All this
means is that certain fields such as the experiment number may be used as a key for
searching through the data in that table. Photosens might ask the database manager to find
experiment number one and the database mana er will return that experiment to the
program. A primary key is a field which uniquely i entifies each row in the table. Or in this
example each experiment would have a unique number. A foreign key is a key which refers
to a primary key in another table. In this case the experiment number key in the sample
table refers to the experiment each sample or photograph belongs to. In this way it is
possible to keep track of what experiment (or project) a photo belongs to while at the same
time organizing data logically into tables: a separate table for experiments and a separate
table for photographic samples.
a
Experiment Table
Experiment Number
Experiment Name
1
Fingerprint Tests
2
Fading Data
3
Bleaching Tests
t
Other Fields...
Primary Key
Sample Table
Foreign Key
Sample Number
Sample Name
Experiment Number
4125
Albumen Control #1
1
4126
Albumen Control #2
1
4127
Aq # 5674
2
Other Fields...
Figure 5
By using this technique Photosens can search through only the samples belonging to
one experiment or project if desired. For example someone might want to know the
condition of all the albumen prints in one test which had been displayed for a certain
amount of time. Alternately, data from many or all the projects may be searched through at
once. It is easy to search through the sample table, for example looking only for one type of
photographic material, by looking in the Material field. The entire database structure of
85
7
Photosens contains ten tables including tables for storing the different types of
photogra hic materials being used and the types of experimental treatments they are
subjectec fto.
The User Interface
Until now the discussion has been focused on tables of information without
discussing how information gets into these database tables or on how data is retrieved from
them. Photosens uses forms on the computer screen to make entering data into these tables
simple. Figure 6 shows the form used to enter the experiment name and other information
for a new project or experiment. To move between fields of the form the operator just uses
the cursor keys and types information in the fields as need be. Figure 7 shows a completed
form. Figure 8 shows the new sample entry form. This is where data for a particular
photograph or sample is entered into the database. Figure 9 shows some fictitious data
entered into the form. Once a sample is entered the database knows about it forever, and
this data will not have to be entered again. For example if you want to record the densities
of a sample every month for a year you would only enter this information once. After that
all you have to do is enter the name of the sample, how long since the last reading (or what
has happened to it since the last reading) and then read in the densities from the
densitometer.
Neu Experiment Data Entry
-
Experiment Started: P e b . 14 1991
Experiment Name:
Comment :
Operator: Lesser
Instructions
er to accept each field when done.
Figure 6
New Experiment Data Entry
-
Experiment Started: Fib. 14 1991
Experiment Name: SPECIAL pp(xTm2T
Comment: This Drolect w a s crsated for dewnetration u
Operator: Lesser
Figure 7
86
es
.
_c__
8
P
New Sample Data Entry
Sample Name:
Sample Uaterial:
Exposure Intensity: 0.00
Exposure Time: 0.00
Neutral Density: o
.
0
0
Exposure Filtration:
Comment :
Wedge or Uodulator or None (W, U or N):
Uodulator or Sample Name:
-
G
-
Processing Technique (Treatment):
Number of duplicates to be averaged:
Number of averages per patch:
1
1
Instructions
er to accept each field when done.
Figure 8
=
r-
New Sample Data Entry
2-
,
Exposure Intensity:
EYDOsUre Time: :
I
Comment :
Wedge or Modulator or None (W, U or N):
Wodulator or sample Name: a101
Processing Technique (Treatment) :
I
I
I
Number of duplicates to be averaged:
Number of averages per patch:
1
1
Instruct1
er to acce
Figure 9
The part of Photosens that does the reading of the densities from the densitometer
was designed with two purposes in mind. The first was to make the reading process as quick
and simple as possible and the second was to make it as accurate as possible. When
densities are read on the densitometer they go directly to the computer via the serial port.
When the computer receives a density value it beeps so that the operator does not have to
look at the screen to know the reading has been received. The density values are also
displayed on the screen along with the densitorneter filter that was used. This allows the
operator to go back and check the values if need be.
Photosens also checks that the readings are consistent. For example if blue and
visual densities are taken of a step wedge image, Photosens will check that both the blue
filter and visual density filter readings have the same number of steps. If, for example, one
step was missed the program will give out a warning beep and display an error message on
the screen.
Readings can always be checked and retaken if necessary at any time during the
density reading process.
Retrieving Data
Getting data out of the tables illustrated earlier is as straightforward as getting the
information into them. Search forms like the one in figure 10 are used to search through the
data in the database for whatever information may be needed. In this case the sample
search form allows the operator to specify as much or as little information about the
87
9
- - - \
1
Sample Search Form
Sample Name:
Sample uterial:
Exposure Intensity:
Exposure Time:
Neutral Density:
Exposure Filtration:
I
--
Wedge or Nodulator or None (W, I4 or N):
Nodulator or sample Name:
nasJcName :
-
Processing Technique (Treatment):
Figure 10
Sample Search Form
Exposure Intensity:
Exposure Time:
Neutral Density:
Exposure Filtration:
Wedge or Nodulator or None (W, I4 or N):
Nodulator or Sample Name:
NaskName :
-
Processing Technique (Treatment):
Figure 11
samples to be found as desired. For example, if only data for one photograph is to be found
we might enter its name in the sample name field and press "enter", as shown in figure 11.
Many of the fields in Photosens' forms are active. That is, the program checks the validity
of information as soon as it is typed in. In this example as soon as you type in the name of a
particular photograph you want to know about, Photosens does not reqmre you to fill in any
other information about the photo. Instead it immediately checks the database and returns
the information on the photo immediately. In figure 12 the information for that photo
appears as it would on the screen.
What happens if you can't remember the name of the photo and get it wrong? If the
name is not found in the database Photosens returns an error message. At any time,
pressing the "page down" key will bring up a list of legal entries for the field the cursor is in.
For example (see figure 13) if a search is desired which returns all the samples of a certain
type of hotograph, such as those made from Kodak Azo paper, just filling in the sample
materia field will find them. Fi ure 14 shows a list of all the different types of
photographic materials Photosens & n o w about that has been "popped up" and we can
select any one from the list, insert it in the active field as in figure 15 and get the
information.
Another aid to help someone using Photosens is the use of menus to navigate
through the program. Figure 16 shows the main menu of the program. Cursing through the
menu causes a help line to be displayed at the bottom of the screen further ex laining what
each menu option does (figure 17 and 18). Being able to look things up whilpe working in
P
88
10
forms and getting descriptive and helpful error messages when data is entered incorrectly
are part of what makes the Photosens program easy to use.
P
_D
-
Sample search Form
P
~
Sample Name: SPWl
Sample Material: SPP-rul
Exposure Intensity: 10.00
Exposure Time: 9-00
Neutral Density: 0.00
Exposure Filtration:
Wedqe or Modulator or None ( W , M or N):
Uodulator or sample Name: ?tow1
MaskName :
Processing Technique (Treatment): NACL-F
Figure 12
Sample Name:
Sample Material: 7
I
Exposure Intensity:
ime:
--
Wedge or Modulator or None ( W ,
Modulator or Sample Name:
UaskName :
U or N):
-
Processing Technique (Treatment):
Instructions
er to accept each field when done.
Figure 13
Sample Search Form
-
~~
Sample Name:
Sample Material:
Exposure Intensity:
Exposure Time:
Neutral Density:
Exposure Filtration:
Uaterials
U]
ImI
2
PRO0
s
b
Processing Technique (Treatment):
Instructions
Type or edit fields. Press enter to accept each field when done.
Press Esc t o abort data entry.
Figure 14
89
~
11
Sample Search Form
sample Name:
Sample material:
A20 ~2
Exposure Intensity:
Exposure Time:
Neutral Density:
Exposure Filtration:
Wedqe or Modulator or None (W, M or N):
Modulator or Sample Name:
MaskNarne :
-
Processing Technique (Treatment):
Instructions
Type or edit fields. Pless enter to accept each field when done.
Press ESC to abort data entry.
Figure 15
Finally, what do you do with the information once you have it back from the
database? Essentially, there are three possibilities. One is to examine it on screen, the
second is to print it out and the third is to plot the data. For reasons of time, only plotting
data will be discussed.
Data which has been found in the database may be loaded into the program for
printing or plotting so that the results of several different searches may be compared at
once. In figure 19, the plotting screen of Photosens is shown. In the menu at the top right of
the screen the names of the search results which have been loaded into the program appear.
By using the "up" and "down" cursor keys any of these search results may be selected so that
they plot on the screen. Figure 20 shows one of the samples retrieved earlier selected and
its data is now visible in the plotting window. The blue data points shown here in light gray
indicate blue filter density and the black points show visual densities. By selecting another
sample (figure 21) its data may also be plotted simultaneously. If we like, we can select
plotting with lines (figure 22) as shown. Another option is to show only the color densities
we wish to see. So for exam le we may select only blue densities for plotting as in figure 23.
Or we may decide to only ook at the visual densities (figure 24). Once the plot looks the
way we want it to we can give it a title which appears in the top window and a footer if we
like in the bottom window before sending the information off to a plotter.
So by using menus, helpful messages, and giving as much information back to the
user wherever possible Photosens makes entering, retrieving, printing and plotting data a
more efficient process.
f
After Installation What?
Nine steps in software development were listed (see figure 1). After the software is
tested and it is verified that it works come the stages of documentation, training, and
ongoing support. These steps are often the most overlooked and underestimated steps in
the software development cycle. In this case a manual describing both the internal workings
of Photosens and a complete user manual were provided. As well, on-site training was
provided along with continuing telephone support. Getting true value from any software
requires significant learning despite the claims of manufacturers that their software is user
friendly. Without training users often spend hours learning the software on their own. In the
case of Photosens as with other software, usin it to its full potential is furthered by training
sessions rather than learning it entirely by tria and error.
In the list of steps in software development (figure 1) is the final step which for lack
of a better term is called maintenance. Photosens was not designed to do ever thing a
conservator or curator might like it to do. This was because of both time and inancial
constraints. Rather than make a program which would have taken over a year to write, with
k
r
90
12
almost every desirable feature, Photosens was designed to meet the most immediate needs
of the Archives and provide a basis for future enhancements. In particular, great emphasis
was put on the data entry and database functions of the program as a basis for later
enhancements. On the other hand Photosens will not generate time versus density plots,
tone reproduction diagrams or Arrhenius plots. These features may be added later as need
be.
Finally, I would like to thank Dr. Klaus Hendriks, who not only saw the need for
Photosens but was able to find the funds to have it produced, and the staff of the
Photograph Conservation Laboratory and the Conservation Research Division of the
National Archives of Canada for all their help.
Photosens
-
Version 1-00
Add Experiant
Search Experiments
New Samples
Print Data
Plot Data
naintain Databases
Quit
Set up experiment before adding sample data.
Figure 16: The main menu of the program. The selected item has been underlined in this illustration.
Photosens
-
Version 1-00
Add Experiment
Search ExDariments
New Samples
Print Data
Plot Data
Maintain Databases
Quit
1
Search through experiment database/load results.
Figure 17
91
13
I
- Version 1.00
Photosens
Add Experiment
Search Experiments
new Samples
Print Data
Plot Data
Maintain Databases
Quit
Enter n e w sample data for any experiment.
Figure 18
Figure 19: The Photosens Plotting Screen.
92
€6
16
Figurc 24
95