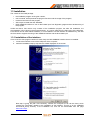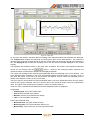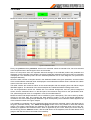
1
User’s Manual
User’s Manual
2009 August 31
HNS SPCea
Statistical process and quality control
Without the prior written permission of HNS Ltd., no part of this documentation may be reproduced, or transmitted, in any form or by any
means, unless this activity is in connection with the legal use of HNS SPCea software.
The Author made the documentation with the greatest care. The Author assumes no responsibility and makes no warranty with respect
to content and completeness of the documentation. The Author assumes no liability for damages resulting from the use of this
documentation.
HNS word and coloured emblem are HNS Technical Development Ltd.’s registered trademarks.
Copyright © 2009
HNS Technical Development Co. Ltd.
H-9027 Győr, Gesztenyefa u. 4., Hungary
Phone: +36 96 506-930
Fax: +36 96 506-931
E-mail: [email protected]
Software licence agreement
This agreement is a contract concluded between you and HNS
Technical Development Co. Ltd. Pursuant to the agreement, you
agree with the installation and the utilisation of the programme in
any other way. The limitations and conditions relating to the
utilisation included in this agreement shall be undertaken by you
in a binding way and you acknowledge that you did not purchase
the software or materials with this licence but you purchased the
right of usage under the following conditions. Should you not
accept the conditions of this agreement as binding to yourself,
then you shall not be entitled to install or use the software.
The provisions of the licence agreement shall be applicable to the
HNS SPC ea program and all the related documents (Software).
The User has acquired the user’s right by possessing the
Software and upon the existing and valid title as stipulated in the
licence agreement. You shall be entitled to install, use and
download the new versions from the Internet in compliance with
the provisions of the licence agreement.
1. PROTECTION OF INTELLECTUAL RIGHTS
All the rights of the Software shall be due to HNS Technical
Development Co. Ltd. that regulates the utilisation of the Software
in a licence agreement. The licence agreement shall qualify as a
legal convention between you and HNS Technical Development
Co. Ltd., as the author of the Software.
2. PARTIES CONCLUDING THE AGREEMENT
This document shall be qualified as a legal agreement between
you, as the User of the Software (the User) and HNS Technical
Development Co. Ltd., as the author of the Software (the Author).
8. COMPLIANCE WITH STANDARDS AND LAWS
The SPC Software fulfils the specifications of the relevant parts of
documents Ford EU 880B, Ford EU 883A (Test Examples for
Verification of SPC Software) and QS9000 SPC Manual in its
mathematical statistics and SPC theoretical aspects.
The Software documentation fulfils the requirements of standard
MSZ ISO 9127.
9. THE LEGAL LIABILITY OF THE AUTHOR
9.1. GUARANTY
The Author of the software does not warrant that the Software is
free from errors or viruses. The Author accepts the
announcement of the User on the errors found in the Software
and that can be reproduced in a documented way and it is
guaranteed that the Author shall correct the errors announced
within 4 months from the date of the agreement. The Author
publishes the correction in the next version of the Software.
The Author only insures the guaranty pursuant to the conditions
defined in the licence agreement. The Author hereby declines all
other expressed or reputed guaranties to the extent maximally
allowed by valid legal statutes including but not limited to the
guaranties on distribution, suitability to a defined purpose,
similarity to the description, on the title of third parties’ rights and
on the restraint from breaching of third parties’ rights.
The User may copy the Software on CD (or other media) with the
aim of storing but the copied software may not be transferred to
any third party except for the User.
9.2. GUARANTY and WARRANTY
The Author declines all kinds of liabilities to the maximal extent
allowed by laws for any indirect, accidental, consequential,
special or basic errors or for lost profit (including but not excluding
others, the damages arising from the loss of profit, the interruption
of business activities, the loss of business information or the
damages arising from other financial losses), which may emerge
from the usage or useless character of the product even if the
Author was informed about the opportunity that such damages
might emerge. The Author’s multiple and complete liability relating
to the user or other partner in the case of losses or damages
arising from any claims, demands or litigations or which may arise
from this agreement or which may be connected to this
agreement shall not be higher than the purchase price of the
licence.
Should you have any technical or legal remedy questions
regarding the Software, please, contact the Author at the Author’s
Product Support telephone number, fax number or via its Internet
address.
10. UPDATING VIA THE INTERNET
The Author made access to the Software on the Internet
exclusively to the usage by the Users pursuant to the conditions
of the Licence agreement.
4. NUMBER and TYPE OF YOUR LICENCE
According to the Software licence agreement in your program
package.
It is the User’s liability to manage the information providing access
(log-in name, password) in a secure way that cannot be accessed
by unauthorised persons. It is forbidden to transfer such
information to third parties. The User shall inform the Author on
the withdrawal from the usage of the update via the Internet and
the User shall destroy documents that include the unused access
information.
3. THE USER’S RIGHTS
Within the framework of the agreement, the user acquires a nonexclusive right to install, use, access, display and operate the
Software.
The User may install the Software in the quantity licensed by the
Author and use it on his / her computers.
This agreement will immediately and automatically be terminated
without prior notice if you breach the contractual conditions and
terms. As soon as you acknowledge the breach of law you shall
immediately contact the Author in order to settle the legal situation
of the usage right.
5. SALE TO THIRD PARTIES
The User shall not sell or transfer his / her rights that were
generated based on this agreement in any way that is to say the
User may not borrow or let, or lease or take by lease the
Software.
6. DECRYPTION FORBIDDEN
The User shall not reverse, decrypt, and shall not alter the
Software except where the applicable legal statutes expressly
allow that on the contrary of this limitation. The Author reserves all
of its rights that are not expressly conveyed here.
7. PRODUCT SUPPORT
The Author shall insure all kinds of product supports relating to
the Software. Should the User not purchase the Software directly
from the Author, the Author shall provide support pursuant to this
licence agreement.
User’s Manual
It is a condition of the usage of the Internet updating that you shall
not use the Author’s Internet platform for any illegal purposes or
for purposes that are forbidden by these conditions and the
warnings. The User shall not use the Internet platform in any way
which might cause defects, faulty operation, overload or damages
in the Author’s server, the connected networks or which would
hinder any third parties in using the updating via the Internet. The
User shall not attempt to illegally access the updating via the
Internet either by deciphering, or by password mining or by any
other methods. It is forbidden to acquire (or to attempt to acquire)
all kinds of data or information, which the Author made accessible
accidentally within the framework of the updating via the Internet.
The Author, in connection with its Internet platform, declares not
to:
- Upload or make other software programmes or any kinds of
other files accessible, which are protected by laws protecting the
intellectual property, for example the laws on copyright or
trademark protection (or which are connected to data protection
1
and publicity) except where it has the relative rights or possesses
them or if the Author has acquired all the necessary approvals for
the implementation of the above.
- Upload viruses, Trojan horses, time bombs, cancel bots,
damaged files and any files or programmes similar to them, which
may cause damages in the operation of its computer or the
property of other parties.
- Fake and delete the copyright data, legal or other information,
marks or labels relating to the origin of the software and other
works contained in the uploaded files.
- Limit or hinder other users in the usage of the Internet platform.
- Breach any relative laws or legal statutes.
11. MISCELLANEOUS PROVISIONS
The Author may review and modify the Software from time to
time.
If the content of the licence agreement cannot be defined
unambiguously then the interpretation that is more favourable to
the Author shall be accepted.
User’s Manual
If any of the points or conditions above were pronounced by any
competent authorities to be invalid or unenforceable, the validity
of the remaining points shall not change.
Product Support
HNS Technical Development Co. Ltd.
H-9027 Győr, Gesztenyefa 4.
phone: +36 96 506-930
fax: +36 96 506-931
e-mail: [email protected]
web: www.hns.eu
e-mail: [email protected]
ftp: ftp.hns.eu/spc
http: www.hns.eu/spc
2
Contents
1 Program installation......................................................................................................................................4
1.1 Program versions .................................................................................................................................................... 4
1.2 Hardware and software requirements.................................................................................................................... 4
1.3 Installation................................................................................................................................................................ 5
1.3.1 Installation of the interface..................................................................................................................................5
1.3.2 Installation of the HNS SPCea program .............................................................................................................7
1.3.3 Installation of the HNS SPCea program’s SQL databases ...............................................................................10
2 Program overview .......................................................................................................................................12
2.1 Access levels ......................................................................................................................................................... 12
2.2 Starting the program ............................................................................................................................................. 13
2.3 Languages.............................................................................................................................................................. 15
2.4 Help......................................................................................................................................................................... 15
2.5 User interface......................................................................................................................................................... 16
2.6 Functions ............................................................................................................................................................... 17
2.7 User’s rights........................................................................................................................................................... 18
3 Functions of the program ...........................................................................................................................19
3.1 Measuring............................................................................................................................................................... 19
3.1.1 Select the product.............................................................................................................................................19
3.1.2 Select the parameter ........................................................................................................................................20
3.1.3 Enter sample data.............................................................................................................................................20
3.1.4 Measure pieces of the sample..........................................................................................................................21
3.1.5 Check the control chart.....................................................................................................................................22
3.1.6 Close measuring...............................................................................................................................................25
3.2 Analysis.................................................................................................................................................................. 27
3.2.1 Select data........................................................................................................................................................27
3.2.2 Value chart .......................................................................................................................................................28
3.2.3 Histogram .........................................................................................................................................................30
3.2.4 Control chart .....................................................................................................................................................31
3.2.5 Export ...............................................................................................................................................................34
3.3 Overview................................................................................................................................................................. 35
3.3.1 Process states ..................................................................................................................................................35
3.3.2 Product pareto ..................................................................................................................................................37
3.4 Database................................................................................................................................................................. 39
3.4.1 Products ...........................................................................................................................................................39
3.4.2 Parameters .......................................................................................................................................................40
3.4.3 Data ..................................................................................................................................................................42
3.4.4 Import ...............................................................................................................................................................43
3.4.5 Machines ..........................................................................................................................................................44
3.5 Users....................................................................................................................................................................... 45
3.6 Settings .................................................................................................................................................................. 47
3.6.1 Database ..........................................................................................................................................................47
3.6.2 Shifts.................................................................................................................................................................48
User’s Manual
2
Figures
Figure 1. Installation of the HNS USBMUX ............................................................................................................................................................................. 6
Figure 2. Checking the installation of the HNS USBMUX ........................................................................................................................................................ 7
Figure 3. Installation of the HNS SPCea program ..................................................................................................................................................................10
Figure 4. Waring message in case of multiple instances ........................................................................................................................................................13
Figure 5. Database settings ...................................................................................................................................................................................................13
Figure 6. Checking of the hardware key .................................................................................................................................................................................14
Figure 7. Hardware key not found ..........................................................................................................................................................................................14
Figure 8. The login area of the program before and after logging in .......................................................................................................................................15
Figure 9. Changing the program language .............................................................................................................................................................................15
Figure 10. User interface of the program................................................................................................................................................................................16
Figure 11. The main window of the program on engineer access level ..................................................................................................................................17
Figure 12. Data input..............................................................................................................................................................................................................19
Figure 13. Selecting the product to be measured ...................................................................................................................................................................19
Figure 14. Selecting the parameter to be measured...............................................................................................................................................................20
Figure 15. Enter the sample data ...........................................................................................................................................................................................21
Figure 16. Measure pieces of the sample...............................................................................................................................................................................22
Figure 17. Displaying the control chart ...................................................................................................................................................................................23
Figure 18. Details of the appointed sample ............................................................................................................................................................................25
Figure 19. Closing the data input............................................................................................................................................................................................26
Figure 20. Analysis.................................................................................................................................................................................................................27
Figure 21. Selecting the data to be analysed..........................................................................................................................................................................28
Figure 22. Value chart ............................................................................................................................................................................................................29
Figure 23. Histogram..............................................................................................................................................................................................................31
Figure 24. Control chart..........................................................................................................................................................................................................32
Figure 25. Details of the appointed sample ............................................................................................................................................................................34
Figure 26. Data export............................................................................................................................................................................................................34
Figure 27. Overview ...............................................................................................................................................................................................................35
Figure 28. Process states.......................................................................................................................................................................................................36
Figure 29. Product pareto analysis.........................................................................................................................................................................................38
Figure 30. Database...............................................................................................................................................................................................................39
Figure 31. Products................................................................................................................................................................................................................39
Figure 32. Parameters............................................................................................................................................................................................................40
Figure 33. Measured values...................................................................................................................................................................................................42
Figure 34. Data import............................................................................................................................................................................................................43
Figure 35. Machines...............................................................................................................................................................................................................44
Figure 36. Users.....................................................................................................................................................................................................................45
Figure 37. User registration....................................................................................................................................................................................................45
Figure 38. Settings .................................................................................................................................................................................................................47
Figure 39. Database settings..................................................................................................................................................................................................47
Figure 40. Shift settings..........................................................................................................................................................................................................48
User’s Manual
3
1 Program installation
1.1 Program versions
Program has more versions, listed in the following table, which are different in technical characteristics.
HNS SPCea
Free version
Single user
version
9
9
Gauge support
Quantity of the data is not limited
SQL version
1
9
1
9
9
9
9
9
9
9
9
9
9
More users can use the database together
In-built on-line upgrade
Standard
version
9
User support
Using of SQL database is supported
1
9
1
: program package contains one piece of HNS USBMUX interface, which serves as the hardware key of the program besides
connecting of the Digimatic gauges.
To use the free version does not require any interface, but also the free version supports the using of
interfaces (to use the non-free versions, it is required at least one interface).
The free version contains the following limitations relative to the quantity of the data:
1. it can be used only with Microsoft Jet (Access) database, which does not require any database
server, and
2. maximum 4 products,
3. maximum 8 parameters and
4. maximum 10.000 measured values can be stored in the database.
The database, which has been created and used with the free version of the program, is usable with the nonfree program version without limitation, too, so the free version can be changed for one of the non-free
versions at any time.
1.2 Hardware and software requirements
Following hardware and software tools are required to use the program:
•
P4 processor, 1 GB RAM (depending on the operating system),
•
SVGA monitor (minimum resolution: 1024x768),
•
Windows operating system (Windows 2000, XP, Vista or Windows7),
•
file server, in case of network operation,
•
database server: Oracle, Microsoft SQL Server or MySQL, in case of SQL version.*
*: you do not need any database server, if you do not use the SQL version.
Further tools are required in case of direct data input from gauge:
•
Mitutoyo Digimatic gauge or gauges,
•
connecting cable - its type depends on the connected gauge or gauges,
•
HNS SMUX / USBMUX interface (it is possible to connect more interfaces together),
•
COM / USB port on the computer, whereon the program is running - depending on the type of the
interface.
Attention!
To use the non-free versions, it is required at least one HNS USBMUX-4 interface (which is the part of the
program package), because the interface also serves as the hardware key of the program.
User’s Manual
4
1.3 Installation
The content of the install package:
• the installation program of the given version,
• user’s manual, which presents the program functions and the usage of the program,
• tutorial to learn and use the program,
• SQL scripts to install the SQL database,
• HNS USBMUX interface to use for direct data input from Digimatic gauges and as hardware key of
the program.
Unlike the above, free version only consists of the installation program, but after the installation, the
documentation can be found in the program directory, or it can be reached in the Start menu of the Windows.
Free version can be used without hindrance, it is not needed to use the interface as hardware key, but also
the free version supports the using of the USBMUX interface and the direct data input.
1.3.1 Installation of the interface
If one of the non-free program versions is used, firstly the HNS USBMUX interface has to be installed:
1. connect the interface to one of the USB ports of the computer,
2. make the installation step by step after the wizard displayed on the screen.
Next step is giving the path of the directory, wherein the ’mchpcdc.inf’ file can be found, which
contains the information needed to the installation of the interface. This file is in the ’USBMUX
Driver/win2k_winxp’ directory of the installation CD, and can be downloaded from the page
www.hns.eu/spc.
User’s Manual
5
The installation of the driver program is started after pressing the ‘Next’ button. To continue the
installation, the ‘Continue Anyway’ button has to be pressed in the ‘Hardware Installation’ window.
At the end of the successful installation, following window will be displayed.
Figure 1. Installation of the HNS USBMUX
After the installation, a new communication port will be displayed among the ports of the computer
(Ports.(COM.&.LPT)). The number of this port (Com1..Com20) has to be used in the HNS SPCea program,
at the selecting of the interface wanted to use - see the ‘Database’ - ‘Parameters’ menu item. Availability and
operability of the interface can be checked in the Device Manager of the Windows, after the installation.
User’s Manual
6
Tools of the computer, if the interface
has not been installed yet, or it is not
connected.
Tools of the computer, if the interface
has been already installed, and it is
connected.
Figure 2. Checking the installation of the HNS USBMUX
The checking can be made as follows: If the interface’s connector is taken out of the computer, the
interface’s port will be removed from the list of ports. If interface is connected again, the interface’s port will
be displayed in the list.
1.3.2 Installation of the HNS SPCea program
The program is installed by the following files - after the HNS SPCea program version:
Version
Free version
Single user version
Standard version
SQL version
Installation file
Hungarian
installation program
English
installation program
SPCeaSetupFreeHU.exe
SPCeaSetupSUHU.exe
SPCeaSetupHU.exe
SPCeaSetupSQLHU.exe
SPCeaSetupFreeEN.exe
SPCeaSetupSUEN.exe
SPCeaSetupEN.exe
SPCeaSetupSQLEN.exe
The installation file of the free version can be downloaded from the page www.hns.eu/spc, but the installation
file of the other version can be found in the Install directory of the HNS SPCea CD.
After starting the installation program, only the steps of the install wizard should be followed.
User’s Manual
7
1.
Welcome screen of the install
wizard
2.
Information about the
program depending on the
version
3.
Licence agreement
The installation can be
continued after accepting all
the items of the licence
agreement!
User’s Manual
8
4.
Choosing the destination
directory of the program
(creating the directory in case
of choosing a new directory)
5.
Confirmation of the
installation
5.
Installation…
User’s Manual
9
5.
Finishing of the installation
Figure 3. Installation of the HNS SPCea program
If the steps of the installation are made, program will be ready to use. After the installation, program will
operate with the default settings, and it will conect to the empty database (Microsoft Jet - Access SPCea.mdb file) in the Database sub-directory of the installation directory automatically.
1.3.3 Installation of the HNS SPCea program’s SQL databases
HNS SPCea program can be used with different databases depending on its versions.
The databases supported by the several versions are the following:
Version
Free version
Single user version
Standard version
Database
Supported database
Microsoft Jet (Access)
SPCea.mdb fájl
Microsoft Jet (Access)
*.mdb fájl
Microsoft Jet (Access)
*.mdb fájl
Microsoft Jet (Access)
*.mdb fájl
SQL version
SQL Server
Oracle
MySQL
Is database server
required?
No
(only the SPCea.mdb
file can be used)
No
Considerations
Database server (software, hardware) is
not required.
Database (mdb file) is portable optionally
and easily.
same
+
It is not recommended to use the Microsoft
Jet database for store large quantity of
important data.
No
same
No
same
Yes
It is recommended to use SQL database
(server) for store large quantity of critical
data!
In case of using the Microsoft Jet (Access) database, it is required no installation and configuration activity.
After the installation, program will connect to the SPCea.mdb database installed in the ‘Database’ subdirectory of the program installation directory automatically and it is ready to use.
Only the SPCea.mdb database made during the installation automatically can be used with the free version.
In case of using one of the non-free versions, optional database file can be selected, so more database files,
which are in different directories or are in one directory but with different names can be used. New empty
database can be created by copying the SPCea.mdb file from the Database directory of the installation CD
into the wanted directory and by renaming it if necessary.
Note
After copying the database file from the CD, the file’s read-only property should be checked and switched off
if needed.
User’s Manual
10
It is required a database server in case of using SQL database. Program supports using of database
servers, which are listed above, different type of database servers cannot be used.
Database of the HNS SPCea program has to be created on the database server. The tools are required to it
can be found in the SQL directory of the installation CD. To create the HNS SPCea database on the server,
ask for the help of the local database administrator or the local system administrator.
Following files can be found in the SQL directory of the CD, which are necessary to create the SQL database
of the HNS SPCea:
Database
Database installation files
File name
Oracle
SQL\Oracle\User.sql
SQL\Oracle\SPCea.sql
Microsoft SQL
MSSQL\DbCreate.sql
MySQL
MySQL\DbCreate.sql
Comment
Attention!
It is recommended to create the database by the six steps
written under the table.
The script has to be run by administrator right.
The script has to be run by local login and administrator right.
To reach the database, also the ODBC driver of the MySQL
database has to be installed.
HNS SPCea database scheme can be created in Oracle database by using SQLplus with the following
steps:
1. starting the SQL plus and login as administrator (according the default system/manager user),
2. running of the USER.sql script,
The script will request the name of the user to be created, it is recommended to enter the SPCeaUser, which is
the default user name of the HNS SPCea. This user will be the owner of the database afterwards.
3. log out
4. log in to the database server with the name (SPCeaUser) and password (spcea) of the user was
created newly,
5. running of the SPCea.sql script,
6. log out (exit).
In case of the two other SQL servers, simply run the script of the given database. These scripts always
create the user (login) with the name SPCeaUser and the database (catalogue) with the name SPCea.
The password of the new database, which has been created by the above steps, is spcea.
Note
If it is wanted to create a database or a user with a name different from the default, or more users, or another
password, etc. is required, this can be made by modifying the above database scripts or by using of other
external tools.
Attention!
Selecting of the created database and the required data see in the chapter ‘Starting the program’ and in the
description about the ‘Settings’ - ‘Database’ menu item.
User’s Manual
11
2 Program overview
2.1 Access levels
HNS SPCea program has its own access protection, which is ensured by a built-in user registration.
The access levels of the program are the following:
Operator
This access level allows of using the following functions.
•
Data input
Data input onto the parameters in the database, and than checking the last control chart of the given
parameter. Data input is made after the conditions (gauge, sample size, specification limits, etc.)
prescribed in the database.
•
Measuring
Displaying the value chart, the histogram or the control chart of any parameter in the database, for
an optional time range. Exporting into text file the measured values recorded during the selected
time range onto the given parameter.
•
Changing of the own password
Engineer
This access level allows of using all functions of the program, excepting several important safety functions.
This access level includes the following functions above the operator’s functions.
•
Database maintenance
Creating, modifying or deleting products and parameters. Listing, modifying or deleting of the
measured values stored in the database. Importing of measured values recorded in a text file into the
database. Creating, modifying or deleting machines.
•
Overview of the process states
Overview the states (process is stable / not stable) and results of the parameters stored in the
database on the basis of the automatic evaluation of the last control chart.
•
Product pareto
Pareto analysis made about the parameters of a product by the number or by the rate of the out-ofspecification values.
•
Maintenance of the user registration
Modifying the own data or the data of the operators (password can be changed only if previous
password is known), deleting itself or operators, adding new users.
•
Settings
Settings related to the database and the shift identification.
System administrator
It must be a special user (named as ‘Admin’) among the operators, who is authorized alone to use the
following functions.
•
Maintenance of the user registration
Modifying the data of the users, deleting the users, changing the password of the users without
knowing the previous password.
Every user has an own password. The user is identified by the name and the password, and every user can
reach only the functions according to the user’s access level.
User’s Manual
12
2.2 Starting the program
After installation, the program can be run by clicking the ‘SPCea’ menu item of the ‘HNS.SPCea’ group in the
Windows ‘Start’ menu or directly with the ‘HNS.SPCea’ shortcut displayed on the Windows Desktop.
Program can be started only in one copy. In case of starting the second copy of the program, following
warning message is displayed.
Figure 4. Waring message in case of multiple instances
At the first starting of the program, or if the program cannot connect to the previous selected database, the
database settings must be given before logging in to the program. In this case, the following window is
displayed automatically after starting the program.
Figure 5. Database settings
First, the type of the database has to be selected, than the connection parameters have to be given.
• Microsoft Access
This database type does not need a database server, only the name and path of the database file
(*.mdb) have to be given. The database file can be also searched with the
button.
Empty database file can be found with the name SPCea.mdb in the Database sub-directory of the
program directory after the program installation, or can be also downloaded from the page
www.hns.eu/spc.
• Microsoft SQL Server
When using this database type, the name of the Microsoft SQL server, the name of the database
(default name: SPCea), the user name (default name: SPCeaUser), and the password of the user
(default password: SPCea) is required.
User’s Manual
13
The SQL script file necessary to create the database can be found in the SQL/SQLServer sub-directory
of the program directory after the program installation, or can be also downloaded from the page
www.hns.eu/spc.
• Oracle Database
When using Oracle database, the name of the database server, the user name (default name:
SPCeaUser), and the password of the user (default password: SPCea) is required.
The SQL script files necessary to create the database can be found in the SQL/Oracle sub-directory of
the program directory after the program installation, or can be also downloaded from the page
www.hns.eu/spc.
• MySQL Database
When using MySQL database, the name of the ODBC DSN made to connect to the SQL server, the
name of the catalogue (default name: SPCea), the user name (default name: SPCeaUser), and the
password of the user (default password: SPCea) is required.
The SQL script file necessary to create the database can be found in the SQL/MySQL sub-directory of
the program directory after the program installation, or can be also downloaded from the page
www.hns.eu/spc.
Attention!
You can request the local database administrator or the system administrator for creating the database and if
required, for giving the connection parameters, which can be different from the default data above.
Note
If you do not use the SQL version of the program, you can choose only the Microsoft Access database type.
After giving the connection parameters, the ‘Check.database.connection’ button has to be pressed, and
the program tries to connect to the database. If the connection is not successful, a warning message will be
displayed. In case of a connection failure, the connection parameters have to be checked and modified, if
required, or it has to be checked with external tools or by the help of the system administrator, whether the
selected database is available.
To
apply
the
database
settings,
the
program
‘Save.settings.and.restart.the.program.now’ button.
has
to
be
restarted
with
the
If you have one of the non-free versions of the program, you need a hardware key (HNS USBMUX-4
interface) to use the program. At starting the program, it is checked whether the hardware key is available (it
is connected and installed; see the chapter ‘Installation the interface’).
If the hardware key is connected into the same port, as at the previous running of the program, the checking
is made quickly; there is no feedback on the screen. Otherwise, the status of the checking can be seen in the
window displayed on the screen.
Figure 6. Checking of the hardware key
If the hardware key is not found, an error message is displayed on the screen.
Figure 7. Hardware key not found
User’s Manual
14
In this case, it is needed to connect and/or install the hardware key, and the checking can be repeated with
the ’Retry’ button.
The hardware key is checked regularly while the program is used, and in default of it, the previous error
message is displayed.
After starting / restarting, the program’s main window is displayed. The user can log in to the selected
database on the area in the left upper corner of this window. User’s name and password is requested at the
logging in, see the description about the ‘Users’ function. Giving the shift identifier can be obligatory, see the
‘Settings’ - ‘Shifts’ function. The user’s name and the shift ID can be selected in a list, but another value,
which is not found in the pre-defined list, cannot be given, except the shift ID, if pre-defined list is not exist.
Figure 8. The login area of the program before and after logging in
If the program is started for the first time, before creating the user registration, the database can be reached
with the following system administrator’s name and password:
User name:
Admin
Password:
admin
Attention!
It is recommended to change the password of the system administrator before using the program!
When incorrect password is given, a failure message will be displayed in the status row.
The access level is assigned by the given user’s name, and then the user is logged in to the database with
the rights belonging to the user’s access level.
2.3 Languages
The program can be run in more languages. The selected language is displayed in the left under corner of
the main window, and the language can be changed in this field, too. The language cannot be changed while
a function is being used. A function can be closed with the ’>’ button, which can be found on the right brink of
the sub-menu, but the measuring function can be closed with the ‘Cancel’ button. To change the selected
language, click the right mouse button above the language field, whereupon a language menu is displayed,
and the wanted language can be selected.
Ö right mouse button Ö
Figure 9. Changing the program language
2.4 Help
The user’s documentation of the program can be displayed by the
main window, as follows.
icon in the left-under corner of the
Ö left mouse button Ö User’s manual
Ö Shift + left mouse button Ö Tutorial to know the program
User’s Manual
15
2.5 User interface
The program’s main window consists of the following areas.
5
1
6
2
3
7
4
Figure 10. User interface of the program
1. Login area
This area includes the functions of the user’s login and logout.
2. Main menu
The program’s functions are ordered in groups. A function-group can be reached by clicking the
given button of the main menu.
3. Language selection
In this field, the selected language is displayed, or it can be changed, too.
4. Help
The user’s documentation of the program can be displayed.
5. Submenu
The functions belonging to the group selected in the main menu. A function can be reached by
clicking the given button.
You can go back into the main window by clicking the
button on the right brink of the sub-menu.
6. Work area
Work area belongs to the selected function specifically. If there is not selected any function, the logo
and the important data of the program are displayed.
7. Status row
This area makes for displaying the program messages and the status of the data processing.
The program can be closed by the usual way, by pressing the
window (program can be closed at anytime, without logout).
User’s Manual
button in the right-upper corner of the
16
2.6 Functions
This description contains the functions of the engineer access level, because that level contains all functions
of the software.
The main window of the engineer access level is displayed on the following figure.
Figure 11. The main window of the program on engineer access level
In the right upper corner of the main window, there are displayed the accessibilities of the program support,
the version number and the release-date of the program.
The program’s functions are ordered in groups. A group can be opened by the given button on the left brink
of the main window, and the possible functions belonging to it can be reached by the buttons on the top of
the window. The name and content of the several functions are the following - in order.
Logout - logout of the current user.
Measuring - data input onto the parameters in the database, displaying the last control chart of the
given parameter.
Analysis
• Select data - selecting the parameter and the time wanted to evaluate, giving filter options
possibly.
• Value chart - displaying the measured values, recorded onto the selected parameter during
the selected time range, by bars or points.
• Histogram - displaying the measured values, recorded onto the selected parameter during the
selected time range, in histogram (density diagram).
• Control chart - displaying the measured values, recorded onto the selected parameter during
the selected time range, on control chart with the results of the process
evaluation and automatic OoC analysis together.
• Export - exporting the measured values, recorded onto the selected parameter during the
selected time range, into text file.
User’s Manual
17
Overview
• Process states - the states (process is stable / not stable) and results of the parameters
stored in the database, by the automatic evaluation of the last control
chart.
• Product pareto - Pareto analysis about the parameters of a product by the number or rate of
the out-of-specification values.
Database
• Product - creating, modifying or deleting the products.
• Parameters - creating, modifying or deleting the parameters.
• Data - listing, modifying or deleting the measured values stored in the database.
• Import - importing measured values, recorded in a text file, into the database.
• Machines - creating, modifying or deleting the machines.
Users - maintenance the user registration: adding new users, deleting users, modifying the user’s
data or changing the password.
Settings
• Database - selecting the database wanted to use, giving the connection parameters.
• Shifts - settings related to the shift identification.
2.7 User’s rights
Access level
Function
Engineer
Operator
9
9
9
9
9
9
9
9
9
9
9
9
9
9
9
9
9
91
9
9
9
9
9
9
9
9
9
9
9
Login
Logout
Measuring
Analysis
Select data
Value chart
Histogram
Control chart
Export
Overview
Process states
Product pareto
Database
Products
Parameters
Data
Import
Machines
Users
Settings
Database
Shifts
-
92
-
1
: The right means the changing of the own data, and the data of the operators.
: The right means only the changing of the own password.
2
User’s Manual
18
3 Functions of the program
3.1 Measuring
New sample input can be done in the ‘Measuring’ menu item of the main menu.
Figure 12. Data input
This menu item does not have any submenu; the data input is managed step-by-step.
3.1.1 Select the product
First step of the data input is the selecting of the product, which’s parameter will be measured.
Figure 13. Selecting the product to be measured
The products stored in the database are listed with name and drawing number. A product can be selected
with the ‘Up’ and ‘Down’ buttons, with the up and down arrows of the keyboard or with the mouse. The
User’s Manual
19
description of the selected product can be seen under the list, and the picture (image file) selected to the
given product is displayed on the right side of the window.
Note
Creating a new product see in the description about the ‘Database’ - ‘Products’ menu item.
After selecting a product, the process can be continued with the ‘Next’ button, or data input can be aborted
with the ‘Cancel’ button.
3.1.2 Select the parameter
Second step of the data input is the selecting the parameter of the selected product.
Figure 14. Selecting the parameter to be measured
The parameters belonging to the selected product are displayed with name, unit and sample size. A
parameter can be selected with the ‘Up’ and ‘Down’ buttons, with the up and down arrows of the keyboard
or with the mouse. On the right side of the window the picture (image file) selected to the given parameter is
displayed.
Note
Creating a new parameter see in the description about the ‘Database’ - ‘Parameters’ menu item.
After selecting a parameter, the process can be continued with the ‘Next’ button, or it is possible to go back
into the process selecting window with the ‘Previous’ button.
3.1.3 Enter sample data
Before the measuring, it is possible to enter sample data. These identifiers are stored in the database with
the current sample, and these can be used as filter conditions at the analysis.
User’s Manual
20
Figure 15. Enter the sample data
Sampling time field is filled in automatically, and it is not allowed to modify by the operator (but it can be
modified on engineer level).
Shift ID can be selected in a list, which has been created on engineer level previously. Only one of the shift
ID’s in the list can be selected. If there is not created any list, it is allowed to enter an optional shift ID. If the
shift ID is given at the logging in, this field will be filled in automatically, and this value is not allowed to
modify. Compulsory shift identification can be ensured with the ‘Shift.must.be.identified.on.sample.input’
switch in the ‘Settings’ - ‘Shifts’ menu item.
Note
Creating the list of the shift ID’s and the settings related to the shift identification see in the description about
the ‘Settings’ - ‘Shifts’ menu item.
When the Machine ID is wanted to record, it is necessary to have a machine list, which has been created on
engineer level previously. Compulsory machine identification can be ensured with the
‘Machine.must.be.identified.on.sample.input’ switch in the ‘Database’ - ‘Machines’ menu item.
Note
Creating the list of the machine ID’s and the settings related to the machine identification see in the
description about the ‘Database’ - ‘Machines’ menu item.
LOT ID is an optional identifier, which can be maximum 16-character length. It is also possible to select one
of the previous used LOT ID’s. If a new LOT ID is entered (which was not used previously), it will be
displayed in the list in the LOT field at the next measuring of the given parameter.
If more samples are measured related to one or more parameters of the same product one after the other
(without going back into the product selecting window), the last entered sample data, excepting the sampling
time will be offered automatically.
After entering the sample data, the process can be continued with the ‘Next’ button, or it is possible to go
back into the parameter selecting window with the ‘Previous’ button.
3.1.4 Measure pieces of the sample
Only one sample can be input in the measuring window together.
User’s Manual
21
Figure 16. Measure pieces of the sample
On the left side of the window, the important data and settings of the selected product and parameter are
displayed. On the right side of the window, the picture (image file) selected to the given product or parameter
is displayed. If the selected product and the selected parameter has an own image file, two pictures are
displayed alternately.
The area of the measured values consists of more input fields according to the sample size of the given
parameter. In case of using xi/mx-mR/ms charts, one input field is displayed because samples are composed
by special way. Measured values can be input in optional order, and either of the entered measured values
can be modified (re-measured). The data input fields can be changed with the ‘Up’ and ‘Down’ buttons, with
the up and down arrows of the keyboard or with the mouse.
At the opening of the data input window, the selected gauge is checked (interface and gauge is connected,
gauge is switched on). Measured value can be input with the ‘Measure’ button, with the ‘F12’ button of the
keyboard, with the Data button of the gauge or with the foot switch connected to the interface. If the selected
gauge is not connected, the measured value can be input manually by the keyboard. The gauge checking
can be repeated with the ‘Switch.on.the.gauge’ button, if the gauge failure is unmade.
If the gauge is checked and it is appropriate, the actual displayed value of the gauge compared to the
specification limits is shown in a diagram continually. The bar is red, in case of an out-of-specification value,
the bar is yellow, if the actual value is in the third part of the tolerance range close to the specification limits,
otherwise the bar is green. The yellow colour (warning) is not applied in case of one-sided tolerance.
If all the measured values of the sample are entered, the data can be recorded in the database with the
‘Save.data’ button.
After saving the sample, the process can be continued with the ‘Next’ button. It is possible to go back into
the sample data entry window with the ‘Previous’ button, but this button is active until the data are saved,
furthermore, when this button is pressed, the measured values entered by that time will be lost.
3.1.5 Check the control chart
After saving the new sample, the given process is evaluated automatically, and the current control chart is
displayed with the important results (e.g. process capability indices) together.
User’s Manual
22
Figure 17. Displaying the control chart
On the top of the window, the important data and settings of the selected product and parameter are
displayed.
The number of the displayed samples on the control chart depends on the chart size, which is set for the
given parameter.
Note
Settings of the parameters see in the description about the ‘Database’ - ‘Parameters’ menu item.
The displayed control chart is evaluated automatically and the occurrent Out of Control cases are marked
with red-colour.
The values and markings of the center line, the control limits - and the specification limits if they are
displayed - are displayed in the correct position, next to the displayed lines, as default. It can occur, that
several legends cover each other, so they are not fair. In this case, the mouse cursor has to be moved above
the legends, and the values are relocated onto the middle of the diagram in order, so they can be read.
Under the chart, important sample data and important evaluation results of the process are displayed.
Sample data
• Sample time: time of the sample input.
• Measured by: name of the user, who has input the sample.
• Machine: machine ID recorded to the sample.
• LOT: LOT ID recorded to the sample.
• Shift: shift ID recorded to the sample.
• Average: sample average calculated by the measured values of the given sample, or the measured
value in case of individuals chart.
• Deviation / range: sample deviation or sample range calculated by the measured values of the given
sample, depending on the kind of the chart.
Process data
• Grand average: average calculated by the averages of the samples displayed on the control chart, or
by the measured values in case of individuals chart.
User’s Manual
23
• Deviation average / range average: the average calculated by the standard deviations or by the
ranges of the samples displayed on the control chart, depending on the kind of the chart.
• Sigma / standard deviation: if the process is stable, the sigma estimated by the range average or by
the deviation average of the samples displayed on the control chart, but if the process is not stable, the
standard deviation (s) calculated by the measured values of the samples displayed on the control chart.
• OoS’ upper: number of the measured values in the samples displayed on the control chart that are
bigger than the upper specification limit. This data is not applied in case of lower-sided specification.
• OoS’ lower: number of the measured values in the samples displayed on the control chart that are
smaller than the lower specification limit. This data is not applied in case of upper-sided specification.
• Pp / Cp and Ppk / Cpk: process capability indices calculated by the samples displayed on the control
chart. Cp and Cpk are calculated if the process is stable, but Pp and Ppk are calculated if the process is
not stable. Only Ppk / Cpk indices are calculated in case of one-sided tolerances.
Attention!
Process capability indices are always calculated by normal distribution.
Several points (samples) on the control chart can be appointed with the mouse by clicking the given point, or
with the following buttons, which can be found on the bottom of the window.
.......... :
skip to first sample of the control chart.
.......... :
skip to previous sample.
.......... :
skip to next sample.
.......... :
skip to last sample of the control chart.
It is possible to change the display range of the mean / individuals / moving mean diagram after the
displayed samples. The display range can be changed by pressing the
can be changed in order:
button, the following ranges
• UCL-LCL: default display range, samples are displayed between lower and upper control limits,
• USL-LSL: samples are displayed between lower and upper specification limits,
• Max-Min: samples are displayed between minimum and maximum sample mean / individuals / moving
mean values.
button. The legend of this button
The details of the appointed sample can be displayed with the
shows number of the samples displayed on the control chart, and the number of the appointed sample.
User’s Manual
24
Figure 18. Details of the appointed sample
This window shows the measured values of the sample and the time of the data input or the time of the
modifying of the given measured value. If one or more Out of Control cases occur related to the given
sample, they are shown under the measured values marked with red-colour.
Possible Out of Control cases related to both diagrams of the control chart are the following:
• Out of control limits: the point is under the lower control limit or above the upper control limit.
• TREND: 7 points in a row increasing or decreasing,
• RUN: 7 points in a row on same side of the centerline,
• Close to control limits: 5 points in a row are in the third part of the control range close to the control
limits on either side,
• Middle-Third: more than 89% or less than 41% of the points on the control chart are in the middle-third
of the control range.
The process can be continued with the ‘Next’ button, or it is possible to go back into the measuring window
with the ‘Previous’ button.
3.1.6 Close measuring
As the last step of the data input, user has to decide whether data input is wanted to close or continue by
going back to one of the previous step of the data input.
User’s Manual
25
Figure 19. Closing the data input
New sample can be input - compared with the last sample input:
........ : related to another product,
> going back into the ’Select.the.product’ window,
........ : related to another parameter of the same product,
> going back into the ’Select.the.parameter’ window,
........ : related to the same parameter of the same product, but with
different sample identifiers,
> going back into the ’Enter.sample.data’ window,
........ : related to the same parameter of the same product, and with
the same sample identifiers,
> going back into the ’Measure.pieces.of.the.sample’ window.
The process of the data input can be closed with the ‘Exit’ button, or it is possible to go back into the control
chart window with the ‘Previous’ button.
User’s Manual
26
3.2 Analysis
Figure 20. Analysis
The analysis of the samples stored in the database can be displayed in the ‘Analysis’ menu item of the main
menu.
3.2.1 Select data
First step of the analysis is selecting the data to be analysed, the menu items of the analysis are enabled
only after selecting the samples.
User’s Manual
27
Figure 21. Selecting the data to be analysed
First, in the drop-down lists, the product and the parameter have to be selected which’s measured values
are wanted to evaluate.
Next to the drop-down lists, the important identifiers and settings of the selected product and parameter are
displayed. On the right side of the window, the picture (image file) selected to the given product or parameter
is displayed. If the selected product and the selected parameter has an own image file, two pictures are
displayed alternately.
Sample range can be selected by two ways:
• automatic sample range selection, which means selecting the samples of the last control chart according to the chart size set for the given parameter,
• selecting samples recorded during a given time range by giving the beginning and the closing time of
the sample range.
In the second case, if an optional time range is selected, it is possible to filter the samples by the recorded
sample identifiers. The sample identifiers stored in the database related to the given parameter are listed in
the operator, shift, machine and LOT fields. One value can be selected in a list (by clicking the given value
with the mouse), but more or all of the lists can be used together. In case of giving more filter option
together, they are in ‘AND’ logical connection.
After giving the wanted time range and filter options, the ‘Load data’ button should be pressed. The samples
correspondent with the conditions are load from the database and the further menu items of the analysis are
enabled.
If the data is loaded, number of samples and measured values will be displayed in the status row.
3.2.2 Value chart
Value chart displays the measured values of the selected samples with bars or with points.
User’s Manual
28
Figure 22. Value chart
On the top of the window, important data and settings of the selected product and parameter are displayed.
The analysed field contains the beginning and closing time given at the data selection. This means the
sampling time of the first and last sample on the last control chart if the automatic sample range selection is
set. The displayed field contains the sampling time of the first and last sample displayed on the screen
actually.
It is displayed 100 measured values on the value chart, as default. The number of the displayed measured
values can be changed with the
buttons - minimum 100 measured values, maximum the
measured values are selected for analysis can be displayed together.
The values and markings of the mean and the specification limits are displayed in the correct position - next
to the displayed lines, as default. It can occur, that several legends cover each other, so they are not fair. In
this case, the mouse cursor has to be moved above the legends, and the values are relocated onto the
middle of the diagram in order, so they can be read.
The bar or point is red-coloured if the given measured value is out of the specification limits, and it is yellowcoloured if the given measured value is in the third part of the tolerance range close to the specification
limits. The yellow colour (warning) is not applied in case of one-sided tolerance.
Under the chart, important sample data and important statistical results are displayed.
Sample data
• Sampling time: time of the sample input.
• Shift: shift ID recorded to the sample.
• Machine: machine ID recorded to the sample.
• LOT: LOT ID recorded to the sample.
Data of the measured value
• Measured value: the given measured value.
• Measuring time: time of the measured value’s input.
• Measured by: name of the user, who has input the sample.
User’s Manual
29
Statistical data
• OoS’ upper: number of the measured values above the upper specification limit in the selected sample
range. This data is not applied in case of lower sided specification.
• OoS’ lower: number of the measured values under the lower specification limit in the selected sample
range. This data is not applied in case of upper sided specification.
• Maximum value: maximum measured value in the selected sample range.
• Minimum value: minimum measured value in the selected sample range.
Several measured values on the chart can be appointed with the mouse by clicking the given bar, or with the
following buttons can be found on the bottom of the window.
.......... :
skip to first measured value of the selected sample range.
.......... :
turn a page backward.
.......... :
skip to previous measured value.
.......... :
skip to next measured value.
.......... :
turn a page forward.
.......... :
skip to last measured value of the selected sample range.
It is possible to change the display range and mode of the value chart. The display mode can be changed by
pressing the
button, the following modes can be changed in order:
• displaying the deviation of the measured values from the mean in the tolerance range, by bars,
• displaying the deviation of the measured values from the mean between maximum and minimum
measured values, by bars,
• displaying the measured values by points in the tolerance range,
• displaying the measured values by points between the maximum and the minimum measured values.
3.2.3 Histogram
Histogram displays the measured values of the selected samples on frequency diagram, with the expected
(ideal) density function and the empirical density function together.
User’s Manual
30
Figure 23. Histogram
On the top of the window, important data and settings of the selected product and parameter are displayed.
The analysed field contains beginning and closing time given at the data selection. This means the sampling
time of the first and last sample on the last control chart if automatic sample range selection is set.
The table on the right side of the window contains the values of the class limits, number of the measured
values falling into the given class (absolute frequency values), and rate of the measured values falling in the
given class in proportion to the total number of the measured values in the selected sample range (relative
frequency values).
Histogram displays the frequencies belonging to the several classes with bars which’s high is proportional to
the number of the measured values falling into the given class. Display range of the histogram is taken by
the end values of the specification limits, and the maximum and minimum of the displayed measured values.
If there is not any measured value out of specification limits, the display range will be the specification range.
However, in case of one or more out-of-specification values on either or both side, the border / borders of the
display range is taken by the minimum / maximum value on the given side.
The histogram’s bar which displays the actual appointed row of the table is marked with a black narrow, this
sing moves with the appointing of the table-row together. By clicking on a bar of the histogram, the table-row
belonging to it is appointed automatically. The histogram can be analysed visually and by the numerical data
by this possibilities.
Two density functions are displayed on the histogram:
- the black coloured is the empirical density function calculated by the measured values,
- the green coloured is the expected (ideal) density function (if Cp = Cpk = 1,33).
3.2.4 Control chart
Control chart displays run of the statistical data, which are calculated by the selected samples, and marks
the location and the variation of the given parameter.
User’s Manual
31
Figure 24. Control chart
On the top of the window, important data and settings of the selected product and parameter are displayed.
The analysed field contains the beginning and closing time given at the data selection. This means the
sampling time of the first and last sample on the last control chart if the automatic sample range selection is
set. The displayed field contains the sampling time of the first and last sample displayed on the screen
actually.
Statistical data displayed on the control chart may be the mean, the individual value, the moving mean and
the range, the standard deviation, the moving range or the moving standard deviation depending on the kind
of the chart. The kind and the type of the chart (monitoring / control / acceptance) are displayed above the
chart on the right side.
The number of the displayed samples on the control chart depends on the chart size, which is set for the
given parameter.
Note
The meaning of the kinds and types of the chart, and other control chart settings see at the description about
the ‘Database’ - ‘Parameters’ menu item.
The displayed control chart is evaluated automatically and the occurrent Out of Control cases are marked
with red-colour.
The values and markings of the center line, the control limits - and the specification limits if they are
displayed - are displayed in the correct position, next to the displayed lines, as default. It can occur, that
several legends cover each other, so they are not fair. In this case, the mouse cursor has to be moved above
the legends, and the values are relocated onto the middle of the diagram in order, so they can be read.
Under the chart, important sample data and important evaluation results of the process are displayed.
Sample data
• Sample time: time of the sample input.
• Measured by: name of the user, who has input the sample.
• Machine: machine ID recorded to the sample.
• LOT: LOT ID recorded to the sample.
• Shift: shift ID recorded to the sample.
User’s Manual
32
• Average: sample average calculated by the measured values of the given sample, or the measured
value in case of individuals chart.
• Deviation / range: sample deviation or sample range calculated by the measured values of the given
sample, depending on the kind of the chart.
Process data
• Grand average: average calculated by the averages of the samples displayed on the control chart, or
by the measured values in case of individuals chart.
• Deviation average / range average: average calculated by the standard deviations or by the ranges of
the samples displayed on the control chart, depending on the kind of the chart.
• Sigma / standard deviation: if the process is stable, the sigma estimated by the range average or by
the deviation average of the samples displayed on the control chart, but if the process is not stable, the
standard deviation (s) calculated by the measured values of the samples displayed on the control chart.
• OoS’ upper: number of the measured values in the samples displayed on the control chart that are
bigger than the upper specification limit. This data is not applied in case of lower-sided specification.
• OoS’ lower: number of the measured values in the samples displayed on the control chart that are
smaller than the lower specification limit. This data is not applied in case of upper-sided specification.
• Pp / Cp and Ppk / Cpk: process capability indices calculated by the samples displayed on the control
chart. Cp and Cpk are calculated if the process is stable, but Pp and Ppk are calculated if the process is
not stable. Only Ppk / Cpk indices are calculated in case of one-sided tolerances.
Attention!
Process capability indices are calculated by normal distribution.
Several points (samples) on the control chart can be appointed with the mouse by clicking the given point, or
with the following buttons can be found on the bottom of the window.
.......... :
skip to first sample of the selected sample range.
.......... :
turn a control chart backward.
.......... :
skip to previous sample.
.......... :
skip to next sample.
.......... :
turn a control chart forward.
.......... :
skip to last sample of the selected sample range.
It is possible to change the display range of the mean / individuals / moving mean diagram after the
displayed samples. The display range can be changed by pressing the
can be changed in order:
button, the following ranges
• UCL-LCL: default display range, the samples are displayed between the lower and the upper control
limits,
• USL-LSL: samples are displayed between lower and upper specification limits,
• Max-Min: samples are displayed between minimum and maximum sample mean / individuals / moving
mean values.
button. The legend of this button
The details of the appointed sample can be displayed with the
shows number of the samples displayed on the control chart, and the number of the appointed sample.
User’s Manual
33
Figure 25. Details of the appointed sample
This window shows the measured values of the sample and the time of the data input or the time of the
modifying of the given measured value. If one or more Out of Control cases occur related to the given
sample, they are shown under the measured values marked with red-colour.
Possible Out of Control cases related to both diagrams of the control chart are the following:
• Out of control limits: the point is under the lower control limit or above the upper control limit.
• TREND: 7 points in a row increasing or decreasing,
• RUN: 7 points in a row on same side of the centerline,
• Close to control limits: 5 points in a row are in the third part of the control range close to the control
limits on either side,
• Middle-Third: more than 89% or less than 41% of the points on the control chart are in the middle third
of the control range.
3.2.5 Export
In the ’Export’ menu item, the data of the sample range selected for analysis can be copied into csv file.
Figure 26. Data export
Firstly, the name and path of the csv file should be given. File can be also searched and selected by the
button. If the path is not given, file will be placed in the program directory (next to the .exe file).
Further data can be exported beside the measured values by turning on the following switches:
• sampling time of the given sample,
• time of the input / last modification of the measured value (measuring time),
• further sample data in the following order:
- LOT ID,
- machine ID,
- shift ID,
- operator ID.
After the required settings, the copying of the data can be started by pressing the ‘Export’ button. The status
of the export process is marked in the status row at the bottom of the window.
User’s Manual
34
3.3 Overview
Figure 27. Overview
In the ’Overview’ menu item of the main menu, all of the processes (parameters) stored in the database can
be surveyed in different regards.
3.3.1 Process states
In the ‘Process.states’ menu item the states (process is stable / not stable) and calculated results of the
parameters (processes) stored in the database are displayed.
User’s Manual
35
Figure 28. Process states
On the left side of the window, the products and parameters stored in the database are displayed in tree
structure.
There are displayed only the parameters which had new data input in the past week (past 7 days).
Otherwise, the process is regarded as inactive and is not displayed in the list above.
The name of the parameter is red-coloured if at least one of the following conditions is fulfilled.
• the process is not stable, namely there is one or more Out of Control case on the control chart,
• there are one or more measured values out of specification limits in either sample displayed on the
control chart,
• the process capability index is lower than the expected limit.
The name of the product is red-coloured if at least one of the parameters of the product has “red” status.
The following details of a parameter can be seen by clicking its name:
• important identifiers and settings of the given parameter,
• data of last sample input:
•
last sampling time,
•
name of the user, who measured the sample,
•
shift ID recorded to the sample (which shift produced the sample),
•
machine ID recorded to the sample (which machine produced the sample),
•
LOT ID recorded to the sample (which LOT belongs the sample to),
•
sample average,
•
sample range,
•
sample standard deviation,
•
•
sample OoC status (there is an Out of Control case or there is not any Out of Control case
at the last sample input),
data of last control chart:
User’s Manual
•
time range evaluated automatically (sampling time of the first and last sample on the actual
control chart),
•
maximum measured value in the samples displayed on the control chart,
•
minimum measured value in the samples displayed on the control chart,
36
•
number of parts (measured values) above the upper specification limit in the samples
displayed on the control chart (OoS’ upper), this data is not applied in case of lower-sided
specification,
•
number of parts (measured values) beyond the lower specification limit in the samples
displayed on the control chart (OoS’ lower), this data is not applied in case of upper-sided
specification,
•
average of the measured values in the samples displayed on the control chart (xa) and the
average calculated by the averages of the samples displayed on the control chart, or by the
measured values in case of individuals chart (xga),
•
range of the measured values in the samples (R) and the average of the sample ranges (Ra)
displayed on the control chart,
•
standard deviation of the measured values in the samples (s) and the average of the sample
standard deviations (sa) displayed on the control chart,
•
•
sigma estimated by the range average or by the standard deviation average of the samples
displayed on the control chart - this data is applied only in case of stable processes,
process capability indices:
•
Cp and Cpk if the process is stable,
• Pp and Ppk if the process is not stable.
In case of one-sided specifications, only the Cpk or Ppk index is calculated - related to the given
specification limit.
If the capability index value is smaller than the expected minimum value set for the given
parameter, the index is red-coloured.
Attention!
Process capability indices are calculated by normal distribution.
The results above are calculated by the samples of last control chart, which’s length is taken after to the
chart size set for the given parameter.
3.3.2 Product pareto
In the ’Product pareto’ menu item, Pareto analysis can be made about the parameters of a product by the
number or rate of the out-of-specification values.
User’s Manual
37
Figure 29. Product pareto analysis
In the left-upper corner of the window, the products recorded in the database are listed. On the right side of
the window, the Pareto analysis of the selected product is displayed.
Pareto analysis is made by the data recorded in the past week (past 7 days), as default. If different time
range is wanted to analyse, the beginning and closing date should be given in the ‘Analysed’ field, and the
‘Refresh’ button should be pressed.
If no samples were recorded during the selected time range, or all of the measured values are in the
specification, the number of the failures cannot be defined, and the Pareto diagram cannot be made. In this
case, a legend is displayed instead of the diagram.
In the left-under corner of the window, the parameters belonging to the selected product are listed, but only
the parameters whereto new samples have been recorded during the selected time range and at least one
measured value is out of the specification in the recorded samples.
Next to the name of the parameter, number of the out-of-specification values, which were recorded during
the selected time range, is displayed; it is as much as saying that the given parameter has resulted so many
defected parts.
The order of parameters in this table is the same as in the Pareto diagram; they are in decreasing order of
the number of failures.
If another parameter is appointed in the table, the black narrow beyond the diagram will skip to the bar,
which marks the appointed parameter. If another bar is appointed in the diagram with the mouse, also the
appointed parameter in the table will be changed.
In the right-upper corner of the diagram, the data of the selected parameter is displayed in a table:
•
number of measurements recorded during the selected time range related to the given parameter,
•
number of measured values above the upper specification limit (OoS’ upper) recorded during the
selected time range related to the given parameter,
•
number of measured values beyond the lower specification limit (OoS’ lower) recorded during the
selected time range related to the given parameter.
If numbers of the measured values recorded to the several parameters are different, it is recommended to
make the Pareto analysis by the rate of out-of-specification values in proportion to total number of measured
values. Display mode can be changed by double-clicking with the left mouse button on the field of the
diagram. In this case, the rate is calculated in percentage, the number of out-of-specification values is
correlated to the total number of measured values (both value is related to the selected time range and the
selected parameter), and several parameters are ordered accordingly.
User’s Manual
38
3.4 Database
Figure 30. Database
The functions of the database maintenance can be found in the ‘Database’ menu item of the main menu.
3.4.1 Products
Product registration can be displayed by pressing the ‘Products’ button of the sub-menu.
Figure 31. Products
Product’s names are listed on the left side of the window; further fields contain the data of the product
selected in the list.
One of the product’s data can be modified; only the wanted data should be rewritten, and the given input
field should be left.
User’s Manual
39
New product can be created with the ‘Add product’ button, and following product data should be defined:
•
Product name, its length is 25 characters at longest, compulsory data.
•
Drawing number of the product, its length is 25 characters at longest.
•
Description of the product, optional text, its length is 255 characters at longest.
•
Name and path of the image file wanted to display to the product. File can be also searched by the
button.
The image file is displayed in a field, which size is 190x190 pixels, but a larger picture can be
selected, too. In this case, the picture will be reduced automatically, but its scale will not be
changed. If the width and/or high of the picture-field are not filled in, grey background is shown on
the empty place.
New product can be saved in the database with the ‘Ok’ button, or rejected with the ‘Cancel’ button.
The selected product can be removed from the database with the ‘Delete product’ button, after conforming
of deleting.
3.4.2 Parameters
Parameter registration can be displayed by pressing the ‘Parameters’ button of the sub-menu.
Figure 32. Parameters
Parameter registration belongs to a given product, so firstly, the product, which one’s parameters are
wanted to list, has to be selected in the drop-down list in the left-upper corner of the window.
Parameter’s names are listed on the left side of the window; further fields contain the data of the parameter
selected in the list.
New parameter can be created with the ‘Add parameter’ button, and following parameter data should be
defined:
•
Parameter name, its length is 25 characters at longest, compulsory data.
•
Unit, its length is 10 characters at longest.
•
Type of specification: double-sided, lower-sided or upper-sided. Upper specification limit (USL)
and/or lower specification limit (LSL) has to be given according to the selected specification type.
User’s Manual
40
•
Sample size: number of measured values in a group (number of pieces are taken out of the
process together).
•
Resolution of the gauge used for measuring of the given parameter, number of the decimals to be
used.
•
The gauge used for measuring of the given parameter. Data input can be done by keyboard, or by
Mitutoyo Digimatic gauges connected to HNS SMUX / USBMUX interface. If the interface is
selected, also the COM port (COM port of the computer, whereto the interface is connected) and
the channel (channel of the interface, whereto the gauge is connected) have to be given.
•
Required (minimum) capability index value for the given parameter. Calculated capability index is
compared with this value and the index’s conformance is marked after this.
•
Name and path of the image file wanted to display to the parameter. File can be also searched by
button.
the
The image file is displayed in a field, which size is 190x190 pixels, but a larger picture can be
selected, too. In this case, the picture will be reduced automatically, but its scale will not be
changed. If the width and/or high of the picture-field are not filled in, grey background is shown on
the empty place.
•
Chart size: number of points (samples), which are displayed on the control chart together.
•
Kind of chart, which can be after the statistical parameters displayed on the control chart:
•
x-R : mean - range chart,
•
x-s : mean - standard deviation chart,
•
xi-mR : individuals - moving range chart,
•
xi-ms : individuals - moving standard deviation chart,
•
mx-mR : moving mean - moving range chart,
•
mx-ms : moving mean - moving standard deviation chart.
When individuals - moving range / moving standard deviation, or moving mean - moving range /
moving standard deviation chart is applied, sample size value means, that the moving mean /
moving range / moving standard deviation is calculated by so many sucessive measured values
(so it is not means the number of pieces are taken out of the process together).
•
Type of chart, which can be after the calculation method of the control limits:
•
Monitoring: default chart type, the center line of the mean / individuals diagram is the
process average (marked with ‘xga’), and calculated control limits are simmetric to it.
•
Control: the center line of the mean / individuals diagram is the middle of the specification
range (marked with ‘xgoal’), and calculated control limits are simmetric to it.
•
Acceptance: the center line of the mean / individuals diagram is calculated by restricting
the specification range, considering the statistical parameters of the process.
Attention!
The ‘control’ chart type is not enabled in case of one-sided specification.
•
Control limits can be calculated or fixed values. In case of fixed control limits, the user has to be
given the values to be used. Four input fields are available to give the upper control limit (UCL) and
lower control limit (LCL) values: two on the left side for the upper (x) diagram of the control chart,
and two on the left side for the under (R/s) diagram of the control chart.
New parameter can be saved in the database with the ‘Ok’ button, or rejected with the ‘Cancel’ button.
One of the parameter’s data can be modified; only the wanted data should be rewritten, and the given input
field should be left.
Attention!
Sample size and kind of chart cannot be changed later.
When the specification is changed, the statuses of the data stored in the database are re-evaluated,
therefore the process may take up more minutes depending on the number of the measured values.
The selected parameter can be removed from the database with the ‘Delete parameter’ button, after
conforming of deleting.
User’s Manual
41
3.4.3 Data
Measured values stored in the database can be listed by pressing the ‘Data’ button of the sub-menu.
Figure 33. Measured values
Firstly, the product and the parameter, which one’s measured values are wanted to list, has to be selected
in the drop-down lists in the left-upper corner of the window.
Next to the drop-down lists, the important data and settings of the selected product and parameter are
displayed. On the right side of the window, the picture (image file) selected to the given product or parameter
is displayed. If the selected product and the selected parameter has an own image file, two pictures are
displayed alternately.
Above the table, number of samples stored in the database related to the given parameter, and the number
of the actual selected measured value are displayed. Actual selected measured value is marked with a black
narrow in the first column of the list.
The table contains the measured values of the stored samples with the sampling time and further sample
identifiers together. The elements of the several samples are marked with different background-colour.
The out-of-specification values are marked with red coloured background, and the yellow background
means, that the measured value is in the third part of the tolerance range close to the specification limits.
The yellow background colour is not applied in case of one-sided tolerance.
Measured values and sample identifiers can be modified or given subsequently. This can be done by doubleclicking on the given field, and re-writing the data wanted to modify. If one of the sample identifiers is
modified or one of the missing sample identifiers is given subsequently, the modification will be applied for all
of the measured values of the given sample.
It is possible to re-measure one of the measured values and input the measured value by the gauge set for
the given parameter directly. The ‘Switch.on.the.gauge’ button has to be pressed to check the selected
gauge. If the gauge is appropriate, the measuring can be made and the measured value can be input. Remeasuring is applied to the measured value, which is appointed by the cursor; data input can be made by
the usual way (with the ‘Measure’ button, with the ‘F12’ button of the keyboard, with the Data button of the
gauge or with the foot switch connected to the interface).
User’s Manual
42
If the gauge is switched on, the actual displayed value of the gauge compared to the specification limits is
shown in a diagram continually. The bar is red, in case of an out-of-specification value, the bar is yellow, if
the actual value is in the third part of the tolerance range close to the specification limits otherwise the bar is
green. The yellow colour (warning) is not applied in case of one-sided tolerance.
One of the stored samples can be removed from the database by appointing one of the sample’s measured
values and pressing the ‘Delete selected sample’ button. It is possible to remove all of the samples of the
selected parameter recorded during a selected time range. After the wanted time range is given, removing
can be made with the ‘Delete samples’ button. The beginning and closing time of the time range have to be
entered in the fields next to the ‘Deleting by time’ legend. When clicking the
button, the sampling time of
the sample is actual appointed by the cursor will be copied into the given time field. Samples are always
removed after conforming of deleting.
3.4.4 Import
In the ‘Import’ menu item, it is possible to load measured values of a text file into the database.
Figure 34. Data import
In the ‘File’ field, the name and the path of the file contains the data to be imported have to be given. The
import file can be also searched by the
button.
Next step is to select the product and the parameter, whereto the imported samples wanted to save.
Furthermore, selecting of the import file format is required out of the following possibilities:
•
import file contains only the measured values,
13,45
13,46
13,39
13,41
13,43
Ø
•
import file contains the measured values and sampling time,
13,45;2009.03.18.
13,46;2009.03.18.
13,39;2009.03.18.
13,41;2009.03.18.
13,43;2009.03.18.
15:47:02
15:47:02
15:47:02
15:47:02
15:47:02
Ø
•
import file contains beside the measured values, the sampling time, measuring time, LOT ID,
machine ID, shift ID and operator ID.
13,45;2009.03.18.
13,46;2009.03.18.
13,39;2009.03.18.
13,41;2009.03.18.
13,43;2009.03.18.
15:47:02;2009.03.18.
15:47:02;2009.03.18.
15:47:02;2009.03.18.
15:47:02;2009.03.18.
15:47:02;2009.03.18.
15:47:32;12345-01;Eszterga-1;A01;xy
15:47:38;12345-01;Eszterga-1;A01;xy
15:47:45;12345-01;Eszterga-1;A01;xy
15:47:53;12345-01;Eszterga-1;A01;xy
15:48:01;12345-01;Eszterga-1;A01;xy
Ø
User’s Manual
43
Following requirements has to be fulfilled related to the format of the import files.
•
One row contains one measured value and the identifiers belonging to it.
•
The format of the measured values (decimal point) is used according to the regional and language
settings of the operating system, which is running on the computer.
•
Several fields are separated with semicolon (’;’).
•
Several items of the date (year, month, day) have to be marked with numbers, and separated with
point (‘.’). Several items of the time (hour, minute, second) have to be separated with colon (‘:’).
Time is separated with a space (‘ ‘) from the date.
•
Time format: yyyy.mm.dd hh:mm:ss.
•
Rows are closed with Cr (13) and Lf (10) characters.
•
Number of rows in the file is according to the sample size selected for the given parameter (number
of rows is the multiple of the sample size).
Note
At the loading of the import file with the first format, sampling time and measuring time will be equal to the
loading time of the given measured value automatically. Further sample identifiers will not be recorded.
At the loading of the import file with the second format, measuring time will be equal to the loading time of
the given measured value automatically. Further sample identifiers will not be recorded.
In the import file with the third format, the places of the missing sample identifiers have to be appointed with
semicolon even if the sample identifier misses from the last field of the row.
If the first or second format is selected, further sample identifiers will not be recorded even if they occur in the
file.
Sample identifiers are checked per samples excepting the measuring time. If different identifiers occur in the
file related to several measured values of one sample, the identifier of the sample’s first measured value will
be recorded to all the measured values of the given sample.
Importing can be started with the ‘Import data’ button, after the required settings are made. The status of the
import process is marked in the status row at the bottom of the window.
Firstly, the content of the file is checked after the importing is started. Loading of the data is made only if the
format and the content of the file are correct.
3.4.5 Machines
In the ‘Machines’ menu item, the list of the machines used as sample identifiers can be made and
maintained.
Figure 35. Machines
Machine’s names are listed on the left side of the window; further fields contain the data of the machine
selected in the list.
User’s Manual
44
One of the machine’s data can be modified; only the wanted data should be rewritten, and the given input
field should be left.
New machine can be created with the ‘Add machine’ button, and following machine data should be defined:
•
Machine name, its length is 25 characters at longest, compulsory data.
•
Description of the machine, optional text, its length is 255 characters at longest.
New machine can be saved in the database with the ‘Ok’ button, or rejected with the ‘Cancel’ button.
The selected machine can be removed from the database with the ‘Delete machine’ button, after
conforming of deleting.
If the ‘Machine must be identified on sample input’ switch is on, it will be compulsory to give the machine
ID at the input of the new sample.
3.5 Users
Figure 36. Users
User registration can be maintained in the ‘Users’ menu item of the main menu.
Figure 37. User registration
User’s Manual
45
User’s names are listed on the left side of the window; further fields contain the data of the user selected in
the list.
To change the name or the access level, only the wanted data should be modified, and the given input field
should be left. To change the password, the ‘Change password’ button should be pressed, and the old and
the new password should be given. New password must be confirmed in the ‘New password again’ field.
New password can be saved by the ‘Ok’ button or rejected with the ‘Cancel’ button.
New user can be added with the ‘Add user’ button, and following user data should be defined:
•
user’s name, its length is 25 characters at longest, compulsory data,
•
user’s rights level: engineer or operator,
See the explanation of the access levels in the chapter ‘Program overview’ / ‘Access levels’.
new password and new password again, compulsory data.
•
New user can be saved with the ‘Ok’ button, or rejected with the ‘Cancel’ button.
The selected user can be removed from the registration with the ‘Delete user’ button, after conforming of
deleting.
It is compulsory to have at least one engineer to maintain the user registration. There is a pre-defined user,
who has engineer rights; its name is ‘Admin’, and its default password is ‘admin’.
This user name and password can be used at the login when the program is started for the first time - before
the user registration is created.
Attention!
It is recommended to change the password of the system administrator before using the program!
‘Admin’ cannot be removed from the user registration.
‘Admin’ is an important user in the regard of the rights connected to the user registration. It has following
possibilities, which are more expansive than the engineer’s rights.
- adding new user,
- modifying either of the data of either of the users,
- deleting either of the users,
- changing the password of the users without knowing the old password.
Following functions of the user registration are enabled for the engineers:
- adding new user,
- modifying of the own data, removing itself,
- modifying either of the data of the operators (but the operator’s password can be changed only with
knowing the old password of the given operator), and removing either of the operators.
Operators can only change the own password, with knowing the old password.
User’s Manual
46
3.6 Settings
Figure 38. Settings
3.6.1 Database
In the ‘Settings’ - ‘Database’ menu item, another (different from the previous selected) database can be
selected, and the connection parameters can be given.
Figure 39. Database settings
User’s Manual
47
The description about selecting the database and giving the required connection parameters see in the
relevant part of the chapter ‘Starting the program’.
Note
If you do not use the SQL version of the program, you can choose only the Microsoft Access database type.
If you use the free version of the program, you cannot change the database, you can use only the
’SPCea.mdb’ file installed in the ‘Database’ sub-directory of the program directory.
3.6.2 Shifts
In the ‘Settings’ - ‘Shifts’ menu item, the shift identifiers and the shift settings can be given.
Figure 40. Shift settings
Maximum four different shift identifiers can be given; the length of each is 5 characters at longest.
One of these shift ID’s can be given as sample identifier at the sample input or at the login into the program.
If here is not entered any sample ID, optional shift ID could be given at the sample input and at the login.
If the ‘Shift must be identified on login’ switch is on, the user cannot login into the program without giving
the shift ID.
If the ‘Shift must be identified on sample input’ switch is on, it is compulsory to give the shift ID at the
input of the new sample.
If the ‘Shift must be identified on login’ switch is on, the ‘Shift must be identified on sample input’ switch
cannot be off, because the shift ID entered at the login cannot be changed at the sample input.
User’s Manual
48