1
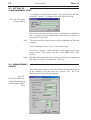
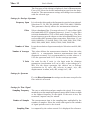
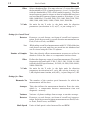
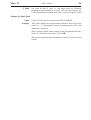
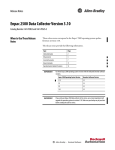
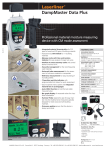
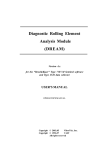
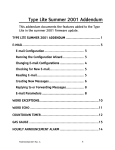
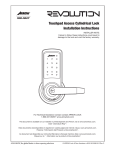
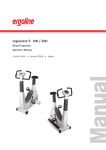
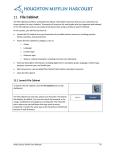
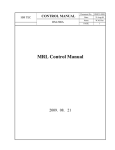
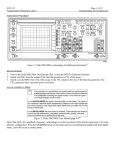
VIBRO 12 APPLICATION SOFTWARE For the DC-12M vibration analyzer USER'S MANUAL Copyright © 2000, 2004 Inteltech Enterprises, Inc. Copyright © 2000, 2004 VAST, Inc. Vibro 12 User's Guide Contents 1. FEATURES ................................................................................................. 3 2. TECHNICAL SUPPORT................................................................................ 4 3. USER INTERFACE ...................................................................................... 5 3.1. THE MAIN WINDOW OF THE PROGRAM ............................................. 5 3.2. THE DATABASE NAVIGATION .............................................................. 6 4. THE MAIN OPERATIONS ............................................................................ 7 5. DATABASE SETUP ..................................................................................... 8 5.1. SETTING UP A GROUP ....................................................................... 8 5.2. SETTING UP A NEW MACHINE ........................................................... 9 5.3. SETTING UP A MEASUREMENT POINT ............................................. 10 5.4. MEASUREMENT SETUPS ................................................................. 10 6. ROUTE CREATION ................................................................................... 14 7. LOADING ROUTES INTO THE DC-12M ...................................................... 15 8. UNLOADING ROUTES .............................................................................. 16 9. VIEWING AND ANALYZING MEASUREMENT DATA .................................... 17 10. MENUS .................................................................................................. 18 10.1. THE FILE MENU .............................................................................. 18 10.2. THE CONFIGURATION MENU ......................................................... 18 10.4. THE HELP MENU ............................................................................ 19 1 2 User's Guide Vibro 12 Vibro 12 User's Guide 3 1. FEATURES The Vibro 12 is an application software used with the DC-12M, data collector and analyzer. The program is easy-to-use. It provides the operations as follows: l creating measurement routes; l loading them into DC-12M; l unloading the measurement data obtained from the DC12M; l viewing and analyzing measurement data; l input of your comments; l storage of the measurement results in the database which provides quick access to the data with the hierarchical tree. All this is true also for the the Off Route measurements. 4 User's Guide Vibro 12 2. TECHNICAL SUPPORT The Vibro 12 software is developed by Association VAST, Ltd. and VibroTek, Ltd. You may apply for technical support at 140, Stachek pr. St. Petersburg, 198207 Russia e-mail: [email protected] fax in Russia: +7 (812) 324 6547 tel. in Russia: +7 (812) 327 5563 You can get information on the VAST products and answers to your questions via Internet at http://www.vibrotek.com Vibro 12 User's Guide 5 3. USER INTERFACE The program has a standard Windows interface and can be driven either with the mouse or the keyboard. The latter is faster for the common operations. 3.1. THE MAIN WINDOW OF THE PROGRAM The main window of the program consists of two panes and a menu bar. - Database pane; - View/Route pane. Fig. 4.1. The main window of the Vibro 12 software The database pane contains the following sections: - Configuration to configure equipment tree and set up measurements. - OffRoute to store offroute measurements. - Balancing, Shock pulse, Running up / Coast down to store logs of the relative measurement programs. The right pane contains two pages - View and Route - which you can toggle by clicking the page tabs at the top of the pane. The main controls are as follows: q menu; q local right-button menu; 6 Vibro 12 User's Guide Note q hot keys (indicated next to the commands in the menus); q dialogs called with the commands; q control panels. All the control panels can be moved along the four pane borders. Use the mouse to drag them to the desired location. 3.2. THE DATABASE NAVIGATION The machinery database is represented as a tree for easy navigation. While not setting up, it has only two root nodes: Configuration and Offroute that are the highest levels of hierarchy, they cannot be removed. After you set up the database according to your machinery, it should contains several levels of hierarchy. The lowest level is measurement data from the data collector. The hierarchy may contains the levels as follows: Group -> Machine -> Measurement Point -> Measurement Setup -> [Measurement Data]. For easy navigation, use the mouse or the arrow keys: Note Key Action Up arrow key goes one level up; Down arrow key goes one level down; Right arrow key expands a branch; Left arrrow key collapses a branch. If the cursor is on the measurement data, the arrow keys are used at the View pane. Thus use the mouse to go to another node. The commands are applied to the selected node. Vibro 12 User's Guide 7 4. THE MAIN OPERATIONS The main steps to work with the program are as follows: 1. First of all you need configure the database tree and enter there all the groups, machines and points you need to measure. (See section 5) 2. Then create a route, add the nodes you want to it for measuring. 3. Load the route to the DC-12M. 4. Take measurements. 5. Unload the measurement data into the database. 6. View/analyze the measurement data. Add your comments (estimations) to them. The Off-Route section of the database is sorted by measurement types and settings so that the data of the various machines are groupped together. If the section is grown it would be difficult to handle it, so try and copy the measurement data into the machinery section as quick as possible. 8 User's Guide Vibro 12 5. DATABASE SETUP The database tree is hierarchical and can contains levels as follows: Root node (Configuration) -> Group of machines -> Machine -> Measurement point -> Measurements Setups -> [Measurement data, if taken]. To configure a new node which can be any of the above (aside from the measurement data, of course), 1. Press the <Insert> key (or select the New command from the Configuration menu). 2. Enter the name for the new node into the dialog. You may additionally enter comments, which will be shown for reference at the header of the View pane, as well as a picture). Then click OK. You will see that the new node is added to the tree. In the same way you may configure the next levels of the new node (down to the measurement setups). After you set up a measurement point, selected it and pressed <Insert>, the User Measurement Setup dialog will be displayed. Select the desired measurement type, all the settings you need and click OK. After your have configured the database for your equipment to measure, create routes for measurements and you can take data with DC-12M. Any tree node can be copied and moved into another location within the tree (aside from the root nodes Configuration and OffRoute). 5.1. SETTING UP A GROUP To configure a group, select the Configuration node and press <Insert>. It displays the New (Group) dialog. Fig. 4.2. The New (Group) dialog Vibro 12 User's Guide 9 Enter the name of the group (up to 20 characters). Additionally, you may enter your comments and select a picture to show at the View pane. Note The picture will be shown instead of the information on the node contents. The comments can be up to 45 characters long. To choose a picture, click the button which is the next to the input line for the picture name. The picture can be of the BMP, GIF, JPG formats. Note After the group is created, you may edit its properties any time you want by pressing the <F4> key. 5.2. SETTING UP A NEW MACHINE To set up a machine, select the desired group (or create a new one and then select it) and press <Insert>. It displays the New (Machine) dialog. Fig. 4.3 The New (Machine) dialog Enter the name of the machine (up to 20 characters). Additionally, you may enter your comments as well as select a picture to show at the View pane. Note The picture will be shown instead of the information on the node contents. Comments can be up to 45 characters long. To choose a picture, click the button of the input box for the picture name. The picture can be of the BMP, GIF, JPG formats. Note After the machine is created, you may edit its properties any time you want by pressing the <F4> key. 10 User's Guide Vibro 12 5.3. SETTING UP A MEASUREMENT POINT To configure a measurement point, select the desired machine and press <Insert>. It displays the New (Point) dialog. Fig. 4.4. The New (Point) dialog Enter the name of the machine (up to 20 characters). Additionally, you may enter your comments as well as select a picture to show at the View pane. Note The picture will be shown instead of the information on the node contents. Your comments can be up to 45 characters long. To choose a picture, click the button of the input box for the picture name. The picture can be of the BMP, GIF, JPG formats. Note After the measurement point is created, you may edit its properties any time you want by pressing the <F4> key. 5.4. MEASUREMENT SETUPS To set up a measurement, select the desired measurement point in the database tree and press the <Insert> key. The User Measurement Setup dialog appears. Fig. 4.5. The User Measurement Setup Dialog for Envelope Spectrum Vibro 12 User's Guide 11 The first page of the dialog is displayed, that is Measurements. First of all, select the desired measurement type from the dropdown list. The measurement settings will change in accordance with the selected type. Settings for Envelope Spectrum Frequency Span It is selected with regard to the frequencies need to be monitored. Selections: 25, 50, 100, 200, 400 800, 1600, 3200, 6400, 12800 Hz. This parameter directly affects the measurement duration. Filter Select a bandpass filter. You may select an 1/3 octave filter (with the bandwidth of 23% of mean frequency), or an 1/1 octave filter (with the bandwidth of 70% of filter mean frequency). The filter mean frequency must be chosen so that its bandwidth have been not less than the Frequency Span to monitor. Selections: 1/1 oct 8000, 16000 Hz; 1/3 oct 800, 1000, 1250, 1600, 2000, 2500, 3200, 4000, 5000, 6400, 8000, 10000, 12800, 1600, 20000 Hz. Number of Lines It sets the resolution of spectrum analysis. Selections are 400, 800, 1600. Number of Averages This value defines the measurement duration. Enter the value which is a compromise between measurement time and diagnostic accuracy. It is recommended to set this value to 68 for the spectrum and 10-12 for the envelope spectrum. Y Units Set units for the Y scale i.e. the basic units for vibration parameters (acceleration in G, m/s2, dB), or just voltage in V, dB). For the direct spectrum, the choices are as follows: acceleration in G, m/s2, dB; velocity in mm/s, in/s, dB; displacement in mkm, mils, dB; voltage in V, dB. Settings for Spectrum For the Direct Spectrum the settings are the same except for the filter which is not used. Settings for Time Signal Sampling Frequency The rate at which the analyzer samples the signal. It is recommended to set the sampling frequency more than 10 times as high as the highest frequency in the signal. If the ratio is less, the transients, impacts may be missed. Number of Samples The measurement time is the sampling time multiplied by the number of samples. Select the value with regard to the number of signal periods need to be viewed. Sampling Time is computed by the values entered. It is displayed for reference. 12 User's Guide Vibro 12 Filter Select a bandpass filter. You may select an 1/3 octave filter (with the bandwidth of 23% of mean frequency), or an 1/1 octave filter (with the bandwidth of 70% of filter mean frequency). The filter mean frequency must be chosen so that its bandwidth have been not less than the Frequency Span to monitor. Selections: 1/1 oct 8000, 16000 Hz; 1/3 oct 800, 1000, 1250, 1600, 2000, 2500, 3200, 4000, 5000, 6400, 8000, 10000, 12800, 1600, 20000 Hz. Y Units Set units for the Y scale i.e. the basic units for vibration parameters (acceleration in G, m/s2), or just voltage in V. Settings for Overall Level Detector Detectors, or scale factors, are forms of overall level representation. Scale factors used in overall vibration measurements are Peak, Peak-to-Peak, and RMS. Note While taking overall level measurements with DC-12M, all the four scale factors are used, and they are stored into the database and can be viewed using the Vibro 12 software. Number of Samples This value directly affects measurement accuracy as well as its duration. Select the value as a compromise between them. Filter Defines the frequency range of overall measurements. The cutoff frequencies of a band can be 2-200, 3-300, 5-500, 2-1000, 10-1000 (which is the ISO specification), 10-2000, 10-5000, 5000-10000, 10000-25000 Hz. Y Units Set units for the Y scale i.e. the basic units for vibration parameters (acceleration in G, m/s2, dB; velocity in mm/s, in/ s, dB; displacement in mkm, mils, dB; ), or just voltage in V, dB. Settings for Phase Harmonic No The number of the rotation speed harmonic for which the measurement will be done. Averages This value defines the measurement duration. Enter the value which is a compromise between measurement time and diagnostic accuracy. Variance Variance of phase readings from average to another average. Detector Detectors, or scale factors, are forms of overall level representation. Scale factors used in phase measurements are Peak, Peakto-Peak, Peak Factor, and RMS. Shaft Speed Units of shaft speed: select between Hz and RPM Vibro 12 User's Guide Y Units 13 Set units for the Y scale i.e. the basic units for vibration parameters (acceleration in G, m/s2, dB; velocity in mm/s, in/ s, dB; displacement in mkm, mils, dB; ), or just voltage in V, dB. Settings for Shaft Speed Units Averages Units of shaft speed: select between Hz and RPM This value defines the measurement duration. Enter the value which is a compromise between measurement time and diagnostic accuracy. Also you may change some settings of the measurement instrument. To confirm your choices, click OK. After you set up all the measurements you need, it's time to create routes. 14 Vibro 12 User's Guide 6. ROUTE CREATION The right pane of the main window consists of the two pages View and Route - you may toggle them by clicking the page tabs at the top of the pane. To create a route, 1. Display to the Route page of the right pane. 2. In the database tree, select the desired group of machines. Note A route cannon hold machines/measurement points from the different groups. 3. Click the New Route button ( Note ) on the route page. The selection cursor in the database tree can be at any location within the desired group. 4. In the dialog displayed, type the name for the new route (not more than 8 characters long), and - if required - comments, and click OK. At the Route page, you will see the new route. 5. To add a machine/measurement point to the route, select it in the tree, and if there are a number of routes, select the desired route, and then press the F5 key (that is the Include in the Route command). The selected node will be added to the selected route. In this way, set up the entire route and load it into the DC-12M. Note To add the tree node to the route with the mouse, drag it to the route page from the tree and drop there. Vibro 12 User's Guide 15 7. LOADING ROUTES INTO THE DC-12M After you configured the routes you need, you may load them into DC-12M. To do it, 1. Connect DC-12M to the PC using RS-232 interface. 2. At the Route pane, select the route to load. 3. Click the button. It displays the Communication Settings dialog which contains the detailed instructions on how to load a route. Just follow them. Fig. 4.7 The Communication Settings dialog After you took measurements, unload the measurement data into the software database. 16 User's Guide Vibro 12 8. UNLOADING ROUTES To unload a route from the DC-12M, 1. Connect the DC-12M to the PC with the RS-232 cable. 2. From the File menu, choose the Unload Hardware command. 3. Follow the instructions at the Communication Settings dialog. Fig. 4.8. The Communication Settings dialog Now you can view and analyze all the measurement data loaded. Vibro 12 User's Guide 17 9. VIEWING AND ANALYZING MEASUREMENT DATA The measurement data obtained you can view by selecting the measurement you need in the database tree. The data will be shown at the View page of the right pane. It may be a graph (for spectra), a number value (for overall level), or a time waveform. As well as the controls on the graph control panel, you can use the mouse to zoom/move a graph, or a part of it. To zoom a part of the graph, select it with the mouse by dragging the mouse cursor in the right and down direction, then release the left button of the mouse. To restore the initial state of the graph, do the same in opposite direction. You can drag the graph with the mouse cursor within the Cartesian coordinates into any direction while holding down the right button of the mouse. At the View page of the measurement data, there a number of controls to help you. At the initial point of the graph there is a cursor, which can be moved using either the mouse, or the arrow keys. Key Left arrow Right arrow Note <Home> <End> Action moves cursor to the left. moves cursor to the right. To move the cursor in the big steps with the arrow keys, hold down <Ctrl>. moves the cursor at the starting point of the graph. moves the cursor at the end of the graph. <+> zooms in the entire graph. <-> zooms out the entire graph. To set the cursor at the location you want, click it with the mouse. The cursor readouts are shown at the bottom of the pane. All the information relative to the measurement is shown above the graph. At the right lower corner of the View page you can see the operating speed of the machine (if it have been measured, or entered with the keyboard), as well as the vibration overall level of the frequency band from the 10 Hz till upper cutoff. While viewing and analyzing the measurement data, you may enter text comments on the machinery state. 18 User's Guide Vibro 12 10. MENUS 10.1. THE FILE MENU Unload Hardware <F3> The command is used to unload measurement data from the DC12M into the Vibro 12 software. Prior to use it, connect the DC12M to PC with the RS-232 cable. The command displays the Communication Settings dialog (see Fig. 4.8) in which there are all instructions on how to unload data. The measurement data can be viewed and analyzed using the View panel. Exit The command to exit the program. 10.2. THE CONFIGURATION MENU New... <Ins> The command to create a new node in the database tree. The type of the node depends on your selection (where you are - on the group, machine, measurement point, or measurement). Into the group its a machine to add, into the machine its a point to add, and into the point its time to define measurement setups. The command display the New (Group/Machine/Point) dialog in which you need enter the name (mandatory) and comments (optional). The comments you entered will be shown at the View pane. Aside from that you may choose a picture in BMP, GIF, or JPG formats for showing at the View pane. It will be shown instead of information on the node contents. If you have selected a measurement point in the tree, the User Measurement Setups dialog will be displayed (See Fig. 4.5). Include in Route <F5> It adds the selected node to the route (which have to be created preliminarily). You may add a group, a machine, or a point. Note You may add to the route the nodes with no measurements configured and would configure them later. Copy/Paste The commands provide copying/moving of a node to another location within a database tree. You can copy to an appropriate node only (higher in hierarchy), for example, the point is copied to the machine, the machine to the group. The steps involved are as follows: 1. Select a node to copy. 2. Select the Copy command from the menu, or just press <Ctrl+Ins>). Vibro 12 User's Guide 19 3. Select a node to enter. 4. Select the Paste command from the Configuration menu, or press <Shift+Ins>). It brings to screen the Copy dialog which enables you to specify down what level you want to copy the selected node. The Delete Source option allows you to move the selected node to another tree location. Make your choice, and then click the Copy button. As a result of your actions, the copy will be entered the selected node. To do it with the mouse, 1. Select a node. 2. Drag it to another location within the tree, and drop it there. While dragging, the mouse cursor will be of help to you. If the node is available, it shows the blank page cursor, if not, the cursor is crossed with a line. 3. Make selections in the Copy dialog and click Copy. Delete <Del> Properties <F4> The command to delete a node after your confirmation. Use this command to edit properties of a node any time you want. For the group (machine, point) they are the name, comments and picture, then for the measurement they are measurement setups. The command displays the dialog with the previous data. 10.4. THE HELP MENU Contents About... Displays the Contents of the Help. Displays the software Copyrights.