1
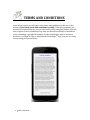
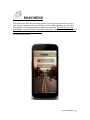
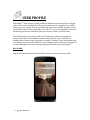
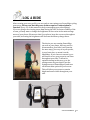
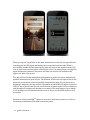
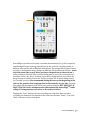
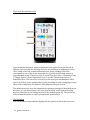
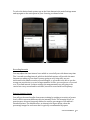
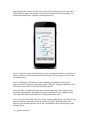
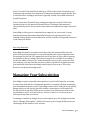
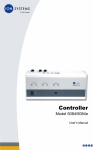
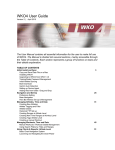
POWEREDGE for the Android User’s Manual Congratulations on your purchase of the PowerEdge® app. We hope that this powerful tool will help you achieve your fitness and training goals effectively. In this document, you will find a step-‐by-‐step guide for setting up your user profiles, logging and reviewing your rides, and getting the maximum performance out of your software. For more information on this and other products, visit our web site http://www.kinetic-‐edge.com ©2013-‐2014, Kinetic Edge LLC All rights reserved. Reproduction of any material in this User’s Manual is strictly prohibited. POWEREDGETM is a trademark of Kinetic Edge LLC. 2 USER’S MANUAL GETTING STARTED When you purchase and install your app from GooglePlay, the PowerEdgeTM icon will appear in your applications folder. When you launch PowerEdgeTM, you will be greeted by the welcome screen displaying the PowerEdgeTM logo. USER’S MANUAL 3 TERMS AND CONDITIONS In the initial screen, you will agree to the terms and conditions for the use of this software. Read these terms and conditions carefully. With this agreement, you assume full responsibility for your personal safety while using this product. You will have to agree to these conditions every time you launch PowerEdgeTM. In addition, you are bound by copyright laws and by all other distribution laws for software products. It is illegal to copy or distribute the PowerEdgeTM app. Now you are ready to start using your power meter. 4 USER’S MANUAL MAIN MENU The main menu offers the following options: (1) Using your power meter to log a ride, (2) reviewing the rides in your history, (3) creating, updating, or selecting a user profile, and (4) adjusting the settings on your phone. The first time you use PowerEdgeTM, you will need to begin by selecting the “Profile” button in the menu to enter the necessary rider information. You will not be able to log a ride without creating a user profile. USER’S MANUAL 5 USER PROFILE PowerEdgeTM allows you to create profiles for different users who will be using the same device and for multiple bicycles for the same user. For example, if you will be using your power meter on your road bike and your time trial bike, you may create two profiles named “Julie’s road bike” and “Julie TT” in your user profiles. If you will be sharing your device with Mark, then you can also create a profile for him. The default units for the user profile are US Customary, which use pounds for weight, miles and feet for distances, and seconds for time. If you would like to change these to metric units, you may do so under “Settings” in the main menu prior to creating your user profile. Please see the Settings section in this manual (page 20) for more information. Power is always displayed in Watts in any unit system. New Profile Tap on the New button in the User Profile screen to create a new user profile. 6 USER’S MANUAL Rider and Bike Information For each profile, first choose a name, then enter your weight, and then your bike’s weight by tapping on each of the text boxes. If you don’t know your bike’s weight, an easy way to get an accurate measurement is to weigh yourself holding your bike and then again yourself only and to take the difference. Threshold Power To complete your profile, you will need to enter the your power output, or wattage, at your lactate threshold1. This is the highest effort you can sustain for a substantial period of time. Tests that you can conduct with your PowerEdge power meter are one of the best ways to determine your threshold power. Power threshold determined in this way is easily and functionally translated into training intensity levels. If you know this value from earlier testing or rides, you may enter it by tapping on the threshold power window and typing it in. If you do not know it, please refer to the graphs in the “Measuring your Threshold Power” section (page 24) to obtain an estimate based on your weight, gender, and current cycling fitness. If, instead, you 1 Determining your threshold power precisely may be carried out by a testing protocol in a laboratory, which involves blood sampling. These tests are invasive, costly, and unnecessary for the vast majority of cyclists. USER’S MANUAL 7 will be performing one of the threshold tests discussed in that section, leave it in the default setting until you carry out these test rides. (This will not affect any of your test results). The default threshold power value is set at 150 Watts. Tire Pressure Enter the tire pressure that you normally set for that bike. Advanced Settings: Aerodynamic Drag Coefficients PowerEdge uses sophisticated formulae to calculate your aerodynamic drag coefficients using the information you entered and your position on the bike. It also determines the coefficient of rolling friction for your bike based on its weight and the tire pressure you entered. However, there are two advanced features in the profile menu that you can also adjust manually if and only if you have independent measurements of your frontal surface area, drag coefficients, and/or the coefficient of rolling friction for your bike. You may do so by tapping on the CdA and CR tabs at the bottom of the profile menu. If you don’t know these quantities independently, the software will automatically adjust to your personal values using the information you just entered and you should not change these. 8 USER’S MANUAL You may manually adjust your CdA coefficient per ride position. Click on “Norm” to update this coefficient for your upright riding position, and then drag the button on the bar to the chosen value. Similarly, tap on “Drop” to enter it for the coefficient on the drop bars (on a road bike), and “Aero” to adjust it for the position on aerobars. Each of these entries will be saved on your profile. Similarly, you may manually adjust your CR coefficient by tapping on the CR tab and dragging the button on the bar to the desired value. If you have chosen custom values for CdA and/or CR and subsequently update your weight or your tire pressure, you will be prompted to choose whether to keep using the custom CdA and CR values you entered or to change them according to the new weight or pressure information. If you answer “Yes”, the program will recalculate your appropriate coefficients based on its own algorithm and use these values. If you answer “No”, it will keep the custom values you entered. PLEASE NOTE: If you change the CdA and/or CR by mistake, you can revert to the correct values simply by re-‐entering your weight (for CdA) and the tire pressure for your bike (for CR). You are now all set for your first ride! USER’S MANUAL 9 Choosing a Profile: If you have created multiple user profiles, select the one you would like to use before any ride by clicking on the name of that profile and choose “Select”. The check mark appearing next to the name of that profile verifies that it is the one selected for the current ride. Editing or Deleting a Profile: You may update the information you entered into your user profile(s) at any time by tapping on the name of the profile you wish to change and choosing “Edit”. At that point, you may re-‐enter any of the information appearing on that screen. Click the “Save” button at the bottom of the screen after making any adjustments. You may also delete a profile you no longer need by tapping on the name of that profile, choosing the “Delete” function, and confirming your choice in the dialogue box. 10 USER’S MANUAL LOG A RIDE After creating your user profile, you are ready to start using your PowerEdge cycling power app. Please note that the power feature requires a subscription to function. (See p. 23 of this manual for help on managing your subscription). If you are going to be viewing power data during the ride, for better visibility of the screen, you may want to change the brightness of the screen in the main settings menu of your phone. Please note that if you plan to keep the screen on throughout your ride, increasing the brightness will decrease the battery charge faster. The device you are running PowerEdge on, such as your phone, does not need to be mounted on your bike. It will function the same way if you carry it in your pocket, in your bento box, or mount it on the handlebars. If you choose to mount it, you will be able to see your power in real time throughout your ride. To allow for optimal viewing in this case, go to the settings menu on your device (not the Settings menu of PowerEdgeTM) and turn off the auto-‐dim option for your screen. This will allow your screen to remain bright and most visible throughout your ride. USER’S MANUAL 11 When you tap on “Log a Ride” in the main menu shown on the left, the app will start searching for the GPS signal and display the screen shown on the right. When it successfully obtains GPS information, the main ride screen will appear and the GPS icon on that screen will be visible with the blue color. If it cannot locate a strong GPS signal within three minutes, the search will time out and the GPS indicator will appear red with a line across. The app will also obtain atmospheric information as well as the three-‐dimensional position information of your bicycle. The AIR and TOPO icons will appear blue in the main ride screen when it has successfully obtained these data. If your phone has a barometric altimeter, the app will use this and the word BARO will appear instead of TOPO. If any of these icons are red, it will indicate an unsuccessful or lost connection and the app will continuously attempt to reconnect. This may happen if your phone is out of range of a telecommunications tower or if you are enclosed in places such as tunnels. Please note that PowerEdgeTM cannot be used on a stationary trainer as it relies on the moving coordinates of the bike to measure power. 12 USER’S MANUAL TM PowerEdge provides an accurate, real-‐time measurement of a cyclist’s output by considering all forms of energy expenditure by the cyclist in a varying terrain, at different ride speeds, and at different wind speeds. The energy that a cyclist loses to air (due to aerodynamic drag) changes at different ride positions on the bike. At the top of the main ride screen, there are three ride positions to choose from. If you are riding a time trial bike or will be doing most of your ride on aerobars on a road bike, choose the “Aero” position. If you will be doing most of your ride in the drops on your road bike, choose the “Drops” position. For all other riding, choose the “Normal” position. We recommend setting this once at the beginning of the ride for the position that is appropriate for the majority of your ride. You may also adjust this throughout your ride if your position changes, BUT ONLY IF IT IS SAFE TO DO SO! Never attempt to enter information into PowerEdgeTM while riding, if it compromises your safety or the safety of others. Tapping the “Start” button will start recording your ride data. Once you start recording, the buttons at the bottom of the screen will become “Pause”, “Lap” and “End” as shown on the screen above. USER’S MANUAL 13 The Power Box and Power Bar Your instantaneous power output is displayed in the upper box on the screen. In addition, you can track the intensity level you are training at by making use of the color-‐coded power bar located underneath your power reading. Each color corresponds to one of the power zones that are typically defined with respect to your threshold power. These are: Zone 1: Active Recovery; Zone 2: Endurance; Zone 3: Tempo; Zone 4: Lactate Threshold; Zone 5: Aerobic Threshold; and Zone 6: Anaerobic effort. The bar will be colored up to the zone your instantaneous effort level is at (Zone 4 in the example above), thus providing an easy visual gauge of your effort level in addition to the numeric value displayed on your screen. The default zones are set at the commonly accepted percentages of threshold power. However, you can also adjust or fine-‐tune your intensity levels from the Settings menu, as described in the Settings section of this manual (page 20). The power bar will automatically adjust to reflect your personal power zones. The Speed Box Your instantaneous speed will be displayed in the speed box below the power bar. 14 USER’S MANUAL Pause PowerEdgeTM is equipped with an auto-‐stop detection feature. You do not need to pause your power meter for intermittent stops on a ride, such as red lights, hydration breaks, etc. These stops will be automatically removed from your averages (unless you choose to disable the auto-‐stop detection function in the Settings menu). However, if you wish to pause the software or the recording manually for part of your ride or for any break, you can do so by tapping the “Pause” button at the bottom of the screen. When you are ready to resume your ride, simply tap the “Resume” button at the bottom of the screen. Note that PowerEdgeTM will not start on its own after a rider manually places it on “Pause”; it is necessary to resume the program. Laps For training that involves different effort levels during a ride or to perform interval training, it is useful to record parts of your ride as different laps. PowerEdgeTM allows you to do this by tapping on the “Lap” button located at the bottom of your screen during your ride. The “Lap” feature will record the time interval, the distance, and the power expended each time you hit the “Lap” button as separate segments. End When you are done riding, simply tap the “End” button. This will take you to a screen displaying the summary. At the same time, the entire data for your ride will be saved in a file that has the date and time of your ride. USER’S MANUAL 15 Finish The summary screen displays all the stats for the ride, including the total ride time, the total distance, average speed, elevation gain, and the average power. On this screen, you have the option of finishing and saving your ride by tapping on the “Finish” button. Note that if you exit from this screen without any further action, the file is automatically saved and added to your ride log. Share You can use the “Share” button to upload the highlights of your ride on social media to share with your friends. You can also share the file containing all of your power and ride data by sending an email to yourself or to any other address of your choice, so you may upload it to an analysis software or any website you use to keep track of your training. The files are in the standard Garmin TCX format that is recognized by most analysis software currently on the market. Delete If you do not wish to save the ride you just completed for any reason, then you can also choose to delete it at this point by tapping on the “Delete” button located at the bottom of the screen. You will be prompted to confirm this selection if you choose to delete the file. Please note that deleting is an action that cannot be undone. 16 USER’S MANUAL PowerEdge also gives you the option to view your rides as a graph and on map. By tapping the “Map” button above the ride stats, you can view your ride traced out on a map. “Graph” option displays the power output throughout the entire ride against the ride time, color coded based on the power zone you were in at each moment so you can easily see what you achieved in your training at a glance. USER’S MANUAL 17 REVIEW YOUR RIDES 18 USER’S MANUAL You can access the summary of your rides and the saved files at any time by tapping on the “Review Your Rides” button in the main menu. This will take you to the screen shown on the right, which has a list of your logged rides. Your ride history will keep up to 20 rides. After that point, it will indicate that there is no more storage space to record new rides. We suggest that you download older rides you want to save into a training analysis software or website or keep the TCX files on a separate storage device. When you tap on the particular ride you would like to review, it will take you to the same summary screen that was shown at the end of that ride. This will have the total time, the total distance, the average speed, and the average power for the ride, as well as the map screen option and the graph displaying your power output throughout that ride colored according to different power zones. At any point, you still have the option of sharing or deleting the ride files. USER’S MANUAL 19 SETTINGS There are a number of features you can control using the Settings button on the home menu. These include the system of units you use to display your ride metrics, the recording intervals, the exercise intensity levels, the auto-‐stop detection feature during your ride. You can also manage your monthly subscription by connecting to Google Wallet through this menu. Units PowerEdge allows you the option of choosing the system of units you would like to use when running the program. In US customary units, the distances are measured in miles and feet, the weights are in pounds, and the time is in seconds. In the metric units, the distances are in meters and kilometers, the weights are in kilograms, and the time is in seconds. In both cases, the power output is calculated and displayed in Watts. 20 USER’S MANUAL To select the desired unit system, tap on the Units button in the main Settings menu and tap again on the unit system of your choosing, as shown below. Recording Intervals You may adjust the time interval over which to record all your ride data at any time. The 1 second recording interval, which is the default option, will provide the most frequent recording of your data. If you are going on very long rides, are not interested in the small second-‐to-‐second changes, or you want to be able to use the storage on your device to record a larger number of rides, you can choose a 5 second or a 10 second interval. In these settings, the measurements are still going to be carried out every second and in real time, but will be saved with less frequency. Exercise Intensity Levels You will get the most benefits from power training by training at a variety of power levels, which represent different exercise intensity levels. The intensity levels, or power zones, are most frequently defined at various percentages of the athlete’s threshold power. The default values, as shown in the figure below, show the percentage ranges for each zone that is typically recommended by sports USER’S MANUAL 21 physiologists and coaches. Please refer to the power training section at the end of this manual for more information on the power intensity levels, measuring your lactate threshold power, and other training resources. Level 1: Active Recovery: Performed to recover from hard workouts, to cool down after a workout, or between interval efforts. Power is below and up to 55% of the threshold power. Level 2: Endurance: This zone is used for building an endurance base and to improve aerobic fitness. It is the typical power range for “long slow distance” rides. The power zone is 56%-‐75% of the threshold power. Level 3: Tempo. A tempo ride feels faster than an endurance ride, requires more work and concentration, and builds muscular endurance. Power range between 76% and 90% of the threshold power is the typical tempo zone. Level 4: Lactate Threshold. This zone covers a power range that is just below to just above an athlete’s threshold power, from 90% to 105%. Training in this zone improves the threshold power. Focus and considerable effort are required in this intensity level. 22 USER’S MANUAL Level 5: Aerobic Threshold. Performed up to 120% of the lactate threshold power. Training at this intensity level improves VO2max, the maximum oxygen uptake. Due to the hard effort, training in this zone is typically carried out in short intervals of around 5 minutes. Level 6: Anaerobic Threshold. Any training intensity that exceeds 120% of the threshold power is the anaerobic threshold zone. Training at this intensity is characterized by short, intense efforts that cannot be sustained for longer periods of time. PowerEdgeTM allows you to customize these ranges if you, your coach, or your health professional determines that different zones are appropriate for your training. Simply drag the control button for each level with your fingertip to adjust it to the value you choose. Auto Stop Detection PowerEdge has an auto stop detection feature that will automatically sense the point when you bring the bike to a stop and eliminate the stopped segments from the averages for the ride. This means that you do not have to worry about pausing the software or the recording when you are stopped at a red light or are taking a break from riding. However, for certain situations, such as a race, where the total time matters, or at any time that you do not wish to exclude the stopped intervals, you can disable this feature by simply unselecting the box next to “Auto Stop Detection” in the main Settings menu. Managing Your Subscription PowerEdge requires a monthly subscription to work in its full capacity, accessing the necessary data and the aerodynamic models to accurately calculate and display your instantaneous power output. PowerEdge comes with a 30-‐day free trial period, during which you can use the app fully without a subscription. At the end of the 30-‐day period, Google Play allows you to continue your subscription without any inconvenience to you. You can, however, choose to cancel or to reactivate your subscription any time you choose. To manage or make any changes to your subscription, go to the Settings menu and choose “Manage Subscription”, which will connect you to Google Wallet where you can manage all the details of your account. USER’S MANUAL 23 If you do not have an active subscription, you can still use PowerEdge as a full cycling computer, which displays all the metrics except for power. In this case, when you choose “Log A Ride” in the main menu, you will see the following dialog screen, which allows you to either start your free trial (if you haven’t already used your 30-‐ day period) or to proceed without power. You can also tap on the “Start Free Trial” button to reactivate your subscription through Google Play. When you use PowerEdge as a cycling computer, your main ride screen will display ride time, current speed, total distance, maximum and average speeds, as well as the calories burned, as shown in the next page. 24 USER’S MANUAL Your ride summary will display the following information: total time, total distance, average speed and total calories burned during the ride. This screen will still give you the option of viewing your ride on a map. However, the graph button, which displays the power graph, will be disabled. USER’S MANUAL 25 TRAINING WITH POWER Power measurement is an increasingly more important training tool for cyclists at all levels of fitness. It serves as a quantitative metric of fitness, a device to track training progress and analyze race performance, as well as a tool to devise and follow strategies in cycling events. Cyclists use readings from a power meter to establish training intensities. All athletes, professionals and amateurs alike, know the benefits of training at different intensity levels. Some days are meant for longer easier rides, aimed at increasing endurance, teaching the body to burn fat, and increasing aerobic fitness. Other days require hard effort, which increase the body’s ability to remove lactate more effectively, to make us faster, and fitter. But how do we know the true intensity of our training? A power meter is the gold standard in measuring the true effort of an athlete. It provides an accurate and objective measure of the instantaneous effort level. Contrary to perceived exertion methods or heart rate monitors, which can show day-‐to-‐day variations due to differences in tiredness levels, outside temperature, and many other factors, a power measurement remains precise and objective. A power meter gives you real time feedback on how hard you are actually working. It can be used as a valuable pacing tool for a wide variety of event types and distances. A power meter is not only for the competitive athlete or for hard training days. On the contrary, a power meter can help any cyclist stay within desired intensity levels, which are important on recovery days, for weight loss programs, and for any amateur looking to improve their fitness. It can help pace any ride or race so that valuable energy is not used up too fast. PowerEdge can help you enjoy any ride more by allowing you to maintain an optimal pace. Measuring your Threshold Power Your training zones are determined based on your threshold power. For this reason, you will need to enter your threshold power in your user profile. There are numerous physiological definitions of threshold power, but for practical purposes, it is the power level you can maintain during a sustained hard effort. Here, we will present some practical methods to determine your threshold power. For more detailed discussions, additional methods, and training strategies, we refer you to Training and Racing with a Power Meter by Hunter Allen and Andrew Coggan or other resources. 26 USER’S MANUAL The threshold power that a rider produces changes based on fitness level, body weight, gender, and age. We provide below two charts, for men and women, that allow you to estimate your threshold power based on your current cycling fitness level and your weight. These are intended to provide a good starting point for the “Power Threshold” in your profile, which can be updated at any time. USER’S MANUAL 27 In these charts, find the curve that best describes your current cycling fitness level, using the guide below: Beginner Cyclist: Any rider who is just starting cycling specific training and on average rides 1-‐2 times/week. Intermediate Cyclist: A cyclist who has a period of training under their belt, some racing experience and rides 2-‐3 times/week. Advanced Cyclist: A cyclist who trains and competes on a regular basis, and rides on average 3-‐4 times/week. Elite cyclist: A highly trained cyclist who is the equivalent of a Category II rider in USA Cycling and rides 4-‐6 times/week. 28 USER’S MANUAL On the curve that best describes your cycling level, find the number that corresponds to your body weight. As an example, a 170 lb male cyclist, who is in the intermediate category will determine a threshold power of 180 Watts. A 130 lb female in the advanced category will find her threshold power to be 165 Watts. This is your current threshold power. If your fitness level falls somewhere between these categories, you can also use a value that is between those numbers for your body weight. A second method to determine your threshold power is by performing a threshold test. A simple but robust one your can perform with your PowerEdgeTM is the following. To perform the test, you will need to pick a relatively flat, uninterrupted 10 mile stretch of road, preferably without stop lights or signals. The procedure for this test comprises the following steps: 1. Turn on PowerEdgeTM and select your user profile 2. Choose “Log a Ride” but do not press the “Start” button 3. Warm up 15 minutes easy on a flat road 4. Press “Start” to begin your testing segment, which will record your power data 5. Ride at a sustainable, consistent, hard pace for 30 minutes or 10 miles, whichever comes first 6. Press “End” at the end of the test segment to complete your ride 7. Cool down for 15 minutes 8. Review your ride, taking note of your average power for the test segment. You may do this on your phone or by analyzing the ride file on a power training software or website. The average power for the test segment is your threshold power. Note: Beginner cyclists may decrease the warm-‐up to 10 minutes and the consistent hard pace segment of the test to 5 miles or 20min. You may use any one of these methods to determine your threshold power and enter it into your user profile. Remember that you may change or update this number at any time in your profile as your training progresses, your fitness improves, or as you repeat any one of these tests. You may also adjust them if the training levels based on your threshold power do not feel right, such as having to work very hard to keep up an endurance ride (up to 75% of your threshold power) or being able to sing loudly during an aerobic threshold interval. Finally, your coach or a training/analysis software that you use can determine or finesse your threshold power based on rides you record and upload with PowerEdgeTM. From all of us at Kinetic EdgeTM, we wish you happy training with PowerEdgeTM! USER’S MANUAL 29 THE SCIENCE OF POWEREDGE The Technology PowerEdgeTM is based on a breakthrough, patent-‐pending method of precisely measuring a rider’s instantaneous power using a GPS device, a telecommunications network, weather information, and a pioneering algorithm. The power output is calculated by balancing the various forms of energy input and expenditure on the system consisting of the rider and the bicycle. The calculation of the different forms of energy input and expenditure is carried out using data related to the time-‐dependent, three-‐dimensional position of the bicycle as well as additional information related to the bicycle, the rider, and to the current atmospheric conditions. All aspects of power consumption, from the gradient of the road to the energy lost to the air due to aerodynamic drag at any wind speed and air temperature, from the friction in the bicycle to the power required to accelerate, are accurately calculated in real time using the most advanced measurement techniques, mathematical formulae, and latest physiology research. Performance and Comparisons with other Power Meters Contrary to simple power calculations that are widely available but inaccurate, PowerEdgeTM does not simply use instantaneous data to estimate power. Instead, it uses an integrated work profile of the ride and applies advanced regression algorithms to calculate the power output of the rider very accurately. It also takes into account varying weather conditions, such as the wind and the atmospheric pressure in real time, accounting for these precisely in the power calculation. PowerEdgeTM performs with high accuracy under all conditions, when there is a GPS signal and a network connection present. Its performance does not degrade with ambient temperature or conditions. PowerEdge does not require any calibration by the user or at a service center, prior to the first use or at any time afterwards. It does not burden the user with the maintenance of any mechanical parts. 30 USER’S MANUAL PowerEdgeTM has been tested extensively against a variety of calibrated mechanical power meters under many road and environmental conditions. Testing was carried out over several thousand miles of varying terrain. The graph above shows a typical comparison between the power readings obtained simultaneously with PowerEdgeTM with a barometric altimeter and a mechanical power meter. PowerEdgeTM captures the rapid changes in the rider’s output such as when coming to a stop, climbing, or coasting downhill. Moreover, the average power obtained with PowerEdgeTM and the other power meters in numerous tests differ by less than 3% over the entire ride. This typical example shows that, during this hour-‐long ride, PowerEdgeTM measured the average power of this rider to be 177 W by while Cycleops obtained an average of 175 W. The difference between these two readings is 1.1%, which is a typical performance for PowerEdge. USER’S MANUAL 31