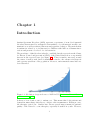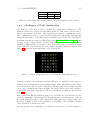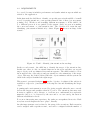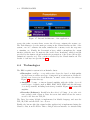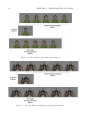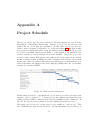
1
Masters’ Degree in Informatics Engineering
Dissertation
A Virtual Reality Application
with a Brain-Computer Interface
for Rehabilitation of Social
Development in Autism
Marco António Machado Simões
[email protected]
Advisors:
Professor Miguel Castelo-Branco
IBILI - Institute for Biomedical Research in Light and Image
Professor Paulo de Carvalho
DEI - Department of Informatics Engineering
July 15, 2011
Acknowledgments
I hereby acknowledge the guidance provided by both of my supervisors, Professor
Miguel Castelo-Branco and Professor Paulo de Carvalho. Their time and advices
were have a fundamental importance in this work.
I show my gratitude to Gabriel Pires, from who I gather much insight on BrainComputer Interfaces. I thank his availability and care.
To my colleague Carlos Amaral, who worked with me in some parts of the project,
and to João Castelhano, who was always available and guide me through the EEG
acquisitions, my sincere thanks.
Susana Mouga was my bridge to autism. My insights on that matter would not
be half they are without her. In the same area, I acknowledge Professor Doctor
Guiomar Oliveira and Doctor Frederico Duque, who gave me the opportunity to
follow some autism child assessments in the Pediatric Hospital of Coimbra.
To all the participants in my experiments, either in the Encephalography or in the
usability testing. Your contribution made this project possible.
I thank my friends, especially the ones from DEI, for the nights of work and the
times of joy, and the ones from IBILI, for the help, the lunches and the coffees.
I leave a very special thank to my family, who grabbed me every time I fall and give
me the support to carry on. As important as Andreia Gomes, whose continuous
care helped me not to fall.
i
Abstract
The Autism Spectrum Disorders (ASD) have gained an important focus of the society in the last two decades. The number of studies about diagnosis and treatments
have grown significantly from the 1980s. The main deficits in autism are related
to social development. Children with Autism Spectrum Disorders avoid human
interactions and present a low level of social attention.
There is no cure for autism, but interventions on this subjects, if started in youth, can
be effective on increasing their quality of life as well as of their families. Although,
it is usually hard for the psychologists to do interventions on this subjects, because
establishing influence over these children is an often difficult first step where human
interaction can be so disruptive that learning is not possible. Another characteristic
of these subjects is related to their preference to computer interactions. These
children respond well to structure, explicit, consistent expectations and challenge
provided by computers.
This dissertation presents a Virtual Reality application which stimulates a social
skill not normally developed in autism, the joint attention. The Virtual Reality
has several characteristics which make it a strong opportunity to explore for autism
interventions. The system uses also a Brain-Computer Interface (BCI) which monitors the user’s attention to the requested visual targets. Therefore, the application
forces the user to focus on the desired social stimuli, which we believe can improve
the quality of the rehabilitation.
Some EEG classification algorithms are studied and a new approach is implemented
and validated over the state of the art methods, with a lower, but yet reasonable,
success rate.
Keywords
Autism Spectrum Disorders, Joint Attention, Virtual Reality, Brain-Computer Interface, EEG, Event-Related Potentials, P300.
iii
Contents
1 Introduction
1.1 Problem Definition . . . . . . . . . . . . . . . . . . . . . . . . . . . .
1.2 Objectives . . . . . . . . . . . . . . . . . . . . . . . . . . . . . . . . .
1.3 Structure of the Report . . . . . . . . . . . . . . . . . . . . . . . . . .
1
2
3
3
2 Clinical Context
2.1 Autism Spectrum Disorders . . . . . . . . . . . . .
2.1.1 Main Characteristics . . . . . . . . . . . . .
2.1.1.1 Social development deficits . . . .
2.1.1.2 Communication . . . . . . . . . . .
2.1.1.3 Repetitive and Restricted Behavior
2.1.2 Treatment . . . . . . . . . . . . . . . . . . .
2.2 Joint attention . . . . . . . . . . . . . . . . . . . .
2.3 Conclusions . . . . . . . . . . . . . . . . . . . . . .
.
.
.
.
.
.
.
.
5
5
5
6
6
6
7
7
8
.
.
.
.
.
.
.
.
.
.
.
.
.
.
.
.
.
9
9
10
11
11
12
12
13
15
15
16
16
17
18
20
20
21
21
.
.
.
.
.
.
.
.
3 State of Art
3.1 Virtual Reality in Autism . . . . . . . . . . . . . . .
3.1.1 Motivation . . . . . . . . . . . . . . . . . . . .
3.2 Brain-Computer Interfaces . . . . . . . . . . . . . . .
3.2.1 Types of BCI . . . . . . . . . . . . . . . . . .
3.2.1.1 BCI Neuromechanisms . . . . . . . .
3.2.1.2 Electroencephalography (EEG) . . .
3.2.1.3 Event-Related Potentials (ERP) . . .
3.2.1.4 P300 elicited by an oddball paradigm
3.3 P300 BCI in Virtual Environments . . . . . . . . . .
3.3.1 Stimulus design techniques . . . . . . . . . . .
3.4 P300 detection . . . . . . . . . . . . . . . . . . . . .
3.4.1 Challenges of P300 classification . . . . . . . .
3.4.2 Signal Pre-processing . . . . . . . . . . . . . .
3.4.3 Feature Extraction/Selection . . . . . . . . . .
3.4.4 Classification . . . . . . . . . . . . . . . . . .
3.5 Research Challenges . . . . . . . . . . . . . . . . . .
3.6 Conclusions . . . . . . . . . . . . . . . . . . . . . . .
.
.
.
.
.
.
.
.
.
.
.
.
.
.
.
.
.
.
.
.
.
.
.
.
.
.
.
.
.
.
.
.
.
.
.
.
.
.
.
.
.
.
.
.
.
.
.
.
.
.
.
.
.
.
.
.
.
.
.
.
.
.
.
.
.
.
.
.
.
.
.
.
.
.
.
.
.
.
.
.
.
.
.
.
.
.
.
.
.
.
.
.
.
.
.
.
.
.
.
.
.
.
.
.
.
.
.
.
.
.
.
.
.
.
.
.
.
.
.
.
.
.
.
.
.
.
.
.
.
.
.
.
.
.
.
.
.
.
.
.
.
.
.
.
.
.
.
.
.
.
.
.
.
.
.
.
.
.
.
.
.
.
.
.
.
.
.
.
.
.
.
.
.
.
.
.
.
.
.
.
.
.
.
.
.
.
.
.
.
.
.
.
.
.
.
.
.
.
.
.
4 VR Application for Autism
23
4.1 Objectives . . . . . . . . . . . . . . . . . . . . . . . . . . . . . . . . . 23
v
vi
CONTENTS
4.2
4.3
4.4
4.5
4.6
4.7
4.8
4.9
Requirements . . . . . . . . . . . .
4.2.1 System-wide Requirements .
Architecture . . . . . . . . . . . . .
4.3.1 Internal Architecture . . . .
Technologies . . . . . . . . . . . . .
Database . . . . . . . . . . . . . . .
Design . . . . . . . . . . . . . . . .
Implementation . . . . . . . . . . .
Tests . . . . . . . . . . . . . . . . .
4.8.1 Unit Testing . . . . . . . . .
4.8.2 Functional Testing . . . . .
4.8.3 Synchronization Testing . .
4.8.3.1 The portable setup
4.8.4 Usability Testing . . . . . .
Conclusions . . . . . . . . . . . . .
.
.
.
.
.
.
.
.
.
.
.
.
.
.
.
.
.
.
.
.
.
.
.
.
.
.
.
.
.
.
.
.
.
.
.
.
.
.
.
.
.
.
.
.
.
5 Experimental Analysis
5.1 Preliminary Experiments . . . . . . . . .
5.1.1 Results . . . . . . . . . . . . . . .
5.2 Project Experiments . . . . . . . . . . .
5.2.1 Protocol . . . . . . . . . . . . . .
5.2.2 EEG Montage . . . . . . . . . . .
5.3 Signal Processing and Classification . . .
5.3.1 Proposed Methods . . . . . . . .
5.3.2 Signal Filtering: Common Spatial
5.3.3 Tests and Results . . . . . . . . .
5.3.3.1 Our dataset . . . . . . .
5.4 Conclusions . . . . . . . . . . . . . . . .
.
.
.
.
.
.
.
.
.
.
.
.
.
.
.
.
.
.
.
.
.
.
.
.
.
.
.
.
.
.
.
.
.
.
.
.
.
.
.
.
.
.
.
.
.
.
.
.
.
.
.
.
.
.
.
.
.
.
.
.
.
.
.
.
.
.
.
.
.
.
.
.
.
.
.
.
.
.
.
.
.
.
.
.
.
.
.
.
.
.
.
.
.
.
.
.
.
.
.
.
.
.
.
.
.
.
.
.
.
.
.
.
.
.
.
.
.
.
.
.
.
.
.
.
.
.
.
.
.
.
.
.
.
.
.
.
.
.
.
.
.
.
.
.
.
.
.
.
.
.
.
.
.
.
.
.
.
.
.
.
.
.
.
.
.
.
.
.
.
.
.
.
.
.
.
.
.
.
.
.
.
.
.
.
.
.
.
.
.
.
.
.
.
.
.
.
.
.
.
.
.
.
.
.
.
.
.
.
.
.
.
.
.
.
.
.
.
.
.
.
.
.
.
.
.
.
.
.
.
.
.
.
.
.
.
.
.
.
.
.
23
26
27
28
29
31
31
34
35
35
35
35
37
37
41
. . . . .
. . . . .
. . . . .
. . . . .
. . . . .
. . . . .
. . . . .
Patterns
. . . . .
. . . . .
. . . . .
.
.
.
.
.
.
.
.
.
.
.
.
.
.
.
.
.
.
.
.
.
.
.
.
.
.
.
.
.
.
.
.
.
.
.
.
.
.
.
.
.
.
.
.
.
.
.
.
.
.
.
.
.
.
.
.
.
.
.
.
.
.
.
.
.
.
.
.
.
.
.
.
.
.
.
.
.
.
.
.
.
.
.
.
.
.
.
.
.
.
.
.
.
.
.
.
.
.
.
.
.
.
.
.
.
.
.
.
.
.
.
.
.
.
.
.
.
.
.
.
.
43
43
47
48
48
50
51
51
52
53
55
61
6 Conclusions and Future Work
63
Bibliography
65
Appendixes
69
A Project Schedule
71
B Project Documentation
75
B.1 Requirements Specification . . . . . . . . . . . . . . . . . . . . . . . . 75
List of abbreviations
ADHD . . . . . . . . . . .
ASD . . . . . . . . . . . . .
BCI . . . . . . . . . . . . . .
CAR . . . . . . . . . . . . .
CSP . . . . . . . . . . . . .
EEG . . . . . . . . . . . . .
ERP . . . . . . . . . . . . .
ERS/ERD . . . . . . .
FLD . . . . . . . . . . . . .
fMRI . . . . . . . . . . . .
IO . . . . . . . . . . . . . . .
ISI . . . . . . . . . . . . . . .
LAT . . . . . . . . . . . . .
ORM . . . . . . . . . . . .
PCA . . . . . . . . . . . . .
SCP . . . . . . . . . . . . .
SD . . . . . . . . . . . . . . .
SNR . . . . . . . . . . . . .
SQL . . . . . . . . . . . . .
SWLDA . . . . . . . . .
TCP/IP . . . . . . . . .
VE . . . . . . . . . . . . . .
VEP . . . . . . . . . . . . .
VR . . . . . . . . . . . . . .
Attention Deficit / Hyperactivity Disorder
Autism Spectrum Disorders
Brain-Computer Interface
Common Average Reference
Common Spatial Patterns
ElectroEncephaloGraphy
Event-Related Potentials
Event Related Synchronization and Desynchronization
Fisher Linear Discriminant
functional Magnetic Resonance Imaging
Input/Output
Inter-Stimulus Interval
Local Average Technique
Object-Relational Model
Principal Component Analysis
Slow Cortical Potentials
Stimulus Duration
Signal-to-Noise Ratio
Structured Query Language
Step-Wise Linear Discriminant Analysis
Transmission Control Protocol / Internet Protocol
Virtual Environment
Visual Evoked Potentials
Virtual Reality
vii
Chapter 1
Introduction
Autism Spectrum Disorders (ASD) represent a spectrum of neurodevelopmental
disorders characterized by widespread abnormalities of social interactions and communication, as well as restricted interests and repetitive behavior. The main deficits
in autism are related to social interaction. Children with ASD avoid human interactions and present a low level of social attention.
The prevalence of this disorders is hard to establish, but the reports from the Center
for Disease Control and prevention (CDC) of the United States show a exponential
increase in the reported cases (see figure 1.1). There is much controversy around
the causes of such growth, but it is usually associated to the advances in diagnosis
and a greater awareness of the population. However, environmental causes have not
been discarded.
Figure 1.1: Evolution of reported cases of ASD in US (Centers for Disease Control
and Prevention, 2011)
It has not been found a cure to autism, yet. This means that both patients and
bystanders must change their lives to adapt to this circumstances. Having no cure,
the therapies gain focus. Studies have shown several improvements in patient’s
quality of life related to some therapies, especially if started in youth. However,
1
2
CHAPTER 1. INTRODUCTION
it is usually hard for the therapists to do interventions on these subjects, because
establishing influence over these children is an often difficult first step, where human
interaction can be so disruptive that learning is not possible. But, on the other
hand, these children respond well to structure, explicit, consistent expectations,
and challenge provided by computers. Some studies have also reported better results
using computers as learning aids instead of humans (Chen and Bernard-Opitz, 1993;
Plienis, 1985).
The above facts suggest that a computer application that trains social skills in
children with ASD might be effective in those subjects’ rehabilitation and increase
their quality of life, as well as of their bystanders.
1.1
Problem Definition
The aim of the project consists of the creation of a system to rehabilitate social
skills of children with ASD. The rehabilitation process will focus on the lack of joint
attention in these children. Joint attention is a social interaction in which two people
use gestures and gaze to share attention with respect to a third object or element
of interest (Charman, 2003).
This system will be composed by input sensors that are able to capture EEG, a
virtual reality environment to stimulate the patient according to predefined diagnosis
and/or treatment protocols, and a monitoring module that is composed of EEG
analysis algorithms able to detect and classify diagnosis features from the EEG
captured by the system.
The use of virtual reality techniques aids in learning through generalization of the
simulated actions, for an easier application to real life situations. Therefore, the
application must simulate a realistic social environment where the user interacts
with realistic virtual human characters.
The application shall train the user in two specific tasks of joint attention:
1. Detect and identify joint attention clues;
2. Follow joint attention clues, identifying the targets of the clues.
Being the goal of the application training attention to specific visual stimuli, the
interaction mechanism between the users and the application should be related to the
attention payed to the visual stimulus. Therefore, a Brain-Computer Interface (BCI)
can help in identifying the attention to the targets and perform the communication
between the user and the application.
A brain-computer interface is a direct communication pathway between the brain
and an external device. The system uses an Electroencephalography (EEG) to read
the brain electrical activity and then tries to interpret these signals, usually through
machine learning algorithms. A deeper explanation of this methods can be found
on chapter 3. The design of the stimulus represents a challenge: thus BCI methods
have never been tested using high-level avatars movements. The state of the art
1.2. OBJECTIVES
3
approaches (even those under virtual reality environments) only use static low-level
stimulus, normally by flashing images or characters.
Concluding, the project combines virtual reality stimuli design techniques, neurophysiological methods, real-time signal processing and machine learning techniques
to develop a biofeedback system that can be used in ASD patients in order to
rehabilitate its social skills.
1.2
Objectives
The project aggregates three main areas of work:
1. A Software Engineering component, applied in the development of the BCI
system and the Virtual Reality application. This component explores the
different phases of the development of a software application and validates the
technical competences acquired in the course;
2. A Research component, applied in the comparison of different algorithms for
BCI classification existing in the literature;
3. A Clinical component, applied in the neurological results comparison of ASD
patients and normal subjects when subjected to social stimuli. This clinical
study falls off the ambit of an Informatics Engineering thesis and will be only
slightly referenced in this document.
This is an interdisciplinary work, typically broad in clinical informatics. A challenge
by the combined application of Informatics Engineering and Neurosciences.
1.3
Structure of the Report
This report is constituted by six chapters. The first chapter is the introduction,
where the problem was stated with its motivation, and the work schedule was presented. The second chapter contains a clinical context of the Autism Spectrum
Disorder. In this chapter, there is a special focus on the joint attention and its
importance in this disorder. The third chapter presents the State of the Art of
the BCI techniques, Virtual Reality applications combined with BCI for autistic
subjects. This chapter focus especially the current classification techniques used to
address the problem of interest in this dissertation. A fourth chapter is entirely
dedicated to the software application. It shows the requisites, the architecture, the
hardware and software used, the design of the system, the construction and the
tests of the application; The fifth section presents the experimental analysis with a
detailed description of the preliminary test for the stimuli creation and the study of
P300 classification, comparing the state of the art solution and our novel ideas; the
conclusion makes a wrap of the project and presents the future work.
4
CHAPTER 1. INTRODUCTION
The technical details of the application are given in appendix I - Project Schedule
and II - Project Documentation.
Chapter 2
Clinical Context
This chapter presents the Autism Spectrum Disorders. A special focus is made on
joint attention, because it is that deficit on ASD that this project aims to rehabilitate. The main goal of the chapter is to elucidate the reader on the specific aspects
of this disorder and clearly identify the motivations of the project.
2.1
Autism Spectrum Disorders
ASDs are a group of developmental disabilities that can cause significant social,
communication and behavioral challenges. The five forms of ASD are (DSM, 2010):
1. Autism
2. Asperger syndrome
3. Pervasive Developmental Disorder Not Otherwise Specified (PDD-NOS), usually called atypical autism.
4. Rett syndrome
5. Childhood Disintegrative Disorder
The autism is the core of the spectrum. These forms are not going to be detailed in
this dissertation since it is not fundamental for the readers’ comprehension of the
project and its purpose. The spectrum will be considered as a single target.
2.1.1
Main Characteristics
ASDs begin before the age of 3 and last throughout a person’s life, although symptoms may improve over time. Some children with an ASD show hints of future
problems within the first few months of life. In others, symptoms might not show
up until 24 months or later. Some children with an ASD seem to develop normally
until around 18 to 24 months of age and then stop gaining new skills, or lose the
skills they once had.
5
6
CHAPTER 2. CLINICAL CONTEXT
The main characteristics of autism are usually grouped in a triad (DSM, 2010),
composed by:
• Social Development
• Communication
• Repetitive and Restricted Behavior
Those characteristics will now be detailed and related to the application goals.
2.1.1.1
Social development deficits
Unusual social development becomes apparent early in childhood. Autistic children
show less attention to social stimuli. They smile and look at others less often, and
respond less to their own name. The usual social concepts that normal developing
children acquire are not present in the children with ASD. For example, these children maintain less eye contact and do not talk in turn taking; do not have the ability
to use simple movements to express themselves, such as the deficiency to point at
things. Autistic children between three and five years old are less probable to initiate or understand social interactions, approach others spontaneously and initiate
or respond to emotions (DSM, 2010).
The project aims to rehabilitate a specific social interaction, known as joint attention
(see section 2.2).
2.1.1.2
Communication
About a third to a half of individuals with autism do not develop enough natural
speech to meet their daily communication needs Noens et al. (2006). The communication deficits appears in the first years of life. Joint attention seems to be related
to communication as a mandatory skill for a common development. Treatments
that rehabilitate joint attention have shown correlated improvements in the communication skills of the children (Jones et al., 2006), (Kasari et al., 2006), (Whalen
et al., 2006). Joint attention plays also an important role for being one of the first
detectable symptoms, appearing in the first years of age.
2.1.1.3
Repetitive and Restricted Behavior
The last main characteristic involves a restricted behavior, limited in focus, interest
or activity, with a big resistance to change. Combined with compulsive behavior,
which makes them tend to following specific rules on their daily tasks.
This characteristic, combined with their larger acceptance of computer learning aids,
reinforce the idea that a rehabilitation application will have a positive impact. If
they accept the treatment, they can do it repeatedly and, by so, improve its efficacy.
2.2. JOINT ATTENTION
2.1.2
7
Treatment
There is no known cure for autism, nor is there one single treatment for autism
spectrum disorders. But there are ways to help minimize the symptoms of autism
and to maximize learning. The current treatment solutions can be grouped into three
groups: behavioral and other therapies; educational and school-based programs and
medicine. The therapies’ quality is highly dependable of the quality of the team
responsible for its application.
The project aims to be a treatment for social development. Very few applications
exist with this purpose, being the most common applied to the communication and
cognitive learning, generally discarding the social factor.
2.2
Joint attention
Before infants have developed social cognition and language, they communicate and
learn new information by following the gaze of others and by using their own eye
contact and gestures to show or direct the attention of the people around them. Scientists refer to this skill as “joint attention”. Joint attention is an early-developing
social-communicative skill in which two people use gestures and gaze to share attention with respect to interesting objects or events. It involves the ability to gain,
maintain, and shift attention. For example, one person is gazing at another and
then points to an object. The other person looks to the object and then back to the
person. In this case, the pointing person is “initiating joint attention” by trying to
get the other to look at the object. The person who looks to the referenced object
is “responding to joint attention”. Joint attention is referred to as a triadic skill,
meaning that it involves two people and an object or event outside of the duo. This
skill plays a critical role in social and language development. Figure 2.1 shows a two
step example of joint attention.
Figure 2.1: Joint attention example: The left child sees that the right child is staring
to some object and follows his gaze. Both of them end up looking for the object.
The attention of the right child was successfully shared with the left one.
Here is an example of a real life joint attention experience (from (Jones and Carr,
2004)):
Sam and his mother were playing in the park when an airplane flew overhead. Sam
looked up excitedly, then looked back at his mother, and finally pointed to the air-
8
CHAPTER 2. CLINICAL CONTEXT
plane, as if to say, ”Hey, Mom, look at that!”. Sam’s mother looked at where her
son was pointing and responded, ”Yes, Sam, it’s an airplane!”
Concluding, joint attention abilities play a crucial role in the diagnosis of autism,
because it has been proved to be related to the disorder and because they are one
of the earliest signs of it (Charman, 2003). Joint attention interventions in autistic
children showed strong results in their communication capabilities such as social
initiations, positive affect, imitation, play and spontaneous speech (Whalen et al.,
2006; Jones et al., 2006; Kasari et al., 2006).
2.3
Conclusions
The ASDs are gaining presence and awareness in the society. The reported incidence
has grown severely, although the reasons beyond such growth are yet controversial.
Having no cure yet discovered, the treatments represent an important approach to
enhance the subjects quality of life. The studies referred shown better results for
computer learning aids than the human assisted ones.
This project focus on the subjects characteristics, practicing a known deficit in
autistic children’s social development: joint attention.
Chapter 3
State of Art
This chapter presents the basis and recent developments in the fields covered by
the dissertation. It covers VR in autism, introduces the Brain-Computer Interfaces
(specifically using Visual Evoked Potentials), and exposes the state of the art of BCI
applications within Virtual Reality environment. Finally, it presents the issues and
current performances of P300 detection algorithms.
3.1
Virtual Reality in Autism
Virtual Reality (VR), in the definition presented by Alan B. Craig in “Developing
Virtual Reality Applications” (Craig et al., 2009), is a term that applies to computer
simulations that create an image of a world that appears to our senses in much the
same way we perceive the real world (or “physical” reality). In order to convince
the brain that the synthetic world is authentic, the computer simulation monitors
the movements of the participants and adjusts the sensory displays in a manner
that gives the feeling of being immersed in the simulation. To achieve a realistic
simulation, these systems stimulate the human senses - visual, audio or even haptic.
There were already some attempts of using Virtual Reality systems as learning
aids for children with Autism Spectrum Disorders. The University of Haifa, Israel,
developed a system that teaches autistic children how to safely cross the street
(University of Haifa, 2008). In another example, Dorothy Strickland, who completed
some of the first studies on virtual reality and autism while a computer scientist at
North Carolina State University in the mid-’90s, has since developed a range of
software programs that feature cartoon characters teaching autistic children how
to respond to everything, from a fire to a smile (Gillette et al., 2007). The North
Carolina State University has also developed a study where two autistic children
were embed in a Virtual Environment and tried to identify a car and its color.
Those studies presented motivating results, evidencing the ability of ASD children
to adapt to the hardware and the environments.
9
10
CHAPTER 3. STATE OF ART
3.1.1
Motivation
There are several reasons supporting the use of Virtual Environments as learning
aids in Autism Spectrum Disorder subject. The most important are:
• Controllable Input Stimuli: virtual environments can be simplified to the level
of input stimuli tolerable by individual. Distortions in elements can take place
to match the user expectations or abilities. Distracting visual elements and
sounds can be removed and introduced in a slow, regulated way.
• Modification for Generalization: minimal modification across similar scenes
may allow generalization and decreased rigidity. This is a property of major
importance, because it dictates the relevance of the application for the user’s
real life.
• Safer Learning Situation: a virtual learning world provides a less hazardous
and more forgiving environment for developing skills associated with activities of daily living. Mistakes are less catastrophic and the environments can
be made progressively more complex until realistic scenes to help individuals
function safely and comfortably in the real world.
• A Primarily Visual/Auditory World: the VR systems used nowadays use specially visual and auditory stimuli. Particularly with autism, sight and sound
have been effective in teaching abstract concepts. Studies show that the autistic individuals thought patterns are primarily visual.
• Preferred Computer Interactions: the complexity of social interaction can interfere when teaching individuals with social disorders. Establishing influence
over the child is an often difficult first step where human interaction can be
so disruptive that learning is not possible. These children respond well to
structure, explicit, consistent expectations and challenge provided by computers. Some studies have have reported advantages of computer learning aids
for autism and attention disorders (Chen and Bernard-Opitz, 1993; Plienis,
1985).
To better understand the patients impairments, we have been given the privilege
of assist to some development assessments of children with ASD in the Pediatric
Hospital of Coimbra, with Dr. Frederico Duque and the Dr. Susana Mouga, under
the approval of Professor Dr. Guiomar Oliveira. In those assessments, a personal
understanding of these patients capabilities and limitations was gained, which proved
to be very useful in the development of the application. Follow those appointments
allowed to verify some of the advantages of a Virtual Reality system. In concrete,
all the children followed showed interesting levels of technology usage. For example,
after a child failed to do a cognitive test with the therapist (see figure 3.1), the
parents stated that the child plays that same game in the TV set-up box for hours,
when at home, with the remote. This is a clear example where the social impairments
made him fail in a task he is able to execute, and also expresses the predisposition
of the child to computerized learning aids.
3.2. BRAIN-COMPUTER INTERFACES
11
Figure 3.1: An example of the cognitive test performed to the autistic child.
3.2
Brain-Computer Interfaces
A Brain-Computer Interface (BCI) - also called Direct Neural Interface or Brain
Machine Interface - is a direct pathway between the brain and an external device.
The idea is to interpret the brain waves in order to allow communication through
the simple thoughts of a person (Farwell and Donchin, 1988).
The applicability of such technology is wide: The game community has early understood the value of this technology in gaming and some products have already been
released that use it (Emotiv, 2011; NeuroSky, 2011; Nijholt, Anton, 2009). The
military directed the research towards a telepathic communication device, where
soldiers could communicate with each others just by thinking of it (Drummond,
Katie, 2009). But the large research field has been the neuro-scientific, towards
augmenting the capabilities of handicapped people, such as, power muscle implants
and restore partial movement.
A largely studied paradigm is the BCI speller, where a user is presented with a
matrix of letters and the system identifies the letter the user wants to choose. This
represents a way for patients with locked-in syndrome communicating for the first
time in ages.
3.2.1
Types of BCI
There are three types of BCI: invasive, partially invasive and non-invasive.
Invasive BCI research has targeted repairing damaged sight and providing new functionality to persons with paralysis. Invasive BCIs are implanted directly into the
gray matter of the brain during neurosurgery. Being attached directly in the brain,
this produces the highest quality signals, but are subject to scar-tissue build up
as the body reacts against a strange object. Studies with this type of BCI aim to
restore sight to people with non-congenital (acquired) blindness.
12
CHAPTER 3. STATE OF ART
Partially invasive BCI devices are implanted inside the skull but rest outside the
brain rather than within the grey matter. They produce better resolution signals
than non-invasive BCIs where the bone tissue of the cranium deflects and deforms
signals and have a lower risk of forming scar-tissue in the brain than fully-invasive
BCIs.
Non-invasive BCI scan the EEG with electrodes placed outside of the skin. This
makes the signal less accurate, but has the advantages of not needing surgery to
be installed. This type of BCI can also be performed with different neuro-imaging
techniques, like fMRI (Sitaram et al., 2007). Figure 3.2 illustrates the relation
between the invasion and the EEG quality.
Figure 3.2: Inverse relation between the method level of invasion and the signal
quality.
3.2.1.1
BCI Neuromechanisms
Current BCI systems use mainly four different neuromechanisms (Pires et al., 2008):
slow cortical potentials (SCP); event related synchronization and desynchronization
(ERD/ERS) of µ and β rhythms, usually through motor imagery; visual evoked
potentials (VEP) and steady VEP; and P300. The first two approaches require
the subjects to acquire control of its brain rhythms, which usually take much time
and some subjects cannot perform that task in a satisfactory level. The other
two approaches do not need a learning phase from the user, since they are natural
brain responses to the visual stimuli. In these mechanisms, users only have to pay
attention to the stimuli.
The BCI neuromechanism used in this project is the P300 (figure 3.3. The oddball
paradigm fits the structure of the virtual reality software to develop and it relation
to attention is a great feature for the social development rehabilitation in the autism.
3.2.1.2
Electroencephalography (EEG)
The brain’s electrical charge is responsible of billions of neurons, which are electrically charged (or “polarized”) by membrane transport proteins that pump ions
3.2. BRAIN-COMPUTER INTERFACES
13
Figure 3.3: An example of the P300 signal in the Pz channel of an EEG.
across their membranes. When a neuron receives a signal from its neighbor via an
action potential, it responds by releasing ions into the space outside the cell. Ions
of the same charge repel each other, and when many ions are pushed out of many
neurons at the same time, they can push their neighbors, who push their neighbors,
and so on, in a wave. This process is known as volume conduction. When the wave
of ions reaches the electrodes on the scalp, they can push or pull electrons on the
metal on the electrodes. Since metal conducts the push and pull of electrons easily,
the difference in push, or voltage, between any two electrodes can be measured by
a voltmeter. Recording these voltages over time gives us the EEG (Tatum, 2007).
In conventional scalp EEG, the recording is obtained by placing electrodes on the
scalp with a conductive gel or paste. Usually each electrode is attached to an
individual wire. Some systems use caps or nets into which electrodes are embedded.
This is particularly common when high-density arrays of electrodes are needed. The
electrodes are then connected to an amplifier which augments the voltage between
the active electrode and the reference (typically 1,000-100,000 times, or 60-100 dB
of voltage gain). Most EEG systems these days, are digital, and the amplified
signal is digitized via an analog-to-digital converter, after being passed through an
anti-aliasing filter.
An issue is the separation of artifacts from the signal. Artifacts are electrical signals
detected along the scalp by an EEG which are not originated from non-cerebral
origin. The amplitude of artifacts can be quite large relative to the size of amplitude
of the cortical signals of interest. The artifacts can be biological (eye blinks, in
example, showed in figure 3.4) or environmental (movements or bad grounding, in
example).
3.2.1.3
Event-Related Potentials (ERP)
An event-related potential (ERP) is any measured brain response that is directly
the result of a thought or perception. More formally, it is any stereotyped electro-
14
CHAPTER 3. STATE OF ART
Figure 3.4: Blink artifacts in EEG reading.
physiological response to an internal or external stimulus.
This is normally recorded with EEG. As the EEG reflects thousands of simultaneously ongoing brain processes, the brain response to a single stimulus or event of
interest is not usually visible in the EEG recording of a single trial. To see the brain
response to the stimulus, the experimenter must conduct many trials (100 or more)
and average the results together, causing random brain activity to be averaged out
and the relevant ERP to remain. The averaging of the signals act as a low-pass
filter. The P300 ERP is especially presented in the frequencies lower than 30 Hz
(Krusienski and Shih, 2011).
Event-related potentials are caused by the high processes that might involve memory,
expectation, attention, or changes in the mental state, among others.
Figure 3.5: Several Event-Related Potentials showed together
The nomenclature of the ERP are usually defined as a first letter identifying the
polarity event (N - Negative, P - Positive) followed by the expected time delay where
it appears, after the stimuli. So, if the ERP has the name N100 it means that there
3.3. P300 BCI IN VIRTUAL ENVIRONMENTS
15
is a negative variance of the EEG signal 100 milliseconds after the display of the
stimuli. The ERPs are specific to spacial regions of the brain. The ERP resulting
of visual stimuli are grouped in a subset called Visual Evoked Potentials (VEP).
Figure 3.5 shows an example of several ERP grouped together in one signal.
3.2.1.4
P300 elicited by an oddball paradigm
The VEP used in the project is the P300. The P300 is a positive variance of
potential, compared with the reference, in EEG signal that occurs 300 milliseconds
after the stimuli presentation. Timing of this component may range widely, however,
from 250 ms and extending to 900 ms, with amplitude varying from a minimum of
5 µV to a usual limit of 20 µV for auditory and visual evoked potentials, although
amplitudes of up to 40 µV have also been documented. Studies show that P300
amplitude is proportional to the attention provided by the subject issued.
Figure 3.6: An example showing the difference of the neuronal reaction between the
frequent and the infrequent stimuli.
The P300 is usually elicited by an oddball paradigm. The oddball paradigm is
a technique used to assess the neural reactions to unpredictable, but recognizable,
events. The user is asked to count or press a button to identify whenever a target
stimuli occurs, that are hidden as rare occurrences amongst a series of more common
stimuli. The non-target stimuli require no response. Figure 3.6 shows the difference
of the brain responses between the target and non-target stimuli. It was first used by
Nancy Squires, Kenneth Squires and Steven Hillyard at the University of California,
San Diego (Squires et al., 1975).
3.3
P300 BCI in Virtual Environments
The combination of this two technologies is been tried with success in the research
community. However, there are still many issues to be studied. The most common
experiment we can find in the bibliography is the control of a virtual apartment
16
CHAPTER 3. STATE OF ART
(Bayliss, 2003). It uses a P300 paradigm and has a panel of options with the different
elements blinking in a random order. The P300 is measured for the different options.
Other solutions use P300, but still with the same paradigm: use a control board with
commands. The user look to the commands which are flashing in a random order.
Those solutions include controlling a character motion along the z-axis, navigate in
some virtual environment or control object movement.
Different solutions use motor imagery to navigate in virtual environments. This kind
of solution has several different implementations: exploration in a virtual conference
room (Leeb et al., 2005), 2-dimension cursor control (Fabiani et al., 2004), drive car
in 3D virtual environment (Zhao et al., 2009), motion along virtual street (Klein,
1991), etc.
Some studies focus on the feasibility of combining both solutions, comparing results
of the BCI between immersive and non-immersive setups, for instance. The stimulus
type in VEs have not been studied deeply, which will be covered in the following
section.
3.3.1
Stimulus design techniques
Its important to verify that the current solutions in the bibliography never use
motions nor social interactions as stimulus for the BCI. In the case of P300 BCI, the
solutions always use some reference control panel, with flashing elements (Donnerer
and Steed). This is a challenge to the design of the virtual environment: create the
social interactions in a way that they can elicit a P300 neuronal wave in its users.
Stimulus with 3D object have been done, but with a different technique: a semitransparent sphere appears in the front of the object to stimulate, for a short time.
This is different than a 2D flash in a panel, because is uses 3D properties and the
objects are distributed through the 3D space. However, it still does not explore the
motion nor the social components this project addresses.
3.4
P300 detection
The first time the P300 wave was reported dates from 1965 (Andrews et al., 2008).
Its shape is a positive deflection in the EEG signal approximately 300 ms after the
presentation of a rare, deviant or target stimulus. It resides mainly in the 0-8 Hz
band (Khosrow-Pour, 2009).
The latency and the amplitude of the P300 wave is correlated with the user’s level
of fatigue and the saliency (brightness and color) of the stimulus. The stimuli can
be visual or auditory (Citi et al., 2008; Serby et al., 2005; Zhang et al., 2008).
The usual P300 classification process involves three steps: signal pre-processing,
feature extraction/selection and classification.
3.4. P300 DETECTION
17
Accuracy
# repetitions
15
5
96.5% 73.5%
Table 3.1: P300 Speller Paradigm results from BCI competition (3rd edition).
3.4.1
Challenges of P300 classification
The P300 is a wave that is hard to identify in a single trial classification. The
usual procedure is to average several trials/repetitions of the same event in order to
improve the signal to noise ratio. This clearly slows down the communication rates.
The communication rate is a term associated with the P300 speller paradigm and
represents the number of bits that can be transmitted per second. The P300 Speller
paradigm was first presented by Farwell in 1988 (Farwell and Donchin, 1988) and
is composed by a square matrix of letters, with dimension 6. Each row and column
blinks in a different time, in a random order. If the user wants to transmit the letter
A the P300 will occur when the line and column containing that letter flashed. The
figure 3.7 shows the visual paradigm of the P300 speller.
Figure 3.7: The P300 speller proposed by Farwell and Donchin in 1988
.
With the growing of research interest in the BCI area, a competition was created to
validate the research methods and techniques develop through this last years. There
were already four editions of the competition. The last edition was in 2008, but this
one do not considered any P300 paradigm. The third edition dated 2005 and has a
P300 speller paradigm competition. The best classification results are presented in
table 3.1.
This competition fits its validation purpose by providing an open database for the
research community to test its methods. It is important for a new method to confront
its results with the results of this competition. Although, only accuracy values are
provided, nothing is said about specificity or sensibility of the classifiers, neither
other classification metrics are used.
Another problem the classification of P300 faces is the need of several channels to
18
CHAPTER 3. STATE OF ART
remove the correlation in the signals. It is an interesting point of investigation the
decreasing of the number of channels used for online classification of P300.
Finally, applying the P300 analysis in this project brings innovation to the both
components of it. Because the P300 was never tested with social moving stimulus in
a virtual reality visual paradigm, this presents a new signal classification problem.
Because of the variability of P300, we cannot expect to obtain a standard P300
wave. Not knowing a priori the brain response that this paradigm will generate,
this causes issues in both sides: the classification problem addresses a wave that
is not a perfect match with the P300 presented in the bibliography and the visual
stimuli has to be adapted to maximize the brain response of the user.
3.4.2
Signal Pre-processing
The P300 wave has in its worse characteristic its Signal-to-Noise Ratio (SNR), caused
by powerful background noise. The denoising of the signal is typically done by batch
averaging of the signals recorded in multiple trials.
• Trial Averaging: In on-line applications, the trial must be repeated several
times until statistical significance is achieved (Serby et al., 2005). However,
recording several trials is time consuming and causes lengthy delays in BCI
processing. Also, the latency of the P300 response may differ from trial to
trial, which can lead to latency distortion of the averaged result (Andrews
et al., 2008).
Pires et. al. study compares the effect of changing the number of averaged
trials on the performance of a P300-based BCI (Pires et al., 2008). The results
shown a monotonic decrease in the false positive, false negative and error rate
as the number of averaged trials increases. This results shows the efficacy of
the trial averaging approach.
• Spatial Filtering: A spatial filter is a function that operates on signals
originating at different points in space at the same instant in time. Some
examples of spacial filtering used in BCI are the Laplace filter, the Local
Average Technique (LAT) and the Common Average Reference (CAR) (Peters
et al., 2001).
Common Average Reference (CAR):
n−1
x0k (t)
1X
xi (t) k = 0..n − 1
= xk (t) −
n i=0
Laplace Filter: This method involves can only be applied in channels surrounded by other channels, at least 4 (each side, up and down). Corresponds
to the application of the filter shown in the figure 3.2, being the filtered channel
in the center of the matrix.
3.4. P300 DETECTION
19
0
-1
0
-1
4
-1
0
-1
0
Table 3.2: Laplacian filter matrix to apply on the surrounding channels.
1
x0i,j = xi,j − {xi−1,j + xi,j−1 + xi+1,j + xi,j+1 }
4
Local Average Technique (LAT): A local average between the channel to
filter and its surroundings (each side, up and down).
1
x0i,j = {xi−1,j + xi,j−1 + xi,j + xi+1,j + xi,j+1 }
5
In the Peters et al., 2001 study, this filters were compared using a Neural
Network classifier. The LAT filter have worse results than the original signal,
but the Laplace and CAR filters showed a performance of 98% BCI classification accuracy. These results are odd, since the laplacian filter acts as an
high pass filter, and the P300 components are expressed in a low band of frequencies [1-30]Hz. This controversial data exposes the few studies done in the
frequency spectrum of P300, since most of the approches focus on the time
domain features.
Spatial filters are a feasible denoising option when multiple channels of data
are present. However, as their transfer functions are constant and insensitive
to the input data, they are suboptimal at noise removal.
Another filter recently used is the Common Spatial Patterns, which is based
on the principal component decomposition of the the sum covariance R, where
R=
X ∗ X0
trace(X ∗ X 0 )
being X a NxT signal of N channels and T values. Then, R can be defined as
R = AλA0
where A is the orthogonal matrix of eigenvectors of R and λ is the diagonal
matrix of eigenvalues of R. A whitening transformation matrix W
1
W = λ− 2 A0
transforms the covariance matrix R to I (identity matrix).
The above process is done in two separated signal groups, in the training: the
target and non-target epochs. For both of them, the eigenvectors At and Ant
20
CHAPTER 3. STATE OF ART
are achieved. The matrix Af is created combining the eigenvectors with bigger
eigenvalues in both At and Ant .
The Spatial Filtered data (Y) is achieved by
Y = A0f W X
3.4.3
Feature Extraction/Selection
Some initial studies used the peak characteristics as features (like latency, area).
The first appearance of a P300 detection BCI system was the BCI speller in 1988
by Farwell et al (Farwell and Donchin, 1988). In its study, it used as features the
peak of the signal, the area and the covariance between trials.
This types of features have disappeared from the literature in the last years. The
new approaches use wavelet feature extraction methods (Salvaris and Sepulveda,
2009), (Donchin et al., 2000). The purpose is to approximate the P300 signal by a
Wavelet Transform and then use the wavelet coefficients as features.
Some works present methods like Principal Component Analysis for feature selection/dimension reduction (Lenhardt et al., 2008). PCA is a mathematical procedure
that uses an orthogonal transformation to convert a set of observations of possibly
correlated variables into a set of values of uncorrelated variables, called principal
components. The first principal component has the highest variance possible (that
is, accounts for as much of the variability in the data as possible), and each succeeding component in turn has the highest variance possible under the constraint that
it be orthogonal to (uncorrelated with) the preceding components.
The great majority of the studies use the signal itself (after averaging) as feature
to the classifier. The main focus on the P300 classification is on the signal preprocessing and not in the feature extraction/selection.
Pires et al., 2009 performs channel selection using the Signal Coherence between
channels. Coherence gives a linear correlation between two signals as a function of
the frequency. In the context of neurophysiology, it is used to measure the linear
dependence and functional interaction between different brain regions. The purpose
is to select the most coherent channels to then apply the Common Spatial Patterns
algorithm.
3.4.4
Classification
There are several classifiers used in the literature to the P300. A significant part of
the studies uses linear discriminant classifiers. The original work from Farwell used
a Step-Wise Linear Discriminant Analysis (SWLDA) method. Several studies use
linear discriminant classifiers (Fisher Linear Discriminant)(Selim et al., 2009).
3.5. RESEARCH CHALLENGES
21
Statistical classifiers are also used in the bibliography, like Bayesian classifier (Pires
et al., 2008; Selim et al., 2009). Neural Networks have also been used in some works
(Cecotti and Graser, 2010).
Recently, the use of Support Vector Machine classifiers have become more frequent
since it is a powerful approach for pattern recognition especially for high-dimensional
problems (Selim et al., 2009; Kaper et al., 2004). Using the entire signal as features
makes this type of classifier very suitable to the problem.
3.5
Research Challenges
The P300 signal classification provides some challenges not yet satisfactorily addressed by the research community:
• Single-trial classification: The current systems use averaging methods to
achieve better signal-to-noise ratio. This mean that for communicating one
symbol/instruction the visual stimuli must be repeated n times. Current approaches can already detect the P300 with a 100% accuracy for around 10
repetitions. This makes a very slow communication rate and is not possible in
real-life applications. The objective of the research arround P300 classification
is to achieve 100% accuracy in single-trials. This means to detect every time
a P300 occurs, without any averaging.
• Environment noise: A Virtual Reality system promotes the user movement
of the head and the eyes. This can cause a lack of attention in the target of
the experiments, which can increases difficulties in the detection of P300. This
difficulties have been documented by other studies (Bayliss and Ballard, 1998)
and may decrement slightly the accuracy of the classification. Another issue
is related to the stimuli being a social movement - not an image flash, blink or
transition, as studied in the bibliography. The signal can be slightly different
from the standard P300 waves found so far with the common stimuli.
• Channel reduction: Studies make use of spacial filters to enhance the signalto-noise ratio, in P300 classification. Although, in autistic children, the set up
of several EEG electrodes may be very difficult. This elicits the need of using
few EEG channels, providing a fast set up for the experiences eliminating this
difficulty with the children.
3.6
Conclusions
The benefits of virtual reality environments in autism are gaining expression in the
bibliography. However, the studies approaching this solution are still few.
The combination of virtual reality and brain-computer interfaces have been studied
recently. Some studies reflect that it is possible, but they only try low level, minimalistic stimulus. Studies do not try high-level stimulus, as motions from avatars.
22
CHAPTER 3. STATE OF ART
None study was found that combines virtual reality and brain-computer interfaces
in patients with autism.
The usage of a BCI system has several advantages to validate the subjects’ attention, but it also raises several challenges. The classification process of P300 in a
dynamic virtual environment based on a social movement as stimuli was not yet
tried and the resulting signal of such stimuli can have some differences from traditional approaches. Also, there is the need of trying a channel reduction to fasten
the set up of the EEG system on the autistic children. A last point is the research
of single trial classification techniques, which still few explored in the bibliography.
Chapter 4
VR Application for Autism
This chapter presents the software application: the objectives of the application, the
requirements, architecture, design, construction and tests. The full documentation
is presented in Appendix B, for detailed analysis.
For the software application development, it was adopted the openUP methodology,
which is similar to RUP but with agile characteristics. The sprints were two weeks
long. The reason beyond this software development process is related to the fact of
the project being a research project, requirements tent do change along the development process. The agile properties of this software methodology provide the means
to deal to such changes, even in the last development phases.
It is important to clearly explain that there are two different applications/modules
that play key roles in the project. One is the Virtual Reality application, the other
is the EEG classification module. In the Architecture section (4.3) it is explained
how the different modules co-exist.
4.1
Objectives
The objectives of the application is to create a social virtual environment in which
the user interacts with virtual human characters in order to train its joint attention
skills. The system must use a Brain-Computer Interface to perform the assessment
of the user attention to the clues. The BCI system will use a P300 classifier.
4.2
Requirements
The functional requirements analysis followed the use case modeling technique,
which is fully detailed in Appendix B. Figure 4.2 presents the use cases diagram.
In this section will only describe the main requirements, which correspond to the
main functionalities available to the users. The system-wide requirements will also
23
24
CHAPTER 4. VR APPLICATION FOR AUTISM
Figure 4.1: High-level interaction diagram showing the flow of information.
Figure 4.2: Use case diagram
4.2. REQUIREMENTS
25
be covered, because it includes performance and synchronization aspects which are
critical to the application.
In the first task, the child has to identify one specific person in the middle of a small
crowd, by paying attention to some specific attention clue of these (eye movement,
pointing, etc). All the crowd is making different movements, so if the child looks
to a different person it is recognized by the system. Only one person is making
the correct movement - a joint attention clue. The objective is to train the user
identifying joint attention initiation by others. Figure 4.3 shows a mockup of this
scenario.
Figure 4.3: Task 1 - Identify joint attention clue mockup
In the second scenario, the child has to identify the target of the attention clue.
In this case, there is only one virtual character in the scene and there are several
target objects, each one animated in a random sequence. The child is asked to follow
the nonverbal clue of the subject and pay attention to the animations of the target
object. This way, the P300 is elicited after the objects animates and the system can
check if the subject identified the right target.
This scenario, presented in figure 4.4, has the objective of evaluate if the subject is
available to respond to joint attention, following the clue and identifying the target
object.
A gaming-style environment is created by giving rewards when the user correctly
detects the targets and penalties when he does not. The attention clues may vary
from more explicit to more discrete, so it allows us to understand how expressive
must the clue be to be detected by the user and so we can catalog the users in
different rehabilitation levels.
For a more interesting user experience, the tasks are encapsulated in stories. Each
story has several chapters the user “plays”, literally.
Another important use case is related to the setup of the executions. Each execution
can be assigned with a specific scenario, and can be configured with the number of
26
CHAPTER 4. VR APPLICATION FOR AUTISM
Figure 4.4: Task 2 - Identify joint attention target mockup
human characters or the target objects, with respect to task 1 and 2.
The remaining use cases are related to the user creation and edition, the trial results
saving and consult.
4.2.1
System-wide Requirements
On the system-wide requirements level, the synchronization is a key aspect in the
application. For the BCI application, a pattern in the signal is detected 300 ms
after the visual stimuli is presented. This means that, when the stimuli is presented,
a trigger must be sent to the EEG recorder, marking the occurrence of an event.
The change in the screen (presentation of the stimuli) and the sending of the trigger
must be synchronized, to ensure there are no variations in time to jeopardize the
signal recognition process.
Another important system-wide requirement is usability. The system must keep the
user training joint attention as long as possible. To foster this, the rewarding and
story-like environments were created. The usability tests assess this requirement.
A main system-wide requirement was to provide the therapist the ability of create,
edit or add new tasks without changing the application. A great effort was made
in order to abstract whole the implementation to assure the system could handle
different types of content. The system gives the therapist an interface to manage
the scenarios used during the tasks, the objects, the avatars, its animations, etc.
The system supports several types of 3D formats, so the therapist can add material
found in public databases to the tasks.
The abstraction of animations is a key issue, because it is very important to guarantee the adding of new attention clues in the future, for more detailed clinical
studies.
4.3. ARCHITECTURE
4.3
27
Architecture
This section describes the architecture of the system. In figure 4.5 it is shown the
whole system in an high level perspective.
Figure 4.5: Architecture Diagram (High Level)
The system has four main modules: the data acquisition, the data processing, the
virtual reality application and the database. The description of each of this modules
follows below.
• Data Acquisition: The data acquisition involves two phases: in the first
phase, the EEG data is captured by the electrodes in the cap, amplified and
sent to the recording software provided by the amplifier. In the second phase,
a matlab acquisition module connects the amplifier recording software by a
TCP/IP connection and reads the data from it to the matlab. Figure 4.6
describes this architecture.
Figure 4.6: EEG Data Acquisition Architecture
28
CHAPTER 4. VR APPLICATION FOR AUTISM
• Data Processing: This module does the pre-processing of the signal to remove noise and artifacts. Then, the feature extraction and selection techniques
are applied to gather the characteristic to use in the classification. The last
step corresponds to a machine learning technique that is able to classify the
signal into P300 or not P300. Then, the classification result is sent to the
last module, the virtual reality application, by a TCP/IP connection. This
communication protocol was selected to ensure a large integration possibilities
with several different technologies. The usage of a network protocol permits
the system to be distributed and separated in different computers. Real-time
Data processing and Virtual Environment rendering are two heavy operations
that can benefit from large dedicated resources. Using the TCP/IP protocol
we can separate completely both parts of the system.
• Virtual Reality Application: This is the last module of the system, the one
that directly interacts with the user. Its main function is to display the user
tasks while sending a synchronized trigger to the data acquisition module, in
order to provide the data processing module a way to match the signal and
the events provided in the virtual reality application. One last function of this
module is to receive the classification results from the data processing module
and use it to re-enforce the user experience.
• Database: The database module purpose is to keep permanently the information about the users, tasks, results, etc. The database uses a ORM
(Object-Relational Model) system, which uses the data mapper pattern to automatically map the object models into a SQL database. The ORM system
used is from Django (Django Project, 2011). Django is a web framework in
Python, in which the developer had already experience. Only the database
system from the Django framework was installed and used, once the web features were not needed. A deeper analysis and the Entity-Relationship model
from the database is presented in section 4.5.
4.3.1
Internal Architecture
The internal architecture of the application can be divided into three layers: Presentation, Logic and Database. Figure 4.7 presents these architecture.
In a bottom-up analysis, the Database layer consists of the part of the software with
connects the database to the application. It includes the models of each element and
the DatabaseInterface classes, which establishes a bridge between the logic application and the database. In the same layer is the Sensors Middleware, responsible for
receive and process input from external devices, namely the EEG and the Virtual
Reality Sensors. The data, after processed, is passed up to the Task Manager from
the Logic layer, which creates the appropriate responses in the Presentation to respond to the input. The Logic layer consists of the brain of the application. It can
be split into two main modules: the administration, which is responsible to handle
the addition, edition and removal of the contents of the application. In includes
the validation of the content loaded for rendering; and the Task Manager, which
4.4. TECHNOLOGIES
29
Figure 4.7: Internal Architecture of the application.
creates the tasks, executes them, creates the 3D scene, animate the avatars, etc.
The Task Manager does the main processing in the Virtual Reality module of the
system, once it coordinates the tasks, animates the contents, create the responses
to stimulus, etc. Finally, the Presentation layer, which contemplates the output
interface with the user. It main module is the Scene Rendering, which is mostly
provided by the framework and includes the presentation of the scenes (3D models,
animations, rewards, etc). The content is rendered by the Vizard framework. The
details of each layer are specified in 4.6.
4.4
Technologies
The EEG acquisition system is from BrainProducts:
• Electrodes: actiCap - a cap with active electrodes based on high-quality
Ag/AgCl sensors with a new type of integrated noise subtraction circuits delivering even lower noise levels than the ”normal” active electrodes achieves.
Figure 4.8 presents this cap.
• Amplifier: V-amp - a sixteen channel amplifier with the ability of record
several types of signals, such as EEG, EOG, ECG, EMG and the full range
of evoked potentials, including brain stem potentials. Figure 4.9 presents this
amplifier.
• Recorder (Software): BrainVision Recorder for V-Amp - A recorder software package with a Remote Data Access module which allows the remote
access to the data via TCP/IP.
The Data Processing Module is implemented in Matlab language and uses the
TCP/IP/UDP and the PRTools toolboxes.
Finally, the last module (the virtual reality application) is implemented using the
Vizard toolkit, from WorldViz. This toolkit provides an interface for virtual reality
30
CHAPTER 4. VR APPLICATION FOR AUTISM
Figure 4.8: actiCap - Picture from BrainProducts
Figure 4.9: V-amp - Picture from BrainProducts
environments development in python. This toolkit provides an Integrated Development Environment that eases the management of the Virtual Reality project.
Some features provided by this software:
• Extensive 3D model formats: .wrl (VRML2/97), .flt (Open Flight), .3ds (3D
Studio Max), .txp (multi-threaded TerraPage loader), .geo (Carbon Graphics),
.bsp (Quake3 world layers), .md2 (Quake animation models), .ac (AC3D),.obj
(Alias Wavefront), .lwo/lw (Light Wave), .pfb (Performer), the OSG’s native
.osg/.ive format, DirectX .x format, and .3dc point cloud.
• Character (human biped) formats: 3D Max Character Studio (via 3rd party
exporter) and Cal3D .cfg files.
• Raster image formats include: .rgb/.rgba, .dds, .tga, .gif, .bmp, .tif, .jpg, .pic,
.pnm/.pgm/.pbm, and .png, jp2 (jpeg2000). Support for compressed and mipmapped images provided in .dds format.
• Audio modes: mono, stereo, 3D; supported formats: .wav, .mp3, .au., .wma,
.mid, and any other DirectShow supported format.
• Video textures: Any DirectShow compatible video format can be used as a
texture, including .avi, .mpg, .wmv, animated GIFs, and more. Access to
frame-by-frame control of video is available. Videos with alpha channels are
supported.
4.5. DATABASE
31
• Support for nearly all standard virtual reality devices , including trackers, 3D
displays, HMDs (head mounted displays), and many other peripheral devices.
The following is a list of just some of the hardware supported by Vizard.
• Full collision detection capabilities between either the viewpoint and any node
on the scene graph or between any two arbitrary mesh nodes on the scene
graph.
• Interoperability issue: only supports Windows as Operating System.
The final application is exported to an executable which can run in any computer
with operating system Windows XP or higher.
The application is developed under an enterprise license and an additional library
of human characters is also available in IBILI.
4.5
Database
As already mentioned, the application uses an ORM database. This way, the object
models (classes) implemented in the database are automatically mapped into SQL
tables. The ORM is currently mapping the objects to a SQLite database, for an
easier transportation and no need of changing configuration between computers. If
latter emerges the need of evolving the system to a more efficient database system,
it simply involves to change the configuration of the application.
Figure 4.10 contains the Entity-Relationship model of the database. The table Users
saves the info of the users, as specified in the use case ’Manage Users’. The tables
Avatars, Scenarios, Elements save the info of the respective 3D models. The table
Tasks contains the information about the tasks to be performed by the users. This
table saves both type 1 and 2 tasks. The tables TaskAvatars and TaskElements
relate the avatars and elements to the tasks. The table TaskRuns is used to save
the results of the executions of the tasks. Finally, there is the Stories and Chapters
tables, with the information needed for the use case ’Play Stories’.
4.6
Design
The Virtual Reality application follows an architectural pattern named Model-ViewController. This pattern splits the structure of an application in three parts, with
distinct responsibilities, and specifies the interactions between them. The figure 4.11
displays this pattern with the correspondent relationships.
The separability of this patterns induces several advantages to an application architecture, providing a decoupled development. The Model part represents the objects
of the database, such as user, avatar, element, etc. The View part represents the displays of the applications, the interfaces. The interfaces present informations about
the models, so they have a direct access to that part. Finally, the Controller part
32
CHAPTER 4. VR APPLICATION FOR AUTISM
Figure 4.10: E-R Diagram showing the tables and its relations in the database.
Figure 4.11: Model-View-Controller pattern diagram.
4.6. DESIGN
33
represents the logic of the application. It directly changes the View and the Model
parts, like changing the information about a user (model part) or displaying the
avatars in a scene (view part).
The View part includes the the classes responsible for what the final user sees: the
Scene class and all its children, including the menus, the story and the tasks (which
contemplates scenarios, avatars and elements). This module accesses the Model
module, from where it gathers information, for example, about the task to design
(which scenario to present, which avatars to load, etc). The class diagram for the
scenes is presented in figure 4.12.
Figure 4.12: Class diagram for the scenes used in the project.
The Model part includes the classes for the models. The class diagram for this part
is not presented, because it strictly follows the E-R model structure. Each class
represents a table with the respect fields as attributes.
The Controller part is the brain of the application. It is responsible to display the
views and react to the user interactions. This way, it is this module which creates
the tasks and manages the user responses to them. The design of the tasks and IO
module is presented in figure 4.13. To achieve a better modularity, the application
was designed to have different forms of input. The base form is the BCI method,
where the user user its brain to interact to the application, but it can also use a
34
CHAPTER 4. VR APPLICATION FOR AUTISM
Figure 4.13: Class diagram for the task and the IO mechanisms using the bridge
design pattern.
joystick or simply a button press interface, where the user simply presses a button
when it wants to interact. To be able to support different input devices was used a
bridge design pattern. The bridge separates the task (having an abstract class and
several child implementations) and the TaskIO (having an abstract IO with several
child implementations). This way, adding another task or a new IO mechanism will
not interfere with anything else. This can all be checked in the figure 4.13.
4.7
Implementation
The abstraction of scenarios, elements and characters makes it easy to extend the
software to insert new variations of those. Because the rewards of the users will
change through time, that it was developed a way to permit the insertion of new
elements in the application without changing the code. So, the user can simply
specify a file compatible with the Vizard elements and it is imported to the application. This abstraction was a constant focus on the development, being the whole
administration module the response to ensure such versatility. The validation of formats, animations and configurations was focused with special care because to ensure
abstraction, the files management are on the user side and can easily be corrupted.
A major challenge is the creation of the character animations for the scenes. Not
having the sensors to produce the movements in an automatic way, the characters
must be edited and several positions and movements tested to achieve the desired
action. This part was extremely time consuming, implying the learning of complex
3D modeling software and character animation techniques.
The usability of the application was also a major issue. Being a rehabilitation application, it becomes as much effective as much the users like it and auto-promote
themselves to use it. The autistic children demonstrate a lack of motivation for
participating in the traditional interventions. If the application is able to explore
their natural willingness for technological applications and the users becomes self-
4.8. TESTS
35
motivated to use the application it can have better results in the children development. The story and rewards module appear as a response to this, allowing the
therapist create and enhance stories to maximize the users’ motivation.
Finally, there was a long iterative process in designing the right stimuli configuration
to have a visible P300 ERP in the EEG. First attempts were ineffective, needed
improvements like changing the animations, normalization of non-target movements,
placement of the different elements on the scenes, velocity of animations, etc. All of
those factors were improved in order to achieve a visible median P300.
4.8
Tests
This section present the tests defined to validate the application. These tests assess the expected behavior of the application and help define if the application is
implemented correctly. It is a good and important way to validate the application
and identify problems. It is divided into four parts: unit testing, functional testing,
synchronization testing and usability testing.
4.8.1
Unit Testing
For each of the main modules of the application, it was implemented unit tests
which validated the respective module before every update to the master branch in
the repository. For instance, the database module: before performing any merge to
the master branch, a script ran all the tests of the database, which included adding,
removing and editing elements. Only if all the tests validated successfully, the merge
could be made.
4.8.2
Functional Testing
A detailed list with all the functional tests can be found in appendix B.1. Being
the content abstraction an important focus of the application, allowing the user to
add, edit and remove all the content used in the tasks (avatars, scenarios, animations, elements), the tests covered with a stronger focus the integrity of the content
added. This means that, on every execution, the application verifies the existence
of the external content in the correspondent paths and its consistency. Besides from
that, the main functionalities are covered by the tests, which address user-oriented
functionalities.
4.8.3
Synchronization Testing
The synchronization between the stimuli and the trigger is a major issue. If they
are not synchronized, the validation of the EEG is flawless, once we are looking for
36
CHAPTER 4. VR APPLICATION FOR AUTISM
a wrong time spectrum. For example, if one is looking for the average of the epochs
after triggers, in case of desynchronization, the signals will be dislocated and the
average will destroy signal components which might be important features for P300.
Figure 4.14 shows the test configuration: it was created a circuit where the screen
changes its colour and, at the same instant, a signal is sent through the parallel port
(trigger). The trigger is connected directly to one input of the digital oscilloscope,
and the colour change in the screen is capture by a fotodiode, which is connected
to the second channel of the oscilloscope. The screen was configured at 60Hz. This
system montage and data acquisition was done by Carlos Amaral.
Figure 4.14: Set up for the synchronization testing.
The experiment was run several times and the data was gatherer and exported by
the oscilloscope. Then, the delay between both channels were analysed.
The possibilities for analyzing the delay can be wrapped in the following groups:
• Digital Systems:
– Temporal response approaches
• Continuous Systems:
– Temporal response approaches
– Frequency response approaches
On Digital Systems, the response delay, if any, is in the order of nanoseconds. It can,
thereby, be discarded. The temporal approaches are the ones used. On the other
hand, on continuous systems, the time response is, usually, not disposable. Therefore, response in Frequency is used, in a technique called Group Delays (Struck,
Christopher J., 2007). Although the fotodiode is a continuous system, a temporal method was used. The following results show the differences in time form the
reception of the trigger and the detection of temporal response of the fotodiode.
Image 4.15 shows an histogram of that variance. The difference between the two
signals have a mean of 32.27 ms and a standard error of the mean 0.470 ms. This
4.8. TESTS
37
is an acceptable value. The direct implications of such latency is a delay of about
30ms on the P300 peak.
Figure 4.15: Histogram of delays between channels variances (fixed montage).
4.8.3.1
The portable setup
For the possibility of doing the experiments anywhere, it was needed to create a way
to send a parallel signal through a laptop. Current laptops have no parallel way out.
The solution went through the implementation of a microchip which receive a byte
through a USB port (serial) and send it through a cable (in parallel) to the EEG
amplifier. The microchip used to implement this circuit was the MSP430 LaunchPad
(MSP-EXP430G2), from Texas Instruments.
The synchronization was also tested on the portable setup. The histogram in figure
4.16 shows a mean of 47.38 ms and a SEM of 0.73 ms. The delay is bigger than in
the fixed setup, but it has also a smaller variance, which means it is synchronized.
Figure 4.17 shows a comparison between the fixed and portable montage delays,
where we can see the laptop version is more consistent, with a smaller variance.
4.8.4
Usability Testing
For the usability testing, ten healthy volunteers were asked to play a story. The
story was composed by six chapters, 3 of each type of task. Half the group played
a version without rewards, which means the feedback only came on the end of each
task/chapter. The other half played a version with rewards. After each block of
38
CHAPTER 4. VR APPLICATION FOR AUTISM
Figure 4.16: Histogram of delays between channels variances (portable montage).
Figure 4.17: Boxplot comparing fixed to portable montages synchronization.
4.8. TESTS
39
trials, during a task, a happy or sad smile was shown to the user, indicating his
performance on the task.
Each user played six tasks, with five blocks each, for a total of 30 performance
measures. The interaction mechanism used was a button-press technique. The user
pressed a button whenever he saw a target stimuli.
The population is presented in figure 4.18, with its age and gender. The names
were kept confidential, for disclosure purposes. The mean age is 22 years old, with
a standard deviation of 3.61 years.
Figure 4.18: Ages and gender of usability testing participants.
It was performed a normality test on the data. Figure 4.19 show that both variables
follow a Gaussian distribution.
Figure 4.19: Normality test results.
Then we conducted a paired samples T-test, which revealed mean differences statistically significants (see figure 4.20).
Figure 4.21 shows that the half of the users who did the tests with rewards achieved
a better performance than the users who did it without rewarding. The standard
error mean is also smaller for the users with rewards. This support the inclusion of
the rewarding process.
40
CHAPTER 4. VR APPLICATION FOR AUTISM
Figure 4.20: Significance for mean comparison difference.
Figure 4.21: A boxplot comparing distribution of test results with reward and without.
4.9. CONCLUSIONS
41
During usability tests, the users behavior was also observed and registered. The
questions they placed were used to adapt the instructions of the tasks, for instance.
All the users refer that the tasks embed in the story helped to give context to the
tasks and help the keeping of the users attached in the applications. All users wanted
to play the story until the end.
4.9
Conclusions
This system is a multi-modular system. It integrates with proprietary acquisition
software which handles the EEG data input and streams it via TCP/IP. The module
that handles the interaction with that software implements the proprietary protocol
by it defined. That module then passes the data to the classification module which
does the pre-processing of the signal (removing noise, extracting features) and classifies it has P300 or not. The result is then sent to the Virtual Reality application
which uses it to assess the user performance and show him the result. The whole
system communicates through TCP/IP to achieve a possible hardware separation
with network communication.
It was made a special effort to leave the interaction mechanism abstracted, currently
supporting BCI and Button-press. Another abstraction is related to content: every
3D object, avatar, animation, voice audio, etc. is separated from the application,
having the administrator the possibility of managing everything.
Some usability tests were made to study the effects of presenting rewards to the
users, which revealed an increase on users performance.
The system developed is an important achievement, because it is as a baseline for
the realization of several clinical studies.
Chapter 5
Experimental Analysis
This chapter presents the experimental tests and its results. It is divided in preliminary experiments and the project experiments. The projects experiments include
the classification of the EEG channel.
5.1
Preliminary Experiments
Before entering in the full development of the social visual paradigms for the P300
classification, we decided to perform a proof-of-concept testing on having social
movements eliciting P300 signals.
As mentioned in the state of the art, there have not been found any study that uses
high-level movements as stimuli for P300 classification. Having not been tried yet,
and being a basilar point to the project, there were defined a few tests to check in
an off-line analysis if a social movement would elicit a P300.
Having movements as stimuli, some issues must be taken into account: we hypothesize that long stimulus can cause delays on the latency of P300; another aspect is
that long stimulus might have variability in the perception time. So, we developed
the following paradigms to study how a social movement might elicit a P300:
• Static Paradigms
– Ball paradigm: A pair of balls, with high similarity to eyes, are flashed
on the screen. In the non-target stimulus, the balls appear in the normal
position, and in the target stimulus it appears rotated (see figure 5.1).
– Head paradigm: Similar to the balls paradigm, but with a 3D head.
The head is shown in its base position on the non-target stimulus, and
rotated on the target stimulus (see figure 5.2).
– Eyes paradigm: Similar to the head paradigm, but instead of rotating
the whole head, its the eyes that appear with a different rotation (see
figure 5.3).
43
44
CHAPTER 5. EXPERIMENTAL ANALYSIS
Figure 5.1: Ball paradigm representation.
Figure 5.2: Head paradigm representation.
5.1. PRELIMINARY EXPERIMENTS
45
Figure 5.3: Eyes paradigm representation.
• Moving Paradigms
– Moving-head paradigm: This paradigm is similar to the head paradigm,
but instead of the showing has a static image, the head moves to the left
for the non-target stimulus, and for the right on the target stimulus (see
figure 5.4).
– Moving-head paradigm (4 avatars): In this paradigm, four avatars
appear on the displayer. Each one of them, on a random order, looks
to another side. Here, the same movement is used for target and nontarget stimulus, being the target stimulus the movement performed by
the target avatar, and the non-target stimulus the movements performed
by the remaining avatars (see figure 5.5).
The static paradigms aimed to explore the P300 response associated to social stimulus. Those paradigms do not contain movement, and follow a traditional approach
of image display: present a set of images with target or non-target content, being
the target frequency lower.
The moving paradigms aimed to explore the P300 response on moving stimulus,
keeping the social characteristics. The moving head keeps a clean set up, showing
only one head and rotating it to the left or the right. The rotation simulates the
“look to something” social action. The 4 avatars test is the bridge to the project,
because it includes movement social stimulus (looking) in a virtual environment,
performed by a small crowd, like the task IdentifyJointAttentionClues, from the
46
CHAPTER 5. EXPERIMENTAL ANALYSIS
Figure 5.4: Moving Head paradigm representation.
Figure 5.5: Moving Head paradigm (4 avatars) representation.
5.1. PRELIMINARY EXPERIMENTS
47
project. For this reason, this experiment will be further detailed in description and
results.
Each avatar looks away from the crowd on a random selection (a stimuli), with a
fixed interval between stimuli. The user chooses an avatar to be the target, and
keeps a mental count of the number of times he makes the movement. The figure
5.5 shows a representation of the stimulus.
Each paradigm was tested in the following settings:
• Inter-Stimulus Interval (ISI): 1.1s
• Stimulus Duration: 0.9s
• # Trials: 50 (10 Target, 40 Non-Target)
5.1.1
Results
Figure 5.6: Population of the preliminary experiences.
For validation of the success of those proof-of-concept experiments, they were tested
on 7 participants (4 male, 3 female) with an average age of 24.57 years old and
a standard deviation of 2.06 years. Figure 5.6 shows the ages and genders of the
population. Participants names were ommited. The EEG readings were conducted
by Carlos Amaral.
After each experiment, the raw EEG signal was filtered, to the band of [1Hz 30Hz], then segmented by one second after each stimuli. The segments were divided
in target and non-target groups. Then, each group was averaged and plotted on the
same graphic. The verification of the success of the experiment was done by visual
inspection: if the usual shape of the P300 appears in the target averaged signal, in
contrast with the non-target signal, then the success was assumed.
The success was achieved in all paradigms, some with better P300 amplitude then
others, but in all cases the P300 was considered detected. The figure 5.7 is an
example result for the last paradigm, for 6 EEG channels, where the evidence of
P300 is clear, being the red signal the target average and the blue the non-target.
48
CHAPTER 5. EXPERIMENTAL ANALYSIS
Figure 5.7: Example result of the 4 avatars paradigm, with six EEG channels.
5.2
Project Experiments
Here we present the experiments with the application’s final paradigms. A detailed
description of the tasks are included, followed by a description of the classification
methods attempted and the results presentation and analysis. The objective is to
validate the P300 classification algorithms developed in single trial.
5.2.1
Protocol
This section presents, step-by-step, the entire experiment.
Figure 5.8: Task procedure, showing the Inter-Stimulus Interval (ISI) and the Stimulus Duration (SD).
The procedure involves the execution of two tasks. Each task follows the same
principle, which is explained in figure 5.8. From ISI to ISI, a stimuli is made, with
SD duration.
For the first task, the setup is composed by 10 women arranged in a half-circle,
as shown in figure 5.9. From ISI to ISI, one women makes an an animation, in a
random order, which can be a target animation (pointing) or a non-target animation
5.2. PROJECT EXPERIMENTS
49
Figure 5.9: Disposal of the avatars in Task 1. This image shows the target stimulus
(the pointing girl).
(lifting a leg). Only one women does the target animation, the other nine do the
non-target.
The task is composed by blocks of trials. When all the ten women performed their
animation, a trial is complete. Each block contains 10 trials, which means the all
sequence repeats 10 times with the same women being the target, but the order of
stimulus is random. After the 10 trials, a new target avatar is randomly selected,
and another 10 trials are preformed. The tasks ends after 10 blocks.
Task Configuration:
• Avatars: 10
• ISI: 700ms
• SD: 500ms
• # trials: 10
• # blocks: 10
After performing the first task, the subject is asked to do the second task. The second task consists of a different set up, where is presented a single avatar surrounded
by eight balls. The avatar is doing the pointing animation towards a randomly chosen ball, which changes on each block. The balls are then illuminated, from ISI to
ISI in a random order. When all the eight balls have been illuminated, a trial is
complete. Each block is composed by 10 trials. Figure 5.10 shows the task montage,
during a target animation.
Task Configuration:
• Balls: 8
• ISI: 700ms
• SD: 500ms
• # trials: 10
• # blocks: 10
50
CHAPTER 5. EXPERIMENTAL ANALYSIS
Figure 5.10: The disposal of the second task: one avatar surrounded by balls, pointing to one of them, which is currently activated.
5.2.2
EEG Montage
Figure 5.11: The electrodes placements in the head of the subjects.
Figure 5.11 shows a schema for the placement of the EEG channels on the scalp of
the participants. The reference is omitted, but it is placed on the left side, over the
ear. The montage is an important step of the experiment, because a bad montage
can decrease the signal quality abruptly. The montage involves: clean the scalp;
place the cap; put conductive gel in each electrode until its impedance reaches a low
value.
5.3. SIGNAL PROCESSING AND CLASSIFICATION
5.3
51
Signal Processing and Classification
We have developed two baseline classification processes to compare our methods:
the first uses a Fisher linear discriminant classifier and the second a Naive Bayes
classifier.
The signal processing consisted of applying a band-pass filter to cut frequencies
outside the 1-20Hz range. After that, and following the main procedures from the
state of the art, we use the hole signal as feature vector for classification. However, a
1s window on 1KHz sample frequency on 16 channels corresponded to 16000 features,
which is intractable. We downsampled the data with a 1/25 factor, reducing the
sample rate from 1KHz to 40Hz. We then concatenate the whole 16 channels,
reducing the features from 16000 to 640, which is manageable.
The data is then split into train and target sets, with six-fold cross validation.
5.3.1
Proposed Methods
We tried to develop two new methods for the P300 classification, exploring the
concept of signal coherence. The coherence (sometimes called magnitude-squared
coherence) between two signals x(t) and y(t) is
Cxy =
|Gxy |2
Gxx ∗ Gyy
(5.1)
being Gxy the cross-spectral density between x and y, and Gxx and Gyy the autospectral density of x and y, respectively.
This method gives information about the coherence of the both signals in several
frequency decompositions. We propose a creation of a two template signals from
the train data - St and Snt - derived from the mean of every target epochs and
non-target epochs, respectively.
Then, the coherence is calculated between each epoch in the train set and the template signals St and Snt . The first 10 coherence values of the signal (corresponding
to the gamma 0-20Hz) with each template are used as features in a Naive Bayes
classifier. The same is applied on the test set.
The second method we implemented also explores the coherence aspect. The idea
is that in a trial with N elements, of which we know one of them has a P300 and
the others do not, we suggest that the P300 signal will be the one less coherent with
the remaining N-1 signals. For each epoch we calculate the N-1 coherences with the
remaining and sum it. The epoch with the minimum total coherence is selected as
target. The principal advantage of this method is that it does not need any training.
52
5.3.2
CHAPTER 5. EXPERIMENTAL ANALYSIS
Signal Filtering: Common Spatial Patterns
As was mentioned in the state of the art, the spatial correlation of EEG is commonly addressed to achieve better signal-to-noise ratios, as an alternative to trials
averaging. Using few EEG channels (precisely, 16), and the application of localized
spatial filter need surrounding channels to uncorrelate the signal, we decided not to
use localized filter. Instead, we used Common Spatial Patterns (CSP).
The CSP method is based on the principal component decomposition of the sum
covariance R of the target and non-target covariances.
R = Rt + Rnt
(5.2)
where Rt and Rnt are the normalized N x N spatial covariances computed from
Rt =
xt x0t
trace(xt x0t )
Rnt =
xnt x0nt
trace(xnt x0nt )
(5.3)
We use the average of the normalized covariances trials
Nt
Nn t
1 X
1 X
Rt =
Rt (i) Rn t =
Rnt (i)
Nt i=1
Nn t i=1
(5.4)
where Nt and Nnt are the number of target and non-target trials on the training set,
respectively. The PCA is applied to the averaged matrix R, obtaining
R = Rt + Rnt = AλA0
(5.5)
where A is the matrix of eigenvectors and λ the diagonal matrix of eigenvalues of
R. A whitening transformation W
√
W =
λA0
(5.6)
which transforms the matrix R in the identity matrix.
S = W RW 0 = I
(5.7)
We calculate St and Snt replacing the R in 5.7 by Rt or Rnt , respectively. Through
PCA factorization on St and Snt
St = At λt A0t
Snt = Ant λnt A0nt
(5.8)
The spatial filter H is defined conjugating the most discriminative eigenvectors of
each group:
5.3. SIGNAL PROCESSING AND CLASSIFICATION
H = nA0 W
53
(5.9)
where nA represents the matrix of conjugated eigenvectors of At and Ant . The
spatial filter is applied in the signal, obtaining
Y = HX
5.3.3
(5.10)
Tests and Results
The methods were tested in two datasets: the P300 benchmark used in BCI competition III and our own dataset, created from our paradigm.
We conducted a first analysis on the BCI competition dataset to compare the performance of the four methods: FLD, Bayes, Template Coherence and Inner Coherence,
with and without the previous CSP filtering. We run 5 times a 6-fold cross validation.
We tested the normality of the results distribution, which is presented on figure
5.12. By the significance of the Kolmogorov-Smirnov test, we see none distribution
is normal.
Figure 5.12: Normality assessment of results for the BCI competition III dataset.
The boxplot in figure 5.13 shows the better performance of Bayes solution over our
proposed approaches.
The Friedman test, chose because we have more than two matched categories and
we do not assume the normality of the distributions, was used to rank the different
solutions. The ranks on figure 5.14 expose a better performance for the Template
54
CHAPTER 5. EXPERIMENTAL ANALYSIS
Figure 5.13: A boxplot comparing the four methods performances, with and without
filtering.
5.3. SIGNAL PROCESSING AND CLASSIFICATION
55
solution over the FLD, which is very commonly used in the state of the art. However,
the Bayes solution still have a better performance than any other approach.
Figure 5.14: Friedman ranks and significance.
A 2-related test was made to compare the significance on the differences of performance of Bayes and filtered Bayes, Bayes and Cohere, and Cohere and FLD. The
objective was to study if the filtered version of Bayes have significantly differences
to the simple version, if our method (Cohere) obtained a performance statistically
equal to Bayes, and if Cohere have achieved a better performance than a common
state of the art method, like FLD. The results are in figure 5.15, which compare the
ranks, and figure 5.16, which evaluates the significances.
As presented, there are no statistical significant difference between the normal and
filtered version of Bayes. Concerning to the Cohere-Bayes comparison, there is a
statistically significant difference, which means our method did not achieve a performance as good as the Bayes classifier. Relatively to the Cohere-FLD comparison, the
versions are statistically different, meaning Cohere achieved a better performance
by the ranking analysis.
The specificity and sensibility of each method are provided in figures 5.17 and 5.18.
The specificity values are very low for all the methods. This is related to the dataset
difficulty and the fact of the methods approach a single trial classification. The
results presented for the same dataset in the state of the art have a 73.5% accuracy
for a five trial averaging.
5.3.3.1
Our dataset
We preform the same analysis on the dataset collected with the experiments of the
system in four subjects: 3 male, 1 female. Ages and gender are specified in figure
56
CHAPTER 5. EXPERIMENTAL ANALYSIS
Figure 5.15: The ranks from the 2-related Wilcoxon test.
Figure 5.16: The significance result from the 2-related Wilcoxon test.
5.3. SIGNAL PROCESSING AND CLASSIFICATION
Figure 5.17: Specificity description.
Figure 5.18: Sensitivity description.
57
58
CHAPTER 5. EXPERIMENTAL ANALYSIS
5.19. The average age is 22 with a standard deviation of 3.
Figure 5.19: Population of the experiments of the system.
A normality test was preformed, which is presented on figure 5.20. By the significance of the Kolmogorov-Smirnov test, we see that only Bayes and InnerCohere
follow a normal distribution.
Figure 5.20: Normality assessment of results for the system’s dataset.
The boxplot in figure 5.21 shows the better performance of Bayes filtered solution
over our proposed approaches.
The Friedman test was done again on the system’s dataset to rank the different
solutions. The ranks on figure 5.22 show the filtered Bayes with the best rank,
followed by its non-filtered version.
To study the significance of the filtering effect on the Bayes performance, a 2-related
Wilcoxon test was performed with Bayes and filtered Bayes. Figure 5.23 and 5.24
show the result of this test.
The CSP filtering had a statistically significant improvement in the accuracy of the
Bayes algorithm.
5.3. SIGNAL PROCESSING AND CLASSIFICATION
59
Figure 5.21: A boxplot comparing the four methods performances, with and without
filtering, on the system’s dataset.
Figure 5.22: Friedman ranks and significance.
60
CHAPTER 5. EXPERIMENTAL ANALYSIS
Figure 5.23: The ranks from the 2-related Wilcoxon test between Bayes and fBayes.
Figure 5.24: The significance result from the 2-related Wilcoxon test.
Figure 5.25: Specificity description for system’s dataset.
5.4. CONCLUSIONS
61
Figure 5.26: Sensitivity description for system’s dataset.
The specificity and sensibility of each method are provided in figures 5.25 and 5.26.
The specificity and sensibility of the system’s dataset is higher than the BCI competition III dataset. This means that, although these kind of stimulus were never
used, their are more easily classified in single trial than the BCI competition III
dataset.
5.4
Conclusions
The development of a new paradigm on P300 stimulation was successfully achieved.
Preliminary tests were preformed in order to obtain the confidence to incorporate the
BCI in the system. After the apparent success of P300 elicitation by those stimulus,
the system paradigm was experimented with 4 methods for the signal classification:
two state of the art and two new approaches.
The signal was positively classified with state of the art results for single trial classification. The methods were compared and statistically validated not only in the
acquired signal, but in the BCI competition III dataset, which works as a benchmark
for P300 classification algorithms. The proposed methodologies do not have better
results than the state of the art ones. However, we believe there is place for further
exploration of frequency-domain approaches on P300 classification.
Chapter 6
Conclusions and Future Work
This project leaves an important contribution for the social rehabilitation under Virtual Reality environments using BCI techniques. The most remarkable achievement
is the validation of the elicitation of a P300 signal by moving social stimulus. That
is an aspect that has not been yet addressed by the research community and its confirmation opens a door for further studies with complex stimulus. We are studying
the possibility to publish our achievements in the creation of a new paradigm with
complex, high-level, motion stimulus.
The system itself is a sustained contribution of the project. An engineering solution
in which the versatility of the architecture allows a further utilization in therapies.
The therapist has full control to re-define the contents of the application to suit
better to the target subject needs. The button-press interface allows the application
to be used without an EEG, on a domestic environment, for example. This removes
the dependency on a complex and not user-friendly system, which is an important
interface for clinical tests and studies, but is a limitation for a recurrent use of the
application.
The size of the project and its versatility make some topics to be left open for future
work. The most clear event is the test of the application in the target population
and study its effects on their development.
The P300 classification has still some work to be done. We achieved performances
of 90% in single trial with our paradigm, which is a competitive result in the state of
the art. However, our ideas did not perform better than a bayesian classifier using
the raw signal (or filtered). Our bet on the frequency falled off the usual techniques,
which consider only the temporal characteristics of the signal. The results were not
the best, but they represent a new approch which need more time to be refined.
A system for rehabilitation would benefit to integrate a less invasive EEG. The setup
of the device (preparation of the scalp, channel placement, conductivity verification,
etc) is a limitation to use the system very often. With the evolution of the engineering, with wireless amplifiers and dry electrodes, such systems will start to emerge.
Some solutions are emerging already, for commercial use. In future work it would
be interesting to study its applicability in the setup of the project.
63
Bibliography
DSM-IV-TR symptom index. American Psychiatric Publishing, Inc., 2010.
S. Andrews, Ramaswamy Palaniappan, Andrew Teoh, and Loo chu Kiong. Enhancing p300 component by spectral power ratio principal components for a single trial
brain-computer interface. American Journal of Applied Sciences, 5(6):639 –644,
2008. ISSN 1546-9239. doi: 10.3844/ajassp.2008.639.644.
J.D. Bayliss. Use of the evoked potential p3 component for control in a virtual apartment. Neural Systems and Rehabilitation Engineering, IEEE Transactions on, 11
(2):113 –116, june 2003. ISSN 1534-4320. doi: 10.1109/TNSRE.2003.814438.
Jessica D Bayliss and Dana H Ballard. Single Trial P300 Recognition in a Virtual
Environment. Environment, 14627, 1998.
H. Cecotti and A. Graser. Convolutional neural networks for p300 detection
with application to brain-computer interfaces. Pattern Analysis and Machine
Intelligence, IEEE Transactions on, PP(99):1, 2010. ISSN 0162-8828. doi:
10.1109/TPAMI.2010.125.
Centers for Disease Control and Prevention. Autism spectrum disorders (asds), June
2011. URL http://www.cdc.gov/ncbddd/autism/index.html.
Tony Charman. Why is joint attention a pivotal skill in autism? Philosophical
transactions of the Royal Society of London. Series B, Biological sciences, 358
(1430):315–24, 2003.
S H Chen and V Bernard-Opitz. Comparison of personal and computer-assisted
instruction for children with autism. Mental retardation, 31(6):368–76, 1993.
L. Citi, R. Poli, C. Cinel, and F. Sepulveda. P300-based bci mouse with geneticallyoptimized analogue control. Neural Systems and Rehabilitation Engineering, IEEE
Transactions on, 16(1):51 –61, 2008. ISSN 1534-4320. doi: 10.1109/TNSRE.2007.
913184.
Alan Craig, William R. Sherman, and Jeffrey D. Will. Developing Virtual Reality
Applications: Foundations of Effective Design. Morgan Kaufmann, 2009. ISBN
0123749433.
Django Project. Django - the web framework for perfectionists with deadlines, May
2011. URL https://www.djangoproject.com/.
65
66
BIBLIOGRAPHY
E. Donchin, K.M. Spencer, and R. Wijesinghe. The mental prosthesis: assessing the
speed of a p300-based brain-computer interface. Rehabilitation Engineering, IEEE
Transactions on, 8(2):174 –179, 2000. ISSN 1063-6528. doi: 10.1109/86.847808.
Michael Donnerer and Anthony Steed. Using a p300 brain–computer interface in an
immersive virtual environment. Presence: Teleoper. Virtual Environ., 19:12–24.
ISSN 1054-7460. doi: http://dx.doi.org/10.1162/pres.19.1.12.
Drummond,
Katie.
Pentagon
preps
soldier
telepathy
push,
May
2009.
URL
http://www.wired.com/dangerroom/2009/05/
pentagon-preps-soldier-telepathy-push/.
Emotiv. Emotiv - you think, therefore, you can, January 2011. URL http://www.
emotiv.com.
Georg E Fabiani, Dennis J McFarland, Jonathan R Wolpaw, and Gert Pfurtscheller.
Conversion of eeg activity into cursor movement by a brain-computer interface
(bci). IEEE Transactions on Neural and Rehabilitation Systems Engineering, 12
(3):331–338, 2004.
L.A. Farwell and E. Donchin. Talking off the top of your head: toward a mental prosthesis utilizing event-related brain potentials. Electroencephalography
and Clinical Neurophysiology, 70(6):510 – 523, 1988. ISSN 0013-4694. doi:
DOI:10.1016/0013-4694(88)90149-6.
D R Gillette, G R Hayes, G D Abowd, J Cassell, R El Kaliouby, D Strickland, and
P T Weiss. Interactive technologies for autism. CHI 07 extended abstracts on
Human factors in computing systems CHI 07, page 2109, 2007.
E. A. Jones and E. G. Carr. Joint Attention in Children With Autism: Theory
and Intervention. Focus on Autism and Other Developmental Disabilities, 19(1):
13–26, January 2004. ISSN 1088-3576. doi: 10.1177/10883576040190010301. URL
http://foa.sagepub.com/cgi/content/abstract/19/1/13.
Emily A Jones, Edward G Carr, and Kathleen M Feeley. Multiple effects of joint
attention intervention for children with autism. Behavior Modification, 30(6):
782–834, 2006.
M. Kaper, P. Meinicke, U. Grossekathoefer, T. Lingner, and H. Ritter. Bci competition 2003-data set iib: support vector machines for the p300 speller paradigm.
Biomedical Engineering, IEEE Transactions on, 51(6):1073 –1076, 2004. ISSN
0018-9294. doi: 10.1109/TBME.2004.826698.
Connie Kasari, Stephanny Freeman, and Tanya Paparella. Joint attention and symbolic play in young children with autism: a randomized controlled intervention
study. Journal of child psychology and psychiatry, and allied disciplines, 47(6):
611–20, June 2006.
Mehdi Khosrow-Pour. Encyclopedia of Information Science and Technology. Information Science Reference, Hershey, USA, 2009. ISBN 1605660264.
BIBLIOGRAPHY
67
Rolf Klein. Moving Along a Street, volume 553, pages 123–140. Springer-Verlag,
1991.
Dean J. Krusienski and Jerry. J. Shih. Spectral components of the p300 speller
response in electrocorticography. In Neural Engineering (NER), 2011 5th International IEEE/EMBS Conference on, pages 282 –285, 27 2011-may 1 2011. doi:
10.1109/NER.2011.5910542.
R Leeb, R Scherer, C Keinrath, C Guger, and Gert Pfurtscheller. Exploring virtual
environments with an eeg-based bci through motor imagery. Biomed Tech Berl,
50(4):86–91, 2005.
A. Lenhardt, M. Kaper, and H.J. Ritter. An adaptive p300-based online brain
computer interface. Neural Systems and Rehabilitation Engineering, IEEE Transactions on, 16(2):121 –130, 2008. ISSN 1534-4320. doi: 10.1109/TNSRE.2007.
912816.
NeuroSky. Neurosky - brain wave sensors for every body, January 2011. URL
http://www.neurosky.com.
Nijholt, Anton. BCI for Games: A State of the Art Survey. In Scott Stevens
and Shirley Saldamarco, editors, Entertainment Computing - ICEC 2008, volume
5309 of Lecture Notes in Computer Science, pages 225–228. Springer Berlin /
Heidelberg, 2009.
I Noens, I van Berckelaer-Onnes, R Verpoorten, and G van Duijn. The ComFor: an instrument for the indication of augmentative communication in people with autism and intellectual disability. Journal of intellectual disability research : JIDR, 50(Pt 9):621–32, September 2006. ISSN 0964-2633. doi: 10.
1111/j.1365-2788.2006.00807.x. URL http://www.ncbi.nlm.nih.gov/pubmed/
16901289.
B.O. Peters, G. Pfurtscheller, and H. Flyvbjerg. Automatic differentiation of multichannel eeg signals. Biomedical Engineering, IEEE Transactions on, 48(1):111
–116, 2001. ISSN 0018-9294. doi: 10.1109/10.900270.
Gabriel Pires, Miguel Castelo-Branco, and Urbano Nunes. Visual p300-based bci to
steer a wheelchair: A bayesian approach. In Engineering in Medicine and Biology
Society, 2008. EMBS 2008. 30th Annual International Conference of the IEEE,
pages 658 –661, 2008. doi: 10.1109/IEMBS.2008.4649238.
A Plienis. Analyses of performance, behavior, and predictors for severely disturbed
children: A comparison of adult vs. computer instruction. Analysis and Intervention in Developmental Disabilities, 5(4):345–356, 1985.
M. Salvaris and F. Sepulveda. Wavelets and ensemble of flds for p300 classification.
In Neural Engineering, 2009. NER ’09. 4th International IEEE/EMBS Conference on, pages 339 –342, 2009. doi: 10.1109/NER.2009.5109302.
68
BIBLIOGRAPHY
A.E. Selim, M.A. Wahed, and Y.M. Kadah. Machine learning methodologies in p300
speller brain-computer interface systems. In Radio Science Conference, 2009.
NRSC 2009. National, pages 1 –9, 2009.
H. Serby, E. Yom-Tov, and G.F. Inbar. An improved p300-based brain-computer
interface. Neural Systems and Rehabilitation Engineering, IEEE Transactions on,
13(1):89 –98, 2005. ISSN 1534-4320. doi: 10.1109/TNSRE.2004.841878.
Ranganatha Sitaram, Andrea Caria, Ralf Veit, Tilman Gaber, Giuseppina Rota,
Andrea Kuebler, and Niels Birbaumer. fmri brain-computer interface: A tool
for neuroscientific research and treatment. Computational intelligence and neuroscience, (1):25487, 2007.
Kenneth C. Squires, Nancy K. Squires, and Steven A. Hillyard. Vertex evoked potentials in a rating-scale detection task: relation to signal probability. Behavioral
Biology, 13(1):21 – 34, 1975. ISSN 0091-6773. doi: DOI:10.1016/S0091-6773(75)
90748-8.
Struck, Christopher J. Group delay, January 2007. URL https://www.cjs-labs.
com/.
William O. Tatum. Handbook of Eeg Interpretation. Demos Medical Publishing,
2007. ISBN 1933864117.
University of Haifa. Virtual reality teaches autistic children street crossing, study
suggests, January 2008. URL http://www.sciencedaily.com/releases/2008/
01/080128113309.htm.
Christina Whalen, Laura Schreibman, and Brooke Ingersoll. The collateral effects
of joint attention training on social initiations, positive affect, imitation, and
spontaneous speech for young children with autism., 2006.
Haihong Zhang, Cuntai Guan, and Chuanchu Wang. Asynchronous p300-based
brain–computer interfaces: A computational approach with statistical models.
Biomedical Engineering, IEEE Transactions on, 55(6):1754 –1763, 2008. ISSN
0018-9294. doi: 10.1109/TBME.2008.919128.
Qibin Zhao, Liqing Zhang, and Andrzej Cichocki. Eeg-based asynchronous bci control of a car in 3d virtual reality environments. Chinese Science Bulletin, 54(1):
78–87, 2009.
Appendixes
69
Appendix A
Project Schedule
The project had an agnostic start compared to the usual master projects from the
Department of Informatics Engineering. Usually, every project has already been
defined and as a work plan pre-established. In this chase, the project was not
defined on the beginning of September. So, as shown in figure A.1, the first months
were spent in research and study about the different systems used in the project.
I followed some EEG experiences in IBILI to gain insight of the hardware, the
software and the processes currently used in the institute. I have also done some
research on the current BCI systems and applications. I have explored the Virtual
Reality solutions existing in IBILI, in terms of hardware and software development
frameworks. I have also studied different systems which were not used in the project,
such as the functional Magnetic Resonance Imaging (fMRI) and some eye-tracking
systems also present in IBILI.
Figure A.1: First semester Gantt plan.
In that phase I needed to gain insight also about neurological disorders where this
systems could be applied. So, I learned about the Autism Spectrum Disorders
(ASD), Attention Deficit / Hyperactivity Disorder (ADHD) and also Ambliopya. In
the end, the chosen target population was the Autism Spectrum Disorders.
This phase was followed by a time span for the definition of the project. This
was a difficult task, with several iterations. The interdisciplinary level achieved on
71
72
APPENDIX A. PROJECT SCHEDULE
the project took several meetings and discussions, in order to find the best way to
proceed.
Once the project had been defined, the different phases of the development of the
software started. The requirements analysis, the architecture, then the design and,
finally. the construction were initiated.
In parallel with this software oriented activities, I have studied deeper the state of
the art of the different areas involved in the project. Finally, the time for writing
the dissertation proposal took place.
The second semester took a slightly different path than originally planned. Figure
A.2 shows the original planning, and figure A.3 the final version.
Figure A.2: Second semester original Gantt plan.
Figure A.3: Second semester executed plan.
The main differences are related to the incorporation on the preliminary study on
virtual reality motion stimulus. Those tests include the development and validation
of a group of paradigms, which were not contemplated in the initial approach. Although it caused a time shift in the P300 classification study, we decided to include
the study to ensure the feasibility of the project, because such stimulus where never
used before, as explained further in the state of the art chapter.
73
Another issue that caused a delay on the project was the creation of the avatar
animations and the 3D content. This task required the learning of a complex 3D
modeling software (Autodesk 3DS Max) for character rigging, frame by frame. It
was, however, indispensable for the project, as it is a core issue of the application.
The application needed several iterations for maximization of the P300 elicited by its
stimulus. The first attempts failed and needed some reformulation. Each iteration
involved EEG testing and validation.
The P300 classification study have a smaller focus because of time limitations. However, we have still implemented a state of the art approach and tried some new ideas.
Appendix B
Project Documentation
Introduction
This document contains the documentations of the VRASDA - Virtual Reality
Application for Social Development in Autism. It should provide the reader
a full insight of all the components of the application. The document has a strong
technical component, because it aims to provide the information needed to ensure
the extendability of the work by another software engineer. If the reader is a user
with the goal of learn how to interact with the application, he should skip to chapter
B.1 - User Manual.
This document in organized by the following structure. After this introduction,
the chapter 4.2 presents the requirements specification, through a use-case modeling approach, including actors, use-cases and system-wide requirements. Then,
the chapter B.1 presents the architecture, database and design of the application.
Chapter B.1 contains the user guides for both administrators and users. Chapter
B.1 contains the testing preformed on the application.
B.1
Requirements Specification
Introduction
The requirements analysis followed the use case modeling process. In this method,
the requirements are associated with the use cases of the application, in a way that
each use case specify its requirements. The requirements that are transversal to the
application are covered in the system-wide requirements. This include requirements
like performance, scalability, etc., that cannot be specified directly in a use case.
75
76
APPENDIX B. PROJECT DOCUMENTATION
Actors
User
The User is the target of the rehabilitation intervention. The User is embed in the
virtual environment, interacts through a Brain Computer Interface (BCI) and, in
the ultimate level, corresponds to a child with an Autism Spectrum Disorder (ASD).
Administrator
This actor represents the user that configures the experiment. This configuration,
that is done before each experiment, is done by a third party user. This actor is
usual a therapist or a pediatric medical doctor.
System
This actor represents the application itself, which has some specific use cases.
Use Cases
This section will enumerate the use cases of the application, from the use case
diagram displayed in figure B.1.
Manage Users
• Actor: Administrator
• Brief Description: The administrator has the responsibility of manage the
users of the application. This includes creation, edition and elimination of
users from the application database. The user information must include:
name; age; development quotient; intelligence quotient; diagnosis (principal
and secondary); evaluation results for ADR-R, ADOS and DSM-IV; and an
observations’ field.
• Assumptions: The administrator is someone responsible for the application
and with some insight about the users.
• Pre-Conditions: None
• Post-Conditions:
– Successful Completion: The users were updated in the database.
– Failure Completion: The users information remains the same.
• Basic Flow of Events:
B.1. REQUIREMENTS SPECIFICATION
Figure B.1: Use case diagram of the application.
77
78
APPENDIX B. PROJECT DOCUMENTATION
– Create User:
1. Fill the fields about the user;
2. Click on ’create’ button.
– Remove User:
1. Select the user from the users’ dropdown list;
2. Click on ’remove’ button.
– Edit User:
1. Select the user from the users’ dropdown list;
2. Click on ’load’ button;
3. Change the user’s information fields;
4. Click on ’save’ button.
• Alternative Flow of Events:
1. At any time the administrator can click the ’clear’ button and the management screen will reset to the original state.
• Mockups:
Some mockups for this use case are presented in figure B.2.
Figure B.2: Manage users screen mockup.
B.1. REQUIREMENTS SPECIFICATION
79
Manage Scenarios
• Actor: Administrator
• Brief Description: The administrator must be provided of a way to create
new scenarios to be used in the application. To ensure the modularity of the
project, the scenarios are developed in a 3D modeling software and exported
to one of the file formats supported by the application (see section B.1). The
application must have an interface to register the different scenarios, allowing
the addition, removal and edition of the scenarios. Such interface must record
the scenario name and its location on the system.
• Assumptions: Scenarios’ files are not moved after added to the application.
• Pre-Conditions: None
• Post-Conditions:
– Successful Completion: The scenarios were updated in the database.
– Failure Completion: The scenarios information remains the same.
• Basic Flow of Events:
– Create Scenario:
1. Fill the fields about the scenario;
2. Click on ’create’ button.
– Remove Scenario:
1. Select the user from the scenarios’ dropdown list;
2. Click on ’remove’ button.
– Edit Scenario:
1. Select the scenario from the scenarios’ dropdown list;
2. Click on ’load’ button;
3. Change the scenario’s information fields;
4. Click on ’save’ button.
• Alternative Flow of Events:
1. At any time the administrator can click the ’clear’ button and the management screen will reset to the original state.
• Mockups:
Some mockups for this use case are presented in figure B.3.
80
APPENDIX B. PROJECT DOCUMENTATION
Figure B.3: Manage scenarios screen mockup.
Manage Avatars
• Actor: Administrator
• Brief Description: The human characters used by the application are created in a 3D modeling software and then exported to the Cal3D format (see
sections B.1). The application must provide a way for the administrator to
add new avatars to the application, remove or edit the existent ones. The
most important info to include is a name to the avatar and a reference to its
configuration file in the system.
• Assumptions: The avatars are not moved from place after added to the
application.
• Pre-Conditions: When adding a new avatar it is already in the Cal3D format.
• Post-Conditions:
– Successful Completion: The avatars were updated in the database.
– Failure Completion: The avatars information remains the same.
• Basic Flow of Events:
– Create Avatar:
1. Fill the fields about the avatar (name and file);
2. Click on ’create’ button.
– Remove Avatar:
1. Select the avatar from the avatars’ dropdown list;
2. Click on ’remove’ button.
B.1. REQUIREMENTS SPECIFICATION
81
– Edit Avatar:
1. Select the avatar from the scenarios’ dropdown list;
2. Click on ’load’ button;
3. Change the avatar’s information fields;
4. Click on ’save’ button.
• Alternative Flow of Events:
1. At any time the administrator can click the ’clear’ button and the management screen will reset to the original state.
• Mockups:
Some mockups for this use case are presented in figure B.5.
Figure B.4: Manage avatars screen mockup.
Manage Targets
• Actor: Administrator
• Brief Description: The application uses 3D objects in the tasks the users do.
Those objects, called targets, are created in a 3D modeling software and then
exported to one of the supported formats (see sections B.1). The application
must provide a way for the administrator to add, remove and edit those 3D
objects. The most important info to include is a name to the object and a
reference to its file in the system.
• Assumptions: The target files are not moved from place after added to the
application.
• Pre-Conditions: None.
82
APPENDIX B. PROJECT DOCUMENTATION
• Post-Conditions:
– Successful Completion: The targets were updated in the database.
– Failure Completion: The targets information remains the same.
• Basic Flow of Events:
– Create Target:
1. Fill the fields about the target (name and file);
2. Click on ’create’ button.
– Remove Target:
1. Select the target from the targets’ dropdown list;
2. Click on ’remove’ button.
– Edit Target:
1. Select the targets from the target’ dropdown list;
2. Click on ’load’ button;
3. Change the target’s information fields;
4. Click on ’save’ button.
• Alternative Flow of Events:
1. At any time the administrator can click the ’clear’ button and the management screen will reset to the original state.
• Mockups:
Some mockups for this use case are presented in figure B.5.
Figure B.5: Manage targets screen mockup.
B.1. REQUIREMENTS SPECIFICATION
83
Manage Clues
• Actor: Administrator
• Brief Description: Although the avatars perform several animations, it is
needed some specific animation in the application: the attention clues. An
attention clue is a movement one makes to direct attention of other to a specific
target. We can think of pointing of a good attention clue example. To give
the application a better detail in the animations, the same clue animation
should be provided in different directions. Imagine the pointing animation.
The animation should exist in pointing forward, to the left, to the right, etc.
This way, when the application needs to make the avatar point to a specific
target, it chooses the animation closer to the target and do a small rotation in
the avatar to correct the positioning. If the avatar points only in one direction,
this rotation must be much more pronounced and becoming less friendly.
The directions of the animation are specified in degrees, has shown in figure
B.6.
Figure B.6: Specification of the directions for the attention clues animation.
• Assumptions: When adding a new clue, the avatars already have those animations configured.
• Pre-Conditions: None.
• Post-Conditions:
– Successful Completion: The clues were updated in the database and
will be used in the tasks.
– Failure Completion: The clues information remains the same.
• Basic Flow of Events:
– Create Clue:
1. Fill the name field;
84
APPENDIX B. PROJECT DOCUMENTATION
2. Insert directions, by clicking ’Add New’ on directions;
3. Click on ’create’ button.
– Remove Clue:
1. Select the clue from the clues’ dropdown list;
2. Click on ’remove’ button.
– Edit Clue:
1. Select the clue from the clues’ dropdown list;
2. Click on ’load’ button;
3. Change the clue’s information fields, including directions;
4. Click on ’save’ button.
• Alternative Flow of Events:
1. Adding wrong direction:
(a) The user introduces a direction smaller than 0 or bigger than 180;
(b) An error message is shown;
(c) The direction is not added.
2. At any time the administrator can click the ’clear’ button and the management screen will reset to the original state.
• Mockups:
Some mockups for this use case are presented in figure B.7.
Manage Tasks
• Actor: Administrator
• Brief Description: The most important part of the application is the tasks
the users execute. There are two types of tasks: The type one, where the user
is asked to identify an avatar, in a small crowd, which is making an attention
clue. The other avatars are making different animations. The type two, where
the user is asked to identify the object the user is making the attention clue
towards. E.g., an avatar is pointing to a ball in the middle of a row, where
are several toys. The user has to be able to identify the correct toy, the ball,
between the others.
To a better modularity, the administrator can create this tasks, specifying the
scenario, the avatars, the clue, the targets, etc. This use case defines how the
administrator can do it.
• Assumptions: None.
B.1. REQUIREMENTS SPECIFICATION
85
Figure B.7: Manage clues screen mockup.
• Pre-Conditions: None.
• Post-Conditions:
– Successful Completion: The tasks were updated in the database.
– Failure Completion: The taks information remains the same.
• Basic Flow of Events:
– Create task 1:
1. Choose type 1, in the type droplist;
2. Fill the remaining task fields, like name, clue, scenario, instructions,
etc.
3. Insert avatars by clicking ’Add New’ on avatars;
4. Click on ’create’ button.
– Create task 2:
1. Choose type 2, in the type droplist;
2. Fill the remaining task fields, like name, clue, scenario, instructions,
avatar, etc.
3. Insert targets by clicking ’Add New’ on targets;
4. Click on ’create’ button.
– Remove Task:
1. Select the task from the tasks’ dropdown list;
86
APPENDIX B. PROJECT DOCUMENTATION
2. Click on ’remove’ button.
– Edit Task:
1. Select the task from the tasks’ dropdown list;
2. Click on ’load’ button;
3. Change the task’s information fields;
4. Click on ’save’ button.
• Alternative Flow of Events:
1. At any time the administrator can click the ’clear’ button and the management screen will reset to the original state.
• Mockups:
Some mockups for this use case are presented in figure B.8 and B.9.
Figure B.8: Manage tasks of type 1 screen mockup.
Manage Stories/Chapters
• Actor: Administrator
B.1. REQUIREMENTS SPECIFICATION
Figure B.9: Manage tasks of type 2 screen mockup.
87
88
APPENDIX B. PROJECT DOCUMENTATION
• Brief Description: In the attempt of keeping the user longer executing tasks,
the tasks become parts of stories. The administrator can define stories since
the cover to each chapter. It is very important to have audio versions of the
text, so younger children can also interact actively with the application. An
interface to define the stories must be provided to the administrators, so each
story can be changed and improved in the future. Each chapter have a task
associated so the user can also “virtually live” the story.
• Assumptions: None.
• Pre-Conditions: None.
• Post-Conditions:
– Successful Completion: The stories were updated in the database.
– Failure Completion: The stories information remains the same.
• Basic Flow of Events:
– Create Story:
1. Fill the fields about the story, like the name and the cover image.
2. Click on ’create’ button.
– Create Chapter:
1. Select the story the chapter belongs to;
2. Fill the remaining chapter fields, like name, number, text, voice, task,
etc.
3. Click on ’create’ button.
– Remove Story/Chapter:
1. Select the story/chapter from the stories/chapters’ dropdown list;
2. Click on ’remove’ button.
– Edit Story/Chapter:
1. Select the story/chapter from the stories/chapters’ dropdown list;
2. Click on ’load’ button;
3. Change the story/chapter’s information fields;
4. Click on ’save’ button.
• Alternative Flow of Events:
1. At any time the administrator can click the ’clear’ button and the management screen will reset to the original state.
• Mockups:
Some mockups for this use case are presented in figure B.10 and B.11.
B.1. REQUIREMENTS SPECIFICATION
Figure B.10: Manage stories screen mockup.
Figure B.11: Manage chapters screen mockup.
89
90
APPENDIX B. PROJECT DOCUMENTATION
Start Task 1 / Start Task 2
• Actor: Administrator
• Brief Description: The administrator must be provided of a way to execute
a task without playing a story. An interface is provided so he can choose a
task and execute it, specifying the number of trials and repetitions.
• Assumptions: None.
• Pre-Conditions: None.
• Post-Conditions:
– Successful Completion: The task executed successfully.
– Failure Completion: The task did not run.
• Basic Flow of Events:
1. Select the task;
2. Insert the number of trials and repetitions;
3. Click the button ’start’.
• Mockups:
A mockup for this use case is presented in figure B.12.
Figure B.12: Start task screen mockup.
Identify User
• Actor: Administrator
• Brief Description: This use case describes the need of the administrator
identify the user which will be interacting with the application. To ease this
process, there should be the possibility of search by name and by ID.
• Assumptions: None.
• Pre-Conditions: The user to identify already exists in the database.
• Post-Conditions:
B.1. REQUIREMENTS SPECIFICATION
91
– Successful Completion: The user identified is used as reference for all
the application (tasks, statistics, etc).
– Failure Completion: The previous user (or none) remains identified.
• Basic Flow of Events:
– Search by ID:
1. Insert user ID in the ID field;
2. Click on the search button next to the field;
3. The users’ droplist contains now the user with the specified ID.
– Search by Name:
1. Insert name to search in the name field;
2. Click on the search button next to the field;
3. The users’ droplist contains now the users which match the name
searched.
– Select the User:
1. The users’ droplist contains the users available to choose;
2. Select the correct user from the droplist;
3. Click the button ’select’.
• Mockups:
A mockup for this use case is presented in figure B.13.
Figure B.13: Identify user screen mockup.
View User Statistics
• Actor: Administrator
• Brief Description: It is important that the administrator can track the
evolution of the user. This way, it must be possible for him to view a chart
showing the developments of the user accuracy along the time for both the
tasks.
92
APPENDIX B. PROJECT DOCUMENTATION
• Assumptions: None.
• Pre-Conditions: The user was already identified.
• Post-Conditions:
– Successful Completion: A chart is shown to the administrator containing the evolution of the user for both tasks.
– Failure Completion: The chart is not shown.
• Basic Flow of Events:
1. The chart is shown to the administrator;
2. The administrator presses any key to go back.
• Mockups:
A mockup for this use case is presented in figure B.14.
Figure B.14: View User Statistics screen mockup.
Execute Task
• Actor: User
• Brief Description: The main use case to the user is to execute the tasks.
The task is presented as a Virtual Reality environment with human avatars
and 3d objects as targets. The system must provide an interaction system,
which for the base objectives of the application is a Brain-Computer Interface
but can also be a button-press mechanism, for instance. The different elements
of the task should be activated randomly at different times. Then, when the
user’s target element is activated he should specify it, using the interaction
device.
• Assumptions: None.
• Pre-Conditions: None.
• Post-Conditions:
B.1. REQUIREMENTS SPECIFICATION
93
– Successful Completion: The user identified correctly the target element.
– Failure Completion: The user was not able to identify the target element.
• Basic Flow of Events:
1. Show task instructions to the user;
2. Run the task;
3. User responds when watches target element activated;
4. Show result to user.
Play Story
• Actor: User
• Brief Description: The user can play the stories created by the administrator. To do that a book-like interface should be created, from which the user
navigates through the story and plays the tasks associated to the chapters.
• Assumptions: None.
• Pre-Conditions: The story was previously created by the administrator.
• Post-Conditions:
– Successful Completion: The user reaches the end of the story.
• Basic Flow of Events:
1. The cover is shown to the user, with the title and the image of the story;
2. He navigates by chapter. Each chapter contains a task associated;
3. The user executes the task and moves to the next chapter until he reaches
the end of the story.
• Mockups:
A mockup for this use case is presented in figure B.15.
Classify Neurological Signal
• Actor: System
• Brief Description: For the Brain-Computer Interface, the EEG signal captured in real-time from the user must be analyzed in order to find an Event
Related Potential (the P300), which is the marker that the user wants to identify a specific target element. This signal processing is a core component of
the system, and will be deeply covered in the design and architecture sections.
94
APPENDIX B. PROJECT DOCUMENTATION
Figure B.15: Play Story screen mockups.
• Assumptions: The EEG system is well applied in the user and the channels
are all connected with a good impedance.
• Pre-Conditions: The application is marking the EEG every time an element
is activated.
• Post-Conditions:
– Successful Completion: The signal is classified and the element was
well identified.
– Failure Completion: The system detects a wrong element or cannot
detect any element at all.
• Basic Flow of Events:
1. Read the signal for a complete trial;
2. Pre-process the signal (for noise removal, e.g.).
3. Chunk the signal by element;
4. Classify the chunks in ERP or not-ERP;
5. Send result to application.
System-wide Requirements
Functional Requirements
Registering
The system must keep track of users, for later provide reports of performance. Therefore, there must be a registration and identification module, which are responsibility
B.1. REQUIREMENTS SPECIFICATION
95
of the administrator. This induces the necessity of a database, to keep information
independent of the executions of the application.
Reporting
Being a rehabilitation system, keeping track of the evolution of the users are crucial.
So,there must be the possibility of reporting to the administrator the evolution
statistics, crossing the results of the different sessions of the same user.
Usability Requirements
Ease of Learning and Understandability
A user with Autistic Spectrum Disorder should be able to understand each task in
short time. This may vary from the cognitive level of the user, which is a motivation
to improve the response to this requirement. The instructions must be visual and
auditory, to achieve a easier understanding by the user.
User Satisfaction
The objective of this rehabilitation software is to be used frequently by the user, so
the rehabilitation can take effect. A play-like environment have to be created (the
play stories above described) to try to captivate the user for longer periods. This
solution is measured by the time the user stays in the application.
Reliability Requirements
Accuracy
To use Brain-Computer Interfaces through the P300 signal the different modules of
the system must be synchronized. Being a real time system raises synchronization
and time resolution concerns, which have to be covered in the architecture and
design of the system. Section B.1 explains this issue and how it was covered.
Performance Requirements
Response times
Virtual Reality Environments are very demanding in terms of computational resources. The hardware where the application runs must be able to render the virtual
environment and the avatars actions creating no perceptible lag.
Supportability
Virtual Reality set up
96
APPENDIX B. PROJECT DOCUMENTATION
It must be considered two different set ups to the VE. One using an Head-Mounted
Display (HMD) and another where the scene is projected on a screen. The second
set up may be used to rehabilitate users less tolerant to the first set up.
Conclusion
The requirements presented in this chapter are addressed in the following ones,
which describe the application architecture and design.
Architecture Notebook
Introduction
This chapter presents the technical specifications of the systems, from its architecture and design to its implementation.
Architecture
This section describes the architecture of the system. In the figure B.16 it is shown
the whole system in an high level perspective.
Figure B.16: Architecture Diagram (High Level)
The system has four main modules: the data acquisition, the data processing, the
virtual reality application and the database. The description of each of this modules
follows below.
• Data Acquisition: The data acquisition involves two phases: in the first
phase, the EEG data is captured by the electrodes in the cap, amplified and
B.1. REQUIREMENTS SPECIFICATION
97
sent to the recording software provided by the amplifier. In the second phase,
a matlab acquisition module connects the amplifier recording software by a
TCP/IP connection and reads the data from it to the matlab. Figure B.17
describes this architecture.
Figure B.17: EEG Data Acquisition Architecture
• Data Processing: This module does the pre-processing of the signal to remove noise and artifacts. Then, the feature extraction and selection techniques
are applied to gather the characteristic to use in the classification. The last
step corresponds to a machine learning technique that is able to classify the
signal into P300 or not P300. Then, the classification result is sent to the
last module, the virtual reality application, by a TCP/IP connection. This
communication protocol was selected to ensure a large integration possibilities
with several different technologies. The usage of a network protocol permits
the system to be distributed and separated in different computers. Real-time
Data processing and Virtual Environment rendering are two heavy operations
that can benefit from large dedicated resources. Using the TCP/IP protocol
we can separate completely both parts of the system.
• Virtual Reality Application: This is the last module of the system, the one
that directly interacts with the user. Its main function is to display the user
tasks while sending a synchronized trigger to the data acquisition module, in
order to provide the data processing module a way to match the signal and
the events provided in the virtual reality application. One last function of this
module is to receive the classification results from the data processing module
and use it to re-enforce the user experience.
• Database: The database module purpose is to keep permanently the information about the users, tasks, results, etc. The database uses a ORM
(Object-Relational Model) system, which uses the data mapper pattern to automatically map the object models into a SQL database. The ORM system
used is from Django (Django Project, 2011). Django is a web framework in
Python, in which the developer had already experience. Only the database
system from the Django framework was installed and used, once the web fea-
98
APPENDIX B. PROJECT DOCUMENTATION
tures were not needed. A deeper analysis and the Entity-Relationship model
from the database is presented in section B.1.
Internal Architecture
The internal architecture of the application can be divided into three layers: Presentation, Logic and Database. Figure B.18 presents these architecture.
Figure B.18: Internal Architecture of the application.
In a bottom-up analysis, the Database layer consists of the part of the software with
connects the database to the application. It includes the models of each element and
the DatabaseInterface classes, which establishes a bridge between the logic application and the database. In the same layer is the Sensors Middleware, responsible for
receive and process input from external devices, namely the EEG and the Virtual
Reality Sensors. The data, after processed, is passed up to the Task Manager from
the Logic layer, which creates the appropriate responses in the Presentation to respond to the input. The Logic layer consists of the brain of the application. It can
be split into two main modules: the administration, which is responsible to handle
the addition, edition and removal of the contents of the application. In includes
the validation of the content loaded for rendering; and the Task Manager, which
creates the tasks, executes them, creates the 3D scene, animate the avatars, etc.
The Task Manager does the main processing in the Virtual Reality module of the
system, once it coordinates the tasks, animates the contents, create the responses
to stimulus, etc. Finally, the Presentation layer, which contemplates the output
interface with the user. It main module is the Scene Rendering, which is mostly
provided by the framework and includes the presentation of the scenes (3D models,
animations, rewards, etc). The content is rendered by the Vizard framework. The
details of each layer are specified in B.1.
B.1. REQUIREMENTS SPECIFICATION
99
Technologies
The EEG acquisition system is from BrainProducts:
• Electrodes: actiCap - a cap with active electrodes based on high-quality
Ag/AgCl sensors with a new type of integrated noise subtraction circuits delivering even lower noise levels than the ”normal” active electrodes achieves.
Figure B.19 presents this cap.
Figure B.19: actiCap - Picture from BrainProducts
• Amplifier: V-amp - a sixteen channel amplifier with the ability of record
several types of signals, such as EEG, EOG, ECG, EMG and the full range of
evoked potentials, including brain stem potentials. Figure B.20 presents this
amplifier.
Figure B.20: V-amp - Picture from BrainProducts
• Recorder (Software): BrainVision Recorder for V-Amp - A recorder software package with a Remote Data Access module which allows the remote
access to the data via TCP/IP.
The Data Processing Module is implemented in Matlab language and uses the
TCP/IP/UDP and the PRTools toolboxes.
Finally, the last module (the virtual reality application) is implemented using the
Vizard toolkit, from WorldViz. This toolkit provides an interface for virtual reality
100
APPENDIX B. PROJECT DOCUMENTATION
environments development in python. This toolkit provides an Integrated Development Environment that eases the management of the Virtual Reality project.
Some features provided by this software:
• Extensive 3D model formats: .wrl (VRML2/97), .flt (Open Flight), .3ds (3D
Studio Max), .txp (multi-threaded TerraPage loader), .geo (Carbon Graphics),
.bsp (Quake3 world layers), .md2 (Quake animation models), .ac (AC3D),.obj
(Alias Wavefront), .lwo/lw (Light Wave), .pfb (Performer), the OSG’s native
.osg/.ive format, DirectX .x format, and .3dc point cloud.
• Character (human biped) formats: 3D Max Character Studio (via 3rd party
exporter) and Cal3D .cfg files.
• Raster image formats include: .rgb/.rgba, .dds, .tga, .gif, .bmp, .tif, .jpg, .pic,
.pnm/.pgm/.pbm, and .png, jp2 (jpeg2000). Support for compressed and mipmapped images provided in .dds format.
• Audio modes: mono, stereo, 3D; supported formats: .wav, .mp3, .au., .wma,
.mid, and any other DirectShow supported format.
• Video textures: Any DirectShow compatible video format can be used as a
texture, including .avi, .mpg, .wmv, animated GIFs, and more. Access to
frame-by-frame control of video is available. Videos with alpha channels are
supported.
• Support for nearly all standard virtual reality devices , including trackers, 3D
displays, HMDs (head mounted displays), and many other peripheral devices.
The following is a list of just some of the hardware supported by Vizard.
• Full collision detection capabilities between either the viewpoint and any node
on the scene graph or between any two arbitrary mesh nodes on the scene
graph.
• Interoperability issue: only supports Windows as Operating System.
The final application is exported to an executable which can run in any computer
with operating system Windows XP or higher.
The application is developed under an enterprise license and an additional library
of human characters is also available in IBILI.
Database
As already mentioned, the application uses an ORM database. This way, the object
models (classes) implemented in the database are automatically mapped into SQL
tables. The ORM is currently mapping the objects to a SQLite database, for an
easier transportation and no need of changing configuration between computers. If
latter emerges the need of evolving the system to a more efficient database system,
it simply involves to change the configuration of the application.
B.1. REQUIREMENTS SPECIFICATION
101
Figure B.21: E-R Diagram showing the tables and its relations in the database.
Figure B.21 contains the Entity-Relationship model of the database. The table
Users saves the info of the users, as specified in the use case ’Manage Users’. The
tables Avatars, Scenarios, Elements save the info of the respective 3D models. The
table Tasks contains the information about the tasks to be performed by the users.
This table saves both type 1 and 2 tasks. The tables TaskAvatars and TaskElements
relate the avatars and elements to the tasks. The table TaskRuns is used to save
the results of the executions of the tasks. Finally, there is the Stories and Chapters
tables, with the information needed for the use case ’Play Stories’.
Design
The Virtual Reality application follows an architectural pattern named Model-ViewController. This pattern splits the structure of an application in three parts, with
distinct responsibilities, and specifies the interactions between them. The figure
B.22 displays this pattern with the correspondent relationships.
The separability of this patterns induces several advantages to an application architecture, providing a decoupled development. The Model part represents the objects
of the database, such as user, avatar, element, etc. The View part represents the displays of the applications, the interfaces. The interfaces present informations about
the models, so they have a direct access to that part. Finally, the Controller part
represents the logic of the application. It directly changes the View and the Model
102
APPENDIX B. PROJECT DOCUMENTATION
Figure B.22: Model-View-Controller pattern diagram.
parts, like changing the information about a user (model part) or displaying the
avatars in a scene (view part).
The View part includes the the classes responsible for what the final user sees: the
Scene class and all its children, including the menus, the story and the tasks (which
contemplates scenarios, avatars and elements). This module accesses the Model
module, from where it gathers information, for example, about the task to design
(which scenario to present, which avatars to load, etc). The class diagram for the
scenes is presented in figure B.23.
The Model part includes the classes for the models. The class diagram for this part
is not presented, because it strictly follows the E-R model structure. Each class
represents a table with the respect fields as attributes.
The Controller part is the brain of the application. It is responsible to display the
views and react to the user interactions. This way, it is this module which creates
the tasks and manages the user responses to them. The design of the tasks and IO
module is presented in figure B.24. To achieve a better modularity, the application
was designed to have different forms of input. The base form is the BCI method,
where the user user its brain to interact to the application, but it can also use a
joystick or simply a button press interface, where the user simply presses a button
when it wants to interact. To be able to support different input devices was used a
bridge design pattern. The bridge separates the task (having an abstract class and
several child implementations) and the TaskIO (having an abstract IO with several
child implementations). This way, adding another task or a new IO mechanism will
not interfere with anything else. This can all be checked in the figure B.24.
Functional Testing
This section present the tests defined to validate the application. These tests assess
the expected behavior of the application and help define if the application is implemented correctly. It is a good and important way to validate the application and
identify problems.
B.1. REQUIREMENTS SPECIFICATION
103
Figure B.23: Class diagram for the scenes used in the project.
Figure B.24: Class diagram for the task and the IO mechanisms using the bridge
design pattern.
104
APPENDIX B. PROJECT DOCUMENTATION
Table B.1: Tests defined for the application
Num
1
2
3
4
Name
Add
User
Identify
User
Edit
User
Remove
User
Inputs
Expected Output
1. Choose
option
”Users”
on
the
Admin Menu;
2. Fill the required
fields in the form;
3. Click button ”Save”.
1. Success message appears;
2. A user is created in
the database.
1. Choose option ”Identify user”;
2. Enter the user ID;
3. Click button ”Load”.
1. Success message appears, showing the
name of the user;
1. Choose
option
”Users” on Admin
Panel;
2. Select a user form
the combobox and
click ”Load”;
3. Change user fields as
will;
4. Click button ”Save”.
1. Success message appears;
2. User changes were
registered in the
database.
1. Choose
option
”Users” on Admin
Panel;
2. Select a user form
the combobox;
3. Click button ”Remove”.
1. Success message appears;
2. User is removed from
the database.
B.1. REQUIREMENTS SPECIFICATION
5
6
7
8
Add,
Edit
and Removal
Generalization
Execute
task
without
files
Change
avatar
animations
Set Up
Task 1
105
1. Follow test 1, 3 and 4
for any of the following content:
• Elements;
• Scenarios;
• Avatars;
• Clues;
• Stories;
• Chapters;
• Tasks.
1. The same behavior of
the original test is
expected but related
to the content.
1. Move the art folder
of the project;
2. Execute a task 1 or
2.
1. An error message
appears saying the
content cannot be
found;
2. The application continues its execution.
1. Change avatar configuration file to remove a target animation;
2. Execute a task of
type 1 where the
avatar is used.
1. The task does not
run and a message
appears saying the
avatar
animations
list is invalid;
2. The application returns to main menu
and resumes it normal execution.
1. Choose option ”Start
Task”;
2. Follow test ”2 - Identify User”;
3. Select the scenario,
the attention clue,
the
number
of
avatars and repetitions for the task
1;
4. Click button ”Start”.
1. The chosen scenario
is used in the task;
2. The chosen attention
clue is used by one
human avatar;
3. The number of human characters correspond with the selected;
4. The task repeats the
number specified of
times.
106
APPENDIX B. PROJECT DOCUMENTATION
9
10
11
Set Up
Task 2
Show
Result
After
Task
Show
User
Report
1. Choose option ”Start
Task”;
2. Follow test ”2 - Identify User”;
3. Select the scenario,
the attention clue,
the number of targets and repetitions
for the task 2;
4. Click button ”Start”.
1. The chosen scenario
is used in the task;
2. The chosen attention
clue is used by the
human avatar;
3. The number of targets correspond with
the selected;
4. The task repeats the
number specified of
times.
1. Follow test ”8 - Set
Up Task 1” or ”9 Set Up Task 2”;
2. Execute the task until the end;
1. The system shows
(1) a good reward
associated with the
user or (2) a bad
reward associated to
the user, whether
the user completed
the task successfully
or unsuccessfully, respectively;
2. The
result
was
registered in the
database, associated
to the user.
1. Select option ”User
Report”;
2. Follow test ”2 - Identify User”;
1. A report must be
shown
identifying
the user last results.
User Manual
This chapter presents the software application for the end users. It explains the
usage details of the system, how to configure and run the experiments from the
administrator point of view and how to execute them from the end user perspective.
B.1. REQUIREMENTS SPECIFICATION
107
Administration
This section is specific to the administrator. It explains the application interfaces for
the administrator. It starts by introducing the 3D models formats and then jumps
to the application’s user guide. The 3D Models section is extremely important to
the administrator understand the compatible formats to use in the application and
how they are applied in the tasks.
3D Models
Introduction
3D models are elements used in virtual environment to re-create reality. From a
static solid sphere to an animated human being, every representation embed in the
virtual environment represents a 3D model.
For a larger adaptability to the users and to ensure expandability to the application,
new 3D models can be added to the application. This way, if one needs to add a
new human avatar he can do it without changing the application. The application
uses three different models, each of them used in a proper context. Those models
are:
• Environment scenarios
• Animated human characters
• Target objects
This document explains the guidelines that each different model must follow to be
successfully inserted into the application.
3D Modeling Software
There are several software applications that provide the 3D modeling capabilities
required. From proprietary to free, a wide range of applications cover the needs of
this project. The project is independent from the 3D modeling software used, so the
user gets to choose which one wants to perform the modeling and animation. The
user must simply ensure that, whatever the chosen application is, it can export the
models into one of the supported formats recognized by the application (see section
B.1).
Several comparisons can be found in literature, so this section has not the goal to
compare the state of the art of 3D modeling software. A good comparison analysis
performed by the University of California, Santa Barbara, USA can be found in
http://www.create.ucsb.edu/ATON/00.10/3d-tools-report.pdf.
To ease the development of the 3D modelings, a proprietary package containing several human characters from WorldViz was used. WorldViz uses and provides several
contents from Autodesk 3ds Max. It also provides exporters for the OpenSceneGraph and Cal3D formats. Therefore, this was the 3D modeling software used in
the development of the application.
108
APPENDIX B. PROJECT DOCUMENTATION
Supported Formats
The application was developed using the Vizard development software, from WorldViz. This software provides the import of several formats for 3D models. The majority of these formats are supported by the application. The following list present
those formats:
• OpenSceneGraph (.ive, .osg): OpenSceneGraph is a native ASCII format
that is interpreted by the system on the load to do the generation of the models
(extension: .osg). This is a slow process, which is only convenient when the
loaded object is edited after loaded. There is also a binary version which
is pre-compiled, achieving faster loading times (extension: .ive). Because the
scenarios are static and are not edited after loading, the binary version is a
better option. Both formats are supported and can be used.
• 3D Studio Max (.3ds): 3DS is one of the file formats used by the Autodesk
3ds Max 3D modeling, animation and rendering software. Users can also use
this format on the application.
• VRML97 (.wrl): The Virtual Reality Modeling Language is supported by
the application, an can be used by files with the .wrl extension.
• Wavefront (.obj): The Wavefront .obj file format is a standard 3D object
file format created for use with Wavefront’s Advanced Visualizer. Object Files
are text based files supporting both polygonal and free-form geometry (curves
and surfaces). The .obj files can also be used on the application.
To the avatars, which are much complexer models, a different format is used. The
format used is the Cal3D:
“Cal3D is a skeletal based 3d character animation library written in C++ in a
platform/graphic API-independent way” (Cal3D project homepage).
The avatar and its animations can be developed in any 3D modeling software and
then exported to this format (Cal3D). The format definition divides the different
parts of the character by different files, having a configuration file specifying the
files used in each function, like the skeleton file, the mesh file, the materials and the
animations the avatar performs.
Required Models
This section describes the context in which the models are used in the application,
the formats and configurations required for each type.
• Environment scenarios
The environment scenarios are used both in the Identify Joint Attention Clue
and the Follow Joint Attention Clue tasks. They represent the environment
world in which the human avatars and the targets will appear. Different
scenarios may induce different levels of difficulty to the execution of the task.
The possibility of create and add new scenarios to the application assumes a
preponderant role in the application.
B.1. REQUIREMENTS SPECIFICATION
109
The scenarios should be created in a 3D modeling software and exported to one
of the supported formats, referred in the section B.1. To add a new scenario
to the application, please refer to the section B.1.
• Animated Human Characters
The human characters represent the social layer of the application. Their
realism is very important, both in physical aspect and body movements. It is
important that the application provides the users to the possibility of change
and add the avatars and its animations in an independent way, not altering
the application itself.
To provide this functionality, the 3D human characters the application uses
are in the Cal3D format. To ensure a good separability of the resources used
by the application, the following guideline should be followed when adding an
avatar:
1. Create an avatar folder under /resources/art/avatars/. Give a distinct
name to the folder, by which the avatar will be identified. Example:
avatar1.
2. Put into that folder all the files used by the avatar: the mesh, the skeleton,
the animations, etc.
3. Correctly configure the .cfg file, with the correct references to the resources and animations.
For documentation related to adding an avatar, the reader should proceed
to section B.1. Information regarded the avatars’ animations is presented in
section B.1.
• Target Objects
The target objects are used in the second task as the target of the attention
clues performed by the human characters. Those are supposed to be simple
3D models, nothing so complex as an human character or a hole scenario. The
formats supported are the same as for the scenarios (the referred in section
B.1). The addition of a new target follows a similar process to the scenarios’.
1. Create a folder under /resources/art/targets/ with the target name;
2. Add the target file(s) to the folder;
Section B.1 explains the process of adding the target to the application.
Conclusion
The formats used by the application are fully spread in the state of the art 3D modeling software. Some of the 3D modeling software do not implement the exporters
to the required formats as main features but provide plugins to do it.
There was an important effort in the development of the project to keep the 3D
models and its animations apart from the application itself. The admin has full
110
APPENDIX B. PROJECT DOCUMENTATION
control to create, edit or remove scenarios, avatars, animations and target object.
This document specified step-by-step all the processes to do it.
Administrator User Guide
This section presents a step-by-step tutorial through the application. It is divided
in subsections referring specific parts of the application.
Main Menu
The figure B.25 presents the main menu. The several options include: administration, user identification, user statistics, start a task and stories. Each option is
covered in the following subsections.
Figure B.25: Main Menu screen
Identify User
The figure B.26 presents the user identification screen. Here, the admin specifies
the user that will be using the application on the following tasks. For that, he can
search the user by id or name. Then, select the correct user from in the selection
box. The user will be active and his name will show in the main menu.
Figure B.26: Identify User screen
User Statistics
If the administrator wants to follow the performance of a specific user along the
time, he can go to User Statistics a a chart will be displayed with the performance
B.1. REQUIREMENTS SPECIFICATION
111
statistics of the current user. It combines the performance of both tasks. The figure
B.27 shows an example of feature.
Figure B.27: User Statistics screen
Start Task 1/2
For a faster set up of a experiment, the application provides the options Task 1 and
Task 2 in the main menu. Those options lead to a screen similar to B.28. Here, the
admin can choose the task to run, the number of trials and repetitions, and start it.
Figure B.28: Start Task 1 screen
Stories
This option leads to the end-user environment: the story. The admin, by choosing
this option, is prompted for selecting a story. After that, the end-user takes place
(see section B.1).
Administration Menu
The figure B.29 presents the administration menu. The several options include the
management of users, scenarios, targets, avatars, clues, stories and chapters. Each
option is covered in the following subsections.
Manage Users
The Manage Users screen (figure B.30) provides the possibility of create, edit and
remove users. To create a new user, just fill the form with the related information
and click create. To edit or remove a user, select a user from the selection box in the
112
APPENDIX B. PROJECT DOCUMENTATION
Figure B.29: Administration Menu screen
Figure B.30: Manage Users screen
B.1. REQUIREMENTS SPECIFICATION
113
top of the screen. Click on Remove to delete it or Load to edit it. After loading,
the fields in the form can be edited and then saved again.
Manage Scenarios
The management of the scenarios is a little different from the users’ management
because it includes the addition of an external file. Figure B.31 presents the interface
for the management. The functionalities of Create, Edit and Remove are similar to
the Manage Users screen.
To add a new scenario, the user is encouraged to follow the procedure bellow:
1. Create a folder to the path /resources/art/scenarios/ with the name of the
scenario;
2. Put the scenario’s file inside the created folder;
3. Click on browse in the screen and select the file.
If the file is damaged or is corrupted, a message is shown and the file is not added.
Figure B.31: Manage Scenarios screen
Manage Avatars
The management of the avatars is similar to the management of scenarios. Figure
B.32 presents the interface.
To add a new avatar, the user is encouraged to follow the procedure bellow:
1. Create a folder to the path /resources/art/avatars/ with the name of the
avatar;
2. Put the avatar’s files inside the created folder, including the configuration file
and all the resources it uses (mesh, materials, animations, etc);
3. Ensure the configuration file (.cfg) is correctly defined;
4. Click on browse in the screen and select the configuration file.
If the configuration file has any misconfiguration, a message is shown and the avatar
is not added.
114
APPENDIX B. PROJECT DOCUMENTATION
Figure B.32: Manage Avatars screen
Manage Attention Clues
The attention clues are specific animations the avatars must have. Each animation
has two main properties: the name and the directions. The name is an unique
identifier to the animation. The directions correspond to the different angles from
the left of the avatar in which the animation is performed.
The figure B.33 shows an example of five directions: 0, 45, 90, 135 and 180. If a
clue example requires this five directions, there must be, on the avatar’s configuration file, five animation files with the names example 0, example 45, example 90,
example 135 and example 180.
Figure B.33: Sample directions for user animations.
The figure B.34 presents the interface to manage the clues. It is responsibility of the
user to ensure the animations are made respecting these directions. The application
validates the existence of animations with the names required, but is impossible to
verify the animation itself.
Manage Targets
The management of the targets is similar to the management of scenarios. See figure
B.35 to a display of the management interface. To add a new target, the user is
encouraged to follow the procedure bellow:
B.1. REQUIREMENTS SPECIFICATION
115
Figure B.34: Manage Clues screen
1. Create a folder to the path /resources/art/targets/ with the name of the target;
2. Put the target’s file inside the created folder;
3. Click on browse in the screen and select the file.
If the file is damaged or is corrupted, a message is shown and the file is not added.
Figure B.35: Manage Targets screen
Manage Tasks
The tasks combine the different elements inserted by the several interfaces. Here the
admin specifies the type of the task (1 or 2), the scenario, the avatars, the targets
and the clue. This interface is presented in B.36.
Manage Stories
The management of stories, presented in figure B.37, has a special focus of the content. The application is completely independent of the content, so is responsibility
of the admin to specify the title, image and voice version of the title to the story.
This is directly presented to the final user in the story interface.
Manage Chapters
Each chapter of the story contains a title (text and voice), a content(text and voice)
and an image. Also, it gets associated with a task, which will be executed by the
user. The interface B.37 provide the means to do this management.
116
APPENDIX B. PROJECT DOCUMENTATION
Figure B.36: Manage Stories screen
Figure B.37: Manage Stories screen
Figure B.38: Manage Chapters screen
B.1. REQUIREMENTS SPECIFICATION
117
End-User Guide
The End-User interact directly in a story environment. The first interface is composed by the cover of the book with the title and image. An avatar is also presented,
which is the partner who will tell the story. He starts to tell the name of the story.
Figure B.39 shows an example of such interface.
Figure B.39: Story book cover interface
By clicking in the book, the user jumps into the first chapter. Here the screen is
composed by the book opened, having in the left page the chapter’s title and its
content, and in the right page the chapter’s image. Figure B.40 shows this scheme.
The avatar reads the whole chapter.
Figure B.40: Story chapter interface
118
APPENDIX B. PROJECT DOCUMENTATION
To execute the task associated with the chapter, the user should click on the task
image. He is then transported to the Virtual Reality world, where he executes the
task.
The navigation between tasks is performed by clicking in the bottom corners of the
book, simulating a page-flip.