1
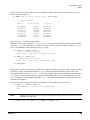
HP-UX KWDB Kernel Debugger Guide
HP 9000 and Integrity Server Computer Systems
E0207
Version 3.1.8
Manufacturing Part Number : 5991-7465
October 2006
Printed in the US
© Copyright 2006 Hewlett-Packard Development Company, L.P.
Legal Notices
This document contains information which is protected by copyright. All rights are reserved. Reproduction,
adaption, or translation without prior written permission is prohibited, except as allowed under the copyright
laws.
Restricted Rights Legend. Use, duplication or disclosure by the U.S. Government Department of Defense is
subject to restrictions as set forth in paragraph (b)(3)(ii) of the Rights in Technical Data and Software clause
in FA 52.227-703.
Copyright ©, 1997–2006 Hewlett-Packard Development Company L.P. All rights reserved. Reproduction,
adaption, or translation of this document without prior written permission is prohibited, except as allowed
under the copyright laws.
Copyright ©, 1988, The Santa Cruz Operation
Copyright ©, 1979, 1980, 1983, 1986, 1993. The Regents of the University of California
Copyright ©, 1980, 1984 AT&T, Inc.
Copyright ©, 1986, 1992 Sun Microsystems, Inc.
Copyright ©, 1980, 1984, 1986 Novell, Inc.
This software and documentation is based in part on the Fourth Berkeley Software Distribution under license
from the Regents of the University of California.
Warranty. A copy of the specific warranty terms applicable to your Hewlett-Packard product and replacement
parts can be obtained from your local Sales and Service Office.
Hewlett-Packard makes no warranty of any kind with regard to this manual, including, but
not limited to, the implied warranties of merchantability and fitness for a particular
purpose.
Hewlett-Packard shall not be liable for errors contained herein or direct, indirect, special, incidental or
consequential damages in connection with the furnishing, performance, or use of this material.
Printing History
New editions of this manual will incorporate all material updated since the previous edition. The manual
printing date and part number indicate its current edition. The printing date changes when a new edition is
printed. (minor corrections that are incorporated at a reprinting do not cause the date to change.) The manual
part number changes when extensive technical changes are incorporated.
Edition/Part Number/Date
First/5971-4809/September 2004
Second/5971-4809/May 2005
Third/5991-7465/October 2006
2
Contents
1. Introduction
2. Setting Up KWDB for Remote Debugging
KWDB Setup . . . . . . . . . . . . . . . . . . . . . . . . . . . . . . . . . . . . . . . . . . . . . . . . . . . . . . . . . . . . . . . . . . . . . . .
Communication Methods . . . . . . . . . . . . . . . . . . . . . . . . . . . . . . . . . . . . . . . . . . . . . . . . . . . . . . . . . . . .
How to Select the Communication Method . . . . . . . . . . . . . . . . . . . . . . . . . . . . . . . . . . . . . . . . . . . . . .
Determining Machine Class and Operating System . . . . . . . . . . . . . . . . . . . . . . . . . . . . . . . . . . . . . .
Set Up Instructions. . . . . . . . . . . . . . . . . . . . . . . . . . . . . . . . . . . . . . . . . . . . . . . . . . . . . . . . . . . . . . . . .
LAN Cards . . . . . . . . . . . . . . . . . . . . . . . . . . . . . . . . . . . . . . . . . . . . . . . . . . . . . . . . . . . . . . . . . . . . . . . . .
LAN Cards for the PA-RISC Architecture. . . . . . . . . . . . . . . . . . . . . . . . . . . . . . . . . . . . . . . . . . . . . . .
LAN Cards for the IPF Architecture . . . . . . . . . . . . . . . . . . . . . . . . . . . . . . . . . . . . . . . . . . . . . . . . . . .
How to Obtain a LAN Card . . . . . . . . . . . . . . . . . . . . . . . . . . . . . . . . . . . . . . . . . . . . . . . . . . . . . . . . . .
KWDB Communications Server . . . . . . . . . . . . . . . . . . . . . . . . . . . . . . . . . . . . . . . . . . . . . . . . . . . . . . . .
Which Communications Server to Use . . . . . . . . . . . . . . . . . . . . . . . . . . . . . . . . . . . . . . . . . . . . . . . . .
How to Start the Communications Server . . . . . . . . . . . . . . . . . . . . . . . . . . . . . . . . . . . . . . . . . . . . . .
How to Ensure Communications Server is Running . . . . . . . . . . . . . . . . . . . . . . . . . . . . . . . . . . . . . .
Communications Server Log Files . . . . . . . . . . . . . . . . . . . . . . . . . . . . . . . . . . . . . . . . . . . . . . . . . . . . .
Starting Communications Server at Boot Time . . . . . . . . . . . . . . . . . . . . . . . . . . . . . . . . . . . . . . . . . .
Communications Server Configuration File . . . . . . . . . . . . . . . . . . . . . . . . . . . . . . . . . . . . . . . . . . . . .
kwdb_config_kern Utility . . . . . . . . . . . . . . . . . . . . . . . . . . . . . . . . . . . . . . . . . . . . . . . . . . . . . . . . . . . . .
kwdbctl Utility . . . . . . . . . . . . . . . . . . . . . . . . . . . . . . . . . . . . . . . . . . . . . . . . . . . . . . . . . . . . . . . . . . . . . .
20
20
21
22
24
29
29
34
35
37
37
37
38
38
38
38
40
42
3. Getting Started with Remote Debugging
Before Starting a KWDB Debug Section . . . . . . . . . . . . . . . . . . . . . . . . . . . . . . . . . . . . . . . . . . . . . . . . .
Starting KWDB Debug Session. . . . . . . . . . . . . . . . . . . . . . . . . . . . . . . . . . . . . . . . . . . . . . . . . . . . . . . . .
Starting the KWDB Debugger . . . . . . . . . . . . . . . . . . . . . . . . . . . . . . . . . . . . . . . . . . . . . . . . . . . . . . . .
Booting and Attaching the Target System for Debugging . . . . . . . . . . . . . . . . . . . . . . . . . . . . . . . . . .
Debugging the Kernel . . . . . . . . . . . . . . . . . . . . . . . . . . . . . . . . . . . . . . . . . . . . . . . . . . . . . . . . . . . . . . . .
Controlling Kernel Execution Using KWDB . . . . . . . . . . . . . . . . . . . . . . . . . . . . . . . . . . . . . . . . . . . . .
Compiling Code for Source Level Debugging . . . . . . . . . . . . . . . . . . . . . . . . . . . . . . . . . . . . . . . . . . . .
Online (Runtime) Initiailization of the Kernel Debugger . . . . . . . . . . . . . . . . . . . . . . . . . . . . . . . . . . . .
Crashtime Kernel Debugging Using KWDB debugger . . . . . . . . . . . . . . . . . . . . . . . . . . . . . . . . . . . . . .
Setting up a system for Crashtime Debugging . . . . . . . . . . . . . . . . . . . . . . . . . . . . . . . . . . . . . . . . . . .
44
45
45
46
66
66
67
68
71
71
4. Command Reference
KWDB Commands . . . . . . . . . . . . . . . . . . . . . . . . . . . . . . . . . . . . . . . . . . . . . . . . . . . . . . . . . . . . . . . . . . .
Beginning a Debugging Session . . . . . . . . . . . . . . . . . . . . . . . . . . . . . . . . . . . . . . . . . . . . . . . . . . . . . . .
Ending a Debugging Session . . . . . . . . . . . . . . . . . . . . . . . . . . . . . . . . . . . . . . . . . . . . . . . . . . . . . . . . .
Getting Help . . . . . . . . . . . . . . . . . . . . . . . . . . . . . . . . . . . . . . . . . . . . . . . . . . . . . . . . . . . . . . . . . . . . . .
Specifying Multiple Commands in the Same Command Line . . . . . . . . . . . . . . . . . . . . . . . . . . . . . . .
Command Completion . . . . . . . . . . . . . . . . . . . . . . . . . . . . . . . . . . . . . . . . . . . . . . . . . . . . . . . . . . . . . .
Executing KWDB Commands Automatically at Startup . . . . . . . . . . . . . . . . . . . . . . . . . . . . . . . . . . .
Reading KWDB Commands From a File . . . . . . . . . . . . . . . . . . . . . . . . . . . . . . . . . . . . . . . . . . . . . . . .
Logging KWDB Output to a File . . . . . . . . . . . . . . . . . . . . . . . . . . . . . . . . . . . . . . . . . . . . . . . . . . . . . .
Turning Off Output to the User’s Terminal . . . . . . . . . . . . . . . . . . . . . . . . . . . . . . . . . . . . . . . . . . . . .
Enable/Disable Writing to the Target . . . . . . . . . . . . . . . . . . . . . . . . . . . . . . . . . . . . . . . . . . . . . . . . . .
78
78
79
80
81
81
81
82
82
82
82
3
Contents
Defining an Alias for Commands . . . . . . . . . . . . . . . . . . . . . . . . . . . . . . . . . . . . . . . . . . . . . . . . . . . . . . 83
Source Information . . . . . . . . . . . . . . . . . . . . . . . . . . . . . . . . . . . . . . . . . . . . . . . . . . . . . . . . . . . . . . . . . 83
Controlling KWDB Using set Command . . . . . . . . . . . . . . . . . . . . . . . . . . . . . . . . . . . . . . . . . . . . . . . . 83
Calling a Kernel Function From the Command Line . . . . . . . . . . . . . . . . . . . . . . . . . . . . . . . . . . . . . . 84
Invoking Commands or Shell Scripts . . . . . . . . . . . . . . . . . . . . . . . . . . . . . . . . . . . . . . . . . . . . . . . . . . 85
Using Breakpoints . . . . . . . . . . . . . . . . . . . . . . . . . . . . . . . . . . . . . . . . . . . . . . . . . . . . . . . . . . . . . . . . . 85
Setting Watchpoints . . . . . . . . . . . . . . . . . . . . . . . . . . . . . . . . . . . . . . . . . . . . . . . . . . . . . . . . . . . . . . . . 90
Stepping and Continuing . . . . . . . . . . . . . . . . . . . . . . . . . . . . . . . . . . . . . . . . . . . . . . . . . . . . . . . . . . . . 91
Examining Source Code . . . . . . . . . . . . . . . . . . . . . . . . . . . . . . . . . . . . . . . . . . . . . . . . . . . . . . . . . . . . . 94
Examining Assembly Code . . . . . . . . . . . . . . . . . . . . . . . . . . . . . . . . . . . . . . . . . . . . . . . . . . . . . . . . . . . 95
Examining Variables . . . . . . . . . . . . . . . . . . . . . . . . . . . . . . . . . . . . . . . . . . . . . . . . . . . . . . . . . . . . . . . 96
Examining Memory . . . . . . . . . . . . . . . . . . . . . . . . . . . . . . . . . . . . . . . . . . . . . . . . . . . . . . . . . . . . . . . . 99
Examining Registers . . . . . . . . . . . . . . . . . . . . . . . . . . . . . . . . . . . . . . . . . . . . . . . . . . . . . . . . . . . . . . 101
Navigating the Stack . . . . . . . . . . . . . . . . . . . . . . . . . . . . . . . . . . . . . . . . . . . . . . . . . . . . . . . . . . . . . . 102
Displaying Symbol Table Information . . . . . . . . . . . . . . . . . . . . . . . . . . . . . . . . . . . . . . . . . . . . . . . . . 104
Trapping Panics . . . . . . . . . . . . . . . . . . . . . . . . . . . . . . . . . . . . . . . . . . . . . . . . . . . . . . . . . . . . . . . . . . 106
Trapping Panics: Crashtime Kernel Debugging . . . . . . . . . . . . . . . . . . . . . . . . . . . . . . . . . . . . . . . . . 106
Debugging Multiple Processor Systems . . . . . . . . . . . . . . . . . . . . . . . . . . . . . . . . . . . . . . . . . . . . . . . 106
Debugging DLKMs . . . . . . . . . . . . . . . . . . . . . . . . . . . . . . . . . . . . . . . . . . . . . . . . . . . . . . . . . . . . . . . . 107
Assembly Level Debugging Using On-Console Debugger . . . . . . . . . . . . . . . . . . . . . . . . . . . . . . . . . 109
Debugging PA-RISC 11.0 and Earlier Kernels with KWDB . . . . . . . . . . . . . . . . . . . . . . . . . . . . . . . 113
Debugging Code with KWDB . . . . . . . . . . . . . . . . . . . . . . . . . . . . . . . . . . . . . . . . . . . . . . . . . . . . . . . . 114
Q4 Commands . . . . . . . . . . . . . . . . . . . . . . . . . . . . . . . . . . . . . . . . . . . . . . . . . . . . . . . . . . . . . . . . . . . . . 116
Command Structure . . . . . . . . . . . . . . . . . . . . . . . . . . . . . . . . . . . . . . . . . . . . . . . . . . . . . . . . . . . . . . . 117
Data Types . . . . . . . . . . . . . . . . . . . . . . . . . . . . . . . . . . . . . . . . . . . . . . . . . . . . . . . . . . . . . . . . . . . . . . 117
Numbers . . . . . . . . . . . . . . . . . . . . . . . . . . . . . . . . . . . . . . . . . . . . . . . . . . . . . . . . . . . . . . . . . . . . . . . . 117
Addresses . . . . . . . . . . . . . . . . . . . . . . . . . . . . . . . . . . . . . . . . . . . . . . . . . . . . . . . . . . . . . . . . . . . . . . . 117
KWDB Q4 Mode . . . . . . . . . . . . . . . . . . . . . . . . . . . . . . . . . . . . . . . . . . . . . . . . . . . . . . . . . . . . . . . . . . 118
Enumerants. . . . . . . . . . . . . . . . . . . . . . . . . . . . . . . . . . . . . . . . . . . . . . . . . . . . . . . . . . . . . . . . . . . . . . 118
Variables . . . . . . . . . . . . . . . . . . . . . . . . . . . . . . . . . . . . . . . . . . . . . . . . . . . . . . . . . . . . . . . . . . . . . . . . 118
Expressions . . . . . . . . . . . . . . . . . . . . . . . . . . . . . . . . . . . . . . . . . . . . . . . . . . . . . . . . . . . . . . . . . . . . . . 119
Synthetic Fields . . . . . . . . . . . . . . . . . . . . . . . . . . . . . . . . . . . . . . . . . . . . . . . . . . . . . . . . . . . . . . . . . . 121
Custom Field Formats . . . . . . . . . . . . . . . . . . . . . . . . . . . . . . . . . . . . . . . . . . . . . . . . . . . . . . . . . . . . . 122
History References . . . . . . . . . . . . . . . . . . . . . . . . . . . . . . . . . . . . . . . . . . . . . . . . . . . . . . . . . . . . . . . . 122
Redirecting Input and Output . . . . . . . . . . . . . . . . . . . . . . . . . . . . . . . . . . . . . . . . . . . . . . . . . . . . . . . 122
Command Completion . . . . . . . . . . . . . . . . . . . . . . . . . . . . . . . . . . . . . . . . . . . . . . . . . . . . . . . . . . . . . 123
Getting Version Information . . . . . . . . . . . . . . . . . . . . . . . . . . . . . . . . . . . . . . . . . . . . . . . . . . . . . . . . 123
Getting Help . . . . . . . . . . . . . . . . . . . . . . . . . . . . . . . . . . . . . . . . . . . . . . . . . . . . . . . . . . . . . . . . . . . . . 123
Searching the Catalog of Data Types . . . . . . . . . . . . . . . . . . . . . . . . . . . . . . . . . . . . . . . . . . . . . . . . . 124
Listing the Fields in a Data Structure . . . . . . . . . . . . . . . . . . . . . . . . . . . . . . . . . . . . . . . . . . . . . . . . 124
Handling Typename Clashes . . . . . . . . . . . . . . . . . . . . . . . . . . . . . . . . . . . . . . . . . . . . . . . . . . . . . . . . 127
Listing Kernel Symbols . . . . . . . . . . . . . . . . . . . . . . . . . . . . . . . . . . . . . . . . . . . . . . . . . . . . . . . . . . . . 129
Disassembling Functions . . . . . . . . . . . . . . . . . . . . . . . . . . . . . . . . . . . . . . . . . . . . . . . . . . . . . . . . . . . 129
Translating Virtual Addresses. . . . . . . . . . . . . . . . . . . . . . . . . . . . . . . . . . . . . . . . . . . . . . . . . . . . . . . 132
Tracing Stacks . . . . . . . . . . . . . . . . . . . . . . . . . . . . . . . . . . . . . . . . . . . . . . . . . . . . . . . . . . . . . . . . . . . 134
Setting Context . . . . . . . . . . . . . . . . . . . . . . . . . . . . . . . . . . . . . . . . . . . . . . . . . . . . . . . . . . . . . . . . . . . 140
4
Contents
Loading Data From the Crash Dump/Kernel Memory . . . . . . . . . . . . . . . . . . . . . . . . . . . . . . . . . . . .
Naming Piles of Data . . . . . . . . . . . . . . . . . . . . . . . . . . . . . . . . . . . . . . . . . . . . . . . . . . . . . . . . . . . . . .
Saving Piles of Data . . . . . . . . . . . . . . . . . . . . . . . . . . . . . . . . . . . . . . . . . . . . . . . . . . . . . . . . . . . . . . .
Saving and Restoring Piles on a File . . . . . . . . . . . . . . . . . . . . . . . . . . . . . . . . . . . . . . . . . . . . . . . . . .
Getting a History of the Loads . . . . . . . . . . . . . . . . . . . . . . . . . . . . . . . . . . . . . . . . . . . . . . . . . . . . . . .
Recalling Old Piles . . . . . . . . . . . . . . . . . . . . . . . . . . . . . . . . . . . . . . . . . . . . . . . . . . . . . . . . . . . . . . . .
Merging Piles . . . . . . . . . . . . . . . . . . . . . . . . . . . . . . . . . . . . . . . . . . . . . . . . . . . . . . . . . . . . . . . . . . . .
Forgetting Piles . . . . . . . . . . . . . . . . . . . . . . . . . . . . . . . . . . . . . . . . . . . . . . . . . . . . . . . . . . . . . . . . . . .
Saving and Restoring State . . . . . . . . . . . . . . . . . . . . . . . . . . . . . . . . . . . . . . . . . . . . . . . . . . . . . . . . .
Printing Structure Fields . . . . . . . . . . . . . . . . . . . . . . . . . . . . . . . . . . . . . . . . . . . . . . . . . . . . . . . . . . .
Printing Structure From an Address. . . . . . . . . . . . . . . . . . . . . . . . . . . . . . . . . . . . . . . . . . . . . . . . . .
Examining Memory . . . . . . . . . . . . . . . . . . . . . . . . . . . . . . . . . . . . . . . . . . . . . . . . . . . . . . . . . . . . . . .
Writing into Kernel Files or Memory . . . . . . . . . . . . . . . . . . . . . . . . . . . . . . . . . . . . . . . . . . . . . . . . .
Evaluating Expressions . . . . . . . . . . . . . . . . . . . . . . . . . . . . . . . . . . . . . . . . . . . . . . . . . . . . . . . . . . . .
Listing Constants . . . . . . . . . . . . . . . . . . . . . . . . . . . . . . . . . . . . . . . . . . . . . . . . . . . . . . . . . . . . . . . . .
Listing Variables . . . . . . . . . . . . . . . . . . . . . . . . . . . . . . . . . . . . . . . . . . . . . . . . . . . . . . . . . . . . . . . . . .
Destroying Variables. . . . . . . . . . . . . . . . . . . . . . . . . . . . . . . . . . . . . . . . . . . . . . . . . . . . . . . . . . . . . . .
Database Operations . . . . . . . . . . . . . . . . . . . . . . . . . . . . . . . . . . . . . . . . . . . . . . . . . . . . . . . . . . . . . .
Database Operations . . . . . . . . . . . . . . . . . . . . . . . . . . . . . . . . . . . . . . . . . . . . . . . . . . . . . . . . . . . . . .
Including PERL Program Files . . . . . . . . . . . . . . . . . . . . . . . . . . . . . . . . . . . . . . . . . . . . . . . . . . . . . .
Running PERL Programs. . . . . . . . . . . . . . . . . . . . . . . . . . . . . . . . . . . . . . . . . . . . . . . . . . . . . . . . . . .
Adding Type Information . . . . . . . . . . . . . . . . . . . . . . . . . . . . . . . . . . . . . . . . . . . . . . . . . . . . . . . . . . .
Listing DLKM Modules . . . . . . . . . . . . . . . . . . . . . . . . . . . . . . . . . . . . . . . . . . . . . . . . . . . . . . . . . . . .
Processing DLKM Modules . . . . . . . . . . . . . . . . . . . . . . . . . . . . . . . . . . . . . . . . . . . . . . . . . . . . . . . . .
The show envvars Command . . . . . . . . . . . . . . . . . . . . . . . . . . . . . . . . . . . . . . . . . . . . . . . . . . . . . . . .
141
143
144
145
146
147
147
147
148
148
150
152
154
157
157
158
158
159
160
160
161
161
162
162
164
5. Analyzing Crash Dumps
What Kind of Dump is This? . . . . . . . . . . . . . . . . . . . . . . . . . . . . . . . . . . . . . . . . . . . . . . . . . . . . . . . . . .
Crashes . . . . . . . . . . . . . . . . . . . . . . . . . . . . . . . . . . . . . . . . . . . . . . . . . . . . . . . . . . . . . . . . . . . . . . . . . . .
Systems with Threads . . . . . . . . . . . . . . . . . . . . . . . . . . . . . . . . . . . . . . . . . . . . . . . . . . . . . . . . . . . . .
Hangs . . . . . . . . . . . . . . . . . . . . . . . . . . . . . . . . . . . . . . . . . . . . . . . . . . . . . . . . . . . . . . . . . . . . . . . . . . . .
Check Status of System . . . . . . . . . . . . . . . . . . . . . . . . . . . . . . . . . . . . . . . . . . . . . . . . . . . . . . . . . . . .
Analyze Run Queues. . . . . . . . . . . . . . . . . . . . . . . . . . . . . . . . . . . . . . . . . . . . . . . . . . . . . . . . . . . . . . .
Analyze Threads . . . . . . . . . . . . . . . . . . . . . . . . . . . . . . . . . . . . . . . . . . . . . . . . . . . . . . . . . . . . . . . . . .
Check Key System Daemons . . . . . . . . . . . . . . . . . . . . . . . . . . . . . . . . . . . . . . . . . . . . . . . . . . . . . . . .
Determine if Memory is Low . . . . . . . . . . . . . . . . . . . . . . . . . . . . . . . . . . . . . . . . . . . . . . . . . . . . . . . .
What to Do if System Does Not Look Hung . . . . . . . . . . . . . . . . . . . . . . . . . . . . . . . . . . . . . . . . . . . .
Stack Tracing Tricks . . . . . . . . . . . . . . . . . . . . . . . . . . . . . . . . . . . . . . . . . . . . . . . . . . . . . . . . . . . . . . . .
Trace Every Crash Event . . . . . . . . . . . . . . . . . . . . . . . . . . . . . . . . . . . . . . . . . . . . . . . . . . . . . . . . . . .
Trace Every Processor on a PA System . . . . . . . . . . . . . . . . . . . . . . . . . . . . . . . . . . . . . . . . . . . . . . . .
Trace Every Processor on IPF System. . . . . . . . . . . . . . . . . . . . . . . . . . . . . . . . . . . . . . . . . . . . . . . . .
Trace Every Process . . . . . . . . . . . . . . . . . . . . . . . . . . . . . . . . . . . . . . . . . . . . . . . . . . . . . . . . . . . . . . .
Other Techniques . . . . . . . . . . . . . . . . . . . . . . . . . . . . . . . . . . . . . . . . . . . . . . . . . . . . . . . . . . . . . . . . . . .
Print Console Message Buffer . . . . . . . . . . . . . . . . . . . . . . . . . . . . . . . . . . . . . . . . . . . . . . . . . . . . . . .
When Did the System Crash? . . . . . . . . . . . . . . . . . . . . . . . . . . . . . . . . . . . . . . . . . . . . . . . . . . . . . . .
How Long Had the System Been Up Before the Crash . . . . . . . . . . . . . . . . . . . . . . . . . . . . . . . . . . .
168
170
171
173
173
175
177
185
186
187
188
188
189
190
191
193
193
194
194
5
Contents
What Was the Load Average?. . . . . . . . . . . . . . . . . . . . . . . . . . . . . . . . . . . . . . . . . . . . . . . . . . . . . . . .
What Command Was a Certain Process Running? . . . . . . . . . . . . . . . . . . . . . . . . . . . . . . . . . . . . . . .
Where Is Per-Processor Information Kept? . . . . . . . . . . . . . . . . . . . . . . . . . . . . . . . . . . . . . . . . . . . . .
Where Are the Crash Events Kept?. . . . . . . . . . . . . . . . . . . . . . . . . . . . . . . . . . . . . . . . . . . . . . . . . . .
Load the Entire Process Table . . . . . . . . . . . . . . . . . . . . . . . . . . . . . . . . . . . . . . . . . . . . . . . . . . . . . . .
Load the Entire Stack Unwind Table . . . . . . . . . . . . . . . . . . . . . . . . . . . . . . . . . . . . . . . . . . . . . . . . .
How Was the Kernel Built? . . . . . . . . . . . . . . . . . . . . . . . . . . . . . . . . . . . . . . . . . . . . . . . . . . . . . . . . .
Did Anyone Write to /dev/[k]mem? . . . . . . . . . . . . . . . . . . . . . . . . . . . . . . . . . . . . . . . . . . . . . . . . . . .
Remote Dump Analysis . . . . . . . . . . . . . . . . . . . . . . . . . . . . . . . . . . . . . . . . . . . . . . . . . . . . . . . . . . . . . .
194
194
195
196
196
196
197
198
199
6. Live Memory Analysis
Starting KWDB to Perform Live Memory Analysis . . . . . . . . . . . . . . . . . . . . . . . . . . . . . . . . . . . . . . . .
Running Commands to Perform Live Memory Analysis . . . . . . . . . . . . . . . . . . . . . . . . . . . . . . . . . . . .
Running PERL Scripts on a Live System . . . . . . . . . . . . . . . . . . . . . . . . . . . . . . . . . . . . . . . . . . . . . . . .
Reading From Locked Pages . . . . . . . . . . . . . . . . . . . . . . . . . . . . . . . . . . . . . . . . . . . . . . . . . . . . . . . . . .
Unsupported Commands . . . . . . . . . . . . . . . . . . . . . . . . . . . . . . . . . . . . . . . . . . . . . . . . . . . . . . . . . . . . .
202
203
209
210
211
7. KWDB PERL Programming Reference
How KWDB Works With PERL. . . . . . . . . . . . . . . . . . . . . . . . . . . . . . . . . . . . . . . . . . . . . . . . . . . . . . . .
Verify PERL is Installed. . . . . . . . . . . . . . . . . . . . . . . . . . . . . . . . . . . . . . . . . . . . . . . . . . . . . . . . . . . .
Verify the Scripts are Installed . . . . . . . . . . . . . . . . . . . . . . . . . . . . . . . . . . . . . . . . . . . . . . . . . . . . . .
Running Scripts . . . . . . . . . . . . . . . . . . . . . . . . . . . . . . . . . . . . . . . . . . . . . . . . . . . . . . . . . . . . . . . . . . . .
Invoking KWDB . . . . . . . . . . . . . . . . . . . . . . . . . . . . . . . . . . . . . . . . . . . . . . . . . . . . . . . . . . . . . . . . . .
Including Program Files . . . . . . . . . . . . . . . . . . . . . . . . . . . . . . . . . . . . . . . . . . . . . . . . . . . . . . . . . . . .
Invoking Scripts . . . . . . . . . . . . . . . . . . . . . . . . . . . . . . . . . . . . . . . . . . . . . . . . . . . . . . . . . . . . . . . . . .
Redirecting Script Output . . . . . . . . . . . . . . . . . . . . . . . . . . . . . . . . . . . . . . . . . . . . . . . . . . . . . . . . . .
Tracing Dialog Between PERL and KWDB . . . . . . . . . . . . . . . . . . . . . . . . . . . . . . . . . . . . . . . . . . . .
Debugging PERL Scripts . . . . . . . . . . . . . . . . . . . . . . . . . . . . . . . . . . . . . . . . . . . . . . . . . . . . . . . . . . .
The Two Scripts Most Often Run. . . . . . . . . . . . . . . . . . . . . . . . . . . . . . . . . . . . . . . . . . . . . . . . . . . . .
Perl Shell Interface for KWDB . . . . . . . . . . . . . . . . . . . . . . . . . . . . . . . . . . . . . . . . . . . . . . . . . . . . . . . .
Writing Scripts . . . . . . . . . . . . . . . . . . . . . . . . . . . . . . . . . . . . . . . . . . . . . . . . . . . . . . . . . . . . . . . . . . . . .
Basic Program Operation . . . . . . . . . . . . . . . . . . . . . . . . . . . . . . . . . . . . . . . . . . . . . . . . . . . . . . . . . . .
Communicating With KWDB . . . . . . . . . . . . . . . . . . . . . . . . . . . . . . . . . . . . . . . . . . . . . . . . . . . . . . . .
Scripts That Implement Q4 Commands . . . . . . . . . . . . . . . . . . . . . . . . . . . . . . . . . . . . . . . . . . . . . . .
Output Formatting . . . . . . . . . . . . . . . . . . . . . . . . . . . . . . . . . . . . . . . . . . . . . . . . . . . . . . . . . . . . . . . .
Interruption Handling . . . . . . . . . . . . . . . . . . . . . . . . . . . . . . . . . . . . . . . . . . . . . . . . . . . . . . . . . . . . .
Fields, Values and Expressions . . . . . . . . . . . . . . . . . . . . . . . . . . . . . . . . . . . . . . . . . . . . . . . . . . . . . .
Miscellaneous . . . . . . . . . . . . . . . . . . . . . . . . . . . . . . . . . . . . . . . . . . . . . . . . . . . . . . . . . . . . . . . . . . . .
Style Guide . . . . . . . . . . . . . . . . . . . . . . . . . . . . . . . . . . . . . . . . . . . . . . . . . . . . . . . . . . . . . . . . . . . . . .
214
215
215
216
216
216
217
217
217
218
218
221
223
223
223
225
227
229
229
231
232
8. Command Quick Reference
Commands . . . . . . . . . . . . . . . . . . . . . . . . . . . . . . . . . . . . . . . . . . . . . . . . . . . . . . . . . . . . . . . . . . . . . . . .
Starting KWDB. . . . . . . . . . . . . . . . . . . . . . . . . . . . . . . . . . . . . . . . . . . . . . . . . . . . . . . . . . . . . . . . . . .
Stopping KWDB . . . . . . . . . . . . . . . . . . . . . . . . . . . . . . . . . . . . . . . . . . . . . . . . . . . . . . . . . . . . . . . . . .
Getting Help . . . . . . . . . . . . . . . . . . . . . . . . . . . . . . . . . . . . . . . . . . . . . . . . . . . . . . . . . . . . . . . . . . . . .
Attaching and Debugging Targets . . . . . . . . . . . . . . . . . . . . . . . . . . . . . . . . . . . . . . . . . . . . . . . . . . . .
6
236
236
236
236
236
Contents
Breakpoints . . . . . . . . . . . . . . . . . . . . . . . . . . . . . . . . . . . . . . . . . . . . . . . . . . . . . . . . . . . . . . . . . . . . . .
Kernel Stack . . . . . . . . . . . . . . . . . . . . . . . . . . . . . . . . . . . . . . . . . . . . . . . . . . . . . . . . . . . . . . . . . . . . .
Execution Control . . . . . . . . . . . . . . . . . . . . . . . . . . . . . . . . . . . . . . . . . . . . . . . . . . . . . . . . . . . . . . . . .
Display. . . . . . . . . . . . . . . . . . . . . . . . . . . . . . . . . . . . . . . . . . . . . . . . . . . . . . . . . . . . . . . . . . . . . . . . . .
Automatic Display . . . . . . . . . . . . . . . . . . . . . . . . . . . . . . . . . . . . . . . . . . . . . . . . . . . . . . . . . . . . . . . .
Expressions . . . . . . . . . . . . . . . . . . . . . . . . . . . . . . . . . . . . . . . . . . . . . . . . . . . . . . . . . . . . . . . . . . . . . .
Symbol Table . . . . . . . . . . . . . . . . . . . . . . . . . . . . . . . . . . . . . . . . . . . . . . . . . . . . . . . . . . . . . . . . . . . . .
Source Files . . . . . . . . . . . . . . . . . . . . . . . . . . . . . . . . . . . . . . . . . . . . . . . . . . . . . . . . . . . . . . . . . . . . . .
DLKM Commands . . . . . . . . . . . . . . . . . . . . . . . . . . . . . . . . . . . . . . . . . . . . . . . . . . . . . . . . . . . . . . . .
Special Kernel Debugging Commands . . . . . . . . . . . . . . . . . . . . . . . . . . . . . . . . . . . . . . . . . . . . . . . .
Q4 Commands. . . . . . . . . . . . . . . . . . . . . . . . . . . . . . . . . . . . . . . . . . . . . . . . . . . . . . . . . . . . . . . . . . . .
Other Commands and Features . . . . . . . . . . . . . . . . . . . . . . . . . . . . . . . . . . . . . . . . . . . . . . . . . . . . . . .
237
239
240
240
241
241
241
242
242
242
244
250
9. Troubleshooting
Problems While Debugging Remote Targets . . . . . . . . . . . . . . . . . . . . . . . . . . . . . . . . . . . . . . . . . . . . . 252
Problems While Running KWDB with PERL. . . . . . . . . . . . . . . . . . . . . . . . . . . . . . . . . . . . . . . . . . . . . 254
Error Messages. . . . . . . . . . . . . . . . . . . . . . . . . . . . . . . . . . . . . . . . . . . . . . . . . . . . . . . . . . . . . . . . . . . . . 255
10. Guide to Writing KWDB Compatible Code
How to Write KWDB Compatible Kernel Code . . . . . . . . . . . . . . . . . . . . . . . . . . . . . . . . . . . . . . . . . . .
Adding New Data Structures . . . . . . . . . . . . . . . . . . . . . . . . . . . . . . . . . . . . . . . . . . . . . . . . . . . . . . . . .
What’s Needed . . . . . . . . . . . . . . . . . . . . . . . . . . . . . . . . . . . . . . . . . . . . . . . . . . . . . . . . . . . . . . . . . . .
Adding a New Data Structure . . . . . . . . . . . . . . . . . . . . . . . . . . . . . . . . . . . . . . . . . . . . . . . . . . . . . . .
Testing New Entry . . . . . . . . . . . . . . . . . . . . . . . . . . . . . . . . . . . . . . . . . . . . . . . . . . . . . . . . . . . . . . . .
Adding New Constants . . . . . . . . . . . . . . . . . . . . . . . . . . . . . . . . . . . . . . . . . . . . . . . . . . . . . . . . . . . . .
Testing New Constants. . . . . . . . . . . . . . . . . . . . . . . . . . . . . . . . . . . . . . . . . . . . . . . . . . . . . . . . . . . . .
How to Avoid Breaking KWDB . . . . . . . . . . . . . . . . . . . . . . . . . . . . . . . . . . . . . . . . . . . . . . . . . . . . . . . .
Kernel Symbols Used . . . . . . . . . . . . . . . . . . . . . . . . . . . . . . . . . . . . . . . . . . . . . . . . . . . . . . . . . . . . . .
Address Translation . . . . . . . . . . . . . . . . . . . . . . . . . . . . . . . . . . . . . . . . . . . . . . . . . . . . . . . . . . . . . . .
Stack Traces . . . . . . . . . . . . . . . . . . . . . . . . . . . . . . . . . . . . . . . . . . . . . . . . . . . . . . . . . . . . . . . . . . . . .
DLKM . . . . . . . . . . . . . . . . . . . . . . . . . . . . . . . . . . . . . . . . . . . . . . . . . . . . . . . . . . . . . . . . . . . . . . . . . .
Endianism . . . . . . . . . . . . . . . . . . . . . . . . . . . . . . . . . . . . . . . . . . . . . . . . . . . . . . . . . . . . . . . . . . . . . . . .
Object File Format . . . . . . . . . . . . . . . . . . . . . . . . . . . . . . . . . . . . . . . . . . . . . . . . . . . . . . . . . . . . . . . . . .
Symbolic Debug Format. . . . . . . . . . . . . . . . . . . . . . . . . . . . . . . . . . . . . . . . . . . . . . . . . . . . . . . . . . . . . .
260
261
261
261
262
263
264
265
265
266
267
268
270
270
270
Glossary . . . . . . . . . . . . . . . . . . . . . . . . . . . . . . . . . . . . . . . . . . . . . . . . . . . . . . . . . . . . . . . . . . . 271
Index . . . . . . . . . . . . . . . . . . . . . . . . . . . . . . . . . . . . . . . . . . . . . . . . . . . . . . . . . . . . . . . . . . . . . . 279
7
Contents
8
Tables
Table 1. Publishing History Details . . . . . . . . . . . . . . . . . . . . . . . . . . . . . . . . . . . . . . . . . . . . . . . . . . 13
Table 2. HP-UX 11i Releases and Release Identifiers . . . . . . . . . . . . . . . . . . . . . . . . . . . . . . . . . . . . 15
Table 2-1. Communication Methods for Remote Debugging . . . . . . . . . . . . . . . . . . . . . . . . . . . . . . . 21
Table 2-2. LAN Drivers for 11.10 or Later . . . . . . . . . . . . . . . . . . . . . . . . . . . . . . . . . . . . . . . . . . . . . 30
Table 2-3. LAN Drivers for 11.0 . . . . . . . . . . . . . . . . . . . . . . . . . . . . . . . . . . . . . . . . . . . . . . . . . . . . . 31
Table 2-4. LAN Drivers for 10.20 and 10.30 . . . . . . . . . . . . . . . . . . . . . . . . . . . . . . . . . . . . . . . . . . . . 31
Table 2-5. LAN Cards/IPF Version . . . . . . . . . . . . . . . . . . . . . . . . . . . . . . . . . . . . . . . . . . . . . . . . . . . 34
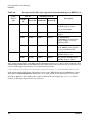
Table 2-6. Description of LAN cards supported by kernel debugger in HPUX 11.31. . . . . . . . . . . . 35
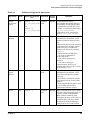
Table 3-1. Supported Online Kernel Debugger Initializations . . . . . . . . . . . . . . . . . . . . . . . . . . . . . 68
Table 3-2. Additional Supported Operations . . . . . . . . . . . . . . . . . . . . . . . . . . . . . . . . . . . . . . . . . . . 69
Table 3-3. 11.31 Support for Kernel PCI OL* Operations . . . . . . . . . . . . . . . . . . . . . . . . . . . . . . . . . 70
Table 4-1. On-Console Debugging Commands . . . . . . . . . . . . . . . . . . . . . . . . . . . . . . . . . . . . . . . . . 109
Table 4-2. Commands for 11.23 and Beyond. . . . . . . . . . . . . . . . . . . . . . . . . . . . . . . . . . . . . . . . . . . 111
Table 4-3. Commands for 11.31 and Beyond. . . . . . . . . . . . . . . . . . . . . . . . . . . . . . . . . . . . . . . . . . . 112
Table 4-4. Kernel File/Memory Write Formats. . . . . . . . . . . . . . . . . . . . . . . . . . . . . . . . . . . . . . . . . 155
9
Tables
10
Figures
Figure 3-1. Debugging Superdome/Matterhorn/Keystone/Orca Target . . . . . . . . . . . . . . . . . . . . . . 48
Figure 3-2. Debugging V-Class Target . . . . . . . . . . . . . . . . . . . . . . . . . . . . . . . . . . . . . . . . . . . . . . . . 49
Figure 3-3. Debugging S700/S800 PA Target Using LAN . . . . . . . . . . . . . . . . . . . . . . . . . . . . . . . . . 51
Figure 3-4. Debugging IPF Target Using LAN. . . . . . . . . . . . . . . . . . . . . . . . . . . . . . . . . . . . . . . . . . 52
Figure 3-5. Debugging S700/S800 PA Target Using a Serial Connection . . . . . . . . . . . . . . . . . . . . . 53
Figure 3-6. Debugging IPF Target Using a Serial Connection . . . . . . . . . . . . . . . . . . . . . . . . . . . . . 55
Figure 3-7. Debugging S700/S800 PA Target Using Lantron Serial . . . . . . . . . . . . . . . . . . . . . . . . . 56
Figure 3-8. Debugging IPF Target Using Lantron Serial . . . . . . . . . . . . . . . . . . . . . . . . . . . . . . . . . 57
Figure 3-9. Assembly Level Debugging PA/IPF Target Using On-Console Debugger . . . . . . . . . . . 57
Figure 3-10. Debugging PA/IPF Target Using Remote Console . . . . . . . . . . . . . . . . . . . . . . . . . . . . 59
Figure 3-11. Debugging PA/IPF Target Using UDP. . . . . . . . . . . . . . . . . . . . . . . . . . . . . . . . . . . . . . 63
Figure 3-12. Debugging 11.0 and Earlier Kernel Using Serial Connection . . . . . . . . . . . . . . . . . . . 64
Figure 3-13. Debugging 11.0 and Earlier Kernel Using LAN . . . . . . . . . . . . . . . . . . . . . . . . . . . . . . 65
Figure 7-1. Invoking KWDB Without PERL. . . . . . . . . . . . . . . . . . . . . . . . . . . . . . . . . . . . . . . . . . . 214
Figure 7-2. Invoking KWDB With PERL Option -p . . . . . . . . . . . . . . . . . . . . . . . . . . . . . . . . . . . . . 215
11
Figures
12
About This Document
This manual describes how to debug the HP-UX kernel and drivers and to analyze crash dumps and live
systems.
The document printing date and part number indicate the document’s current edition. The printing date will
change when a new edition is printed. Minor changes may be made at reprint without changing the printing
date. The document part number will change when extensive changes are made.
Document updates may be issued between editions to correct errors or document product changes. To ensure
that you receive the updated or new editions, you should subscribe to the appropriate product support service.
See your HP sales representative for details.
Intended Audience
This document is intended for HP-UX kernel/driver developers.
This document is not a tutorial.
New and Changed Documentation in This Edition
The manual name and part number have both been changed, so this becomes the first edition.
Publishing History
Table 1
Publishing History Details
Document Manufacturing Part
Number
Operating Systems Supported
Publication
Date
5971-4809
11.23
September 2004
5971-xxxx
11.23
May 2005
5971-xxxx
11.31
October 2006
13
What’s in This Document
The HP KWDB Kernel Debugger Guide contains information on debugging:
•
Chapter 1, “Introduction,” Summarizes what is in this document and provides overview information.
•
Chapter 2, “Setting Up KWDB for Remote Debugging,” explains how to set up systems.
•
Chapter 3, “Getting Started with Remote Debugging,” explains debugging sessions.
•
Chapter 4, “Command Reference,” discusses KWDB and Q4 commands.
•
Chapter 5, “Analyzing Crash Dumps,” shows how to analyze a crash dump.
•
Chapter 6, “Live Memory Analysis,” explains live memory analysis.
•
Chapter 7, “KWDB PERL Programming Reference,” explains how programs can be written in PERL to
analyze crash dumps or live or remote systems.
•
Chapter 8, “Command Quick Reference,” shows the KWDB commands for kernel debugging.
•
Chapter 9, “Troubleshooting,” recognizing and resolving common problems.
•
Chapter 10, “Guide to Writing KWDB Compatible Code,” shows how to write code that can be debugged
using KWDB.
•
“Glossary” — A comprehensive list of terms commonly used in HP-UX Driver Development
documentation.
Typographical Conventions
This document uses the following conventions.
audit (5)
An HP-UX manpage. In this example, audit is the name and 5 is the section in the HP-UX
Reference. On the web and on the Instant Information CD, it may be a hot link to the
manpage itself. From the HP-UX command line, you can enter “man audit” or “man 5
audit” to view the manpage. See man (1).
Book Title
The title of a book. On the web and on the Instant Information CD, it may be a hot link to
the book itself.
KeyCap
The name of a keyboard key. Note that Return and Enter both refer to the same key.
Emphasis
Text that is emphasized.
Bold
Text that is strongly emphasized.
Bold
The defined use of an important word or phrase.
ComputerOut
Text displayed by the computer.
UserInput
Commands and other text that you type.
Command
A command name or qualified command phrase.
Variable
The name of a variable that you may replace in a command or function or information in a
display that represents several possible values.
[ ]
The contents are optional in formats and command descriptions. If the contents are a list
separated by |, you must choose one of the items.
{ }
The contents are required in formats and command descriptions. If the contents are a list
separated by |, you must choose one of the items.
...
The preceding element may be repeated an arbitrary number of times.
14
|
Separates items in a list of choices.
HP-UX Release Name and Release Identifier
Each HP-UX 11i release has an associated release name and release identifier. The uname (1) command with
the -r option returns the release identifier. This table shows the releases available for HP-UX 11i.
Table 2
HP-UX 11i Releases and Release Identifiers
Release
Identifier
Release Name
Supported Processor Architecture
11.11
HP-UX 11i v1
PA-RISC
11.23
HP-UX 11i v2
PA-RISC, IA
11.31
HP-UX 11i v3
PA-RISC, IA
Related Documents
Other documents in this collection include:
•
DDK FAQ
•
HP-UX Driver Development Getting Started Guide
•
HP-UX Driver Development Reference Guide
HP Encourages Your Comments
HP encourages your comments concerning this document. We are truly committed to providing
documentation that meets your needs.
Please include document title, manufacturing part number, and any comment, error found, or suggestion for
improvement you have concerning this document. Also, please include what we did right so we can
incorporate it into other documents.
Support/Compatibility Disclaimers
Since drivers function at the level of the kernel, Hewlett-Packard Company (HP) reminds you of the following:
❏
Adding your own driver to HP-UX requires relinking the driver into HP-UX. With each new release you
should plan on recompiling your driver in order to reinstall it into the new HP-UX kernel. Many header
files do not change. However, drivers typically use some header files that could change across releases
(i.e., you can have some system dependencies).
❏
HP provides support services for HP products, including HP-UX. Products, including drivers, from
non-HP parties receive no support, other than the support of those parts of a driver that rely on the
documented behavior of supported HP products.
❏
Should difficulties arise during the development and test phases of writing a driver, HP may provide
assistance in isolating problems to determine if:
❏
•
HP hardware is not at fault; and
•
HP software (firmware) is not at fault by removing user-written kernel drivers.
When HP hardware, software, and firmware are not at fault, you should seek help from the third party
from whom you obtained software or hardware.
15
Reference Documentation
❏
16
Hewlett-Packard Company
•
HP-UX Driver Development Reference Guide
•
HP-UX Driver Development Guide
1 Introduction
Just as an application debugger is essential to the development, maintenance, and support of an application
program, a kernel debugger is essential to the development, maintenance, and support of an operating system
kernel. HP has made available KWDB, the HP-UX kernel debugger and crash analysis tool, to fulfill the
needs of lab engineers and field engineers for a tool to provide a means to study the behavior of running
systems and to analyze the crash dumps that may be generated when a system terminates.
Run KWDB in three ways:
1. As a remote system kernel debugger.
2. As an on-console or single-system kernel debugger.
3. As a crash dump/kernel memory analysis tool.
As a remote system kernel debugger, KWDB provides source level debugging, which includes access to
symbols, variables, and source in addition to the basic features of providing stack traces, examination and
modification of memory, control of execution through breakpoints and watchpoints. The remote method of
debugging requires at least two systems, the system to debug, called the target, and the system, called the
host, where entering the kwdb command and kwdb runs as a normal user application. This manual discusses
how to set up the communication between these two systems, refer to Chapter 2, “Setting Up KWDB for
Remote Debugging.”
As an on-console kernel debugger, KWDB provides assembly level debugging, which although not as powerful
as source level debugging still provides a set of debugging commands which allows control of breakpoints,
examination and modification of memory, and stack tracing. These commands are documented in Chapter 3,
“Getting Started with Remote Debugging.”
The target will need to be booted with special flags to run KWDB as either a remote system debugger or as a
single system debugger. These flags and the boot commands are documented in Chapter 3, “Getting Started
with Remote Debugging,” as well as how to invoke the KWDB client to connect to the target system.
Although KWDB is based on GDB and KWDB has many of the same commands as GDB, it also supports a
superset of commands provided by the HP-UX crash dump analyzer, Q4. Chapter 3, “Getting Started with
Remote Debugging,” documents the commands available in KWDB.
As a crash dump analysis tool, KWDB allows extraction of information from a crash dump or from the
memory devices, /dev/mem or /dev/kmem, of the local system. Using a local copy of the vmunix file KWDB has
access to all the debug and symbol information available. Many scripts were developed to analyze crash
dumps using Q4. These scripts can also be used by KWDB. Chapter 4, “Command Reference,” documents how
to analyze crash dumps with KWDB. Since the system memory devices provides the super user with access to
the same information on the system as a crash dump, it is easy to use KWDB to perform analysis of a live
system, as documented in Chapter 5, “Analyzing Crash Dumps.”
Chapter 6, “Live Memory Analysis,” documents the script interface provided with KWDB. Chapter 7, “KWDB
PERL Programming Reference,” and Chapter 8, “Command Quick Reference,” contain easy to use references.
As a kernel engineer read Chapter 9, “Troubleshooting,” to better understand the KWDB dependencies in the
kernel.
Chapter 1
17
Introduction
18
Chapter 1
2 Setting Up KWDB for Remote Debugging
To use KWDB as remote kernel debugger at least two systems will be needed; the target system running the
kernel that needs to be debugged, and the host system where the KWDB debugger runs as a normal user
application. The KWDB debugger running as a user application is referred to as the “KWDB client”.
Depending on the type of connection between host and target systems, a “communications server” may need
to be run, in addition to KWDB.
This chapter describes how to set up the communication between the host system running KWDB and the
target system running the kernel to be debugged. Refer to Chapter 3, “Getting Started with Remote
Debugging,” for information on how to boot the target system and invoke KWDB to begin the debugging
session.
Chapter 2
19
Setting Up KWDB for Remote Debugging
KWDB Setup
KWDB Setup
KWDB supports two system architectures, PA-RISC and Itanium. On PA-RISC, a wide variety of HP-UX
operating systems and machine classes are also supported. Setting up the connection between the target and
the KWDB client will be done differently depending on the architecture, machine class and version of HP-UX
on the target system. Therefore a need to identify each of these. Use KWDB to debug all HP-UX systems
whose OS version is 11.10 and later. Kernels whose OS version is 10.0 to 11.0 were designed to be debugged
with a different debugger known as NDDB. However, use KWDB to debug 11.0 and earlier kernels on
PA-RISC S700/800 systems (with some limitations) using its nddb-compatibility mode.
There are at present six different methods by which KWDB can communicate with the target system it is
debugging, and the details of KWDB setup will vary depending on the communication method chosen. Start
by summarizing the different types of communication methods between the host and target machines.
Communication Methods
LAN Communication with Comm Server
This method is communication via a Local Area Network (LAN). It is generally the most common method
since it is the fastest and most flexible. This method requires that a LAN card be installed on the target
system that can be used exclusively by KWDB. This might require installation of an additional LAN card
depending on the configuration of the system. It also requires that a communications server, usually referred
to as a “comm” server run as a separate process on a machine on the same LAN subnet as the target system.
This method of communication uses TCP/IP protocol for communication between KWDB client and
communication server. The communication between communication server and target is through Ethernet
layer LAN packets.
UDP Communication
This communication method is via the network using UDP/IP protocol. The requirements for UDP
communication are the same as for LAN Communication previously described, except that no
communications server is needed. This method of communication is supported by HP-UX kernels version
11.22 or later.
Dedicated Device Communication
There are two types of systems which make use of dedicated device communication for remote kernel
debugging. They are explained in the following sections:
SUB/SINC
The Superdome, Keystone, Matterhorn and Orca systems have a dedicated debugger device
that can communicate with KWDB. Superdome, Keystone and Matterhorn systems use the
SUB/SINC for all debugger communication.
SONIC LAN
V-Class systems have a unique form of communication. The V-Class uses a special type of
LAN card called SONIC LAN card for debugger communication. The V-Class system
consists of a test station and various partitions. The KWDB communications server runs on
the test station and communicates with the different partitions of the V-Class system using
Ethernet layer LAN packets. The KWDB client running on a host system communicates
with the communications server on the V-Class test station via TCP/IP.
20
Chapter 2
Setting Up KWDB for Remote Debugging
KWDB Setup
Serial Communication
The serial communication method uses a direct RS-232 connection between the host and target machines.
This requires close physical proximity between the host and target systems and is slow. It is not the
communication method of choice, will (possibly) be used if an appropriate LAN card is not installed on the
target system.
Lantron Serial Communication
This is an RS-232 connection between the target system and a Lantronix box. This method eliminates the
need for close physical proximity between the host and target systems, but the connection is still slow.
Console Debugger Communication
This is communication via the target system’s on-console debugger. KWDB on a host system can communicate
with the on-console debugger on the target system if there is a remote console for the target system. If the
target system is 11.11 or later, use the on-console debugger. This method of communication is slow.
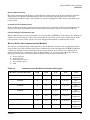
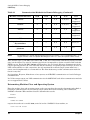
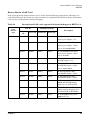
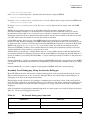
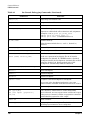
How to Select the Communication Method
The selection of communication method depends on the architecture, machine class and operating system
version of the target. The following table shows communication methods supported by KWDB for different
architecture, machine class and operating system versions. If there are more than one communication
methods supported for a combination, they are listed in Table 2-1, “Communication Methods for Remote
Debugging,” in the order of recommendation. Different notations used in this table are:
C — Console Debugger
D — Dedicated Device
L — LAN with Comm Server
S — Serial / Lantron Serial
U — UDP
Table 2-1
Communication Methods for Remote Debugging
Machine Class/Architecture
11.00
11.10
11.11
11.23
11.31
A Class
L
L
L, C
L, C, S, U
Not
Supported
B Class
L
L
L, C
L, C, S, U
Not
Supported
C Class
L
L
L, C
L, C, S, U
Not
Supported
D Class
S
L
L, S, C
L, S, C
Not
Supported
L, S
L, S
L, S, C
L, S, C, U
Not
Supported
L
L
L, C
L, S, C, U
Not
Supported
L
L
L, C
L, C
J Class (NonAstro)
J Class Astro
K Class
Chapter 2
Not
Supported
21
Setting Up KWDB for Remote Debugging
KWDB Setup
Table 2-1
Communication Methods for Remote Debugging (Continued)
Machine Class/Architecture
11.00
11.10
11.11
11.23
11.31
L Class
L
L
L, C
L, C, S, U
Not
Supported
N Class
L
L
L, C
L, C, S, U
Not
Supported
T Class
L
L
L, C
L, C
Not
Supported
V Class
D
D
D
D
Not
Supported
IPF
—
—
—
L, C, S, U
L, C, S, U
Superdome/Matterhorn/
Keystone/Orca
—
—
D, C
D, C
L, D, C, U
PA-RISC new non-cell
platforms
—
—
L, C
L, C
L, C
NOTE
To determine if a J Class system is Astro based or not, run the ioscan command. If the ioscan
output contains a line for “System Bus Adapter” with “ioa” class, the system is Astro based.
If the machine type is a PA-RISC series 700 or 800, or IPF, the recommended communication method is LAN
since it is the fastest. Use serial or Lantron serial only if it is impossible to obtain or install a LAN card that
KWDB can use. For the PA-RISC 700/800 or IPF systems, also use Console Debugger Communication if the
target’s operating system is 11.11 or later. This has the advantage of requiring no special setup to be done (no
LAN card installation or cable connections), the only requirement is that the target system must have a
remote console implemented via a Lantronix box. The main disadvantage of this communication method is
that it is very slow.
If a Superdome, Keystone, Matterhorn or Orca system, use SUB/SINC communication or Console Debugger
Communication.
If a V-Class target system, use LAN communication via the SONIC LAN card. Other communication methods
are not supported for V-Class.
Determining Machine Class and Operating System
Know the machine class and operating system on the target machine because that determines what kind of
host/target communication to be used. On the target system find out the following; what architecture,
PA-RISC or Itanium? What machine class? To determine this use the:
# model
command; a
19000/785/C3000
response shows that it is a model 9000, series 785 and is a PA-RISC C class machine; an
ia64 Intel MP Server
22
Chapter 2
Setting Up KWDB for Remote Debugging
KWDB Setup
response shows that it is an IPF system
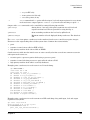
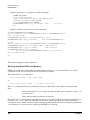
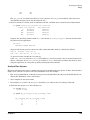
What version of the operating system do you have? To determine this, use the:
# uname -r
command; a
B.11.22
response shows the kernel is version HP-UX 11.22.
Chapter 2
23
Setting Up KWDB for Remote Debugging
KWDB Setup
Set Up Instructions
The following sections explain set-up instructions for different communications methods.
LAN Communication with Comm Server
If the system is PA-RISC 700/800, or IPF, then LAN or UDP communication is the preferred method. This
method of communication needs a LAN card on the target system dedicated for debugger communication.
Determine what LAN cards are installed on the target machine and whether or not any of the LAN cards can
be used by KWDB. If none of the LAN cards on the target machine can be used, install the appropriate type of
card to use LAN communication. To determine what LAN cards are on the system and which LAN cards can
be used by KWDB, and how to obtain the appropriate LAN card, refer to the LAN Cards section. For LAN
communication with comm server, run a communications server. For instructions on how to run the
communications server, refer to the section KWDB Communications Server.
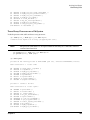
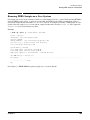
UDP Communication
This method of communication is supported by HP-UX kernels version 11.22 or later. UDP communication
needs a LAN card on the target dedicated for debugger communication. On PA-RISC systems KWDB can use
btlan card and on IPF systems KWDB can use btlan card, intl100 card, igelan card or iether card. To use
this type of communication, determine what LAN cards are installed on the target machine and whether or
not any of the LAN cards can be used by KWDB. If none of the LAN cards on the target machine can be used,
then install the appropriate type of card for UDP communication. To determine what LAN cards are on the
system, which LAN cards can be used by KWDB, and how to obtain the appropriate LAN card, refer to the
LAN Cards section.
UDP protocol is used to communicate between the target and KWDB client, so no communication server is
necessary. The target has to be assigned an IP address and gateway. This can be done automatically if a
DHCP server is running on the network. Consult with the system administrator to check if DHCP server is
running on the network.
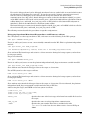
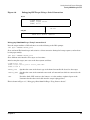
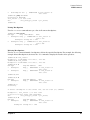
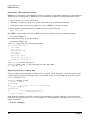
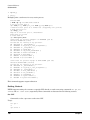
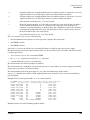
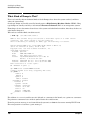
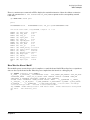
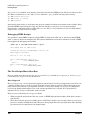
Modify the file /etc/rc.config.d/netconf on the target system as shown in the following example:
# cat /etc/rc.config.d/netconf
...some lines omitted here...
INTERFACE_NAME[0]=lan1
IP_ADDRESS[0]=15.0.100.224
SUBNET_MASK[0]=255.255.252.0
BROADCAST_ADDRESS[0]=15.244.99.255
INTERFACE_STATE[0]=**
DHCP_ENABLE[0]=0
...some lines omitted here...
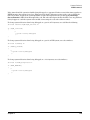
Change the file by removing the IP_ADDRESS value and setting DHCP_ENABLE to 1 as shown here:
# cat /etc/rc.config.d/netconf
INTERFACE NAME[0]=lan1
IP_ADDRESS[0]=
SUBNET_MASK[0]=255.255.252.0
BROADCAST_ADDRESS[0]=15.244.99.255
INTERFACE_STATE[0]=**
DHCP_ENABLE[0]=1
...some lines omitted here...
...some lines omitted here...
24
Chapter 2
Setting Up KWDB for Remote Debugging
KWDB Setup
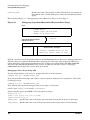
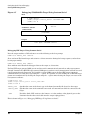
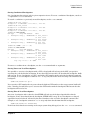
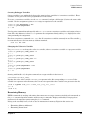
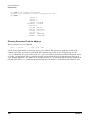
Reboot the target system and look at the IP_ADDRESS in the same file.
# cat /etc/rc.config.d/netconf
...some lines omitted here...
INTERFACE_NAME[0]=lan1
IP_ADDRESS[0]=15.244.99.231
SUBNET_MASK[0]=255.255.252.0
BROADCAST_ADDRESS[0]=15.244.99.255
INTERFACE_STATE[0]=**
DHCP_ENABLE[0]=1
...some lines omitted here...
If the DHCP server is running on the system an IP_ADDRESS will have been written into this file. In the
previous example 15.244.99.231 is the IP address assigned by DHCP server for lan1.
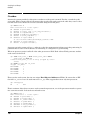
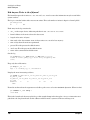
If DHCP is not running on the network, obtain a valid IP address, and a valid gateway in order to use UDP
communication. Its possible to get them from the system administrator. If not, “steal” an IP address and use
the gateway from the target system by looking at the file /etc/rc.config.d/netconf. Search the netconf
file and identify the LAN card KWDB will use. Refer to the LAN Cards section for more details on how to
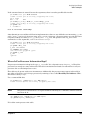
identify the LAN card KWDB will use. The IP address must be the one assigned to the LAN card that KWDB
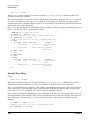
will use. Remove or comment out the corresponding entries from the file /etc/rc.config.d/netconf. Once
the IP address and gateway are obtained, write them into the vmunix file that is to be run on the target
system. For a PA-RISC system write the IP address to the symbol kgdb_udp_ip_addr; for an IPF system
write the IP address to the symbol kdebug_udp_ip_addr. Write the gateway to the symbol
kgdb_udp_gateway for PA-RISC and to the symbol kdebug_udp_gateway for an IPF system. Write the
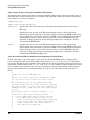
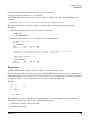
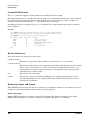
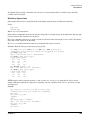
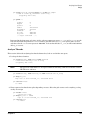
information into the vmunix file using KWDB or adb. Here is an example of writing IP address 0x0f0064e0
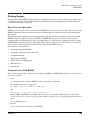
(15.0.100.224) to the symbol kdebug_udp_ip_addr for IPF kernel.
# kwdb -write /stand/vmunix
(kwdb) write 0x0f0064e0 at &kdebug_udp_ip_addr
Writing 4 bytes at 0xe00000010034f9ec in kernel file
Old value : 0x00000000
New value : 0x0f0064e0
(kwdb) quit
Once the information is written to the symbols reboot the kernel with the vmunix file that has been changed
in order to use UDP communication. For instructions on booting the kernel and starting KWDB for UDP
communication, refer to Chapter 3, “Getting Started with Remote Debugging.” In KWDB 3.1.3, patching the
vmunix for hardcoding the UPp IP address is supported through kwdb_config_kern_utility. This can be done
by selecting the option “Set/Unset hardcoded IP address for UDP communication” in the main menu of
kwdb_config_kern.
Dedicated Device Communication
There are two types of systems which make use of dedicated device communication for remote kernel
debugging. They are explained in the following sections:
SUB/SINC
Chapter 2
If the target is a Superdome, Keystone, Matterhorn, or Orca, the SUB/SINC is used for all
debugger communication. There is no need for a communications server or a special LAN
card. Refer to Chapter 3, “Getting Started with Remote Debugging.”
25
Setting Up KWDB for Remote Debugging
KWDB Setup
SONIC LAN
The V-Class uses only LAN communication via the SONIC LAN card. Other forms of
communication such as serial or Console Debugger communication are not supported. The
OS version of the kernel must be 11.10 or later, nddb compatibility mode is not supported
for the V-Class. The kwdbd communications server has to run on the V-Class test station.
For instructions on running the kwdbd communications server, refer to the section KWDB
Communications Server. For instructions on booting the kernel and starting KWDB for a
V-Class, refer to Chapter 3, “Getting Started with Remote Debugging.”
Serial/Lantron Serial Communication
If it is necessary to use an RS-232 serial connection, connect a cable directly between the host and target
machine or from the target machine to a Lantronix box. No communications server is necessary if using a
serial connection.
To set up RS-232 communications, perform the following steps:
1. Ensure the target contains an RS-232 card supported for debugger communications.
To determine this, use the following rules:
•
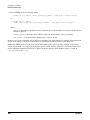
For PA-RISC targets with kernel version 11.11 and earlier, KWDB only supports RS232 under Core
I/O adapter. To determine if the system has a supported RS232 card use the command ioscan -f as
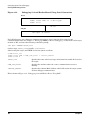
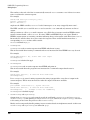
shown in this example:
# ioscan -f
Class I H/W Path Driver
S/W State H/W Type
Description
==============================================================
.....Some lines omitted here.....
ba
2
8/20
bus_adapter CLAIMED
BUS_NEXUS
Core I/O Adapter
.....Some lines omitted here....
tty
1
8/20/2
asio0
CLAIMED
INTERFACE
Built-in RS-232C
.....Some lines omitted here.....
•
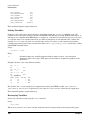
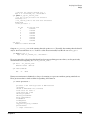
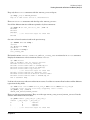
For PA-RISC targets with kernel version 11.20 and later, KWDB supports RS232 with driver asio0.
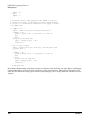
To determine if the system has a supported RS232 card use the command ioscan -fC tty.
The output of the command should show driver asio as shown here:
# ioscan -fC tty
Class
I H/W Path Driver S/W State H/W Type
Description
===================================================================
tty
0 8/16/4
asio0
CLAIMED
INTERFACE Built-in RS-232C
tty
1 8/20/2
asio0
CLAIMED
INTERFACE Built-in RS-232C
The driver cannot be of type mux2 (for example, PA-RISC K class has a mux2 driver and so cannot use
serial communication). The “Driver” is the important column, information in other columns can vary.
For example the “Description” column could show PCI Serial.
•
For Intel IPF systems, KWDB supports RS232 on all IPF systems.
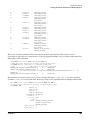
2. Determine which RS-232 port will be dedicated to debugger communications on the target. KWDB will
use the rules listed to select the port:
•
26
For PA-RISC targets, KWDB will choose the second port (“port B” or “serial 2”) on the target for
debugger communications if a second port exists.
Chapter 2
Setting Up KWDB for Remote Debugging
KWDB Setup
•
For PA-RISC targets it is possible to override KWDB’s default selection rules and specify which serial
port is to be used for debugging by using the kwdb_config_kern utility as explained in the
kwdb_config_kern Utility section.
•
For Intel IPF systems, KWDB will choose COM1 on the target for debugger communication.
•
For HP IPF systems, KWDB will choose port 2 on the target for debugger communications if a second
port exists.
•
On IPF systems it is possible to change the default port that KWDB uses for serial communication on
the target by using the -z option when booting the target system. On an Intel IPF target this option
will cause port 2 to be selected and on an HP IPF target, this will cause port 1 to be selected. To
override the default port if it is being used for another purpose such as a remote console. See
Chapter 3, “Getting Started with Remote Debugging,” for information on booting the target system.
3. Set up the serial connection in either of two ways; connect the target and host machines directly, or
connect the target machine to a Lantronix device. The advantage of connecting the target machine to a
Lantronix device is that the host and target machines do not have to be physically connected, the host can
be anywhere as long as it has access to the Lantronix device via the network.
Connecting the Target and Host Directly
The host and target must be close enough to connect a serial cable. Use a DB9 Female/Female null-modem
cable to connect the host and target machines. This can be an off-the-shelf cable from a retail outlet.
Connect the serial cable between a serial port on the host and the serial port on the target determined in
(step 2) of the Serial/Lantron Serial Communication section. Use port B or serial 2 on the host machine.
To specify the device file corresponding to the port (for example, /dev/tty1p0) the target command is
invoked from KWDB client, as explained in Chapter 3, “Getting Started with Remote Debugging.”
Connecting the Target to a Lantronix Device
If a Lantronix device is available, it can be connected to the serial port on the target, determined in (step 2) of
the Serial/Lantronix Serial Communication section, to the Lantronix port instead of connecting the host and
target directly.
Use the standard cable used for a remote console when connecting to a port on the Lantronix device. This can
be an off-the-shelf cable from a retail outlet. Note the number of the Lantronix port that it’s have connected
to.
Set the speed of the Lantronix port that it’s been connected to. Do this as superuser on the Lantronix device.
If the target machine is a PA-RISC system set the speed of the serial port to 19200. If the target machine is an
IPF system, set the speed of the serial port to 57600. For example if on a PA-RISC system and the port
number is 14, configuration looks like:
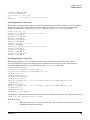
LRS32F04:Telnet34>set pri
Password>
LRS32F04:Telnt34>>set port 14 speed 19200
LRS32F04:Telnt34>>show port 14
Port 14: Username:
Char Size/Stop
Flow Ctrl:
Parity:
Access:
Backward:
Chapter 2
Physical Port 14 (Idle)
Bits:8/1
None
None
Remote
None
Input Speed:
19200
Output Speed:
19200
Modem Control: Disabled
Local Switch:
Port Name:
None
Port_14
27
Setting Up KWDB for Remote Debugging
KWDB Setup
Break Ctrl:
Forward:
Local
None
Session Limit:
4
Terminal Type: Ansi(HP)
If the target machine uses a port on the Lantronix device for its remote console, the same port cannot be used,
connect the second serial port of the target to a different port on the Lantronix. When issuing the commands
to connect KWDB to the remote target, the name of the Lantronix device and the port number are needed. See
Chapter 3, “Getting Started with Remote Debugging.”
Console Debugger Communication
All HP-UX kernels version 11.11 or later have a debugger called the on-console or single system debugger
embedded in the kernel which can be accessed via the system console. If the target system is 11.11 or later
use the on-console debugger. The on-console debugger has a limited set of commands and allows assembly
level debugging only. KWDB on a host system can communicate with the on-console debugger on the target
system if there is a remote console for the target system. This allows for the use of the full set of KWDB
commands with no extra communications setup. To do this, see Chapter 3, “Getting Started with Remote
Debugging.”
28
Chapter 2
Setting Up KWDB for Remote Debugging
LAN Cards
LAN Cards
If the target system is a PA-RISC Superdome, Keystone or Matterhorn this chapter can be skipped. These
systems communicate with KWDB via a dedicated device. The V-Class target always uses the SONIC LAN
card so the information in this chapter is not needed, however for the V-Class needed to run the kwdbd
communications server on the test station. (See the section KWDB Communications Server.)
To use LAN communication between the host and target, there must be a LAN card on the target that is
dedicated for use by KWDB. This dedicated LAN card can not be used for HP-UX networking, so it may be
necessary to install an additional LAN card on the target system if networking is desired while debugging.
KWDB does not support all LAN cards on all HP-UX systems so determine what LAN devices are installed in
the target system. If the system is PA-RISC S700 or S800 series, see the LAN Cards for the PA-RISC
Architecture section. If the system is IPF see the LAN Cards for the IPF Architecture section.
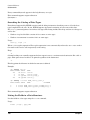
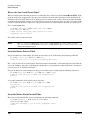
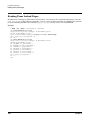
LAN Cards for the PA-RISC Architecture
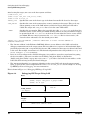
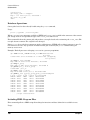
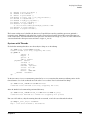
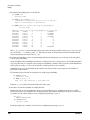
To determine what LAN devices are installed on the target system, issue the command:
# ioscan -fC lan
See something like the following:
# ioscan -fC lan
Class I H/W Path
Driver S/W State H/W Type Description
========================================================================
lan
0 10/0/12/0 btlan CLAIMED
INTERFACE HP PCI 10/100Base-TX Core
lan
1 10/1/5/0
btlan CLAIMED
INTERFACE HP A5230A/B5509BA PCI 10/100Base-TX
Addon
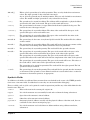
The important things to look at in the output are the Driver column and the H/W Path column. The following
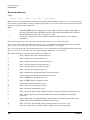
drivers are supported by KWDB for LAN communication with comm server:
lan2
lan3
btlan
btlan3
btlan5
The following drivers are not supported by KWDB:
btlan4
btlan6
lan6
token2
KWDB supports only btlan, btlan3, and btlan5 drivers for UDP communication. The output of the ioscan
command shows that either the LAN card at hardware path 10/0/12/0 or the one at 10/1/5/0 can be used by
KWDB. By default, KWDB will choose the first LAN card it is capable of using at the lowest hardware
address. Therefore in the previous example, it will use the card at the hardware path 10/0/12/0. It is possible
to configure the kernel to override the default rules for selecting a LAN card and use a specific hardware path
using the kwdb_config_kern utility. See the kwdb_config_kern Utility section for information on
kwdb_config_kern.
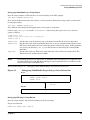
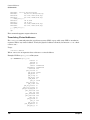
When the KWDB client is invoked later for LAN communication with comm server, you will need to know the
Ethernet MAC address (or Station Address) of the LAN card that KWDB will use. To find this out, use the
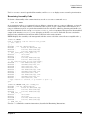
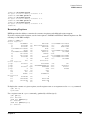
lanscan command:
Chapter 2
29
Setting Up KWDB for Remote Debugging
LAN Cards
# lanscan
Hardware
Path
10/0/12/0
10/1/5/0
Station
Crd Hdw
Net-Interface
Address
In# State Name PPA
0x001083F94458 0
UP
lan0 snap0
0x001083F6AF66 1
UP
lan1 snap1
NM
ID
1
2
MAC
Type
ETHER
ETHER
HP-DLPI
Support
Yes
Yes
DLPI
Mjr#
119
119
In the example, the Ethernet MAC address to use when invoking KWDB is 0x001083F94458 because it
corresponds to the hardware path of the LAN card that KWDB will use.
Not all drivers are supported on all classes of machines on all versions of HP-UX. Which drivers are
supported depends on the version of the operating system (which was previously obtained with the uname -r
command) and the class of machine (which was previously obtained with the model command).
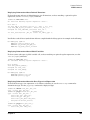
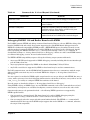
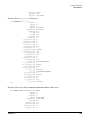
The later the release of HP-UX, the more types of LAN drivers are supported. The following Table 2-2, “LAN
Drivers for 11.10 or Later,” gives an estimate of what LAN drivers are supported on version 11.10 or later
Table 2-2
Machine Class
LAN Drivers for 11.10 or Later
lan2
btlan
btlan3
btlan5
A
X
X
X
B
X
X
X
X
X
X
X
X
X
X
X
X
L
X
X
X
N
X
X
X
C
X
D (low end)
X
lan3
D (high end)
IPF
J (non-astro)
X
J (astro)
K
R
T
30
X
X
X
X
Chapter 2
Setting Up KWDB for Remote Debugging
LAN Cards
The following Table 2-3, “LAN Drivers for 11.0,” gives an estimate of what LAN drivers are supported on
version 11.0. Support for the btlan drivers on 11.0 requires that the patch PHKL_18543 be installed on the
system.
Table 2-3
Machine Class
LAN Drivers for 11.0
lan2
lan3
btlan
btlan3
btlan5
A
X
X
X
B
X
X
X
C
X
X
X
X
X
X
L
X
X
X
N
X
X
X
D (low end)
D (high end)
J (non-astro)
J (astro)
K
X
R
T
X
The following Table 2-4, “LAN Drivers for 10.20 and 10.30,” gives an estimate of what LAN drivers are
supported on versions 10.20 and 10.30
Table 2-4
Machine Class
LAN Drivers for 10.20 and 10.30
lan2
lan3
btlan
btlan3
btlan5
A
B
C
D (low end)
D (high end)
IPF
J (non-astro)
J (astro)
K
X
L
N
Chapter 2
31
Setting Up KWDB for Remote Debugging
LAN Cards
Table 2-4
Machine Class
LAN Drivers for 10.20 and 10.30 (Continued)
lan2
lan3
btlan
btlan3
btlan5
R
T
X
LAN Card Selection Rules for 11.10 and 11.11
The rules for selecting LAN cards for OS version 11.10 and 11.11 are:
1. KWDB uses the supported PCI btlan card at the lowest hardware address.
2. If there is no supported PCI btlan card then it chooses an NIO LAN card with a lan3 driver.
3. If there is neither a supported PCI btlan or an NIO LAN card, it chooses a LASI LAN card with a lan2
driver.
LAN Card Selection Rules for 11.23 and Later
The rules for selecting LAN cards for OS version 11.23 and later are:
1. KWDB uses the supported PCI btlan card.
2. If there is no supported PCI btlan card then it chooses an intl100 card.
3. If there is not btlan or intl100 card then it chooses igelan card.
4. If there is no btlan or intl100 or igelan card then it chooses ieither card.
If there are multiple cards of the same type KWDB chooses the card at the lowest hardware address.
LAN Card Selection Rules for 11.31 and Later
The 11.31 version of the kernel debugger implements a preference ordering for LAN drivers. When booted
with a specific preference order, the kernel debugger attempts to steal a LAN card belonging to that driver. If,
however, no card of that specified driver is found, or could not be claimed due to a hardware problem or if no
cable is connected to the card, the kernel debugger detects that condition, and attempts to select another card
belonging to the next driver in the preference list. The search continues till a LAN card is found. If the user
wishes, he can abort this behavior by pressing control C at the system console after the search for a card for
the initially preferred driver is completed. The preference list for LAN drivers in 11.31 kernels is::
1. btlan: by default -dlan or -dudp would attempt to select a btlan card. If -dlan.btlan is specified, btlan card
is searched for.
2. igelan: If no btlan card is found, kernel debugger attempts to take an igelan card.
3. intl100: If there is no btlan or igelan card, kernel debugger attempts to choose an intl100 card.
4. iether: If there is no btlan or igelan or intl100 card, then kernel debugger attempts to choose an iether
card.
If booted with -dlan.igelan, the preference list is igelan, btlan, intl100, iether. Likewise, if booted with
-dlan.intl100, then preference order is intl100, btlan, igelan, iether, and if booted with -dlan.iether, then
preference order is iether, btlan, igelan, and int100.
32
Chapter 2
Setting Up KWDB for Remote Debugging
LAN Cards
Which LAN Card to Install
If the machine does not have a LAN card that KWDB can use, the system administrator will need to install
one. For the lan2 driver, install a card that supports NIO LAN (sometimes referred to as HP-PB) on the
system. For the lan3 driver, install a card that supports LASI 10BaseT LAN on the system. For any btlan
driver, install a card that supports PCI 10/100 BaseT LAN on the system. See the How to Obtain a LAN Card
section for information on purchasing LAN cards for the target system.
NOTE
Chapter 2
Multiport btlan cards are not supported by KWDB in operating systems prior to the 11.31
release. In 11.31, 4 port btlan cards are supported by KWDB on both PA-Risc and IPF
platforms.
33
Setting Up KWDB for Remote Debugging
LAN Cards
LAN Cards for the IPF Architecture
Selecting LAN cards for the IPF architecture is simpler than it is for PA-RISC. For the IPF architecture, use a
btlan card, a built-in intl100 card, an add-on intl100 card, an igelan card, or an iether card.
The rules for IPF are summarized in Table 2-5, “LAN Cards/IPF Version.”:
Table 2-5
LAN Cards/IPF Version
Machine Class/Kernel Version
btlan
intl100
IPF/pre 11.22
X
IPF 11.22
X
X
IPF 11.23 or later
X
X
igelan
iether
X
X
If the kernel is earlier than version 11.22, then KWDB uses the btlan card with lowest hardware address.
Add a btlan card to the system, because they are not standard on IPF systems. Even if the system has a
btlan card, the ioscan command will probably not show it because btlan drivers are not usually built into
the IPF kernel.
If the kernel version is 11.22 KWDB will select the btlan card with lowest hardware address. If there is no
btlan card installed on the system KWDB will select the intl100 card with the lowest hardware address.
If the kernel version is 11.23 or later KWDB will select the btlan, intl100, igelan or iether card in the order.
It is possible to select a particular type of card for KWDB communication by specifying it along with -d boot
option. For instance, -dlan.btlan will select the btlan card, -dlan.intl100 will select the intl100 card,
-dlan.igelan will select the igelan card and -dlan.iether will select the iether card. If there are multiple
cards of the same type specified the card with lowest hardware address will be selected.
If the target system is an Intel IPF system, use the kwdb_config_kern utility to select the hardware address
of the LAN card to be used. See the kwdb_config_kern Utility section for information.
To find the hardware address of the LAN devices on the target system, issue the command:
# ioscan -fC lan
Results are like the following:
# ioscan -fC lan
Class I H/W Path
Driver S/W State H/W Type
Description
======================================================================
lan
0 0/16/1/5/0 intl100 CLAIMED
INTERFACE
Intel PCI Pro 10/100Tx Server
Adapter
34
Chapter 2
Setting Up KWDB for Remote Debugging
LAN Cards
How to Obtain a LAN Card
If the target Operating System version is 11.31 or later, the kernel debugger supports the following set of
cards. Kernel debugger does detect any other card (that is not specified in the list below) during its hardware
scan, but does not select them for kernel debugging.
Table 2-6
Card
(driver)
type
btlan
Description of LAN cards supported by kernel debugger in HPUX 11.31
PCI ID
Vendor
ID
0x1011
PCI Subsystem ID
Description
Device ID
Vendor ID
Device ID
0x0019
0x103c
0x104f
HP PCI 10/100Base-TX 21143
(btlan) 1 port adapter - core
0x1011
0x0019
0x103c
0x1066
HP PCI 10/100Base-TX 21143
(btlan) 1 port adapter - addon
Part no: A5230A/B5509BA
0x1011
0x0019
0x103c
0x125a
HP PCI 10/100Base-TX 21143
(btlan) 4 port adapter - addon.
Part no: A5506B
igelan
0x14e4
0x1644
0x103c
0x12a4
HP Gigabit Ethernet NIC
bmc5700 adapter - core
0x14e4
0x1645
0x103c
0x128a
HP Gigabit Ethernet NIC
bmc5701/TX adapter - addon.
Part no: A6825-60101
Chapter 2
0x14e4
0x16a7
0x103c
0x12a5
HP Gigabit Ethernet NIC
bmc5703/TX adapter - addon
0x14e4
0x1648
0x103c
0x12a6
HP Gigabit Ethernet NIC
bmc5704/TX adapter - addon
0x14e4
0x1645
0x103c
0x12ca
HP BCM95703C30 PCI/PCI-X
1000-BaseT FC/GigE Combo
adapter in core for Kona IPF
0x14e4
0x1645
0x103c
0x1328
HP PCI-X 1000Base-T Dual-port
Built-in (igelan) adapter in core
for Hurricane/Kona IPF Blades
0x14e4
0x1645
0x103c
0x12c1
HP A7109-60001 PCI (igelan)
1000Base-T Core
35
Setting Up KWDB for Remote Debugging
LAN Cards
Table 2-6
Card
(driver)
type
iether
Description of LAN cards supported by kernel debugger in HPUX 11.31
PCI ID
Vendor
ID
0x8086
PCI Subsystem ID
Description
Device ID
Vendor ID
Device ID
0x100e
0x103c
0x12a6
Intel PCI 1000 Base dual port
Anvik2/T (iether) adapter.
Part no: A7012-60001
intl100
0x8086
0x1079
0x103c
0x1274
Intel PCI Kenai-32 (iether)
adapter
0x8086
0x1079
0x103c
0x12d1
HP AB290-60001
U320/1000Base-T SCSI Combo
(iether) adapter - in core for
Mittlehorn IPF
0x8086
0x1079
0x103c
0x12d3
HP AB545A-60001 dual/Anvik2
4-port 1000B-T (iether) adapter in core for Mittlehorn IPF
0x8086
0x1229
0x103c
0x3000
Intel PCI Pro 10/100Tx Server
(intl100) adapter - core
0x8086
0x1229
0x103c
0x1280
Intel PCI Pro 10/100Tx Server
(intl100) adapter - adapter
If the target system is IPF or a PA-RISC system with support for the btlan driver, obtain and install a PCI
10/100 LAN B5509BA 10BaseT and 100BaseT RJ45 UTP, half-size PCI Universal Card. To obtain this card,
contact an HP support representative or visit the following web site:
http://www.hp.com/workstations/products/accessories/unix/io_cards/b5509ba/summary.html
If the target system is IPF and the OS version is 11.22 or later, KWDB supports the intl100 driver and the
Intel 100+ PCI Network Interface Card (NIC) can be used, which can be obtained from a retail outlet.
It might be difficult to obtain LAN cards for older systems which only support the lan2 or lan3 drivers.
Contact an HP support representative for assistance.
36
Chapter 2
Setting Up KWDB for Remote Debugging
KWDB Communications Server
KWDB Communications Server
If using a LAN connection between the host and target system, and the target is PA-RISC S700/800, IPF, or
V-Class, also run the communications server. The communications server runs as a daemon process. For
PA-RISC S700/800 and IPF the system it runs on must be on the same LAN subnet as the LAN card on the
target system. To determine this, run the ping command with the -o option on the system the
communications server will run on. An example, if the target system is named target1, run.
ping -o target1
Then Ctrl-c after a few seconds to stop the ping command. If the ping command prints only two systems after
the Ctrl-c they are on the same subnet.
# ping -o target1
PING target1.aa.bb.com: 64 byte packets
64 bytes from 11.0.99.222: icmp_seq=0. time=0. ms
^C
----target1.aa.bb.com PING Statistics---1 packets transmitted, 1 packets received, 0% packet loss
round-trip (ms)
min/avg/max = 1/1/1
1 packets sent via:
11.0.99.222
- target1.aa.bb.com
11.0.100.111
- system1.aa.bb.com
#
For V-Class targets, the communications server must run on the V-Class test station.
Which Communications Server to Use
Use one of two communications servers depending on the version of HP-UX on the target system. If using
version 11.10 or later, use kwdbd. If using version 11.0 or earlier on a PA-RISC S700/800 target use nddbcs.
Debugging a V-Class with KWDB on an OS earlier than 11.10 is not supported.
How to Start the Communications Server
Both kwdbd and nddbcs are installed in /usr/contrib/kwdb/bin. The syntax for starting the
communications server is either:
# /usr/contrib/kwdb/bin/kwdb [options]
or
# /usr/contrib/kwdb/bin/nddbcs [options]
The options may be any of the following:
-d
Execute the communications server in a daemon process.
-f device
Chapter 2
37
Setting Up KWDB for Remote Debugging
KWDB Communications Server
Specify a device for LAN communications with the target systems. This parameter has a different syntax
depending on the OS version. For 10.20 and earlier the format is -f/dev/lan<number> where <number> is 0,
1 and so forth. For example, -f/dev/lan0. For OS versions 10.30 and later the format is -flan<number>
where <number> is 0, 1 and so forth. The default device is /dev/lan0, or flan0, depending on the version of
the operating system. For a V-Class, the device file depends on the type of test station. If the test station is a
712, then use lan1. If the test station is a B-Class, then use lan0. Otherwise consult with the system
administrator to determine the device to specify for the V-Class. More than one device may be specified, each
preceded by -f. It might be necessary to specify more than one device if the machine on which the
communications server runs has more than one lan device in /dev. To determine this, use the command:
# ls /dev/lan*
If the command showed /dev/lan0 and /dev/lan1 for example, then specify both lan0 and lan1 for the -f
option.
How to Ensure Communications Server is Running
If running kwdbd, issue the command:
# ps -ef | grep kwdbd
If running nddbcs, use the command:
# ps -ef | grep nddbcs
Communications Server Log Files
The KWDB communications servers log information about host/target connections in a log file. For the kwdbd
communication server the log file is /var/opt/kwdb/kwdbd.log. For the nddbcs communication server, the
log file is /var/opt/nddb/nddb_error_log.
If there are problems connecting to a target machine and have verified that both target and communication
server are in the same subnet, the appropriate communications server is running and the log file does not
contain any possible errors, verify LAN connectivity between communication server and the target using the
command:
# linkloop <ethernet_MAC_address>
Where ethernet_MAC_address is the ethernet MAC address of the target LAN card. Make sure that the
target system is up and running, when the linkloop command is run.
Starting Communications Server at Boot Time
Arrange to start the kwdbd communication server at boot time by editing the file
/usr/contrib/kwdb/newconfig/etc/rc.config.d/kwdbd.
Change the value of KWDBD_START from 0 to 1, and change KWDBD_RS to contain the -f option. Comments in
this file are self explanatory.
Communications Server Configuration File
Make connecting to the target system more user friendly by editing the file /etc/opt/kwdb/kwdbd.conf.
This file provides a correlation between the Ethernet MAC address of the target system and the name of the
target system. It also allows defining of a default target machine. When invoking KWDB to connect to the
target system, ordinarily specify the Ethernet MAC address of the LAN card on the target system. (See
Chapter 3, “Getting Started with Remote Debugging,” for a description of how to connect to the target system.)
38
Chapter 2
Setting Up KWDB for Remote Debugging
KWDB Communications Server
If the kwdbd.conf file is edited to correlate the machine name with the Ethernet MAC address, specify the
machine name instead of the Ethernet MAC address when using KWDB’s target command. This file
contains self-explanatory comments. The format of the file is as follows:
#
Uncomment and edit as appropriate for the system:
#
#
#
#
#
#
Directive
---------
Machine name
------------
Ethernet address
----------------
map
map
default
cheetah
panther
cheetah
0x0800099a1234
0x0800099b5678
map
map
uxho0325
nddb6
0x080009932b50
0x080009419358
default
nddb6
The previous example specifies that the machine uxho0325 has the Ethernet MAC address 0x080009932b50
and the default machine to connect to is nddb6. Set the file permission of kwdb.conf to world-writable by
system administrator, so the users can edit this file to add new entries.
Chapter 2
39
Setting Up KWDB for Remote Debugging
kwdb_config_kern Utility
kwdb_config_kern Utility
It is possible to modify the vmunix kernel to change the communications device that KWDB uses on the target
system using a script called kwdb_config_kern. This can be done for PA-RISC and Intel IPF target systems
(this utility does not function on HP IPF systems). Also, this utility can be used to turn early boot code
debugging on or off. This utility works only on kernels whose OS version is 11.10 or later. for options that
require patching of vmunix, it must be run on the target system, and the system must be rebooted with the
same vmunix kernel that has been modified for the changes to take effect. To execute kwdb_config_kern,
enter:
# kwdb_config_kern kernel_file
Where kernel_file is the kernel file, usually vmunix, that runs on the target system.
The system displays a self explanatory menu of options:
kwdb_config_kern version 3.1.1 --KWDB target kernel configurator.
KWDB kernel configuration Main Menu.
1. Set/unset hardcoded communication device for host to target communication.
(to be used prior to booting).
2. Turn on or off lan or serial port based boottime debugging.
(to be used prior to booting).
3. Initialize the kernel debugger at runtime.
4. Display connection status of the kernel debugger.
5. Set/unset the IP address for UDP/IP communication.
0. Exit kwdb_config_kern.
Choose an action by number from the above list.
If #1, kwdb_config_kern is chosen, it can scan the system and present a list of communications devices, or an
option that will allow the hardware path of the communications device to be entered directly. The hardware
path must appear exactly as it is shown by the ioscan or lanscan commands, for example; 8/0/1/0. The
hardware path for both serial and LAN communication can be changed.
If the early boot code debugging option (option #2) is selected, a prompt to enter “yes” or “no” to turn it on or
off. The kwdb_config_kern script will modify the vmunix kernel, for the changes to take effect, reboot the
target system using this kernel.
If #3 option is selected, kwdb_config_kern would initialize the kernel debugger at runtime. This feature is
available for 11.31 kernels and beyond. Currently runtime initialization of kernel debugger is possible for
sub/sync based remote debugger and console debugger only. If option #4 is selected, kwdb_config_kern
displays the kernel debugger connection status. If the target kernel was booted without any kernel debugger
options, then it prints Kernel debugger is not initialized, otherwise, if booted with any of the kernel
debugging options, it prints the type of communication. This option can be used to determine the MAC
address of the LAN card or the UDP IP address being used for boot-nowait mode of kernel debugging when
debugging with LAN or UDP modes respectively. Usage of options #3 and #4 does not require booting of the
target system.
40
Chapter 2
Setting Up KWDB for Remote Debugging
kwdb_config_kern Utility
If #5 is selected, kwdb_config_kern allows the user to hardcode the vmunix with an IP address for UDP
based communication. Once this is done, for changes to take effect, the target system has to be rebooted.
Option #5 would not be printed for operating system versions prior to 11.22, because UDP-based remote
debugging was not supported in those kernels.
Chapter 2
41
Setting Up KWDB for Remote Debugging
kwdbctl Utility
kwdbctl Utility
The kwdbctl utility allows you to query and to control the state of the kernel debugger in a native system.
This utility has the capability to set dynamically attributes inside kernel debugger stub, and also to print the
hw_path of the kernel debugger remote communication device. This utility has support for online
initialization of the kernel debugger through lan, sub/sync, and console modes of communication. It prints the
output in machine readable format. This utility should be used as a superuser.
Usage
kwdbctl
kwdbctl
kwdbctl
kwdbctl
kwdbctl
-v
-q
-i
-d
-s
| -m
<connection>
| -D
attribute=value
The various options supported by kwdbctl are:
•
-v: print version information and then exit.
•
-q: queries kernel debugger parameters on native system
If the kernel is booted with option for debugging with LAN ,then kwdbctl -q gives the details of LAN
card selected for communication with the host and also prints the MAC address of the LAN card which
can be used for connecting from the remote system.
•
-m: same as -q, prints output in machine readable format
•
-i connection: initializes native system for kernel debugging with the specified connection. The
connection can be one of the following:
— For cell platforms: "sub" or "console" or "lan" or "crash"
— For non-cell platforms: "console" or "lan" or "crash"
•
-d: destroys kernel debugger from native system
•
-D: force destroys the kernel debugger from native system, and any breakpoints that were set by the
client (if any attached), are removed from the target memory.
•
-s <attrib>=<value>: set attributes inside the kernel debugger.
Supported attributes:
nodeconfig:
value can be 1 (kernel debugger cannot be deconfigured)
value can 0 (kernel debugger can be deconfigured). When turned on, the debugger would fail
the cell OLD requests if its remote communication device belongs to the cell being OLD'd.
pci_ola_card_claim:
value can be 1 (pre-initialize stub for remote debugging upon a future PCI OLA)
value can be 0 (to un-init a pre-initialized stub).
To configure for crashtime waiting after system boot.
crash_wait_timeout:
value can be 1 (enable timeout for crashtime remote attachment for 5 mins).
42
Chapter 2
3 Getting Started with Remote Debugging
KWDB uses two primary systems during a remote debugging session:
1. The host system, which runs the KWDB debugger client.
2. The target system, which runs the kernel to be debugged.
KWDB can debug three types of target HP-UX operating systems: 32 bit PA-RISC, 64 bit PA-RISC and IPF.
The host system where KWDB runs need not match the target system in terms of architecture or operating
system version. Whether the host system is 32 bit PA-RISC, 64 bit PA-RISC or IPF, debug any kind of target.
The only limitation is that if the host system is PA-RISC it’s operating system must be version 10.20 or later.
Because the kernel itself is being debugged, KWDB cannot run on the system that is being debugged. Instead,
it is a remote debugger which runs on a separate system (referred to as the “host” system) and communicates
with the system being debugged (referred to as the “target” system). There are at present six different
methods by which KWDB can communicate with the target system it is debugging:
1. LAN Communication with Comm Server — Communication via a Local Area Network (LAN). This
usually may require that an additional LAN card be installed on the target system. It also requires that a
communications server run as a separate process.
2. Serial Communication — A direct RS-232 connection between the host and target machines. This
requires close physical proximity between the host and target machines and is slow.
3. Lantron Serial Communication — This is an RS-232 connection between the target system and a
Lantronix box. This eliminates the need for close physical proximity between the host and target systems
but the connection is still slow.
4. Dedicated Device Communication:
SUB/SINC:
The Superdome, Keystone, Matterhorn and Orca systems have a dedicated debugger
device that can communicate with KWDB. They use the SUB/SINC for debugger
communication.
SONIC LAN:
V-Class systems have a special type of LAN card called SONIC LAN for debugger
communication.
5. Communication via the Target system’s console debugger — If the target system has a remote console and
the operating system is version 11.11 or later, use this communication method.
6. UDP Communication — Communication using UDP between host and target systems. This usually may
require that an additional LAN card be installed on the target system. The OS version of the kernel must
be 11.22 or later.
This chapter assumes that any special setup and installation required to use the above communication
methods has already been done. For setup and installation instructions and more detail about the
communication methods, refer to Chapter 2, “Setting Up KWDB for Remote Debugging.”
To use KWDB to debug the kernel, the kernel’s version must be 11.10 or later. However, KWDB can be used to
debug 11.0 and older kernels (with some limitations) using its nddb-compatibility mode (NDDB is the name of
a previous HP kernel debugger). Chapter 2, “Setting Up KWDB for Remote Debugging,” on page 19 describes
how to do this. The remainder of this chapter describes how to boot the target kernel and invoke KWDB for
remote debugging depending on the type of target machine being debugged and the communication method
used.
Chapter 3
43
Getting Started with Remote Debugging
Before Starting a KWDB Debug Section
Before Starting a KWDB Debug Section
To use KWDB, the following is needed:
•
Host system, with KWDB installed.
•
Target system, booted for debugging. If the target operating system version is 11.31 and beyond, kernel
debugging can be achieved without having to boot the kernel debugger options.
•
If using LAN communications with comm server, a communications server, on which the communications
daemon kwdbd is running. This must be on the same subnet as the target system. The host system itself
can be used as communication server provided the target system is on the same subnet.
•
Copy of the kernel that’s to be debugged must reside on both the host and target systems. Any source files
that are to be symbolically debugged must also be present on the host. Copy those files to the host system.
•
Edit /etc/opt/kwdbd/kwdbd.conf to add the name of the machine along with its ethernet MAC address,
so that kwdbd can find the test machine by name.
44
Chapter 3
Getting Started with Remote Debugging
Starting KWDB Debug Session
Starting KWDB Debug Session
To start a KWDB kernel debugging session, start KWDB on the host system, boot the target system, and
attach the host debugger client to the target system.
The following sections describe the processes to establish a KWDB debugging session:
•
Starting the KWDB Debugger on the HOST system
•
Booting and Attaching the Target System for Debugging
•
Booting the kernel without debugger options and initializing kernel debugger later (for Operating Systems
starting from 11.31 and beyond)
Starting the KWDB Debugger
Start KWDB on a copy of the target kernel executable file on the host system. The KWDB run string syntax
is:
kwdb kernel_file
where kernel_file specifies the pathname of the host’s copy of the target’s kernel file.
As mentioned earlier, this kernel file must be the same as the kernel file booted on the target system. If doing
source level debugging, have the source files that were compiled with debug flags present on the host system.
If the source files are not in the default path searched by KWDB, tell KWDB where to find them by using the
KWDB command:
dir path-name
where path-name is the directory path to the location of the source files.
KWDB supports the following interfaces:
•
Default command line interface.
•
The DDD interface, a widely used free software graphical user interface for GDB.
To start KWDB in XDB compatibility mode, which allows for use of XDB commands, use the -xdb option. The
following example shows how to start KWDB in XDB compatibility mode.
% kwdb -xdb vmunix
To start KWDB with the DDD interface, use the following example:
% ddd -debugger kwdb vmunix
To automatically execute KWDB commands on each invocation of the debugger, enter commands into one of
the KWDB init files, $HOME/.kwdbinit and ./.kwdbinit (where . refers to the current directory from which
KWDB is run). The commands in $HOME/.kwdbinit will be executed first followed by those in ./.kwdbinit
Chapter 3
45
Getting Started with Remote Debugging
Starting KWDB Debug Session
Booting and Attaching the Target System for Debugging
To prepare for a debugging session, reboot the target system or attach to a running kernel on the target, if
debugging has been previously enabled. In either case, the target must have KWDB debugging enabled before
attaching the target with the KWDB client on the host system. This is normally done by booting the target
using the flags defined in the subsections of this chapter.
Methods of Booting Target System
Select one of the two different methods to boot the target for debugging:
1. Boot-and-wait for client connection.
2. Boot-without-wait for client connection.
The method selected determines “the first breakpoint” and when to attach the host to the target for
debugging.
❏
Boot-and-wait for Client Connection
The first breakpoint is the place at which the target kernel is positioned after establishing the connection.
Ordinarily, when the kernel is booted with a boot flag for boot-and-wait that enables debugging, the
kernel will stop early in the boot process and print the message waiting for kernel debugger to
attach. It is at that point that the KWDB target and attach commands are issued on the host system.
When the target is booted to wait for a debugger client to attach, the target is positioned at KWDB’s
initial connection point. Begin issuing KWDB commands to set breakpoints, examine registers and
memory etc. In order for the kernel to continue the boot process, enter the KWDB continue command
which can be abbreviated as “c”. The point in the bootup sequence at which this first breakpoint occurs
may vary by target platform and kernel capability. If the platform has early boot code debugging
capability, KWDB normally connects at the end of routine monarch_init(), early in real-mode
initialization. Targets debugged via PCI LAN currently attach later, during virtual-mode I/O
configuration. For 11.31 and beyond, it is possible to debug the kernel much earlier (as mentioned above).
❏
Boot-without-wait for Client Connection
The target system can be booted with a boot flag for boot-without-wait that enables debugging. In this
method target system does not stop and wait for the KWDB target and attach commands; instead it
completes the boot process. Attach KWDB to the target system at any time using the target and attach
commands.
NOTE
If the code needed to debug is only executed during bootup time before the first breakpoint,
KWDB cannot be used to examine the code. This includes portions of the code for $locore,
realmain(), and monarch_init().
The commands and process used to boot and attach the host to the target depend on the following factors:
•
Type of target system; S700/S800, V-Class, Superdome, Keystone, Matterhorn, Orca, IPF.
•
Communication method: LAN with comm server, RS-232, Lantron serial, SUB/SINC, Console, UDP.
•
Type of attachment: boot-and-wait or attach to a running kernel.
•
In pre 11.31 Operating Systems, the initial breakpoint is at kernel’s kgdb_break for PA kernels and
kdebug_kern_break for IPF kernels. In 11.31 kernels, initial breakpoint is very early in the kernel boot for sub/sync communication on cell platforms, the kernel can be debugged from the very first function of
the kernel, for other remote communications it can be debugged after the 10th function of the kernel on
IPF and 18th function on PA-RISC.
46
Chapter 3
Getting Started with Remote Debugging
Starting KWDB Debug Session
For console debugger, kernel can be debugged after kernel's in-core symbol table is created (which is after
the 4th function of the kernel boot process). If console target mode of remote communication is used,
remote source level debugging can be achieved from that point onwards. For other remote
communications (lan, udp, serial), kernel debugger's routine for the first breakpoint is kwdb_boot_init()
on PA-RISC (which is called at the end of monarch_init() - which is the 18th function called from realmain
calllist during boot), and kwdb_boot_init_lan_serial() on IPF (which is called after ACPI subsystem is
initialized - which is the 10th function called from sysinit calllist).
The kernel debugger’s routine for the first breakpoint is kwdb_boot_init() on PA-RISC (which is called at
the end of monarch_init()) and kwdb_boot_init_lan_serial() on IPF.
The following sections describe the procedures for specific configurations.
Debugging Superdome/Matterhorn/Keystone/Orca with Firmware sub/sync
For a PA system, boot the target machine to ISL, and enter one of the following at the ISL> prompt:
ISL> hpux -f0x8002 kernel_file
For 11.31 and beyond, users can use a more friendly command from the ISL. This is a platform-independent
method:
ISL> hpux kernel_file kwdb_flags=sub
(for backward compatability reasons, bothe the -f and kwdb_flags method work)
(Boot-and-wait) The kernel stops and waits for a client connection during the bootup sequence, rather than
booting up normally.
For pre 11.31 kernels,
ISL> hpux -f0x8000 kernel_file
For 11.31 and beyond, users can use the platform independent kwdb_flags environment variable from ISL:
ISL> hpux kernel_file kwdb_flags=sub.nowait
(Boot-without-wait) Attach the debugger client to the target at a later time.
For an IPF system boot the target as follows:
HPUX > boot kernel_file -dsub
(Boot-and-wait) The kernel stops and waits for a client connection during the bootup sequence, rather than
booting up normally.
HPUX > boot kernel_file -d0x41
(Boot-without-wait) Attach the debugger client to the target at a later time. For 11.31 kernels, the platform
independent kwdb_flags environment variable method works on IPF also.
After booting the target, run KWDB on the host system as follows:
$ kwdb kernel_file
(kwdb) target sub name_of_sub[:47001]
(kwdb) attach 0 partition_name
kernel_file
Specifies the name of the host’s copy of the kernel executable file booted on
the target.
name_of_sub
Specifies the name of sub for Superdome communication.
:47001
Specifies the port number. This value is included only if file
/etc/services on the host does not define service kwdbd as TCP port
47001.
Chapter 3
47
Getting Started with Remote Debugging
Starting KWDB Debug Session
Specifies the name of the partition to debug. This name is case sensitive. If
the partition name contains white space, it must be surrounded by double
quotes.
partition_name
This is shown in Figure 3-1, “Debugging Superdome/Matterhorn/Keystone/Orca Target.”
Figure 3-1
Debugging Superdome/Matterhorn/Keystone/Orca Target
Host
$ kwdb vmunix
(kwdb) target sub Sub:47001
(kwdb) att 0 partitionN
TCP/IP
Superdome/Matterhorn
Keystone/Orca
Sub
Partition1
PartitionN (Target)
....
ISL>hpux -f0x8002 vmunix (on PA)
HPUX> boot vmunix -dsub (on IPF)
From 11.31 and beyond, all cell based machines (both PA-RISC Matterhorns, Keystones, and Superdomes and
IPF Orca, Eiger etc) support LAN based remote debugging also. The steps and procedure for LAN based
remote debugging on the cell based platforms is same as that for non-cell platforms (PA-RISC S700/S800
N/L-class boxes, PA-RISC Mt Hamilton class of boxes, and IPF non-cell boxes). Refer to “Debugging
S700/S7800 Target Using LAN” on page 49 for more details.
Debugging V-Class Target Using LAN
Boot the target machine to the Command: prompt and enter one of the following:
Command: boot pri -f0x8002 kernel_file
(Boot-and-wait) The kernel stops and waits for a client connection during the boot up sequence, rather than
booting up as usual.
Command: boot pri -f0x8000 kernel_file
(Boot-without-wait) Attach the debugger client to the target at a later time.
On the target, kernel_file is usually /stand/vmunix
After booting the target, run KWDB on the host system as follows:
$kwdb kernel_file
(kwdb) target pa_kern test_station[:47001]
(kwdb) attach 0 target_id
kernel_file
Specifies the name of the host’s copy of the kernel executable file booted on the target.
test_station
Specifies the name of the V-Class test station for the target, where kwdbd is running.
48
Chapter 3
Getting Started with Remote Debugging
Starting KWDB Debug Session
:47001
Specifies the port number. This value is needed only if file /etc/services on the host does
not define service kwdbd as TCP port 47001. Starting with 11.31, this port number need not
be given if the /etc/services on the host does not have an entry for kwdbd. In case there is
no entry for kwdbd in the /etc/services file for kwdbd service then the port 1127 will be
used by default for talking to the communication server.
target_id => sonic-mac-address | mnemonic-identifier
For example, target_id can be either sonic-mac-address or mnemonic-identifier.
•
The “sonic-mac-address” is ethernet MAC address (or station address) of the SONIC LAN card in the
target. The station address is a sequence of 12 hexadecimal digits preceded by the string “0x”. For
example, 0x0060b0079447.
•
The “mnemonic-identifier” is a name for the target’s SONIC LAN card, often the target system’s name, as
given by the kwdbd configuration file, kwdbd.conf, on comm_server. See the Chapter 2, “Setting Up
KWDB for Remote Debugging,” for more information.
This is shown in Figure 3-2, “Debugging V-Class Target.”
Figure 3-2
Debugging V-Class Target
Host
$ kwdb vmunix
(kwdb) target pa_kern test_station:47001
(kwdb) att 0 partitionN
TCP/IP
V-Class Target
Test Station
Partition1
PartitionN (Target)
....
HPUX> boot pri -f0x8002 vmunix
Debugging S700/S7800 Target Using LAN
Boot the target machine to ISL, and enter one of the following at the ISL> prompt:
For pre 11.31 kernels,
ISL> hpux -f0xc003 kernel_file
For 11.31 and beyond, users can use a more user friendly command from the ISL. This is a platform
independent method:
ISL> hpux kernel_file kwdb_flags=lan.[driver]
(Boot-and-wait) The kernel stops and waits for a client connection during the bootup sequence, rather than
booting up normally. In 11.31, the driver option lets the user specify which LAN driver would be his most preferred
one whose cards are to be used for kernel debugging. The driver names can be btlan, igelan, intl100, and iether.
Preference of the lan drivers is discussed in detail in “LAN Card Selection Rules for 11.31 and Later” on page 32.
Chapter 3
49
Getting Started with Remote Debugging
Starting KWDB Debug Session
In 11.31, it is also possible to specify the driver name through the -f option as follows:
ISL> hpux -f0x10c003 kernel_file (for specifying btlan driver, same as 0xc003)
ISL> hpux -f0x20c003 kernel_file (for specifying igelan driver)
ISL> hpux -f0x40c003 kernel_file (for specifying intl100 driver)
ISL> hpux -f0x80c003 kernel_file (for specifying iether driver)
(Boot-without-wait) Attach the debugger client to the target at a later time.
For pre 11.31 kernels,
ISL> hpux -f0xc001 kernel_file
For 11.31 and beyond, the platform independent environment variable method can be used:
ISL> hpux kernel_file kwdb_flags=lan.[driver.[nowait]]
In 11.31 the driver specification is optional. See “LAN Card Selection Rules for 11.31 and Later” on page 32.
On the target, kernel_file is usually /stand/vmunix.
After booting the target, run kwdb on the host system as follows:
$ kwdb kernel_file
(kwdb) target pa_kern comm_server[:47001]
(kwdb) attach 0 target_id
kernel_file
Specifies the name of the host’s copy of the kernel executable file booted on the target.
comm_server
Specifies the name of the system where kwdbd is running for the target. This can be any
system running kwdbd on the LAN subnet to which the target’s debugger LAN card is
cabled. The target and comm_server has to be in the same LAN subnet.
:47001
Specifies the port number. This value is needed only if file /etc/services on the host does
not define service kwdbd as TCP port 47001. Starting with 11.31, this port number need not
be specified even if the /etc/services on the host does not define the service kwdbd as TCP
port 47001. When no entry is present in the /etc/services file for kwdbd service, the kwdbd
has been enhanced to use the default port of 1127.
target_id => lan-mac-address | mnemonic-identifier
For example, target_id can be either lan-mac-address or mnemonic-identifier.
•
The “lan-mac-address” is the Ethernet LAN MAC address of the LAN card used for debugger
communications in the target system. The MAC address is a sequence of 12 hexadecimal digits preceded
by the string “0x”, as reported by the lanscan (1M) command on the target (if a driver had bound to the
card). For example, 0x0060b0079447. Some kernels will print this value along with the waiting for
kernel debugger to attach message. If not, see Chapter 2, “Setting Up KWDB for Remote Debugging,”
for instructions on how to determine this value.
•
In 11.31, for boot-without mode of kernel debugging, it is possible to query the target kernel for getting
the lan-mac-address. The user can either use the kwdb_config_kern utility as discussed in “LAN Card
Selection Rules for 11.31 and Later” on page 32, or use kwdbctl -q in order to obtain the
lan-mac-address of the LAN card which is being used by the kernel debugger.
•
The “mnemonic-identifier” is a name for the target LAN card, often the target system’s name, as given by
the kwdbd configuration file kwdbd.conf on comm_server. See the Chapter 2, “Setting Up KWDB for
Remote Debugging,” for more information.
This is shown in Figure 3-3, “Debugging S700/S800 PA Target Using LAN.”
50
Chapter 3
Getting Started with Remote Debugging
Starting KWDB Debug Session
Figure 3-3
Debugging S700/S800 PA Target Using LAN
Host
$ kwdb vmunix
(kwdb) target pa_kern cc_depot:47001
(kwdb) att 0 tgt1
TCP/IP
Comm_server
(cc-depot)
Target
(tgt1)
ISL> hpux -f0xfc003 vmunix
Debugging IPF Target Using LAN
Boot the target machine to ISL, and enter the following at the boot prompt:
For pre 11.31 kernels,
HPUX> boot kernel_file -dlan
For 11.31 and beyond, users can use a more friendly command from the HPUX boot loader prompt:
HPUX> boot kernel_file kwdb_flags=lan.[driver]
(Boot-and-wait) The kernel stops and waits for a client connection during the bootup sequence, rather than
booting up normally. In 11.31, the driver option lets the user specify which LAN driver would be his most preferred
one whose cards are to be used for kernel debugging. The driver names can be btlan, igelan, intl100, and iether.
Preference of the lan drivers is discussed in detail in “LAN Card Selection Rules for 11.31 and Later” on page 32.
(Boot-and-wait) The kernel stops and waits for a client connection during the bootup sequence, rather than
booting up normally. It is possible to specify the type of LAN card for KWDB on HP-UX kernel version 11.23
or later by using the option -dlan.intl100 for intl100 card, -dlan.igelan for igelan card, or
-dlan.iether for iether card.
For pre 11.31 kernels,
HPUX> boot kernel_file -d0x111
For 11.31 and beyond, users can use a more friendly command:
HPUX> boot kernel_file -dlan.[driver.]nowait
or
HPUX> boot kernel_file kwdb_flags=lan.[driver.]nowait
(Boot-without-wait) Attach the debugger client to the target at a later time. On the target, kernel_file is
usually /stand/vmunix.
For HP IPF systems, a btlan card is normally used by KWDB for LAN communication between host and
target systems. It is possible to select the intl100 card for communication on pre HP-UX 11.23 kernels by
booting the target using the -z option.
Chapter 3
51
Getting Started with Remote Debugging
Starting KWDB Debug Session
After booting the target, run kwdb on the host system as follows:
$ kwdb kernel_file
(kwdb) target ia64_kern comm_server[:47001]
(kwdb) attach 0 target_id
kernel_file
Specifies the name of the host’s copy of the kernel executable file booted on the target.
comm_server
Specifies the name of the system where kwdbd is running for the target. This can be any
system running kwdbd on the LAN subnet to which the target’s debugger LAN card is
cabled. The target and comm_server has to be in the same LAN subnet.
:47001
Specifies the port number. This value is needed only if file /etc/services on the host does
not define service kwdbd as TCP port 47001. Starting with 11.31, this port number need not
be specified if the file /etc/services on the host does not define the service kwdbd as TCP
port 47001. When no entry is present in the /etc/services file for kwdbd service), the
kwdbd has been enhanced to use the default port of 1127.
target_id => lan-mac-address | mnemonic-identifier is either lan-mac-address or
mnemonic-identifier.
•
The “lan-mac-address” is the Ethernet LAN MAC address (or test address) of the LAN card used for
debugger communications in the target system. The test address is a sequence of 12 hexadecimal digits
preceded by the string “0x”, as reported by the lanscan (1M) command on the target (if a driver had bound
to the card). For example, 0x0060b0079447. The kernels will print this value along with the waiting for
kernel debugger to attach message.
•
In 11.31, for boot-without mode of kernel debugging, it is possible to query the target kernel for getting
the lan-mac-address. The user can either use the kwdb_config_kern utility as discussed in
“kwdb_config_kern Utility” on page 40, or use kwdbctl -q in order to obtain the lan-mac-address of the
LAN card which is being used by the kernel debugger.
•
The “mnemonic-identifier” is a mnemonic identifier for the target LAN card, often the target system’s
name, as given by the kwdbd configuration file kwdbd.conf on comm_server. See the Chapter 2, “Setting
Up KWDB for Remote Debugging,” for more information.
This is shown in Figure 3-4, “Debugging IPF Target Using LAN.”
Figure 3-4
Debugging IPF Target Using LAN
Host
$ kwdb vmunix
(kwdb) target ia64_kern cc_depot:47001
(kwdb) att 0 tgt1
Comm_server
(cc-depot)
TCP/IP
Target
(tgt1)
HPUX> boot vmunix -dlan
52
Chapter 3
Getting Started with Remote Debugging
Starting KWDB Debug Session
Debugging S700/S800 Target Using RS-232
Boot the target machine to ISL and enter one of the following at the ISL> prompt:
ISL> hpux -f0x8003 kernel_file
(Boot-and-wait) The kernel stops and waits for a client connection during the bootup sequence, rather than
booting up normally.
ISL> hpux -f0x8001 kernel_file
(Boot-without-wait) Attach the debugging client to the target at a later time.
On the target, kernel_file is usually /stand/vmunix. After booting the target, run kwdb on the host
system as follows:
$ kwdb kernel_file
(kwdb) target serial [device_file] [baud_rate]
(kwdb) attach 0
kernel_file
Specifies the name of the host’s copy of the kernel executable file booted on the target.
device_file
Specifies the name of the host RS-232 device file to use for communicating with the target.
This device file describes the host’s serial port that is cabled to the target. If this parameter
is not given, the default is /dev/tty1p0 (which is the second serial port for many S700
platforms).
baud_rate
Specifies the baud rate. This value must match the value used by the target kernel. The
default baud rate for PA targets is 19200.
NOTE
In Operating System 11.31 and beyond, on PA-RISC, serial communication is supported only
for built-in PCI serial cards. The kernel debugger in these platforms does not make use of the
built-in serial cards on PA-RISC boxes.
This is shown in Figure 3-5, “Debugging S700/S800 PA Target Using a Serial Connection.”
Figure 3-5
Debugging S700/S800 PA Target Using a Serial Connection
Host
$ kwdb vmunix
(kwdb) target serial
(kwdb) att 0
RS-232
Target
ISL> hpux -f0x8003 vmunix
Debugging IPF Target Using RS-232
Boot the target machine and enter the following at the boot prompt:
For pre 11.31 kernels,
HPUX> boot kernel_file -dserial
Chapter 3
53
Getting Started with Remote Debugging
Starting KWDB Debug Session
For 11.31 kernels and beyond, you can specify which serial card you want to use - the built-in one or the PCI
serial one (if present)
For selecting builtin serial cards:
HPUX> boot kernel_file -dserial
or
HPUX> boot kernel_file kwdb_flags=serial
For selecting PCI serial cards:
HPUX> boot kernel_file -dserial.pci
or
HPUX> boot kernel_file kwdb_flags=serial.pci
(Boot-and-wait) The kernel stops and waits for a client connection during the bootup sequence, rather than
booting up normally.
For pre 11.31 kernels,
HPUX> boot kernel_file -d0x121
For 11.31 kernels and beyond, you could specify the nowait tag to specify whether the kernel should wait or
not:
HPUX> boot kernel_file -dserial.[pci.]nowait
or
HPUX> boot kernel_file kwdb_flags=serial.[pci.]nowait
(Boot-without-wait) Attach the debugger client to the target at a later time. On the target, kernel_file is
usually /stand/vmunix.
Target system’s COM1 port is used for serial communication between host and target systems. It is possible to
select COM2 port on target system for serial communication by booting the target using -z option.
After booting the target, run kwdb on the host system as follows:
$ kwdb kernel_file
(kwdb) target serial [device_file] [baud_rate]
(kwdb) attach 0
kernel_file
Specifies the name of the host’s copy of the kernel executable file booted on the target.
device_file
Specifies the name of the host RS-232 device file to use for communicating with the target.
This device file describes the host’s serial port that is cabled to the target. If this parameter
is not given, the default is /dev/tty1p0 (which is the second serial port for many S700
platforms).
baud_rate
Specifies the baud rate. This value must match the value used by the target kernel. The
default baud rate for IPF targets is 57600.
This is shown in Figure 3-6, “Debugging IPF Target Using a Serial Connection.”
54
Chapter 3
Getting Started with Remote Debugging
Starting KWDB Debug Session
Figure 3-6
Debugging IPF Target Using a Serial Connection
Host
$ kwdb vmunix
(kwdb) target serial
(kwdb) att 0
RS-232
Target
HPUX> boot vmunix -dserial
Debugging S700/S800 Target Using Lantron Serial
Boot the target machine to ISL and enter one of the following at the ISL> prompt:
ISL> hpux -f0x8003 kernel_file
(Boot-and-wait) The kernel stops and waits for a client connection during the bootup sequence, rather than
booting up normally.
ISL> hpux -f0x8001 kernel_file
(Boot-without-wait) Attach to the target at a later time.
After booting the target, run kwdb on the host system as follows:
$ kwdb kernel_file
(kwdb) target lantron_serial lantron_name:30nn
(kwdb) attach 0
kernel_file
Specifies the name of the host’s copy of the kernel executable file booted on the target.
lantron_name
Specifies the name of the terminal server such as Lantronix box which is connected to the
target.
30nn
Needed to bind a TCP session to the lantron. nn is the number of physical port on the
Lantronix box that the serial cable from the target is plugged in to.
This is shown in Figure 3-7, “Debugging S700/S800 PA Target Using Lantron Serial.”
Chapter 3
55
Getting Started with Remote Debugging
Starting KWDB Debug Session
Figure 3-7
Debugging S700/S800 PA Target Using Lantron Serial
Host
$ kwdb vmunix
(kwdb) target lantron_serial lrs32f04:3001
(kwdb) att 0
TCP/IP
Terminal Server
(Lantronix)
(lrs32f04)
Target
ISL> hpux -f0x8003 vmunix
Debugging IPF Target Using Lantron Serial
Boot the target machine to ISL and enter one of the following at the boot prompt:
HPUX> boot kernel_file -dserial
(Boot-and-wait) The kernel stops and waits for a client connection during the bootup sequence, rather than
booting up normally.
HPUX> boot kernel_file -d0x121
(Boot-without-wait) Attach the debugger client to the target at a later time.
For Intel IPF target system COM1 port is used for serial communication between host and target systems
through Lantronix. For HP IPF target system COM2 port is used for serial communication between host and
target systems through Lantronix. It is possible to select COM2 port on the Intel IPF target system for
communication by booting the target using the -z option. It is possible to select COM1 port on HP IPF target
system for communication by booting the target using the -z option. After booting the target, run kwdb on the
host system as follows:
$ kwdb kernel_file
(kwdb) target lantron_serial lantron_name:30nn
(kwdb) attach 0
kernel_file
Specifies the name of the host’s copy of the kernel executable file booted on the target.
lantron_name
Specifies the name of the terminal server such as Lantronix box which is connected to the
target.
:30nn
Needed to bind a TCP session to the lantron. nn is the number of the physical port on the
Lantronix box that the serial cable from the target is plugged in to.
This is shown in Figure 3-8, “Debugging IPF Target Using Lantron Serial.”
56
Chapter 3
Getting Started with Remote Debugging
Starting KWDB Debug Session
Figure 3-8
Debugging IPF Target Using Lantron Serial
Host
$ kwdb vmunix
(kwdb) target lantron_serial lrs32f04:3001
(kwdb) att 0
TCP/IP
Terminal Server
(Lantronix)
(lrs32f04)
RS-232
Target
HPUX> boot vmunix -dserial
Debugging Targets Using Remote Console
Every HP-UX kernel 11.11 and later has a built-in debugger that can be accessed from the system console.
This is commonly referred to as the “on-console” debugger. This is also called “single system debugger” as the
debugging on the target system itself.
This is shown in Figure 3-9, “Assembly Level Debugging PA/IPF Target Using On-Console Debugger.”
Figure 3-9
Assembly Level Debugging PA/IPF Target Using On-Console Debugger
Target
ISL> hpux -f0x20002 vmunix (on PA)
HPUX> boot vmunix -dconsole (on IPF)
kwdb[0]
For an IPF system, boot the target machine to ISL and enter the following at the boot prompt:
For pre 11.31 kernels,
HPUX> boot kernel_file -dconsole
For 11.31 and beyond,
HPUX> boot kernel_file -dconsole
or
HPUX> boot kernel_file kwdb_flags=console
(Boot-and-wait) The kernel stops and waits at kwdb[0] prompt. Where kernel_file is usually
/stand/vmunix.
For pre 11.31 kernels,
Chapter 3
57
Getting Started with Remote Debugging
Starting KWDB Debug Session
HPUX> boot kernel_file -d0x181
For 11.31 and beyond,
HPUX> boot kernel_file -dconsole.nowait
or
HPUX> boot kernel_file kwdb_flags=console.nowait
(Boot-without-wait) System boots up normally and can be interrupted to get kwdb[0] prompt for debugging
the system at a later time by pressing Ctrl-x.
For an S700/S800 PA system, boot the target as follows:
For pre 11.31 kernels,
ISL> hpux -f0x20002 kernel_file
For 11.31 and beyond,
ISL> hpux -f0x20002 kernel_file
or
ISL> hpux kernel_file kwdb_flags=console
(Boot-and-wait) The kernel stops and waits at kwdb[0] prompt.
For pre 11.31 kernels,
ISL> hpux -f0x20000 kernel_file
For 11.31 and beyond,
ISL> hpux -f0x20000 kernel_file
or
ISL> hpux kernel_file kwdb_flags=console.nowait
(Boot-without-wait) The flag 0x20000 is used if stop on boot is not desired. System boots up normally and can
be interrupted to get kwdb[0] prompt for debugging the system at a later time by pressing Ctrl-x.
This debugger has the advantage of requiring no communications setup since it runs on the target system
itself, but it has a limited set of commands. The list of commands supported on a single system (on-console)
debugger will be described in the Chapter 4, “Command Reference.” The on-console debugger only allows
assembly level debugging.
Use kwdb on a host system in conjunction with the on-console debugger on the target system to provide
symbolic debugging through remote console. Use the full set of KWDB commands with no extra
communications setup as long as there is a remote console for the target system that is implemented via a
Lantronix box.
Using Console Target for Targets with Latronix Console
After booting the target to the kwdb[0] prompt and disconnecting from the remote console run KWDB on the
host system as follows:
$ kwdb kernel_file
(kwdb) target console lantron_name:20nn
kernel_file
Specifies the name of the host’s copy of the kernel executable file booted on the target.
lantron_name
Specifies the name of the terminal server such as Lantronix box which is connected to the
target.
58
Chapter 3
Getting Started with Remote Debugging
Starting KWDB Debug Session
:20nn
Needed to bind a TCP session to the lantron. nn is the number of physical port on the
Lantronix box that the serial cable from the target is plugged in to.
When communication has been established by the target command, an xterm will appear on the host
system’s screen. This will be the new system console window. When the kwdb[0] prompt appears on the
xterm, enter the following command at “KWDB” prompt from KWDB window.
(kwdb) attach 0 Begin the debugging session in the LWDB window. If exiting from the debugger, the xterm
will disappear. To reconnect, get the kwdb[0] prompt back on the system console. To do this,
connect to the remote console for the target system and enter Ctrl-x on the system console.
This will interrupt the running kernel and should see the on-console debugger prompt,
kwdb[0]. Disconnect from the remote console so that KWDB can access it. Reconnect to the
on-console debugger using the same kwdb commands that were used to connect when the
target was booted.
NOTE
Communications between the KWDB on host system and the on-console debugger on target
system is currently slower than other remote targets. Improvements have been made in KWDB
3.1.3 release towards improvement of the speed of the console target, however, it still does not
work as fast as LAN or UDP based remote debugging. It also depends on the target kernel
version whether KWDB client would use the performance improvement enhancements for
console target - for example, when KWDB 3.1.3 is used to debug pre 11.31 kernels (which does
not support the new protocol improvements for supporting console target performance
improvements), KWDB 3.1.3 would automatically use the older method of communication,
which would be still slower (as with older versions of KWDB).
This debugging is shown in Figure 3-10, “Debugging PA/IPF Target Using Remote Console.”
Figure 3-10
Debugging PA/IPF Target Using Remote Console
Host
$ kwdb vmunix
(kwdb) target console lrs32f04:2004
(kwdb) att 0
TCP/IP
Terminal Server
(Lantronix)
(lrs32f04)
RS-232
Target
ISL> hpux -f0x20002 vmunix (on PA)
HPUX> boot vmuni -dconsole (on IPF)
Chapter 3
59
Getting Started with Remote Debugging
Starting KWDB Debug Session
Using Console Target for Targets with MP or GSP Console
For debugging the console target feature for systems with MP or GSP consoles, users can start the target as
mentioned above. On the host system, the user needs to specify the MP or GSP name instead of the lantron
name, and use “23” as the port number:
$ kwdb kernel_file
(kwdb) target console MP_name[:23]
kernel_file
Specifies the name of the host’s copy of the kernel executable file booted on the target.
MP_name
Specifies the name of name of the MP representing the remote console of the target.
Optionally the user may specify 23 as the port number. If not specify, KWDB would use the
port 23 which is the telnet service. Once done, KWDB console would launch an X-terminal
representing the remote console, where the user needs to enter the MP/GSP login and
password, and bring it upto the console debugger prompt prior to issuing the “attach 0”
command in the KWDB client.
MP_name
Specifies the name of name of the MP representing the remote console of the target.
Optionally the user may specify 23 as the port number. If not specify, KWDB would use the
port 23 which is the telnet service. Once done, KWDB console would launch an X-terminal
representing the remote console, where the user needs to enter the MP/GSP login and
password, and bring it upto the console debugger prompt prior to issuing the “attach 0”
command in the KWDB clientMP_name.
Using the kwdb.conf File for Simplifying the Mapping of Lantron Names
To make connecting to the remote target system more user friendly, KWDB provides a mapping file for
console and lantron serial targets. The mapping file is located at /etc/opt/kwdb/kwdb.conf on the kwdb
host system. This file provides a mapping of the terminal server and the port number connected to the target
system with a symbolic name. If the /etc/opt/kwdb/kwdb.conf file is edited to map the terminal server and
the port number with a symbolic name, the user can specify the symbolic name with the attach command
instead of the terminal server and the port number to connect to the target. The format of the file is as
follows:
#
#
#
#
#
#
#
#
#
#
#
#
#
#
#
#
#
#
#
#
#
60
kwdb.conf (/etc/opt/kwdb/kwdb.conf)
This file contains configuration information for KWDB
to use with the console and lantron_serial targets.
Lines beginning with ‘#’ are comments which kwdb
ignores. Blank lines are allowed. Tokens are separated
by tabs or spaces. All other lines are considered to be
kwdb directives. (A kwdb directive cannot span multiple
lines.)
The general format is “directive arguments ...\n”
The first column cotains the directive name:
“console” Maps machine name to lantron name and
port number where the remote console of the
target is connected. The machine name is specified
in the second column. The lantron name and port
number is specified in the third column in
the format “lantron_name:port”.
Chapter 3
Getting Started with Remote Debugging
Starting KWDB Debug Session
#
“lantron_serial” Maps machine name to lantron name and
#
port number where the serial port of the target
#
is connected. The machine name is specified in
#
the second column. The lantron name and port number
#
is specified in the third column in the format
#
“lantron_name:port”.
#
# Uncomment and edit as appropriate for your system:
#
Directive
Machine name
Ethernet address
#
--------------------------console
machine1
lrs02f04:2031
lantron_serial
machine2
lrs02f04:2032
With this support the target command
(kwdb) target console machine1
can be issued instead of
(kwdb) target console lrs02f04:2031
Similarly for lantron serial target the command
(kwdb) target lantron_serial machine2
can be issued instead of
(kwdb) target lantron_serial lrs02f04:2032
Set the file permission of kwdb.conf to world-writable by system administrator, so that users can edit this file
to add new entries.
Debugging Targets Using UDP
Every HP-UX kernel 11.22 and later supports source level debugging using KWDB via a UDP connection
between host and target systems. In pre 11.31 kernels, debugging via UDP connection is not supported on cell
platforms like Superdome, Orca, Matterhorn and Keystone. From 11.31 and beyond, UDP connection is
suppported for all platforms running HPUX.
For an IPF system, boot the target machine to ISL and enter the following at the boot prompt:
For pre 11.31 kernels,
HPUX> boot kernel_file -dudp
For 11.31 and beyond,
HPUX> boot kernel_file -dudp[.driver]
or
HPUX> boot kernel_file kwdb_flags=udp[.driver]
(Boot-and-wait) The kernel stops and waits for a client connection during the bootup sequence, rather than
booting up normally. By default, the btlan card with the lowest hardware address will be selected for KWDB
communication. It is possible to specify the type of LAN card for KWDB by using the option -dudp.intl100
for intl100 card, -dudp.igelan for igelan card, or -dudp.iether for iether card.
HPUX> boot kernel_file -d0x511
(Boot-without-wait) Attach the debugger client to the target at a later time.
For pre 11.31 kernels,
Chapter 3
61
Getting Started with Remote Debugging
Starting KWDB Debug Session
HPUX> boot kernel_file -d0x511
For 11.31 and beyond,
HPUX> boot kernel_file -dudp[.driver].nowait
or
HPUX> boot kernel_file kwdb_flags=udp[.driver].nowait
For an S700/S800 PA system, boot the target as follows:
(Boot-and-wait) The kernel stops and waits for a client connection during the bootup sequence, rather than
booting up normally.
ISL> hpux -f0x1c003 kernel_file
In 11.31, it is also possible to specify the driver name through the -f option as follows:
ISL> hpux -f0x11c003 kernel_file (for specifying btlan driver, same as 0xc003)
ISL> hpux -f0x21c003 kernel_file (for specifying igelan driver)
ISL> hpux -f0x41c003 kernel_file (for specifying intl100 driver)
ISL> hpux -f0x81c003 kernel_file (for specifying iether driver)
or
ISL> hpux kernel_file kwdb_flags=udp.[driver]
(Boot-without-wait) Attach the debugger client to the target at a later time. Where kernel_file is usually
/stand/vmunix.
For pre 11.31 kernels,
ISL> hpux -f0x1c001 kernel_file
For 11.31 and beyond,
ISL> hpux -f0xc001 kernel_file
or
ISL> hpux kernel_file kwdb_flags=udp[.driver].nowait
If the system is successfully booted with boot flags that enable debugging, an IP address will be displayed on
the target system console as shown below:
kdebug IP address 15.244.99.173:468
kdebug lancard mac address 0:60:b0:b3:8b:69 (0x0060b0b38b69)
Waiting for kernel debugger to attach (this line is shown only in Boot-and-wait mode)
This IP address will be needed later to reattach KWDB using UDP, so make note of it. This is the IP address
assigned by the DHCP server and can be used by the host to connect to the target. Without this IP address it
is not possible to use UDP connection. This address will also be stored in a kernel variable
kdebug_udp_ip_addr on IPF and kgdb_udp_ip_addr on PA systems. To reattach later and if the IP address
has been forgotten, get it by examining these variables using ADB or KWDB. The following example shows
how to get the IP address using KWDB.
# kwdb -q4 -q /stand/vmunix.iademo /dev/mem
q4> kdebug_udp_ip_addr
01775061002
267674114
0xff46202
q4>
After booting the target, run KWDB on the host system as follows:
62
Chapter 3
Getting Started with Remote Debugging
Starting KWDB Debug Session
$ kwdb kernel_file
(kwdb) target udp IP_address
(kwdb) attach 0
kernel_file
Specifies the name of the host’s copy of the kernel executable file booted on the target.
IP_address
The IP address displayed on the target system console.
This is shown in Figure 3-11, “Debugging PA/IPF Target Using UDP.”
Figure 3-11
Debugging PA/IPF Target Using UDP
Host
$ kwdb vmunix
(kwdb) target udp 15.244.99.173
(kwdb) att 0
UDP
Target
ISL> hpux -f0x1c003 vmunix (on PA)
HPUX> boot vmunix -dudp (on IPF)
.....................................
kdebug IP address 15.244.99.173.468
kdebug lancard mac address 0:60:b0:b3:8b:69 (0x0060b0b38b69)
Waiting for kernel debugger to attach
Debugging 11.0 and Earlier Kernels with KWDB
Kernels with versions 10.0 through 11.0 were designed to be debugged with a debugger known as NDDB.
However, it is possible to debug 11.0 and earlier kernels with some limitations if kwdb is used in
nddb-compatibility mode. Limitations of kwdb in nddb-compatibility mode is discussed in Chapter 3, “Getting
Started with Remote Debugging.”.
For RS-232 serial debugging, boot the target machine to ISL, and enter the following at the ISL> prompt:
ISL> hpux -f3 kernel_file
After booting the target, run kwdb on the host system as follows:
$ kwdb kernel_file
(kwdb) target nddb -rs device_file
(kwdb) attach 0
kernel_file
Specifies the name of the host’s copy of the kernel executable file booted on the target.
-rs
Specifies RS-232 serial communication.
device_file
Specifies the name of the host RS-232 device file, such as /dev/tty1p0, used for
communicating with the target.
This is shown in Figure 3-12, “Debugging 11.0 and Earlier Kernel Using Serial Connection.”
Chapter 3
63
Getting Started with Remote Debugging
Starting KWDB Debug Session
Figure 3-12
Debugging 11.0 and Earlier Kernel Using Serial Connection
Host
$ kwdb vmunix
(kwdb) target nddb -rs -f/dev/tty1p0
(kwdb) att 0
RS-232
Target
ISL> hpux -f3 vmunix
For LAN debugging, run a different communications server nddbcs instead of the normal kwdbd
communications server. See Chapter 2, “Setting Up KWDB for Remote Debugging,” for details. Boot the target
machine to ISL, and enter the following at the ISL> prompt:
ISL> hpux -f0x4003 kernel_file
On the target, kernel_file is usually /stand/vmunix
After booting the target, run KWDB on the host system as follows:
$ kwdb kernel_file
(kwdb) target nddb -h nddb_comm_server -t ethernet_address
(kwdb) attach 0
kernel_file
Specifies the name of the host’s copy of the kernel executable file booted on
the target.
nddb_comm_server
Specifies the machine where the nddbcs communications server is
running.
ethernet_address
Specifies the ethernet MAC address of the LAN card on the target system
used for debugger communication.
This is shown in Figure 3-13, “Debugging 11.0 and Earlier Kernel Using LAN.”
64
Chapter 3
Getting Started with Remote Debugging
Starting KWDB Debug Session
Figure 3-13
Debugging 11.0 and Earlier Kernel Using LAN
Host
$ kwdb vmunix
(kwdb) target nddb -h nddb1 -t ethernet_address
(kwdb) att 0
Comm_server
(nddb1)
TCP/IP
Target
ISL> hpux -f0x4003 vmunix
Chapter 3
65
Getting Started with Remote Debugging
Debugging the Kernel
Debugging the Kernel
Once attached to the target system and connected to the target kernel, begin entering KWDB commands to
set breakpoints, execute, single-step, and so forth, to debug the kernel.
Controlling Kernel Execution Using KWDB
•
Interrupting Target Kernel Execution
•
Detaching from the Target System
•
Exit from KWDB
•
Re-attaching KWDB to the Target System
•
Re-booting the Target System
Interrupting Target Kernel Execution
While the target kernel is running, the execution can be interrupted by entering Ctrl-c in the window where
the KWDB client is running.
(kwdb 0:0) c
Continuing.
^c(interrupt)
Program received signal SIGINT, Interrupt.
0x336078 in idle()
If the target kernel is not running, Ctrl-c interrupts the execution of the host debugger itself (for example, to
abort display of a particularly long data structure).
Detaching from the Target System
To detach from the target kernel but leave KWDB active (to reattach to the kernel at a later time), use the
detach command.
(kwdb 0:0) detach
Detached from remote task.
(kwdb 0:0)
Exit from KWDB
To stop debugging and exit KWDB entirely, use the quit command (q) or EOF Ctrl-d. If KWDB is currently
attached to a running kernel, you will be prompted to determine whether you want to detach.
(kwdb 0:0) q
The program is running. Quit anyway (and detach it)? (y or n) y
Detached from remote task.
kentucky 53 >
Reattaching KWDB to the Target System
Once booted, a target for debugging and detached KWDB, reattach to the running kernel by invoking KWDB
on the kernel and issuing the same target and attach commands that were used when attaching at boot time.
66
Chapter 3
Getting Started with Remote Debugging
Debugging the Kernel
Rebooting the Target System
To reboot the target system from KWDB, use the kill command k.
(kwdb 0:0) kill
Kill the program being debugged? (y or n) y
Killing remote task
Killed remote task.
Compiling Code for Source Level Debugging
In order to set breakpoints at line numbers, step through the code line by line and display the values of local
variables; compile the source code with the -g option. In addition, if the target is an IPF system, compile with
the +noobjdebug option.
Chapter 3
67
Getting Started with Remote Debugging
Online (Runtime) Initiailization of the Kernel Debugger
Online (Runtime) Initiailization of the Kernel Debugger
Starting with 11.31, the KWDB stub has been enhanced to support online initialization and deletion of the
kernel debugger stub.
The following online initializations of the kernel debugger are supported. This can be done using the kwdbctl
utility (run as superuser) once the kernel has come up to multi-user mode.
Table 3-1
Mode
Supported Online Kernel Debugger Initializations
kwdbctl
command line
Platform
Architecture
Remarks
Sub/sync
kwdbctl -i sub
Cell
IPF/PA
• Speed of debugging depends on
the speed of the management
processor and firmware
performance.
• System I/O resources not used
for remote debugging.
• No subnet restrictions between
the host and target.
Lan
kwdbctl -i lan
Cell/Non cell
IPF/PA
• No known issues with speed of
communication.
• Requires at least one LAN card
of the system to be in
UNCLAIMED state for remote
debugging.
• Target and host if in different
subnets. Requires the comm
server to be in the same subnet as
target.
Console
kwdbctl -i
console
Cell/Non cell
IPF/PA
• Single system assembly level
debugging only.
• If used in conjunction with
console target, then source level
debugging is possible.
Crashtime
initialization
kwdbctl -i
crash
Cell/Non cell
IPF/PA
• Choice of communication mode
is deferred to crashtime.
• Kernel debugger is NOT
activated throughout the lifetime
of the system.
• Interactive menu presented at
system console during a kernel
crash.
• All types of remote debugging
and console debugging possible at
crashtime.
68
Chapter 3
Getting Started with Remote Debugging
Online (Runtime) Initiailization of the Kernel Debugger
Table 3-2
Additional Supported Operations
kwdbctl command
line
Platform
Archit
ecture
Remarks
Operation
Mode
Online
pre-initiali
zation
Any
kwdbctl -s
pci_ola_card_claim
=1
and
kwdbctl -s
pci_ola_card_claim
=0
Cell/Non
Cell
IPF/PA
• This method is used to
pre-initialize the kernel debugger
for claiming a LAN card that may
be added later via PCI OLA, refer
to Table 3-3 for more details (using
pci_ola_card_claim=1).
• The setup can be cancelled by
doing pci_ola_card_claim=0.
Online
deletion
Any
kwdbctl -d
Cell/Non
cell
IPF/PA
• By this method, kernel debugger
initialized by any method, can be
destroyed after the system comes
up.
• All system resources are returned
to the kernel, for example, remote
LAN card can be reclaimed by
kernel's wsio drivers by running
ioscan(1).
• Online deletion would fail if:
• booted or configured in
no-deconfig mode
• the remote debugger is
attached
• the remote debugger
communication device is not
claimed in the I/O tree due to some
errors during ioscan
Force
Online
deletion
Any
kwdbctl -D
Cell/Non
Cell
IPF/PA
• By this method, kernel debugger
initialized by any method, can be
force destroyed after the system
comes up.
• It is used to override the failure
cases mentioned for normal online
deletion.
• This functionality should be used
at user's risk, and should be
applied with extreme caution.
Query
Any
kwdbctl -q
Cell/Non
cell
IPF/PA
This command allows you to query
the state of the kernel debugger on
a native system. It displays the
MAC address, hardware path,
description property of the card, its
hardware state and other useful
information about the debugger
configuration on a native system
Chapter 3
69
Getting Started with Remote Debugging
Online (Runtime) Initiailization of the Kernel Debugger
Table 3-3
11.31 Support for Kernel PCI OL* Operations
Scenario
Steps
Remarks
Mechanism to start the
kernel debugger with LAN
without rebooting the
system - using an installed
LAN card.
1. PCI OLD one of the LAN cards (in
11.31, almost all LAN cards will
support PCI OLD) by running:
olrad -d slot_id
2. Pre-initialize kernel debugger by
running:
kwdbctl -s pci_ola_card_claim=1
3. PCI OLA the card by running:
olrad -a slot_id
1. These steps will ensure the
kernel debugger can start using the
card with LAN based
communication without rebooting
the system.
2. Run "ioscan -fC lan" and ensure
that the card is claimed by the
"kwdb" driver. Kernel driver would
not be able to use the card any
longer.
3. Run "kwdbctl -q" to obtain MAC
address details.
Mechanism to start the
kernel debugger with LAN
without rebooting the
system - using a newly
added LAN card.
1. Pre-initialize the kernel debugger
by running:
kwdbctl -s pci_ola_card_claim=1
2. Physically insert a LAN card.
3. Perform PCI OLA to get the card
claimed by kernel debugger, by
running:
olrad -a slot_id,
and
olrad -A slot_id
After PCI OLA, perform
kwdbctl -q to obtain the remote
communication LAN MAC address
that is required to be used in the
host.
Mechanism to replace the
debugger LAN card
without reboot
1. PCI OLR the debugger LAN card by
running:
olrad -r slot_id.
2. Replace the card.
3. Resume operation on the card by
running:
olrad -R slot_id.
If the remote debugger is already
connected, the connection would go
away after step (1). kwdbctl -q
shows that the hardware state of
the card is Suspended. Once the
card is resumed, remote debugger
may connect to the target without
having the reboot the system.
Mechanism to remove a
card being used for remote
debugging without
rebooting the system
PCI OLD the debugger LAN card by
running:
olrad -d slot_id
Once this is done, remote debugger,
if connected, goes away. The card
can be safely taken out after
successful completion of the PCI
online delete.
70
Chapter 3
Getting Started with Remote Debugging
Crashtime Kernel Debugging Using KWDB debugger
Crashtime Kernel Debugging Using KWDB debugger
Starting in 11.31, crashtime debugging capability is provided for HP-UX KWDB remote debugger. This
feature eliminates the need for collecting crash dumps from failed HP-UX kernels and improves high
availability of HP-UX systems. Standard dump reading utilities like kwdb are able to remotely connect to the
crashed kernel through a remote communication device and start analyzing the failed memory and give the
user an illusion that it is running on a crashdump. This enables users to remotely analyze a crashed system,
do a quick first pass analysis, and apply patches to known problems without having to wait hours and do this
after collecting a crash dump. This feature allows the kernel debugger to be started upon a crash (panic,
Transfer of Control following a hang, HPMC or MCA) through a stolen LAN card with DLPI (with kwdbd
comm server) and/or with UDP as communication protocols. The kernel debugger hardware scan mechanism
has been enhanced to scan the system hardware after a system crash and select one of the installed LAN
cards with a cable through which the remote debugger client would be able to communicate to the crashed
target. All q4 perl scripts and relevant kwdb commands have been extended to work with a crashtime target
(refer to detailed list below).
Some of the salient features of crashtime debugging are described in the following list:
•
kwdb client can connect to the crashtime target with the same set of "target/attach" command pair as
used for normal remote attachment.
•
All q4 dump-reading commands work on a crashtime target through inspection of crash events ("trace
event N", "trace processor N", "trace process at addr", etc), examination of target memory, reading of
module information, etc.
•
All perl scripts for the appropriate (11.31) kernel version also work for a crashtime debugging session.
•
Execution control commands (such as stepping, jumping to an address, and return to callee functions) are
not supported in a crashtime debugging session.
•
If used appropriately, almost all dump reading commands are supported in a crashtime debugging
session; thereby, avoiding the need to collect crash dumps.
Setting up a system for Crashtime Debugging
The following are various means by which the crashtime debugging session can be enabled.
1. The kernel can be booted with a new -dcrash option from the boot loader prompt. When booted with this
option, the kernel would not directly attach to a kernel debugger during its normal operation, but, would
enable attachment to a remote system upon a crash.
Example:
On IPF:
HP-UX> boot /stand/vmunix -dcrash
On PA-RISC:
ISL> hpux -f0x80000 /stand/vmunix
[..]
Kernel debugger configured for crashtime attachment.
Kernel debugger would be initialized for reading the memory of the failed
system through remote or on-console kwdb after the kernel crashes
[..]
As can be seen from this example, the printed messages indicate that the kernel debugger has been
configured for crashtime attachment.
Chapter 3
71
Getting Started with Remote Debugging
Crashtime Kernel Debugging Using KWDB debugger
If, after the system reboots, a panic occurs, then the following menu displays. This menu allows the user
to attach from the remote system after printing the message buffer.
[...]
*** You can connect to "HP-UX KWDB kernel debugger" prior to collecting dump.
*** Kernel debugger crashtime session can be established in following ways
*** Options (enter your selection within next 20 seconds):
*** L) Connect to "HP-UX KWDB remote kernel debugger" through stolen lan card
with intermediate communication server. (default)
*** U) Connect to "HP-UX KWDB remote kernel debugger" through stolen lan card
with UDP/IP communication.
*** C) Connect to "HP-UX KWDB console debugger".
*** N) Donot connect to kernel debugger.
If the user selects L, then a lan card will be scanned for communication with the kwdb client on the host
system. The scan code of the kernel debugger has been enhanced to perform this scanning and select a
LAN card at the time of system crash.
Once a LAN card has been stolen, the MAC address of the lan card is printed which can then be used for
connecting to the crashed system from the remote system. The following are the emnu selections provided
to the user after option L is selected.
*** This selection requires a LAN card to be scanned for remote communication.
*** The default preference order for LAN cards while scanning hardware is:
btlan, igelan, intl100, iether
*** Press any key within the next 20 seconds to change this setting.
*** Setting hardware scan preference for LAN based remote communication
(enter your selection within the next 20 seconds)
*** 1) btlan, igelan, intl100, iether (default)
*** 2) igelan, btlan, intl100, iether
*** 3) intl100, btlan, igelan, iether
*** 4) iether, btlan, igelan, intl100
*** M) return to main menu for reselecting remote debugger communication
*** User input: 1 (preference order: btlan, igelan, intl100, iether).
Notice that options are given for the user to scan the LAN cards in the order preferred by the user.
Depending on the selected order, the LAN cards will be scanned for. If the user input is 1, then the scan
order will be that indicated by menu item 1.
Starting "HP-UX KWDB kernel debugger" prior to dump.
Type 'help' for complete command list upon attachment to the kernel debugger.
Attempting to connect to remote HP-UX KWDB.
Initiating hardware scan for detecting lan card for kernel debugger
Driver selection preference order: btlan igelan intl100 iether
Hardware scan results:
Detected igelan card (0x14e4:0x1645:0x103c:0x1300)
Detected igelan card (0x14e4:0x1645:0x103c:0x128a)
72
Chapter 3
Getting Started with Remote Debugging
Crashtime Kernel Debugging Using KWDB debugger
No btlan card was found or could be used for kernel debugging.
Kernel debugger would select another network card from the ones
installed in the system. Press Control-C within next 15 seconds to
prevent this behavior and continue with crashdump.
Attempting to select another network card for kernel debugger
Card selection preference order: igelan intl100 iether
Configuring igelan card (0x14e4:0x1645:0x103c:0x1300)
Kernel debugger communication device setup
Device: HP A6794-60001 Procurium (igelan) PCI 1000Base-T adapter
MAC address of the LAN card: 0:30:6e:a7:2c:73 (0x00306ea72c73)
Hardware Path of the communication device: 0/1/1/0/4/0
Kernel debugger is initialized
Options for remote attachment (enter your selection within the next 10 seconds)
*** T) Timeout after 5 mins if remote debugger does not connect (default).
*** D) Disable remote attachment timeout.
Timer expired: (attachment to timeout after 5 minutes).
As can be seen in the scan code selected, an igelan card and the MAC address are printed. From the
remote system a kwdb client can be started and attached to this crashed system using the target and
attach commands as for the remote debugger. On the remote host system, start kwdb on vmunix.
#kwdb <vmunix>
[..]
(kwdb) target ia64_kern <comm-server>
[..]
(kwdb) att 0 <mac-address>
Attaching program:
/user/kwdbtest/current_vmunix/em_64-debug/vmunix task: 0, address:
0x00306ea72c73
Target is in crash/reboot path prior to dump
crashpath information:
hostname
hpkdbia7
model
ia64 hp server rx5670
panic
kwdb_inline_test_0_2: deliberate
release
@(#) $Revision: vmunix:
commands -RW -share i80_bl2006_09
jazz @ 20060927.07:44:31IST; jmkvw -proj
25 i80(I80_BL2006_0925) ; FLAVOR=debug
dumptime
N/A
savetime
N/A
dumptype
N/A
Chapter 3
73
Getting Started with Remote Debugging
Crashtime Kernel Debugging Using KWDB debugger
Event selected is 0. It was a panic
0xe000000001e6ced0:0 in panic_save_regs_switchstack+0x110
(0x611, 0xe000000001e7caf0, 0x1a8f, 0x0, 0xe00000010367bb00,
0xe00000010150df00,
0xe00000000053fe40, 0xe00000010367bb60)
q4> trace event 0
#0
0xe000000001e6ced0:0 in panic_save_regs_switchstack+0x110
(0x611, 0xe000000001e7caf0, 0x1a8f, 0x0, 0xe00000010367bb00,
0xe00000010150df00,
0xe00000000053fe40, 0xe00000010367bb60)
#1
0xe000000001e7cb30:0 in panic
(0xe0000001410f1ff0, 0x1, 0x388, 0xe0000001410f76b0, 0x1a4f,
0xe000000103af9f20,
0x0, 0xe000000200044000) at /ux/core/kern/em/svc/shutdown/panic.c:311
…………
q4>
q4> detach
As can be seen, upon attaching to the crashed target, the panic string is printed and a q4 interface is
available for the user. From this interface the user can execute q4 commands, run perl scripts and analyze
the cause of the crash. Once detached the target kernel continues collecting the crash dump.
If you do not attach to the target within the timeout period, then the following message appears on the
console:
Connection timed out with KWDB remote debugger client.
Remote debugger initialization aborted. Kernel would continue with crash dump.
Press the 'c' key within the next 10 seconds to start the console debugger.
Upon pressing the c key, the control will pass to the on-console debugger. The on-console debugger
supports a new panictrace command that prints the stack trace and other useful debug information
during a crash time debugging session.
The usage of this command is shown below:
a. panictrace event <eventno> - This command prints the stack trace of the specified event identified
by eventno. eventno can be a C-style expression that evaluates to an index of the crash event table[].
b.
panictrace processor <procindex> - This command prints the processor mpinfo t, pdk mpinfo t,
pid of the running process, the associated kernel tid (thread ID), the address of the process entry in
the kernel's proc structure, the address of the kernel thread entry in the kernel kthread t structure,
and the stack trace of the process. procindex can be a C-style expression that evaluates to a valid
index of the kernel spu info[] data structure.
In the case of cell platforms, an additional option sub-sync is available. This option enables the kwdb
client on the remote system to attach and debug the cause of the crash using the following commands.
On the host, start kwdb as:
74
Chapter 3
Getting Started with Remote Debugging
Crashtime Kernel Debugging Using KWDB debugger
#kwdb <vmunix>
[..]
(kwdb)target sub <sub-name>:47001
[..]
(kwdb)att 0 “Partition 0”
[..]
q4>
The timeout mechanism for remote attachment at crashtime can be disabled and the target can be
made to wait indefinitely using the boot flags -dcrash.wait or kwdb_flags=crash.wait for IPF and
-f0x80002 or kwdb_flags=crash.wait for PA systems. If booted with these options, then upon a
system crash the target will wait for an indefinite period of time for an attachment request from the
remote system.
2. Even if the system has not been booted with the -dcrash flags, kwdbctl utility can be used to configure
the kernel debugger for crashtime attachment. This can be done once the system comes to multi-user
mode using the following command.
# kwdbctl -i crash
The timeout mechanism can also be disabled using the kwdbctl utility once the target system boots to
multi user mode
# kwdbctl -s crash_wait_timeout=0
On the client side, data caching has been implemented which allows the data to be cached instead of data
being requested from the crashed system.
Chapter 3
75
Getting Started with Remote Debugging
Crashtime Kernel Debugging Using KWDB debugger
76
Chapter 3
4 Command Reference
This chapter is divided into two sections, “KWDB Commands”, and “Q4 Commands”. The KWDB commands
section discusses various commands available in KWDB for source level debugging of HP-UX kernel and
DLKM modules. The Q4 Commands section deals with all the Q4 commands which are now available in
KWDB.
Chapter 4
77
Command Reference
KWDB Commands
KWDB Commands
This section describes various activities performed with KWDB:
•
“Beginning a Debugging Session”
•
“Ending a Debugging Session”
•
“Getting Help”
•
“Command Completion”
•
“Executing KWDB Commands Automatically at Startup”
•
“Reading KWDB Commands From a File”
•
“Logging KWDB Output to a File”
•
“Turning Off Output to the User’s Terminal”
•
“Defining an Alias for Commands”
•
“Source Information”
•
“Controlling KWDB Using set Command”
•
“Calling a Kernel Function From the Command Line”
•
“Invoking Commands or Shell Scripts”
•
“Using Breakpoints”
•
“Setting Watchpoints”
•
“Stepping and Continuing”
•
“Examining Source Code”
•
“Examining Assembly Code”
•
“Examining Variables”
•
“Examining Memory”
•
“Examining Registers”
•
“Navigating the Stack”
•
“Displaying Symbol Table Information”
•
“Trapping Panics”
•
“Debugging Multiple Processor Systems”
•
“Debugging DLKMs”
•
“Assembly Level Debugging Using On-Console Debugger”
•
“Debugging PA-RISC 11.0 and Earlier Kernels with KWDB”
•
“Debugging Code with KWDB”
Beginning a Debugging Session
Begin to debug the kernel by entering KWDB commands to set breakpoints, execute, single step, and so forth.
78
Chapter 4
Command Reference
KWDB Commands
Ending a Debugging Session
To interrupt or end the debugging session, take one of several actions:
•
“Interrupting Target Kernel Execution”
•
“Detaching from the Target System”
•
“Rebooting the Target System”
•
“Ending the KWDB Session”
Interrupting Target Kernel Execution
While the target kernel is running, it can be interrupted, by entering INT Ctrl-c in the window where the
KWDB client is running.
(kwdb 0:0) c
Continuing.
^c(interrupt)
Program received signal SIGINT, Interrupt.
0x336078 in idle ()
If the target kernel is not running, Ctrl-c interrupts the execution of the host debugger itself (for example, to
abort display of a particularly long data structure).
Detaching from the Target System
To detach from the target kernel, but leave KWDB active (to reattach to the kernel at a later time), use the
detach command. Detach clears any break points and watch points set by KWDB, and the target continues to
run.
(kwdb 0:0) detach
Detached from remote task.
(kwdb 0:0)
Rebooting the Target System
To reboot the target system from KWDB, use the kill command k.
(kwdb 0:0) kill
Kill the program being debugged? (y or n) y
Killing remote task
Killed remote task.
(kwdb 0:0)
Getting Information About the Target
Recent versions of kwdb support the info target command. This command gives detailed information about
the target which is being debugged from kwdb.
While remote debugging with LAN, the MAC address of the remote target and the name of the
communication server are printed.
While remote debugging with UDP, the UDP IP address is printed.
While debugging with sub/sync, the remote MP name and the partition connected to are printed.
Chapter 4
79
Command Reference
KWDB Commands
While debugging with console target, the remote MP and/or lantron console name and the console port
number are printed.
Ending the KWDB Session
To stop debugging and exit the KWDB client session, use the quit command q or EOF Ctrl-d. If KWDB is
currently attached to a running kernel, with a prompt for confirmation. If confirmed by pressing y, KWDB
will be detached from the target kernel before terminating the KWDB session. There may be a degradation in
performance because KWDB related code is running in the kernel. If finished with the debugging session and
do not want to attach KWDB again, reboot the kernel without the KWDB flags to ensure optimum
performance.
(kwdb 0:0) q
The program is running. Quit anyway (and detach it)?
(y or n) y
Detached from remote task.
kentucky 53 >
Getting Help
For information about any debugging command, use the help command h. Using help with no arguments
gives a list of topics for which help is available.
(kwdb 0:0) help
List of classes of commands:
running -- Running the program
stack -- Examining the stack
data -- Examining data
breakpoints -- Making program stop at certain points
files -- Specifying and examining files
status -- Status inquiries
support -- Support facilities
user-defined -- User-defined commands
aliases -- Aliases of other commands
obscure -- Obscure features
internals -- Maintenance commands
Type “help” followed by a class name for a list of commands in that class.
Type “help” followed by command name for full documentation. Command name abbreviations are
allowed if unambiguous.
(kwdb 0:0) help breakpoints
Making program stop at certain points.
List of commands:
awatch -- Set a watchpoint for an expression
rwatch -- Set a read watchpoint for an expression
watch -- Set a watchpoint for an expression
tcatch -- Set temporary catchpoints to catch events
catch -- Set catchpoints to catch events
xbreak -- Set breakpoint at procedure exit
break -- Set breakpoint at specified line or function
clear -- Clear breakpoint at specified line or function
delete -- Delete some breakpoints or auto-display expressions disable -- Disable some
breakpoints
enable -- Enable some breakpoints
thbreak -- Set a temporary hardware assisted breakpoint
hbreak -- Set a hardware assisted breakpoint
80
Chapter 4
Command Reference
KWDB Commands
txbreak -- Set temporary breakpoint at procedure exit
tbreak -- Set a temporary breakpoint
condition -- Specify breakpoint number N to break only if COND is true
commands -- Set commands to be executed when a breakpoint is hit
ignore -- Set ignore-count of breakpoint number N to COUNT
---Type <return> to continue, or q <return> to quit--Type “help” followed by command name for full documentation. Command name abbreviations are
allowed if unambiguous.
(kwdb 0:0) help enable
Enable some breakpoints.
Give breakpoint numbers (separated by spaces) as arguments. With no subcommand, breakpoints
are enabled until commanded otherwise. This is used to cancel the effect of the “disable”
command. With a subcommand can enabled temporarily.
List of enable subcommands:
enable display -- Enable some expressions to be displayed when program stops enable once -Enable breakpoints for one hit enable delete -- Enable breakpoints and delete when hit
Type “help enable” followed by enable subcommand name for full documentation. Command name
abbreviations are allowed if unambiguous.
Specifying Multiple Commands in the Same Command Line
It is possible to specify multiple commands in the same command line in KWDB. This can be done by
separating each KWDB command by a semicolon character, as shown below:
(kwdb 0:0) break kwdb_test; info break; continue
The above three commands will be accepted one after the other, and kwdb client will first set a breakpoint in
kwdb_test, print the output of “info break” and finally continue kernel execution.
Command Completion
Type a letter or several letters of a command then type the Tab key twice, KWDB will list all commands whose
first letter(s) match the ones typed. This can be used to determine the minimum number of characters of the
command that are necessary to remove ambiguity. If there is no ambiguity, pressing the Tab key once will
complete the command. For example:
(kwdb 0:0) de<Tab><Tab>
define delete detach
(kwdb 0:0) def<Tab>
(kedb 0:0) define
Pressing the Enter key will repeat the previous command. By default, this feature is turned off in q4 mode. To
turn it on, use the command:
q4>
set auto-repeat on
Executing KWDB Commands Automatically at Startup
Commands in files $HOME/.kwdbinit and ./.kwdbinit (current directory where KWDB is run) will be
automatically executed each time KWDB is started. The commands in $HOME/.kwdbinit will be executed
first followed by those in ./.kwdbinit.
Chapter 4
81
Command Reference
KWDB Commands
Reading KWDB Commands From a File
Commands can be placed in a file and KWDB will execute them when the source command is used. The
syntax is:
source <filename>
Logging KWDB Output to a File
T start logging a KWDB session to a file, use the command:
(kwdb 0:0) set kwdb log on
The default is to set kwdb log on so the previous command could be abbreviated to:
(kwdb 0:0) set kwdb log
To turn logging off, use the command:
(kwdb 0:0) set kwdb log off
By setting kwdb log on and kwdb log off selectively, it is possible to send any part of the KWDB session to the
file. The default file to which KWDB session is written is kwdb-log. To change the name of the file, use the
command:
(kwdb 0:0) set kwdb logfile <filename>
If you change the name of the logfile using the “set kwdb logfile” command, you must issue this
command before issuing the “set kwdb log on” command. If the logfile from a previous KWDB session
already exists when logging is turned on, it will be renamed with the “~” character appended to it. Thus, each
KWDB session will start with the new log file.
Turning Off Output to the User’s Terminal
To turn off display of KWDB’s output on your terminal, use the command:
(kwdb 0:0) set ttyoutput off
If logging of the KWDB session to a file is on, the output will still go to the log file. This could be useful when
logging is on and a command is issued, giving many screenfuls of output.
If KWDB has been started in “perl mode” (i.e., with “-p“) ttyoutput cannot be set to “off”. In this case, use
the redirect character “>” to send output to a file instead of the terminal.
To display KWDB’s output on your terminal after is has been turned off, use the command
(kwdb 0:0) set kwdb ttyoutput on
Enable/Disable Writing to the Target
The set write feature of GDB can be used to turn on/off writing to the target when KWDB is not started with
the --write option.
set write [on | off] - Can be used to enable (or disable) writing to the target. This is a GDB feature,
it can be used to allow for writing to the target if KWDB was not started with the --write option.
82
Chapter 4
Command Reference
KWDB Commands
Defining an Alias for Commands
The define command allows definition of an alias for any command or sequence of commands typed. This can
be useful when typing a long command frequently. For example, to type the q4 command load struct proc
from proc_list max nproc next p_factp skip 10, alias it to the user-defined command myload as
follows:
(kwdb 0:0) define myload
Type commands for definition of “myload”.
End with a line saying just “end”.
>load struct proc from proc_list max nproc next
p_factp skip 10
>end
To display useful information about user-defined commands use the document command. Then use the help
command on the commands defined. For example:
(kwdb 0:0) document myload
Type documentation for “myload”.
End with a line saying just “end”.
>load struct proc from proc_list
>end
(kwdb 0:0) help myload
load struct proc from proc_list
To list user-defined commands use “help user-defined” command.
Source Information
KWDB can display source file and line number information from source files compiled with debug options.
Refer to Chapter 3, “Getting Started with Remote Debugging.”
For HP-UX version 11.23 and later KWDB can display source file and line number information even for files
not compiled with -g. This feature exists only for IPF targets.
This feature is controlled by the KWDB command line option “-src_no_g”. By default, KWDB displays source
information. To turn it off, specify the command line option “-src_no_g none”. To exclude source information
for system libraries such as libc, but display it for other files, specify “-src_no_g no_sys_libs”.
Controlling KWDB Using set Command
The set kwdb subcommands control things that are specific to kernel debugging with KWDB. To see the
current setting for any of these subcommands, use show kwdb <subcommand>. The boolean commands take
the optional arguments on or off.
List of set KWDB subcommands:
set kwdb cache[on|off] — Sets the cache remote memory.
set kwdb memory_cache <integer> — Sets number of pages for caching memory read from crash dump.
This has to be set before target command is issued. The default value is 10,000 pages, i.e., 40MB memory
will be allocated for cache while analyzing crash dumps.
setkwdbdebug[on|off] — Sets debugging of remote target.
set kwdb log [on|off] — Set logging of KWDB output.
set kwdb ttyoutput [on|off] — Set display of KWDB output on terminal.
Chapter 4
83
Command Reference
KWDB Commands
set kwdb logfile <filename> — Sets the filename to record KWDB output. Default is kwdb-log.
set kwdb remotelog [on|off] — Sets logging of remote I/O.
set kwdb remotelogfile <filename> — Sets the filename to record the kwdb/stub log. Default is
kwdb-remote-log.
set kwdb remotelogflush [on|off] — Sets strict flushing of kwdb-remote-log I/O.
set kwdb ntimeout <integer> — Sets number of retries for remote network I/O.
set kwdb spaceid <integer> — Sets the space id used for memory transfers.
set kwdb timeout <integer> — Sets time-out for remote network I/O (tenths of seconds).
set kwdb q4 [on|off] — Sets KWDB to q4 mode or turn q4 mode off.
set kwdb tty output [on|off] — Sets terminal output on/off.
set kwdb performanceregs [on|off] — Enable/Disable display of IPF performance registers.
set kwdb controlregs [on|off] — Enable/Disable display of IPF control registers.
set kwdb floatregs [on|off] — Enable/Disable display of IPF floating point registers.
set kwdb field address first [1|0] — When &name is used in any command and name is a filed
name in current pile and name is also a kernel symbol, it can be treated as either (1) address of field from
the current pile or it can be treated as (2) address of kernel symbol. By default, option 2 is used by KWDB;
that is, &name will be treated as address of the kernel symbol name. To override the default and treat it as
address of the field from current pile set kwdb field address first 1.
set kwdb module-debug [on|off] - Can be used to enable (or disable) processing of modules in kwdb.
Useful when kwdb is not started with the -m option from the command line.
set kwdb vmm-translation [on|off] - Can be used to enable (or disable) translations for symbols
from vmm module during debugging of HPVM. For this to work properly with the vmm symbols, vmm
object module symbols need to be pre-sourced in by using the add-symbol-file command or by starting
kwdb with the -s option.
Type help set kwdb followed by set kwdb subcommand name for full documentation.
(kwdb 0:0) help set kwdb
Command name abbreviations are allowed if unambiguous. To set default input and output radices use set
input-radix or set output-radix, respectively.
Calling a Kernel Function From the Command Line
The kernel functions can be called from the KWDB command line. Pass up to eight 64 bit arguments and one
64 bit value is returned. The syntax has two forms; use either the call or print command. The following
examples call a function function_name and pass two parameters, arg1 and arg2:
call function_name(arg1, arg2)
print function_name(arg1, arg2)
If the following message is received; Unsupported feature number from remote stub: 16 — it means that
the kernel supports the command line call feature but the KWDB client does not. To remedy this, install the
latest version of KWDB on the host.
84
Chapter 4
Command Reference
KWDB Commands
Invoking Commands or Shell Scripts
Execute a command, an executable program or shell script from the KWDB command line using shell or
system commands. Create a new session using the shell command from the KWDB command line, and when
exiting the session be back in KWDB command line. Here are some examples:
(kwdb) system date
Thu Sep 26 13:08:45 PDT 2002
(kwdb) shell date
Thu Sep 26 13:08:50 PDT 2002
(kwdb) shell
$ date
Thu Sep 26 13:08:56 PDT 2002
$ pwd
/test/hpad1879/dumps/dlkm/gl
$ exit
(kwdb)
Using Breakpoints
Use breakpoints to stop execution at a particular location in the program.
Topics in this section are:
•
“Setting Breakpoints”
•
“Setting Temporary Breakpoints”
•
“Listing Breakpoints”
•
“Deleting Breakpoints”
•
“Attaching Command Sequences to Breakpoints”
•
“Setting Thread Level Breakpoints”
Chapter 4
85
Command Reference
KWDB Commands
Setting Breakpoints
Use the break command b to set a breakpoint. The command takes several kinds of arguments:
•
Procedure names.
•
Line numbers. To set a breakpoint at the current line, use break with no arguments.
•
Offsets from the current line.
•
Line numbers in a given file.
•
Memory addresses. Use an asterisk * to indicate an address:
(kwdb 0:0)
Breakpoint
(kwdb 0:0)
Breakpoint
b
1
b
2
enet_install
at 0x58e60c: file enet.c, line 519.
enet_attach
at 0x58e6c8: file enet.c, line 566.
Setting Temporary Breakpoints
Use the tbreak command tb to set a temporary breakpoint. This breakpoint stops execution only once, and is
then deleted.
(kwdb 0:0) tbreak enet_install
Breakpoint 1 at 0x146fd8: file enet.c, line 529.
(kwdb 0:0) jump enet_install
Continuing at 0x146fd8.
enet_install () at enet.c:529
Source file is more recent than executable.
529
enet_saved_pci_attach = pci_attach;
(kwdb 0:0) tbreak *0x146fd8
Breakpoint 2 at 0x146fd8: file enet.c, line 529.
(kwdb 0:0) info break
Num Type
Disp Enb Address
What
2
breakpoint
del y
0x00146fd8 in enet_install at
enet.c:529
(kwdb 0:0) jump *0x146fd8
Continuing at 0x146fd8.
enet_install () at enet.c:529
529
enet_saved_pci_attach = pci_attach;
(kwdb 0:0)
Setting Hardware Breakpoints
Use the hbreak command hb to set a hardware breakpoint. This breakpoint stops execution only once, and is
then deleted.
(kwdb 0:0) hbreak enet_install
Breakpoint 1 at 0x146fd8: file enet.c, line 529.
(kwdb 0:0) jump enet_install
Continuing at 0x146fd8.
enet_install () at enet.c:529
Source file is more recent than executable.
529
enet_saved_pci_attach = pci_attach;
(kwdb 0:0) hbreak *0x146fd8
Breakpoint 2 at 0x146fd8: file enet.c, line 529.
(kwdb 0:0) info break
Num Type
Disp Enb Address
What
86
Chapter 4
Command Reference
KWDB Commands
2
hw breakpoint del
y
0x00146fd8 in enet_install at
enet.c:529
(kwdb 0:0) jump *0x146fd8
Continuing at 0x146fd8.
enet_install () at enet.c:529
529
enet_saved_pci_attach = pci_attach;
(kwdb 0:0)
Listing Breakpoints
Use the info break command i b to get a list of all current breakpoints:
(kwdb 0:0) info break
Num Type
Disp Enb Address
What
1
breakpoint keep y
0x0058e60c in enet_install at
enet.c:519
breakpoint already hit 1 time
2
breakpoint keep y
0x0058e6c8 in enet_attach at
enet.c:566
breakpoint already hit 1 time
Deleting Breakpoints
Use the delete command d with a breakpoint to delete the specified breakpoint. For example, the following
example deletes Breakpoint 2, then uses the “i b” command to display the results of the operation:
(kwdb 0:0) b enet_install
Breakpoint 1 at 0x146fd8: file enet.c,
(kwdb 0:0) b enet_attach
Breakpoint 2 at 0x147094: file enet.c,
(kwdb 0:0) i b
Num Type
Disp Enb Address
1
breakpoint
keep y
0x00146fd8
2
breakpoint
keep y
line 529.
line 576.
What
in enet_install at
enet.c:529
0x00147094 in enet_attach at
enet.c:576
(kwdb 0:0) d 2
(kwdb 0:0) i b
Num Type
1
breakpoint
Disp Enb Address
What
keep y
0x00146fd8 in enet_install at
enet.c:529
(kwdb 0:0) c
Continuing.
To delete a breakpoint on the current line, use the clear (cl) command.
Breakpoint 1, enet_install () at enet.c:529
Source file is more recent than executable.
529
enet_saved_pci_attach = pci_attach;
(kwdb 0:0) i b
Num Type
Disp Enb Address
What
1
breakpoint
keep y
0x00146fd8 in enet_install at
enet.c:529
breakpoint already hit 1 time
Chapter 4
87
Command Reference
KWDB Commands
(kwdb 0:0) cl
(kwdb 0:0) i b
No breakpoints or watchpoints.
Attaching Command Sequences to Breakpoints
To execute a given sequence of commands each time the debugger encounters a breakpoint, use the commands
command (comm), with instructions on how to enter commands.
(kwdb 0:0) list enet_attach
564
#ifdef __LP64__
565
enet_attach( uint32_t id, struct isc_table_type *isc)
566
#else
567
enet_attach( PCI_ID id, struct isc_table_type *isc)
568
#endif
569
{
570
ubit16 reghwid, options, sub_id;
571
ubit32 ssid;
572
/*
573
* OLA/R Variables to set timeouts and events
(kwdb 0:0) b enet_attach
Breakpoint 1 at 0x147094: file enet.c, line 576.
(kwdb 0:0) i b
Num Type
Disp Enb Address
What
1
breakpoint
keep y
0x00147094 in enet_attach at
enet.c:576
(kwdb 0:0) commands 1
Type commands for when breakpoint 1 is hit, one per line.
End with a line saying just “end”.
>print id
>end
(kwdb 0:0) i b
Num Type
Disp Enb Address
What
1
breakpoint
keep y
0x00147094 in enet_attach at
enet.c:576
print id
(kwdb 0:0) c
Continuing.
Breakpoint 1, enet_attach
(id={vendor_id = 4113, device_id = 25}, isc=0xf66200)
at enet.c:576
576
wsio_event_mask_t event_mask = 0;
$1 = {vendor_id = 4113, device_id = 25}
(kwdb 0:0)
To remove the command sequence from the breakpoint, enter an empty command sequence.
(kwdb 0:0 commands 1
Type commands for when breakpoint 1 is hit, one per line.
End with a line saying just “end”.
>end
(kwdb) 0:0
88
Chapter 4
Command Reference
KWDB Commands
Setting Conditional Breakpoints
Set a breakpoint that triggers only if a given expression is true. To create a conditional breakpoint, attach an
if expression to a break command.
To attach a condition to a previously created breakpoint, use the cond command.
(kwdb 0:0) b enet_install
Breakpoint 1 at 0x58e60c: file enet.c, line 519.
(kwdb 0:0) b enet_attach
Breakpoint 2 at 0x58e6c8: file enet.c, line 566.
(kwdb 0:0) b enet_init
Breakpoint 3 at 0x58e8a8: file enet.c, line 657.
(kwdb 0:0) info break
Num Type
Disp Enb Address
What
1
breakpoint keep y
0x0058e60c in enet_install
at enet.c:519
2
breakpoint keep y
0x0058e6c8 in enet_attach
at enet.c:566
3
breakpoint keep y
0x0058e8a8 in enet_init
at enet.c:657
(kwdb 0:0) cond 3 (isc != ‘\0’)
(kwdb 0:0) info break
Num Type
Disp Enb Address
What
1
breakpoint keep y
0x0058e60c in enet_install
at enet.c:519
2
breakpoint keep y
0x0058e6c8 in enet_attach
at enet.c:566
3
breakpoint keep y
0x0058e8a8 in enet_init
at enet.c:657
stop only if isc != 0 ‘\000’
To remove a condition from a breakpoint, use the cond command with no arguments.
Setting Processor Level Breakpoints
It is possible to associate a breakpoint with a CPU so that kwdb will only stop if the CPU you specify is
executing the code that hit the breakpoint. If any other CPU executes the code that hits the breakpoint, kwdb
will not stop. To set a breakpoint at a CPU, append the CPU number at the end of the breakpoint command.
For example, to set a breakpoint at function “foo” to stop only when CPU #1 is executing code which hits the
breakpoint:
(kwdb 0:0) break foo cpu 1
If you specify a CPU number that is greater than the highest CPU number on the target system, kwdb will
issue a warning, but will allow you to associate the CPU number with the breakpoint. This means that the
breakpoint will never be hit.
Setting Thread Level Breakpoints
Associate a breakpoint with a thread so that KWDB will only stop if the thread specified has hit the
breakpoint. If any other thread hits the breakpoint, KWDB will not stop. To set a breakpoint at a thread,
append the keyword “thread” followed by the thread number at the end of the breakpoint command. For
example, to set a breakpoint at function “foo” to stop only when thread #2863 hits the breakpoint:
(kwdb 0:0) break foo thread 2863
To find out what threads are running on the target system being debugged, use the info threads command.
Chapter 4
89
Command Reference
KWDB Commands
Until now, kernel hangs often required a kernel reboot if the remote debugger client was accidentally killed
and the kernel stopped at a breakpoint or hit a breakpoint that was set by the client that died. Though it is
possible to force attach to the target kernel in such cases, the kernel will not proceed because the client does
not know that this breakpoint is set; therefore, the original instruction will not be replaced. In most cases,
this would require a reboot of the kernel. Starting with 11.31 kernels and the kwdb-3.1.5 client, the kernel
will not hang if the client is killed accidentally during debugging.
There are two ways to recover from this situation:
•
Force attach to the target. Upon force attaching, the kernel will delete all the stale breakpoitns from
kernel memory.
•
The kwdbctl utility can be used to destroy the debuger stub. As part of this destruction, all the
breakpoints that were installed will be deleted from the kernel memory.
To use this option use kwdbctl -D.
Setting Watchpoints
In addition to setting breakpoints which cause KWDB to get control when the flow of control reaches the
specified address, set watchpoints at data addresses which causes KWDB to get control when that address is
modified.
To set a watchpoint at a particular address (by default, 4 bytes will be watched):
watch *addr
To set a watchpoint at a global symbol specified by < symbol-name>
watch <symbol-name>
To set a watchpoint over a range of addresses we use:
watch <symbol-name> length <length-name>
symbol-name is the symbol on which the watchpoint must be set. length-name is the range for which the
watchpoint must be set. The watchpoint will be set from the address corresponding to the symbol-name to the
address of the symbol + length-name
watch_target address
This command takes address as a pointer and puts a watchpoint at the target of that address. This is useful
for setting watchpoint on a structure or union pointer.
For example :
(kwdb 0:0) watch_target proc_list
is equivalent to executing:
(kwdb 0:0) print proc_list
$1 = (struct proc_list *) 0x7fdf78
(kwdb 0:0) watch *(struct proc *) 0x7fdf78
KWDB also supports deferring of hardware watchpoints, if watchpoint symbol does not correspond to any
address in the loaded modules or in the vmunix being debugged. The watchpoint is put in the deferred list of
breakpoints (and watchpoints), and is activated as soon as a module containing the symbol gets loaded, and
the corresponding address is watched. When the module gets unloaded in the target, the watchpoint again
gets back to the deferred list.
NOTE
90
On IPF, set a maximum of four hardware watchpoints. If more than four are set, the additional
watchpoints will be implemented in software and be very slow as it is on PA-RISC.
Chapter 4
Command Reference
KWDB Commands
Stepping and Continuing
Topics in this section are:
•
“Basic Stepping”
•
“Continuing to the End of a Function”
•
“Stepping Over Called Functions”
•
“Jumping to a New Location”
•
“Lock Stepping Into a Function”
•
“Lock Stepping Over a Function”
•
“Continuing Execution”
Basic Stepping
To step through the kernel code, use the step command s:
(kwdb 0:0) s
For example:
(kwdb 0:0) list
514
enet_install(void)
515
{
516
int rv_wsio;
517
518
/* add our attach function to the list */
519
enet_saved_pci_attach = pci_attach;
520
pci_attach = (int (*)()) enet_attach;
521
522
/*
523
Initialize our drv_ops. Zero the function pointers
since we = don’t support LLA
*/
(kwdb 0:0) s
520
pci_attach = (int (*)()) enet_attach;
(kwdb 0:0) s
526
bzero((caddr_t)&enet_drv_ops,sizeof(drv_ops_t));
(kwdb 0:0) list
521
522
/*
523
Initialize our drv_ops. Zero the function pointers
524
since we don’t support LLA.
525
*/
526
bzero((caddr_t)&enet_drv_ops,sizeof(drv_ops_t));
527
528
/* tell wsio about ourselves */
529
if ((rv_wsio=
530
wsio_install_driver(&enet_wsio_drv_info))) {
531
if(rv_wsio = str_install(&enet_str_info)) {
The step command steps “into” any called functions.
Continuing to the End of a Function
Ending function without stepping through the remaining lines of source code, use the finish command (fin):
Chapter 4
91
Command Reference
KWDB Commands
(kwdb 0:0) list
524
support LLA.
525
*/
526
bzero((caddr_t)&enet_drv_ops,sizeof(drv_ops_t));
527
528
/* tell wsio about ourselves */
529
if ((rv_wsio =
530
wsio_install_driver(&enet_wsio_drv_info))) {
531
if(rv_wsio = str_install(&enet_str_info)) {
532
wsio_uninstall_driver(&enet_wsio_drv_info);
533
}
534
}
(kwdb 0:0) fin
Run till exit from #0 enet_install () at enet.c:529
0x228bc8 in gio_install_drivers ()
Value returned is $1 = 0
Use the Enter key to repeat the previous command.
Use the stepi command si to step through the code by the machine instruction rather than by the source
line.
Stepping Over Called Functions
To step over a called function, use the next command n:
(kwdb 0:0) b
Breakpoint 3
(kwdb 0:0) n
569
(kwdb 0:0) n
570
(kwdb 0:0) n
574
{ (kwdb 0:0)
588 isc-gfsw
enet_init
at 0x58e8a8: file enet.c, line 657.
pci_read_cfg_uint32_isc(isc,SSID,&ssid);
sub_id = (ubit16)(ssid >> 16) ;
if (!(id.vendor_id==DEC21143_VENDERID && = id.device_id==DEC21143_DEVICEID))
n
= &enet_gfsw;
Use the nexti command ni to step through the code by machine instruction rather than source line.
Jumping to a New Location
To resume execution of the target kernel, at a location specified by line number or address, use the jump
command j.
(kwdb 0:0) tbreak enet_install
Breakpoint 1 at 0x146fd8: file enet.c, line 529.
(kwdb 0:0) jump enet_install
Continuing at 0x146fd8.
enet_install () at enet.c:529
Source file is more recent than executable.
529
enet_saved_pci_attach = pci_attach;
(kwdb 0:0) tbreak *0x146fd8
Breakpoint 2 at 0x146fd8: file enet.c, line 529.
(kwdb 0:0) info break
Num Type
Disp Enb Address
What
2
breakpoint
del y
0x00146fd8 in enet_install at
enet.c:529
92
Chapter 4
Command Reference
KWDB Commands
(kwdb 0:0) jump *0x146fd8
Continuing at 0x146fd8.
enet_install () at enet.c:529
529
enet_saved_pci_attach = pci_attach;
(kwdb 0:0)
Lock Stepping Into a Function
This feature is similar to step except that only the foreground processor will be allowed to continue execution.
All the other processors will be stopped at whatever they were doing at the time kernel was previously
stopped. To lockstep into a function, use the next command use the ls or lockstep command
(kwdb 0:0) b enet_init
Breakpoint 3 at 0x58e8a8: file enet.c, line 657.
(kwdb 0:0) set cpu 1
0x775880 in idle+0x8f0 ()
(kwdb 0:1) set cpu 2
0x775880 in idle+0x8f0 ()
(kwdb 0:2) set cpu 0
0x58e8a8: file enet.c, line 657
(kwdb 0:0) lockstep
0x58e8b0 pci_read_cfg_uint32_isc(isc,SSID,&ssid);
(kwdb 0:0) set cpu 1
0x775880 in idle+0x8f0 ()
(kwdb 0:1) set cpu 2
0x775880 in idle+0x8f0 ()
(kwdb 0:2) set cpu 0
Lock Stepping Over a Function
This feature is similar to next except that only the foreground processor will be allowed to continue
execution. All the other processors will be stopped at whatever they were doing at the time kernel was
previously stopped. To lockstep over a function, use the locknext or ln command.
(kwdb 0:0) b enet_init
Breakpoint 1, 0x4a3150 in kwdb_test () at
/ux/core/kern/common/util/kwdb/kwdb_test.c:12
12 kwdb_test_1();
(kwdb 0:0)set cpu 1
0x775880 in idle+0x8f0 ()
(kwdb 0:1)set cpu 0
0x4a3150 in kwdb_test () at /ux/core/kern/common/util/kwdb/kwdb_test.c:12
12 kwdb_test_1();
(kwdb 0:0)locknext
0x4a315c in kwdb_test () at /ux/core/kern/common/util/kwdb/kwdb_test.c:13
12 kwdb_test_4();
(kwdb 0:0)set cpu 1
$0x775880 in idle+0x8f0 ()
It is possible to configure the behaviour of the next and step commands. This can be done using the command:
(kwdb 0:0) set scheduler-locking < mode>
Here mode can be:
on
Chapter 4
When the mode is set to on, then the next, step, nexti and stepi commands will behave like
lockstep and locknext commands.
93
Command Reference
KWDB Commands
step
When the mode is set to step, then step and stepi commands will behave like lockstep and
lockstepi; whereas, the next and nexti commands behave like normal commands.
off
When the mode is set to off then the step, next, stepi and nexti behave like normal
commands.
Continuing Execution
To continue running the target kernel, use the continue command c.
(kwdb 0:0) c
Continuing.
Examining Source Code
To examine source code not located in the current directory; first find the source files, then examine lines
within them:
•
Finding Source Files
•
Displaying Source Code
Finding Source Files
To view source code (not located in the current directory), set the directory path to point to the location of the
source files. Use the dir command with the associated path name to specify the location of the source files.
(kwdb 0:0) dir path_name_to_source
Issue the command for additional directories to be included in the search path.
(kwdb 0:0) dir /home/tester/enet
Source directories searched:
/home/tester/enet:$cdir:$cwd
If invoke kwdb from the build directory, the source files are available to KWDB without issuing the dir
command.
The show dir command displays the value of search path.
The dir command with no argument clears the search path.
Displaying Source Code
Use the list command l to look at the source code in the immediate vicinity of the current line:
(kwdb 0:0) list
14
enet_install(void)
515
{
516
int rv_wsio;
517
518
/* add our attach function to the list */
519
enet_saved_pci_attach = pci_attach;
520
pci_attach = (int (*)()) enet_attach;
521
Subsequent l commands display the next few lines of source.
A minus sign (-) after the command shows previous sections of code.
94
Chapter 4
Command Reference
KWDB Commands
Use l linenumber around a specified line number, and l function to display source around a given function.
Examining Assembly Code
To obtain a disassembly of the current function, use the disassemble command disas:
(kwdb 0:0) disas
As an argument to the disas command, give an address, a function name or a range of addresses, or view the
current function. If a single address or a function name is given, we get a dump of the entire function. If a
range of addresses is given, we get the disassembled code for only those addresses. Starting with kwdb-3.1.7,
the disas command can also accept a <filename:function_name> as argument. This gives the disassembled
output of the function <function_name> belonging to the file <filename> (If the file does not contain the
function being asked then the function will be looked for in the entire vmunix).
KWDB displays the assembly code interspersed with the source code if the source file was compiled with -g
(kwdb 0:0) disas
Dump of assembler code for function enet_attach:
;;; File: enet.c
;;; {
0x58e6b8 : stw %rp,-0x14(%sr0,%sp)
0x58e6bc :
stw,ma %r3,0x78(%sr0,%sp)
0x58e6c0 :
stw %r26,-0x9c(%sr0,%sp)
0x58e6c4 :
stw %r25,-0xa0(%sr0,%sp)
;;; wsio_event_mask_t event_mask = 0;
0x58e6c8 :
ldi 0,%r20
0x58e6cc :
ldi 0,%r21
0x58e6d0 :
stw %r20,-0x60(%sr0,%sp)
0x58e6d4 :
stw %r21,-0x5c(%sr0,%sp)
;;; pci_read_cfg_uint32_isc(isc,SSID,&ssid);
0x58e6d8 :
ldw -0xa0(%sr0,%sp),%r22
0x58e6dc :
ldw 0xbc(%sr0,%r22),%r1
0x58e6e0 :
ldw 8(%sr0,%r1),%r31
0x58e6e4 :
ldw 8(%sr0,%r31),%r19
0x58e6e8 :
ldw -0xa0(%sr0,%sp),%r20
0x58e6ec :
ldw 0xbc(%sr0,%r20),%r21
0x58e6f0 :
ldw 0(%sr0,%r21),%r26
0x58e6f4 :
ldw -0xa0(%sr0,%sp),%r22
0x58e6f8 :
ldw 0xbc(%sr0,%r22),%r1
0x58e6fc :
ldw 4(%sr0,%r1),%r25
---Type <return> to continue, or q <return> to quit---q
Quit
(kwdb 0:0) disass kwdb_test.c:kwdb_test
0x58e6b8 : stw %rp,-0x14(%sr0,%sp)
0x58e6bc :
stw,ma %r3,0x78(%sr0,%sp)
0x58e6c0 :
stw %r26,-0x9c(%sr0,%sp)
0x58e6c4 :
stw %r25,-0xa0(%sr0,%sp)
;;; kwdb_test_1();
0x58e6c8 :
ldi 0,%r20
0x58e6cc :
ldi 0,%r21
0x58e6d0 :
stw %r20,-0x60(%sr0,%sp)
0x58e6d4 :
stw %r21,-0x5c(%sr0,%sp)
;;; kwdb_test_2();
Use the x/i command to examine instructions, described in Examining Instructions.
Chapter 4
95
Command Reference
KWDB Commands
For information on the PA-RISC architecture and instruction set, refer to PA-RISC 1.1 Architecture and
Instruction Set Reference Manual and PA-RISC 2.0 Architecture Manual Title: HP Assembler Reference
Manual. For information on the IPF architecture and instruction set, refer to Intel IA-64 Architecture
Software Developer’s Manual.
Examining Variables
To inspect the values of variables, see:
•
“Printing the Value of a Variable”
•
“Printing the Value of String Variables”
•
“Displaying the Values at Every Stop”
•
“Creating Debugger Variables”
•
“Changing the Value of a Variable”
The variable or expression used as an argument to these commands must be in scope at the time issuing the
inspection command. KWDB has no syntax for specifying variables that are not currently in scope, but can
create variables or change a variable value as explained later in the Creating Debugger Variables and
Changing the Value of a Variable sections.
Printing the Value of a Variable
To print the value of a variable or expression, use the print command p. By default, the p command prints
the value in a format appropriate to the declared type of the variable.
588 isc->gfsw = &enet_gfsw;
(kwdb 0:0) info source
Current source file is enet.c
Located in /home/tester/enet/enet.c
Contains 12705 lines.
Source language is c. (
kwdb 0:0) p reghwid
$3 = 0
(kwdb 0:0) p options
$4 = 8
(kwdb 0:0) p sub_id
$5 = 4198
To set default output number radix, use the set output-radix command. Every printed expression is
assigned a number, prefixed by a dollar sign ($), by which it can referenced in subsequent commands. The
current value of reghwid has the number $3. KWDB supports all the special characters supported by gdb to
refer to the value history. Use a slash (/) and a format specifier to request another format. For example, use x
for hexadecimal, c for character, d for decimal, and t for binary.
(kwdb 0:0) list 559
554
#ifdef __LP64__
555
enet_attach( uint32_t id, struct isc_table_type *isc)
556
#else
557
enet_attach( PCI_ID id, struct isc_table_type *isc)
558
#endif
559
{
560
ubit16 reghwid, options, sub_id;
561
ubit32 ssid;
562
/*
563
* OLA/R Variables to set timeouts and events
96
Chapter 4
Command Reference
KWDB Commands
(kwdb 0:0) p/x ssid
$6 = 0x1066103c
(kwdb 0:0) p/d ssid
$7 = 275124284
(kwdb 0:0) p/t ssid
$8 = 10000011001100001000000111100
(kwdb 0:0) p/x $$
$9 = 0x1066103c
(kwdb 0:0) p id
$10 = {vendor_id = 4113, device_id = 25}
(kwdb 0:0) c
Continuing
Print expressions, an array or array element. To find the type of a variable, use the ptype command pt:
(kwdb 0:0) ptype rv_s wsio
type = int
(kwdb 0:0) ptype enet_drv_opts
type = struct drv_ops {
int (*d_open)();
int (*d_close)();
int (*d_strategy)();
int (*d_dump)();
int (*d_psize)();
int (*reserved0)();
int (*d_read)();
int (*d_write)();
int (*d_ioctl)();
int (*d_select)();
int (*d_option1)();
struct pfilter *pfilter;
int (*reserved1)();
int (*reserved2)();
struct aio_ops *d_aio_ops;
int d_flags;
}
(kwdb 0:0) ptype enet_wsio_drv_info
type = struct wsio_drv_info {
struct drv_info *drv_info;
struct drv_ops *drv_ops;
struct wsio_drv_data *drv_data;
unsigned int driver_version;
}
Using the print command, access variable that are declared in files that have not been compiled with -g.
KWDB assumes these variables are integers. If the variables have been declared as anything other than
interger and the file was not compiled with -g, specify what the type is, when using the print command, as
follows:
(kwdb 0:0 print (type-cast) variable
where type-cast is the type of variable as declared in the source file.
The debugger also provides a printf command that allows formatted data to be displayed. This command is
useful when attaching commands to breakpoints or creating user-defined commands. Refer to the Attaching
Command Sequences to Breakpoints section.
Chapter 4
97
Command Reference
KWDB Commands
Printing the Value of String Variables
KWDB does not attempt to automatically de-reference variables of type char* and display a null terminated
string that the variable points to. KWDB does not automatically de-reference pointers in kernels because:
•
Some pointers are not set to valid values.
•
The char* variables are often used to point to data that is not a null terminated string.
•
Pointers may point to I/O memory, which can cause an HPMC if accessed as a string.
In order to print the string pointed to by a char* variable, use the command:
x/s pointer_name
For KWDB to print strings pointed to by char* variables by default, use the set command as follows:
set print strings on
To turn printing strings off, use the following:
set print strings off
(kwdb 0:0) ptype enet_wsio_drv_info.drv_info
type = struct drv_info {
char *name;
char *class;
unsigned int flags;
int b_major;
int c_major;
struct cdio *cdio;
signed char *gio_private;
signed char *cdio_private;
} *
(kwdb 0:0) p set print strings on
(kwdb 0:0) print (char *)(enet_wsio_drv_info.drv_info.name)
$1 = 0x7a2df0 “enet”
Displaying the Values at Every Stop
Instead of using a print command each time to view a variable, set the debugger to show one or more values
automatically every time the debugger stops — for example, step or reach a breakpoint. To do this, use the
display command (disp).
(kwdb 0:0)
1: rv_wsio
(kwdb 0:0)
520
1: rv_wsio
(kwdb 0:0)
526
display rv_wsio
= 7752912
n
pci_attach = (int (*)()) enet_attach;
= 7752912
n
bzero((caddr_t)&enet_drv_ops,
sizeof(drv_ops_t));
1: rv_wsio = 7752912
Each displayed variable is assigned a number. To stop displaying a variable expression, use the expression
number as an argument to the undisplay command (und). To stop displaying all expressions, use undisplay
with no arguments:
(kwdb 0:0) undisplay
98
Chapter 4
Command Reference
KWDB Commands
Creating Debugger Variables
Create variables to use within the debugger, the term for these variables is “convenience variables”. These
variables are not part of the user’s program/drivers or the kernel.
To create a convenience variable, use the set var command, and put a dollar sign ($) before the name of the
variable. Use the assignment operator (=) to assign an expression to the variable:
(kwdb 0:0) set $myVariable = 200
(kwdb 0:0) print $myVariable
$2 = 200
Use the print command interchangeably with set var to create convenience variables and assign values to
them. The only difference is that set var performs the assignment silently, while print displays the value
after performing the assignment.
The show convenience commands (sho conv) list all convenience variables currently in use. The variable $_
is automatically set to the last memory address examined.
(kwdb 0:0) sho conv
Changing the Value of a Variable
Use print or set var to change the value of a variable, either a convenience variable or a program variable:
(kwdb 0:0)
$3 = 1
(kwdb 0:0)
$4 = 1
(kwdb 0:0)
$5 = 2
(kwdb 0:0)
$6 = 2
(kwdb 0:0)
$7 = 123
(kwdb 0:0)
$8 = 123
print gio_config_state = 1
print gio_config_state
print gio_config_stat = 2
print gio_config_state
print $myVariable = 123
print $myVariable
Starting with kwdb-3.1.7, the print command can accept variables in the form of:
<filename>:<variable_name>.
It prints the value of the variable variable_name present in the file corresponding to filename. If the
variable is not present in the filename, then an error is reported that the variable is not present in the file.
(kwdb 0:0)print kwdb_test.c:kwdb_test_trap_into_tests
$1 = 0
(kwdb 0:0)
Examining Memory
KWDB commands for reading and writing data structures or ranges of memory include such commands as
the print command p and x (examine memory range) commands. Display and modify C language data
structures in C expression syntax using the print command.
Debug at the assembly level, to look at data or instructions in memory. Topics in this section are:
•
“Examining Memory Addresses”
•
“Examining Instructions”
Chapter 4
99
Command Reference
KWDB Commands
•
“Specifying Virtual Space IDs”
Examining Memory Addresses
To see how the array my_list is arranged in memory, first find the address of the array. Use either the print
command or the info address command:
(kwdb 0:0) info address my_list
Symbol “my_list” is at 0xe00000010016b6c0 in a file compiled without debugging.
(kwdb 0:0) &my_list
$1 = 0xe00000010016b6c0
Use the address as an argument to the “x” (examine memory range) command. In the example, the 10 tells
the debugger to display 10 units of data:
(kwdb 0:0) x/10x 0xe00000010016b6c0
0xe00000010016b6c0 <my_list>:
0xffffffff
0xffffffff
0xffffffff
0xffffffff
0xe00000010016b6d0 <my_list+0x10>:
0xffffffff 0x00000000
0x0000001b
0xffffffff
0xe00000010016b6e0 <my_list+0x20>:
0x00000032
0x00000031
By default, the debugger displays the data using the last format specifier used in either the x or print
command.
Display the values in any of the formats allowed by the print command, and the additional formats s (null
terminated string) and i (machine instruction).
If a print format specifier has not been previously used, the default for the x command is hexadecimal.
Examining Instructions
To display a more manageable number of instructions than the disassemble (disas) command shows, use
the x command with the i (for instruction) format specifier. The following x/i command displays the
instruction at a specified address.
kwdb (0:0) x/i 0x22d4
The following command displays ten instructions, starting with the program counter register ($pc):
kwdb (0:0) x/10i $pc
Specifying Virtual Space IDs
When specifying a virtual address in a KWDB command without a corresponding space ID, KWDB
determines the correct space ID from the current state of the kernel executing on the target.
To explicitly specify space IDs in memory read and write commands, use the set command as follows:
set kwdb spaceid space_id
To find out the current spaceid use the show command as follows:
show kwdb spaceid
Some spaceid commands:
100
Chapter 4
Command Reference
KWDB Commands
(kwdb 0:0) show kwdb spaceid
The space id used for memory transfers is 0.
(kwdb 0:0) set kwdb spaceid 2
(kwdb 0:0) show kwdb spaceid
The space id used for memory transfers is 2.
(kwdb 0:0) set kwdb spaceid 0
(kwdb 0:0) show kwdb spaceid
The space id used for memory transfers is 0.
(kwdb 0:0)
Examining Registers
KWDB provides the ability to examine the contents of registers and additional register support.
To see the contents of the registers, use the “info registers”. PA-RISC and IPF have different register sets. The
following is a PA-RISC example:
(kwdb 0:1) info reg
General Registers
flags:
0x9000044
r1:
0xae1800
rp:
0x3c530c
r3:0x400003ffffff0e08
r4:
0x1bf
r5:0x400003ffffff0000
r6:
0x1c35340
r7:
0x1c7c180
r8:
0xae1800
r9:
0
r10:
0x3
Control Registers
pcoqh:
0x3495f8
pcsqh:
0
pcoqt:
0x3495fc
pcsqt:
0
sar:
0x1f
cr0:
0x1
iir:
0xa00c
Miscellaneous
sr0:
0x4fbc00
sr1:
0xb101800
sr2:
0xf941c00
sr3:
0
r11:
0xb18e00
r12: 0xfffffff0ffffffff
r13:
0xb22e00
r14:
0x8b
r15:
0x10e52c8
r16:
0xb257e8
r17:
0x8bb0
r18:
0
r19:
0x88a40c
r20:
0x10
r21:
0x10 e52c8
isr:
ior:
ipsw:
cr8:
cr9:
cr12:
cr13:
0x18340022
0x400000008800ce18
0x806000f
0xfd
0xf3
0x2
0xf0000114
sr4:
sr5:
sr6:
sr7:
0
0xf941c00
0x2dc7c00
0
r22:0x400003ffffff0530
r23:
0x1c35340
r24:
0x40ffac00
r25:
0x1
r26:0x400003ffffff03a0
dp:
0xc36000
ret0:
0
ret1:0x400003ffffff0dd8
sp:0x400003ffffff12d8
r31:
0x349000
cr0:
cr24:
cr25:
cr26:
0x1
0x10e52c8
0x357fc
0x3200
To display the contents of a given register, use the register name as an argument to the info reg command:
(gdb) i r rp
rp 0x3c530c
Use a register name in a print command p, prefixed by a dollar sign ($):
(gdb) p/x $rp
$10 = 0x3c530c
(kwdb 0:0) print/x $pc
$2 = 0x28c658
(kwdb 0:0) print/x $pcoqt
$3 = 0x28c65c
Chapter 4
101
Command Reference
KWDB Commands
Additional Register Support
On IPF, KWDB can access the following additional registers.
Floating point registers:
•
f0 through f127 will be displayed (not all of these contain valid values)
To display the floating point registers use the command info all-reg or: issue the command:
set kwdb floatregs on.
Performance registers:
•
Data breakpoint registers dbp0 through dbp5 will be displayed
•
Instruction breakpoint registers ibp0 through ibp5 will be displayed
•
Performance monitor config registers pmc0 through pmc12 will be displayed
•
Performance monitor data registers pmd0 through pmd16 will be displayed
To display the performance registers issue the command:
set kwdb performanceregs on
Control registers:
•
dcr, iva, pta, ipsr, isr, iip, ifa, iim, pmv will be displayed
To display the control registers, issue the command:
set kwdb controlregs on
Navigating the Stack
The debugger provides several commands that allow where in the program’s call stack and helps to traverse
the stack. Topics in this section are:
•
“Obtaining a Stack Trace”
•
“Moving Up and Down the Stack”
•
“Moving to a Specific Stack Frame”
•
“Finding Information About a Frame”
Obtaining a Stack Trace
To find out where in the call stack the program has stopped, use the backtrace command bt:
(kwdb 0:0) bt
#0 enet_install () at enet.c:526
#1 0x228bc8 in gio_install_drivers ()
#2 0x228a94 in io_virt_mode_config ()
#3 0x30f718 in DoCalllist ()
#4 0x20ca3c in main ()
#5 0xa9c0c in $vstart ()
#6 0x146f90 in istackatbase ()
The command output begins with the number the debugger gives to each stack frame. The stack frame for the
current program always has the number zero. The stack frame of the outermost or “main” function has the
highest number.
102
Chapter 4
Command Reference
KWDB Commands
The bt command output also includes the function name, its arguments, and the source file and line number,
for files compiled with -g.
Use where as a synonym for bt.
Moving Up and Down the Stack
To move to a higher level of the stack (closer to main), use the up command. To move to a lower level, use
down. Specify a numerical argument to either command to move more than one level at a time:
(kwdb 0:0) up
(kwdb 0:0) bt
#0 enet_install () at enet.c:526
#1 0x228bc8 in gio_install_drivers ()
#2 0x228a94 in io_virt_mode_config ()
#3 0x30f718 in DoCalllist ()
#4 0x20ca3c in main ()
#5 0xa9c0c in $vstart ()
#6 0x146f90 in istackatbase ()
(kwdb 0:0) up
#1 0x228bc8 in gio_install_drivers ()
(kwdb 0:0) up
#2 0x228a94 in io_virt_mode_config ()
(kwdb 0:0) bt
#0 enet_install () at enet.c:526
#1 0x228bc8 in gio_install_drivers ()
#2 0x228a94 in io_virt_mode_config ()
#3 0x30f718 in DoCalllist ()
#4 0x20ca3c in main ()
#5 0xa9c0c in $vstart ()
#6 0x146f90 in istackatbase ()
(kwdb 0:0) info frame
Stack level 2, frame at 0x7fff05b8:
pcoqh = 0x228a94 in io_virt_mode_config; saved pcoqh
0x30f718 called by frame at 0x7fff0580, caller of frame at
0x7fff05f0
Arglist at 0x7fff05b8, args:
Locals at 0x7fff05b8, Previous frame’s sp is 0x7fff05b8
Saved registers:
rp at 0x7fff05a4, r3 at 0x7fff05b8
(kwdb 0:0) down
#1 0x228bc8 in gio_install_drivers ()
Moving to a Specific Stack Frame
To move to a particular stack level, use the frame command f with the desired frame number as argument:
(kwdb 0:0) frame 3
#3 0xac80c in $vstart ()
(kwdb 0:0) frame 1
#1 0x489764 in DoCalllist ()
(kwdb 0:0)
Finding Information About a Frame
To see a brief description of the current stack frame, use the frame command f with no arguments:
(kwdb 0:0) f
Chapter 4
103
Command Reference
KWDB Commands
or the info frame command.
(kwdb 0:0) down
#0 enet_install () at enet.c:526
526 bzero((caddr_t)&enet_drv_ops, sizeof(drv_ops_t));
(kwdb 0:0) info frame
Stack level 0, frame at 0x7fff0628:
pcoqh = 0x58e62c in enet_install (enet.c:526); saved pcoqh = 0x228bc8
called by frame at 0x7fff05f0
source language c
Arglist at 0x7fff0628, args:
Locals at 0x7fff0628, Previous frame’s sp is 0x7fff0628
Saved registers:
rp at 0x7fff0614
(kwdb 0:0) frame 1
#1 0x228bc8 in gio_install_drivers ()
(kwdb 0:0) info frame
Stack level 1, frame at 0x7fff05f0:
pcoqh = 0x228bc8 in gio_install_drivers; saved pcoqh
0x228a94 called by frame at 0x7fff05b8, caller of frame at
0x7fff0628 Arglist at 0x7fff05f0, args:
Locals at 0x7fff05f0, Previous frame’s sp is 0x7fff05f0
Saved registers:
rp at 0x7fff05dc
Displaying Symbol Table Information
KWDB provides commands to display information about the contents of symbol tables:
•
“Displaying the Location of a Symbol”
•
“Displaying Information About Defined Functions”
•
“Displaying Information About Global Variables”
•
“Displaying Information About the Data Type of an Expression”
Displaying the Location of a Symbol
To find the location in storage where a symbol is stored, use the info address symbol command:
(kwdb 0:0) list
521
522
/*
523
Initialize our drv_ops. Zero the function pointers
524
since we = don’t support LLA.
525
*/
526
bzero((caddr_t)&enet_drv_ops,sizeof(drv_ops_t));
527
528
/* tell wsio about ourselves */
529
if ((rv_wsio =
531
wsio_install_driver(&enet_wsio_drv_info))) {
532
if(rv_wsio = str_install(&enet_str_info)) {
(kwdb 0:0) info address enet_drv_ops
Symbol “enet_drv_ops” is static storage at address 0x7e7518.
(kwdb 0:0) info address rv_wsio
Symbol “rv_wsio” is a local variable at frame offset 0.
104
Chapter 4
Command Reference
KWDB Commands
Displaying Information About Defined Functions
To show the name and type of defined function, for all functions, or those matching a optional regular
expression, use the info func [regex] command.
(kwdb 0:0) info func enet*
All functions matching regular expression “enet*”:
File enet.c:
int enet_802_2_ics(struct lan_ift_s *, char *, int, int);
long enet_802_2_test_ctl(char *, struct lan_ift_s *);
unsigned int enet_abnormal_isr(struct enet_ift *,
unsigned int);
int enet_attach(struct _PCI_ID, struct isc_table_type *);
....
It will show a whole list of symbols from files not compiled with the debug option. An example is the following:
Non-debugging symbols:
00034e8c restore_general_regs
000404ac pa_generic_psm_pdc_rtc
00047b3c tcp_hash_insert_listener
Displaying Information About Global Variables
To show names and types of global variable (all, or those matching an optional regular expression), use the
info var [regex] command.
(kwdb 0:0) info var enet*
All variables matching regular expression “enet*”:
File globals:
char enet_brdcst_addr[6]:
unsigned int enet_cfit;
unsigned int enet_debug;
Non-debugging symbols:
0070ede0 general_log_lock
0070ee00 general_log_ptr
Displaying Information About the Data Type of an Expression
To show the data type of an expression (or $) without evaluating it, use the whatis expr command to
determine its type. Use the ptype expr command to display its type.
(kwdb 0:0) whatis enet_wsio_drv_info
type = struct wsio_drv_info
(kwdb 0:0) ptype struct wsio_drv_info
type = struct wsio_drv_info {
struct drv_info *drv_info;
struct drv_ops *drv_ops;
struct wsio_drv_data *drv_data;
unsigned int driver_version;
}
(kwdb 0:0) ptype wsio_drv_info_t
type = struct wsio_drv_info {
struct drv_info *drv_info;
Chapter 4
105
Command Reference
KWDB Commands
struct drv_ops *drv_ops;
struct wsio_drv_data *drv_data;
unsigned int driver_version; }
Trapping Panics
To trap kernel panics, set a breakpoint at function panic().
Trapping Panics After File System Flush on PA-RISC
The default PA kernel has a breakpoint set at routine KWDB_stop_before_dump() to stop a kernel panic after
the file system flush, but before the crash dump. Once the crash dump is started, communication with KWDB
is no longer possible.
Trapping Panics: Crashtime Kernel Debugging
KWDB supports multiple ways to debug a crashed system:
1. Start the target operating system with any kernel debugger option and attach to the target system from
the kernel debugger client. When the kernel panics, the target kernel would automatically enter KWDB
prior to collecting crash dumps.
2. Start the target Operating System with the -dcrash option on IPF, and with -f0x80000 flag on PA-RISC.
This initializes the kernel debugger for crashtime attachment only. For 11.31 kernels and beyond,
crashtime kernel debugger can be enabled by booting the kernel with the kwdb_flags=crash option from
the boot loader prompt. Currently, kernel debugger can be initialized at crashtime with console debugger
on all platforms, and remote debugger through sub/sync only on cell platforms. For source level debugging
with console debugger, the console target method can be used (as described in chapter 3).
NOTE
During the crashtime debugger session, none of the execution control commands of KWDB are
available. Only commands pertaining to examinging the state of the system are available. Also,
all q4 commands that are applicable on a crash dump are available.
Debugging Multiple Processor Systems
When one processor of a multiprocessor system stops because of a debug event such as a single step,
breakpoint being hit, or the user typing Ctrl-c in KWDB on the host system, it will stop the other processors.
When all processors have stopped, KWDB will display the user prompt, enter KWDB commands. A request to
display registers or other processor specific items will cause KWDB to display the environment of the
processor (known as the foreground CPU) that originally stopped because of the debug event. Change the
foreground CPU using the cpu select command. For example, cpu select 1 selects processor #1 as the
foreground CPU. If the foreground CPU is allowed to run by a continue or single step command, all other
CPUs will also run until one of them stops because of a debug event.
Unusual results can occur if a single step on the foreground CPU and another CPU stops for a debug event
(for example, hitting a breakpoint) before the foreground CPU has finished the single step. The processor that
stopped because of hitting a breakpoint becomes the new foreground CPU. If the user continues at this point,
the continue command will first cause a single step to occur, as part of continuing past a breakpoint and on
PA a warning will be issued on the console that it can not have two single steps at the same time. On IPF no
warning will be issued, but results will be unpredictable. To avoid this problem, the user must determine the
reason that the target system has stopped after doing a single step on a multiprocessor system by carefully
106
Chapter 4
Command Reference
KWDB Commands
examining the information displayed by KWDB. If the user does a single step and the next KWDB message
indicates that it stopped in a different CPU because of hitting a breakpoint, the user should delete the
breakpoint before continuing to avoid the problem of having two single steps at the same time.
Debugging DLKMs
This section describes how to debug dynamically loadable kernel modules with KWDB:
•
“Preparing to Debug DLKMs”
•
“Executing KWDB on DLKMs”
A Dynamically Loadable Kernel Module (DLKM) is written in the DLKM format, which allows the
module to be dynamically linked to the kernel without having to re-link the entire kernel or re-boot the
system.
Kernel modules written in the DLKM format can either be configured as dynamically loadable modules or as
statically linked modules. Kernel modules written prior to HP-UX 11.0 (static modules) — can only be
configured as statically linked modules.
Preparing to Debug DLKMs
This section describes the conditions needed to debug dynamically loadable kernel modules. Complete these
conditions before starting the KWDB session.
To debug a dynamically loadable module at source level, place a copy of the module object file with debugging
information (generated via the compiler -g option) on the debugger host system. Do not specify optimization
when compiling.
If source level debugging is not required, do not generate debugging information in the module object file, but
a copy of the module object file must be present on the host. Even if not planning to debug a particular
module, it’s good practice to place a copy of the module file on the host and indicate the location of the module
object file using the path command. This allows KWDB to debug the module in case kernel execution stops
during the session while the module is executing or is active on the execution stack.
The module object file that is copied to the host is the DLKM loadable module file generated by config (1M).
The config command stores the module file in the default location for such files on the target, in directory
/stand/dlkm/mod.d. If the kernel is not named vmunix, the directory is /stand/dlkm.kernel/mod.d. For
example, to debug module mod1 using kernel mykern, copy the module object file from target path
/stand/dlkm.mykern/mod.d/mod1 to a directory on the host.
Place the copies of module object files in any filesystem path on the host. The module object files do not need
to be located in the same paths as they reside on the target. Use the KWDB path command to specify the
location of the DLKM module on the host.
If a dynamically loadable module being debugged accesses an external variable defined in another
dynamically loadable module, copy the module object file for the defining module to the host. Place the
module object file which defines the variable in a path on the host specified in a path command, so KWDB can
locate the host’s copy of the file. It is not necessary to generate debug information for the module object file
that defines the variable. If a copy of the module object file containing the definition is not available, KWDB
can not correctly access the value of the external variable.
Keep the host copy of the module object file current with the module object file loaded on the target. If a
module being debugged is unloaded, modified, and re-loaded on the target during a debugging session, recopy
the new module object file to the host.
Chapter 4
107
Command Reference
KWDB Commands
Executing KWDB on DLKMs
This section describes how to run KWDB to debug DLKM modules. Complete the preparation from the
Preparing to Debug DLKMs section before executing KWDB.
First, execute KWDB on the static kernel and attach to the target system, as usual. Before the modules of
interest are loaded, enter the following KWDB commands:
path directory_name
Required: Enter this command to specify to KWDB where the host copies of the module object files are
located. Enter the name of one or more directories where copies have been placed, of the module object files on
the host. Place all module object files in the same host directory and enter that directory name here. Enter
this command, so that KWDB can read the debugging information about the modules.
catch load [module-name]
Optional: Enter this command if KWDB is to stop and prompt for commands whenever the named modules
are loaded. If module-name is omitted, KWDB will stop for all module loads. Set breakpoints in the new
module or perform other debugging operations before the newly-loaded module begins execution. If debugging
commands are not wanted when a module is loaded, do not issue a catch load command for the module.
For example, assume a copy of each module object file is placed to debug on the host in directory
/home/me/mykern.
The following KWDB command allows KWDB to locate the host’s copy of all modules:
kwdb (0:0)> path /home/me/mykern
To debug all modules, enter the KWDB command:
kwdb (0:0)> catch load
To debug modules 1 and 2, enter the KWDB commands:
kwdb (0:0)> catch load mod1
kwdb (0:0)> catch load mod2
so that KWDB stops each time these modules are loaded, allowing to set breakpoints in the modules.
Other operations, such as intercepting unload events and listing the currently loaded modules, include the
following:
catch unload [module-name]
Enter this command if KWDB is to stop and prompt for commands whenever the named modules are
unloaded. If omitting module-name KWDB will stop for all module unloads.
info shared
This displays information about loaded modules.
KWDB intercepts a module load as soon as the kernel has loaded the module into memory and relocated the
module. The intercept occurs before the module’s _install() or _load() entry points are called. The
intercept also occurs before the module is “logically connected” with the kernel by installing the module into
type-specific switch tables. A module unload is intercepted after the module’s _unload() entry point has been
called, and after memory for the module has been de-allocated.
If a module of interest depends on other dynamically loadable modules that are not loaded, KWDB first
processes the loading of the dependent modules before processing the load of the module of interest.
tcatch load [module-name]
Like catch load but temporary — deleted when the load is caught by KWDB.
108
Chapter 4
Command Reference
KWDB Commands
tcatch unload [module-name]
Like catch unload but temporary — deleted when the unload is caught by KWDB.
uncatch load [module-name]
No longer catch load for [module-name]. If [module-name] is omitted, then no longer catch any DLKM loads
uncatch unload [module-name]
No longer catch unload for [module-name]. If [module-name] is omitted, then no longer catch any DLKM
unloads
KWDB can not perform operations on an unloaded module. For example, display the values of
statically-initialized variables or code instructions in a module that is not currently loaded, nor can the
breakpoints in that module be set, or view the source code that corresponds to a function in that module.
Debugging information about a dynamically loadable module only becomes available at the time the module
is loaded, and becomes unavailable at the time the module is unloaded.
On PA-RISC systems, the local copy of the DLKM module is processed by the pxdb utility every time the
module is loaded. Symbolic debugging of DLKM modules will not work if the module is not processed by pxdb
so, make sure that a version of pxdb that processes 64 bit PA-RISC files is present on the system. By default,
KWDB looks for pxdb in /opt/langtools/bin/pxdb. If the version of pxdb that is needed is not in that
directory, tell KWDB to look for pxdb in another directory by setting the environment variable PXDB to the
absolute pathname of the version of pxdb that is to be used.
If kwdb client gets attached to a running kernel with one or more dlkms already loaded then kwdb will not
process those modules for debugging. To process already loaded dlkms for debugging invoke kwdb with the -m
option. In addition to processing all loaded dlkms, -m option enables processing of modules as and when they
get loaded.
Starting with kwdb-3.1.4, there is support for debugging IPF DLKM’s built with +nosectionmerge. If a DLKM
is built with +nosectionmerge option, then the corresponding object file will have multiple .text, .data, .debug
sections.
Starting with kwdb-3.1.5, there is support for debugging PA DLKM’s built with +nosectionmerge.
Assembly Level Debugging Using On-Console Debugger
Every HP-UX kernel 11.11 and later has a built-in debugger that can be accessed from the system console.
This is commonly referred to as the “on-console” debugger. This is also called “single system debugger” as
debugging can be done on the target system itself.
This debugger has the advantage of requiring no communications setup since it runs on the target system
itself, but it has a limited set of commands. The on-console debugger only allows assembly level debugging. If
source-level debugging is needed, the remote debugger’s console target method can be used as discussed in
Chapter 3.
A list of assembler level debugging commands supported on a single system (on-console) debugger is shown in
Table 4-1, “On-Console Debugging Commands.”
Table 4-1
On-Console Debugging Commands
Command
Remarks
continue [count]
Continue from breakpoint
step|si [n]
Single step machine instruction
Chapter 4
109
Command Reference
KWDB Commands
Table 4-1
On-Console Debugging Commands (Continued)
Command
Remarks
next|ni [n]
Single step over function calls
jump [addr]
Jump to another address
bt
Stack trace
print[/fmt] expr
Print value of expression
Expression could include calls to functions and assignment.
Examples: kwdb[0] print gio_config_state
kwdb[0] print gio_config_state = 2
kwdb[0] print vator (0xe00000000099b8a0)
x[/fmt] addr
Examine memory
Allowed formats include hex (h), octal (o), decimal (d),
character
disass [expr]
Disassembly
break [*addr| function_name]
Set a breakpoint at address or function
tbreak [*addr| function_name}
tbreak sets temporary breakpoint
break [*addr| function_name}
break sets a permanent breakpoint. For 11.31 kernels,
breakpoints are deferred. If a DLKM contains a deferred
breakpoint symbol, the breakpoint is automatically enabled
during the module load. During module unload, the
breakpoint is automatically marked as deferred.
watch addr [length] | &variable_name
Set a watchpoint at an address or a variable
delete n
Delete breakpoint
enable n
Enable breakpoint
disable n
Disable breakpoint
ignore n count
Set ignore-count for breakpoint or watchpoint
Do not stop at the breakpoint/watchpoint n for count
number of times. Available for kernel version 11.23 or later.
finish
Run to completion of current routine
set [cpu n|dis]
Sets variables to switch CPUs or enable disassembly
set [auto repeat | pagination ]
[on|off]
In 11.31 kernels, set auto-repeat feature enables auto repeat
of the previous command, and the set pagination command
enables/disables pagination of the output.
unset var
Unset variables
info reg|break|catch
Display registers or breakpoints. For 11.31 kernels, info
catch displays information about catchpoints.
110
Chapter 4
Command Reference
KWDB Commands
Table 4-1
On-Console Debugging Commands (Continued)
Command
Remarks
help [topic]
Basic help information. In 11.31, if optional target argument
is specified, it displays help information of the specified
topic.
kill
Reboot machine
cpu [select] n
Switch CPU
catch load|unload
Catch loads or unloads of DLKM modules
uncatch load|unload
Do not catch loads or unloads of DLKM modules
Catch of loads and unloads of DLKM modules are off by
default.
quit
Quit from the debugger. Upon quit, all breakpoints,
catchpoints, and watchpoints are removed from the
debugger.
Control-x
Escape into the debugger. other control characters could be
set to escape into the debugger.
The console escape character can be changed using KWDB or adb. Change kernel memory so there is no need
to reboot after making the change. In kernels prior to HPUX 11.31, the console escape character is stored in
the variable kgdb_console_escape on PA and kdebug_console_escape on IPF. For 11.31 and beyond, the
kernel variable kwdb_console_escape_seen needs to be patched.The commands to change
kgdb_console_escape from Ctrl-x (0x18) to Ctrl-f (0x06) using KWDB are:
# kwdb -write /stand/vmunix /dev/kmem
(kwdb) write 0x06 at &kgdb_console_escape using b
Writing a byte at 0xb2fb28 in devmem
Old value : 0x06
New value : 0x18
(kwdb) quit
This example assumes that /stand/vmunix is booted on the machine. For pre 11.31 IPF, replace the variable
kgdb_console_escape with kdebug_console_escape. For 11.31 and beyond, replace
kgdb_console_escape_seen with kwdb_console_escape_seen.
The following Table 4-2, “Commands for 11.23 and Beyond,” lists additional commands available on
on-console debugger for kernel 11i version 2.0 (11.23) or later which are not listed in Table 4-1, “On-Console
Debugging Commands.”
Table 4-2
Commands for 11.23 and Beyond
Commands
pfndump phys_mem_tbl
Chapter 4
Remarks
Prints info about physical memory regions (regular and
I/O memory).
111
Command Reference
KWDB Commands
Table 4-2
Commands for 11.23 and Beyond (Continued)
Commands
Remarks
pfndump io_mem_tbl
Prints info about physical regular memory regions.
pfndump pgclass [<Page Frame Number>]
Prints the page classification of a given page. Without
arguments, it displays classification of all page.
pfndump pfdat <Page Frame Number>
Prints info about a specified page frame number.
process proc_address
Prints info about a process from the kernel’s proc
structure.
When used without arguments, it prints info about all
processes.
Prints info about a kernel thread.
kthread ktid
When used without arguments, it prints info about
threads.
symbol symbol_name | symbol_address
Prints the address, type, and size of a kernel symbol.
symbol
When -module option is used, all the symbols in the
module specified by module_name is printed.
-module module_name
panictrace event event_num
Displays the stacktrace in crash path for the event
specified by event_num.
panictrace processor processor_index
The panictrace processor will display the stacktrace for
the processor specified by processor_index.
module [module_name]
Displays information about the modules in the kernel.
Without the argument, module command prints info
about all kernel modules.
Table 4-3 on page 112 lists additional commands available on on-console debugger for kernel 11i version 3.0
(11.31) or later which are not listed in Table 4-1 on page 109, or Table 4-2 on page 111.
Table 4-3
Commands for 11.31 and Beyond
Commands
Remarks
break <func|addr> thread <tid>
Allows to set a breakpoint on a specific kernel thread
break <func|addr> process <pid>
Allows to set a breakpoint on a specific kernel process
break <func|addr> cpu <procid>
Allows to set a breakpoint on a specific processor
catch|uncatch load|unload <modulename>
Allows to set a load or unload catchpoint for a specific
module. When used with uncatch, a specific module is
uncaught.
maint print unwind <funcname>
Print unwind info of a specified function
maint info break
Print contents of the console debugger breakpoint table
112
Chapter 4
Command Reference
KWDB Commands
Table 4-3
Commands for 11.31 and Beyond (Continued)
Commands
Remarks
maint info catch
Print contents of the console debugger catchpoint table
ltor <addr|func>
Prints the corresponding physical address given a kernel
virtual address
translate <addr|func>
Prints the contents of the Page Directory entry on
PA-RISC and Page Table Entry on IPF for the given
function or kernel virtual address
< and > keys
Command line history recall (upto 100 commands are
buffered and can be recalled by the console debugger)
Debugging PA-RISC 11.0 and Earlier Kernels with KWDB
For PA-RISC systems, KWDB only debugs 11.10 and later kernels. However, also use KWDB to debug older
kernels (PA-RISC 11.0 and earlier) that contain support for the older NDDB kernel debugger instead of
KWDB. For backwards compatibility, KWDB provides a KWDB/NDDB protocol translator, named kwnddb,
which translates between the KWDB protocol and the NDDB protocol spoken by the older kernels. Specify
this by specifying the KWDB command target nddb instead of entering a usual target command, as
documented in Chapter 3, “Getting Started with Remote Debugging.” Allows use of the same KWDB interface
for all kernel debugging, even for 11.0 and earlier kernel releases.
Use KWDB’s NDDB compatibility targets to debug the following target systems and kernels:
•
Any target HP-UX kernel supported for NDDB debugging, currently including OS releases 10.0 through
post-11.0 i80 release line.
•
Any target platform supported by NDDB on that kernel: S700, S800, V-Class, N-Class.
•
Any LAN or serial device supported by NDDB on that kernel may be used for communications.
For LAN communications, use the NDDBCS LAN Communications Server to communicate with the target,
dedicated LAN connections may not be used with KWDB. See Chapter 3, “Getting Started with Remote
Debugging.”
It is not required, to modify the NDDB-capable target kernel in any way to debug it with KWDB. But, may of
course, wish to generate source level debugging information for certain files of interest, or may wish to use the
nddb_config_kern utility to configure NDDB characteristics of the kernel.
Boot the target as described in Chapter 3, “Getting Started with Remote Debugging.”
Using KWDB to debug an NDDB target, use most KWDB commands, such as the commands that read and
write memory and registers, set and delete breakpoints, continue execution, trace the stack, and so forth.
Operations that may not be performed include — the following KWDB operations not supported by
NDDB-capable kernels:
•
Can not attach to a running kernel. The kernel must be booted for NDDB debugging using the
appropriate boot flags, and must wait for a client connection at bootup time.
•
Can not remotely reboot the target with file system buffers flushed. (The KWDB kill command will
immediately TOC the target if the NDDB target supports this for the NDDB kill command, otherwise
the target is left suspended.)
Chapter 4
113
Command Reference
KWDB Commands
•
Can not detach the target kernel (even if the NDDB target supports this for the NDDB debugger, due to
differences in protocols).
•
Can not call a kernel function.
Can not perform the following NDDB operations not currently supported by KWDB:
•
Can not use hardware assisted watchpoints.
•
The NDDB ps, ktps and cpus commands are not supported by KWDB.
•
Some control registers such as RCTR, EIEM and EIRR which could be modified by NDDB can not be
modified by KWDB.
•
Can not use a dedicated LAN connection (NDDB feature not supported by KWDB).
NDDB-style functionality provided by NDDB compatibility targets that is not provided by regular KWDB
targets includes:
•
Console printf’s are displayed by the debugger.
Debugging Code with KWDB
KWDB can be used to debug most kernel code, with some exceptions discussed in the following sections:
Non-Debugable Code
These are the known kernel code parts that can not be debugged.
•
Early boot code before KWDB attaches to the target.
•
Low-level interrupt and trap handling code, $ihandler and $thandler on PA, and bubbleup on IA.
KWDB uses that code to service its own interrupt and trap events. Debugging can begin on the interrupt
and trap paths at interrupt() and trap().
•
VM code that services a TLB miss. KWDB relies on the code for this while execution of the target is
“stopped” by the debugger. No breakpoints can be placed in this path of execution.
•
Code that executes with interrupts turned off can not be interrupted, but can stop at breakpoints and may
be single stepped.
•
On PA, code that executes with PSW Q = 0 can not have breakpoints and can not be single stepped. This
includes emulation code for emulated floating-point instructions on platforms without floating-point
coprocessors.
Code with Timeouts in Effect
Because KWDB freezes the state of the system for long periods of time while interactive, kernel code that
must execute within a certain amount of time before “timing out” can be a problem to debug. In order to be
able to debug the code executed with the timer in effect, make some changes to do things differently while
debugging the system.
If timer expiration results in the system “panicking” repeatedly printing messages to the system console, or in
other ways drastically affects system operation, defeat that behavior when debugging. The panic or lengthy
diagnostics should be skipped when debugging.
If there is no need for the timer to be operational when debugging the system, do not set the timer. Some time
dependent functionality, such as clock.c checking for missed clock ticks or spinlock held too long, is
completely useless and is skipped while debugging the kernel.
114
Chapter 4
Command Reference
KWDB Commands
If the timer should be operational while being debugged, no apparent ill effect occurs if the timer pops due to
KWDB freezing the system for too long. This protects both the debugging session of the code for which the
timer is in effect, and protects against problems for other developers who may be debugging Interrupt
Server Routines (ISRs) that interrupted the code. The other developers ideally should not see any problems
if they happen to catch the system in the middle of executing the code with a timer in effect.
To change system behavior when being debugged on a pre 11.31 PA system, use code like the following:
#include <machine/kgdb/kgdb_external.h>
if (kgdb_connected)
{
/*
* System is being debugged.
*/
}
To change system behavior when being debugged on a pre 11.31 IPF system, use code similar to:
#include <h/kdebug.h>
if (kdebug_enabled)
(
/*
* System is being debugged.
*/
)
To change system behavior when being debugged on a 11.31 system, use code similar to:
#include <h/kwdb_kernprivate.h>
if (KWDB_ENABLED()
(
/*
* System is being debugged.
*/
)
Chapter 4
115
Command Reference
Q4 Commands
Q4 Commands
KWDB supports a superset of commands provided by the crash dump analysis tool, Q4. These are defined in
the following sections:
•
“Command Structure”
•
“Data Types”
•
“Numbers”
•
“Addresses”
•
“KWDB Q4 Mode”
•
“Enumerants”
•
“Variables”
•
“Expressions”
•
“Synthetic Fields”
•
“Custom Field Formats”
•
“History References”
•
“Redirecting Input and Output”
•
“Command Completion”
•
“Getting Version Information”
•
“Getting Help”
•
“Searching the Catalog of Data Types”
•
“Listing the Fields in a Data Structure”
•
“Handling typename Clashes”
•
“Listing Kernel Symbols”
•
“Disassembling Functions”
•
“Translating Virtual Addresses”
•
“Tracing Stacks”
•
“Setting Context”
•
“Loading Data From the Crash Dump/Kernel Memory”
•
“Naming Piles of Data”
•
“Saving Piles of Data”
•
“Getting a History of the Loads”
•
“Recalling Old Piles”
•
“Merging Piles”
•
“Forgetting Piles”
•
“Saving and Restoring State”
116
Chapter 4
Command Reference
Q4 Commands
•
“Printing Structure Fields”
•
“Printing Structure From an Address”
•
“Examining Memory”
•
“Writing into Kernel Files or Memory”
•
“Evaluating Expressions”
•
“Listing Constants”
•
“Listing Variables”
•
“Destroying Variables”
•
“Database Operations”
•
“Database Operations”
•
“Including PERL Program Files”
•
“Running PERL Programs”
•
“Adding Type Information”
•
“Listing DLKM Modules”
•
“Processing DLKM Modules”
Command Structure
KWDB implements a line-based debugging language. Commands are terminated by a newline. The exception
is that command lines ending with a \ are continued to the next line.
Data Types
Wherever KWDB requests to enter the name of a data type, it must be prefixed with the proper keyword:
•
enum if it’s an enumerated type
•
struct if it’s a structure
•
union if it’s a union
•
nothing (no prefix at all) if it’s a typedef
Numbers
Wherever KWDB requests to enter a number, it may be entered in octal, decimal, or hex according to the C
convention (begins with 0x for hex, 0 for octal, any other digit for decimal).
KWDB uses this same convention for its output.
Addresses
Wherever KWDB requests to enter an address, enter it in any of the follow forms:
offset
A number taken to be the 64 bits address. The space is taken to be 0.
space.offset
A fully qualified address with both space and offset separated by a dot.
Chapter 4
117
Command Reference
Q4 Commands
KWDB Q4 Mode
KWDB supports all the commands available in Q4. There are certain commands, like symbols, run, print,
and unset present both in KWDB and Q4. To invoke as Q4 commands, they must be prefixed with Q4 as in q4
symbols, q4 run, q4 print and q4 unset. Instead of prefixing all the Q4 commands with q4, it is possible to
set KWDB to a Q4 mode by using the following command:
set kwdb q4 on
Once this mode is set all the Q4 commands will be prefixed with q4 internally and the user need not do this
manually. Setting this mode for the crash and devmem targets provides the user with the standard q4>
prompt. Turn the Q4 mode off by using the following command.
set kwdb q4 off
NOTE
Once the kwdb/q4 mode is set to ON, all of the symbols in the succeeding commands are taken
from the current pile. Only if a symbol is not found in the current pile will it search in the
symbol table.
KWDB supports a command line option -q4. Traditional Q4 users can invoke KWDB with this -q4 command
line option to automatically set kwdb q4 mode ON and to get the same look and feel of Q4.
Enumerants
KWDB prints enumerated types using a symbolic format.
If the value corresponds exactly to a member of the enumerated type, the name of that value is printed.
If the value is a composite of several members of the type, it is decomposed into the smallest number of
members which, when or’ed together, produce that value.
If there are bits in the value that are not covered by any members of the type, a hex number representing
those bits is added to the end of the string of named enumerants.
Example:
q4> print p_space p_vaddr p_type p_flags
p_space
p_vaddr p_type p_flags
32386
0 PT_MMAP PF_ACTIVE|PF_EXACT|PF_ALLOC
8381 1073745920 PT_DATA PF_ACTIVE|PF_EXACT|PF_ALLOC
8381 2063605760 PT_MMAP F_WRITABLE|PF_ACTIVE|PF_EXACT|PF_ALLOC
8381 2063613952 PT_MMAP PF_WRITABLE|PF_ACTIVE|PF_EXACT|
PF_ALLOC
8381 2063683584 PT_MMAP PF_WRITABLE|PF_ACTIVE|PF_EXACT|
PF_ALLOC
See a list of the enumerants defined in the kernel by using the constants command.
Variables
KWDB defines variables and assigns 32- or 64-bit values to them. The usual C language rules apply to
variable names and the syntax used to assign them values and use them.
To create a KWDB variable, decide on a name and assign a value to it with an expression. In Q4 mode, the
variable assignment can be done by entering the command “variable_name = value_expression”. If
KWDB is not in Q4 mode this has to be specified as “eval variable_name = value_expression”.
The variable_name may not start with $q4.
118
Chapter 4
Command Reference
Q4 Commands
See a list of the variables created by using the variables command.
Delete any variables by using the unset command.
Any KWDB commands or their aliases can not be used as a variable name. The following KWDB control
variables:
q4UnwLevel, q4PrintDecimal, q4PrintHex, q4PrintOctal, and q4PrintRadix
Have special meanings to control the output of commands. They will be discussed in later sections.
Example:
1. The print command to use hex (instead of decimal) by default.
$ kwdb -q4 ...
q4> q4PrintRadix=16
2. Define a variable called myVariable1 with the value 10 and display it.
q4> myVaribale1 = 10
012100xa
q4> variables
NAME
OCTAL
DECIMAL
MyVariable1 012
10
HEX
0xa
Note that in this example KWDB is in Q4 mode as shown by the “<q4>” prompt.
If KWDB is not in Q4 mode the same thing has to be done as:
(kwdb) eval myVariable1 = 10
10
(kwdb) variables
NAME
OCTAL
DECIMAL
MyVariable1 012
10
HEX
0xa
Expressions
Anywhere KWDB input calls for a number or address, an expression can be used.
Type an expression that is not part of some other command, KWDB, in Q4 mode, evaluates it and prints the
result in three forms (octal, decimal and hex). The decimal, hex or octal output may be suppressed by setting
the KWDB variable(s) q4PrintDecimal, q4PrintHex or q4PrintOctal, respectively, to zero. Any of them may
be suppressed. The evaluate command can also be used to evaluate any expression.
Example:
q4> 1+1
02
2
0x2
q4> eval 1+1
2
(kwdb) eval 1+1
2
When KWDB encounters an identifier in an expression there are four possibilities. It tries to resolve the
reference by checking each of these categories until it finds a match:
•
A field in the structure of the current pile.
•
A user-defined variable.
Chapter 4
119
Command Reference
Q4 Commands
•
A kernel-defined enumerant (constant).
•
A kernel global variable.
To use field names in the current structure of the current pile, there must be a current pile (that is, at least
one load command) and that pile must have at least one structure in it. If there are no structures in it, there
will be no values to get. If there is more than one structure in it, the value from the first structure will be
used.
The exceptions to this are the keep and discard commands. They operate on an entire pile, one structure at a
time.
It is possible to define a user variable that obscures a kernel defined enumerant or global variable. This can
be useful or hazardous, depending upon the circumstances. Use the constants and variables commands to
find out if this was done.
KWDB’s expression syntax is lifted almost verbatim from the C language. Most of the standard operators
have been implemented and a few new ones have been added.
The following monadic (one operand) operators are supported (with the usual precedence):
~ !
++ -& *
sizeof()
tooffset() tospace()
ltor()
The following dyadic (two operand) operators are supported (with the usual precedence):
+ - * / %
<<>
<> <= = == !=
& ^ |
&& ||
= *= /= %= += -= <<= = &= ^= |=
,
The following triadic (three operand) operators are supported (with the usual precedence):
?:
Expressions in KWDB deal mostly with long integers. If processing a 64 bit kernel a long integer will have 64
bits of value. If processing a 32 bit kernel a long integer will have 32 bits of value.
Most of the previous operators only work on both 32-bit and 64 bit integers. The rules are:
dyadic + and -
At most one operand may have a nonzero space. That space is preserved in the result. The
offset parts of the operands are combined (without carry or borrow) to form the result.
dyadic *, / and % Both operands may be simple 64-bit numbers. They are combined (without carry or borrow)
to form the result.
<< and
The left operand may have a nonzero space. The right operand must not. The offset part of
the left operand is shifted as requested without affecting the space part.
<, , <= and =
Both operands may be simple 64-bit numbers.
== and !=
Either or both operands may be 64-bit quantities.
dyadic &, ^ and | At most one operand may have a nonzero space. That space is preserved in the result. The
offset parts of the operands are combined to form the result.
120
Chapter 4
Command Reference
Q4 Commands
&& and ||
Either or both operands may be 64-bit quantities. They are only checked for zero/nonzero
values. The right operand is only evaluated if necessary.
?:
Any or all of the operands may be 64-bit quantities. They are only checked for zero/nonzero
values. The middle and right operands are only evaluated if necessary.
ltor()
The operand may be any 64-bit address. The address will be translated to a physical address
and stored in the offset of the result. The space of the result will be zero.
sizeof()
The operand must be the name of a type defined in the kernel’s symbolic debug area. The
result is the size of that type in bytes.
tooffset()
The operand may be any 64-bit address. The offset of the result will be the space of the
operand. The space of the result will be zero.
tospace()
The operand may be any 64-bit address. The space of the result will be the offset of the
operand. The offset of the result will be zero.
monadic &
The operand may be the name of any kernel global variable. The result will be the address
of that variable.
monadic *
The operand may be any 64-bit address. The result will be the long integer contents of that
location in the crash dump (after address translation has been performed).
monadic +
The operand may be any 64-bit quantity. The result will be the operand verbatim.
monadic -
The operand may be any 64-bit quantity. The space of the result will be the space of the
operand. The offset of the result will be the negation of the offset of the operand.
~
The operand may be any 64-bit quantity. The space of the result will be the space of the
operand. The offset of the result will be the bit-wise complement of the offset of the operand.
!
The operand may be any 64-bit quantity. The space of the result will be zero. The offset of
the result will be 1 if the offset of the operand was 0, 0 otherwise.
,
The operands may be any 64-bit quantities. The result will be the right operand. The left
operand is always evaluated.
++ and --
The operand may be any 64-bit quantity. The result will be the operand after the increment
or decrement. If the operand is a user-defined variable it is saved either before or after the
increment or decrement operation, as appropriate.
Synthetic Fields
In addition to the fields of each kernel data structure that were defined in the source code, KWDB pretends
there were a few extra fields. (It adds these because they are often useful when debugging.)
These so-called synthetic fields can be printed or used in expressions just like any of the fields defined in the
kernel source. They are:
indexof
Index of the item in the current pile (origin is 0).
mapped
It is 1 if the structure was successfully located and read from the dump, otherwise 0.
spaceof
Space bits of the structure’s virtual address.
addrof
Offset bits of the structure’s virtual address.
physaddrof
Structure’s physical address (actually only the physical address of the first word, the rest
could fall on some other noncontiguous page).
realmode
It is 1 if the structure was loaded from an address without using address translation,
otherwise 0.
Chapter 4
121
Command Reference
Q4 Commands
Custom Field Formats
The print command supplies a default format for every kind of field it can print.
The default formats can be overridden for numeric fields (only) by following the field name on the command
line with any numeric format specification lifted from the printf (3C) manual page. (Since overrides are
permitted only for numeric fields, the c, s, and % formats are not available.)
An additional format (not supported by printf) is supplied. The p format prints integer types as symbolic
kernel addresses.
Example:
q4> load kthread_t from kthread_list next kt_global_kthread max 5
loaded 5 struct kthreads as a linked list (stopped by max count)
q4> print kt_lastrun_time kt_rlink kt_wchan %p
kt_lastrun_time kt_rlink kt_wchan
12527
0
ticks_since_boot
2366
0
streams_up_runq
2366
0
SB$obj#str_memory+0x18
2366
0
weldq_runq
2366
0
str_freeb_idle
q4>
History References
Piles in the history are referred to in these ways:
a positive integer
This refers to a pile by its history number as shown by the history command.
a negative integer
This refers to a pile relative to the current pile in the history list. The pile before the current
pile is -1, the one before that is -2, and so on. The history numbers shown by the history
command have a bearing on relative references so forgotten piles that leave gaps in the
numbering have an effect on this.
zero
This refers to the current pile.
a name
This refers to a pile by its nickname. Nicknames are assigned to piles using the name
command. Nicknames are also assigned with brand command. Piles that have not been
named have no nickname.
Redirecting Input and Output
When KWDB senses its input and output are connected to a terminal it assumes to run it interactively so it
prompts for commands and prints status messages about its progress.
Redirecting Input
Redirect KWDB’s input if to read from a script. It will automatically suppress prompting. Once within
KWDB, input commands can be made to read from a script file using the source command.
122
Chapter 4
Command Reference
Q4 Commands
Redirecting Output Once Inside KWDB
When running KWDB interactively output can be redirected to many of the commands, to files or pipe them
into other commands.
The syntax is just expected. Use > to create or overwrite a file. Use >> to create or append a file. Use | to pipe
to a command. (The command may include additional pipe stages and redirection.)
Use output redirection with any of the following commands: catalog, code, constants, disassemble,
examine, fields, help, history, print, run, symbol, trace, translate, variables, version.
Command Completion
KWDB allows partial commands to be entered rather than typing the entire command name, as long as there
is no ambiguity. For example entering “lo” is equivalent to the command load. But it can not resolve when
there is ambiguity. For example entering “l” will not be resolved to any command as there are two commands,
load and list, starting with “l”.
Special characters for command completion provided by shells are also supported by KWDB as shown in the
following example.
(kwdb) lo<tab>
Will complete the command to q4> load
q4> li<tab>
Will complete the command to q4> list
q4> l<tab>
Will not be able to complete the command as there are two commands,
list and load, starting with ‘l’. Pressing Tab will show a list of commands
to select from, such as:
list load
q4>
KWDB work with ied (1M) only in perl mode (i.e., WDB invoked with -p). Make an alias like:
alias q4=ied -h ~/.q4history kwdb -q4 -q -p
Command editing and history are available at all times. The history file even makes the commands typed in
previous sessions available in current session.
To record command history in a file for using in a future session use the command:
(kwdb 0:0) set history save on
To stop recording the command history use the command:
(kwdb 0:0) set history save off
For more information on the history commands, refer to the GDB User manual.
Getting Version Information
Type version to get the KWDB version string. This command supports output redirection.
Getting Help
Type help to get a short message describing how to get more help.
Type help class to get detailed help on list of commands in that class.
Type help topic to get detailed help on topic.
Chapter 4
123
Command Reference
Q4 Commands
Every command keyword appears in the help directory as a topic.
This command supports output redirection.
Synonyms: h
Searching the Catalog of Data Types
Every kernel supported by KWDB contains symbolic debug information describing some or all of the data
types compiled into the code. In fact, KWDB supports any kernel containing at least some of this data.
The catalog command prints a list of these data types. The listing includes the shape and size of each type as
well as the:
•
Number of top level fields it contains (if it’s a struct or union type).
•
Number of enumerants it contains (if it’s an enum type).
Usage:
catalog [ flags ] re
Where re is a regular expression. The regular expression is not automatically anchored so use ^ or $ to anchor
the match to the head or tail (respectively) of the string.
Flags:
-h
Column headings are normally suppressed when output is sent to a noninteractive destination (like a file or
pipe). This option forces headers to be printed regardless of the destination.
-v
This flag prints the filename in which the structure is defined.
Example:
q4> catalog callout
BYTES FIELDS SHAPE
40
10 struct
4
12 enum
4
12 typedef
40
10 typedef
NAME
callout
callout_flags
callout_flags_t
callout_t
q4> catalog -v struct kwdb_catalog_test2_s
BYTES FIELDS SHAPE
NAME
FILENAME
8
8
2
2
struct kwdb_catalog_test2_s kwdb_test_3.c
struct kwdb_catalog_test2_s kwdb_test_1.c
This command supports output redirection.
Listing the Fields in a Data Structure
List the fields in a data type using the fields command.
Usage:
fields [ flags ] type_name
124
Chapter 4
Command Reference
Q4 Commands
Where type_name is the name of any data type appearing in the catalog. The type_name must be fully
qualified.
Flags:
-c
Output is normally printed as a table of names and numbers. This option makes the output
look like a (compilable) C-style definition.
-h
Column headings are normally suppressed when output is sent to a noninteractive
destination (like a file or pipe). This option forces headers to be printed regardless of the
destination.
-v
Useful only with the -c option, this option adds comments to the C code which describe the
offset and size of each field.
-x
Useful only with the -c option, this option expands every embedded structure and union
reference inline making the complete definition of the type visible.
Example: What’s in a struct callout?
q4> fields struct callout
OFFSET
SIZE
FLAVOR
bytes +bits bytes +bits
0
0
1
0 u_char
1
0
1
0 u_char
4
0
4
0 enum4
8
0
4
0 u_int
12
0
4
0 u_int
16
0
4
0 *
20
0
4
0 *
24
0
4
0 *
28
0
4
0 *
32
0
4
0 *
36
0
4
0 *
32
0
4
0 *
32
0
4
0 u_int
36
0
4
0 u_int
NAME
c_cookie
c_pad
c_flag
c_abs_time_hi
c_abs_time_lo
c_time_next
c_time_prev
c_hash_next
c_hash_prev
var.real_callout.cc_func
var.real_callout.cc_arg
var.time_header.
tc_thdr_next
var.hash_header.
hc_walkcount
var.hash_header.
hc_walklength
Bit fields may have nonzero bit offsets, but all other fields will not. The same is true for field sizes.
The FLAVOR field may not be exact, but it will be the right size and basic underlying type, and will be
correct.
Decode the FLAVOR field as follows:
int
Signed integer (consult the SIZE column for detail).
u_int
Unsigned integer (consult the SIZE column for detail).
char
An 8-bit signed integer.
short
A 16-bit signed integer.
long
A 32-bit or 64-bit signed integer.
u_char
An 8-bit unsigned integer.
u_short
A 16-bit unsigned integer.
u_long
A 32-bit or 64-bit unsigned integer.
Chapter 4
125
Command Reference
Q4 Commands
enum1
An 8-bit signed enumerated.
enum2
A 16-bit signed enumerated.
enum4
A 32-bit signed enumerated.
float
A 32-bit signed IEEE 754 single-precision floating-point.
double
A 64-bit signed IEEE 754 double-precision floating-point.
*
A 32-bit or 64-bit signed pointer.
The entire path to the field is given as its NAME. Every field and subfield of the type is listed.
Example: What’s in a struct sigevent?
q4> fields struct sigevent
OFFSET
SIZE
FLAVOR
bytes +bits bytes +bits
0
0
4
0 int
4
0
4
0 int
8
0
4
0 int
12
0
4
0 int
8
16
24
32
36
40
44
48
52
56
60
0
0
0
0
0
0
0
0
0
0
0
8
8
8
4
4
4
4
4
4
4
4
0
0
0
0
0
0
0
0
0
0
0
*
*
*
int
int
int
int
int
int
int
int
NAME
__sigev_notify
__sigev_signo
__sigev_value.
__svi_int_s.__svi_pad
__sigev_value.
__svi_int_s.__svi_int
__sigev_value.__sival_ptr
__sigev_notify_function
__sigev_notify_attributes
__sigev_reserved[0]
__sigev_reserved[1]
__sigev_reserved[2]
__sigev_reserved[3]
__sigev_reserved[4]
__sigev_reserved[5]
__sigev_reserved[6]
__sigev_reserved[7]
q4>
Example: Produce a declaration for struct sigevent’s.
q4> fields -c struct sigevent
struct sigevent {
int __sigev_notify;
int __sigev_signo;
union sigval __sigev_value;
char (*__sigev_notify_function)( );
int *__sigev_notify_attributes;
int __sigev_reserved[8];
}
q4>
Example: Add offsets and sizes to the previous example.
q4> fields -cv struct sigevent
struct sigevent {
int __sigev_notify;
int __sigev_signo;
126
/* off 0 bytes, len 64
bytes */
/* off 0 bytes, len 4
bytes */
/* off 4 bytes, len 4
Chapter 4
Command Reference
Q4 Commands
bytes
/* off 8
bytes
char (*__sigev_notify_function)( ); /*
*/
bytes, len 8
*/
off 16 bytes, len
8 bytes */
int *__sigev_notify_attributes;/* off 24 bytes, len 8
bytes */
int __sigev_reserved[8];
/* off 32 bytes, len 32
bytes */
union sigval __sigev_value;
}
q4>
Example: Expand all embedded structures/unions in the previous example.
q4> fields -cx struct sigevent
struct sigevent {
int __sigev_notify;
int __sigev_signo;
union sigval {
struct {
int __svi_pad;
int __svi_int;
} __svi_int_s;
char *__sival_ptr;
} __sigev_value;
char (*__sigev_notify_function)( );
int *__sigev_notify_attributes;
int __sigev_reserved[8];
}
q4>
For enumeration types, fields command shows all enumerants and their values as shown in the following
example.
Example: What is in the enumeration type proc_state.
q4> fields enum proc_state
NAME
SUNUSED
SWAIT
SIDL
SZOMB
SSTOP
SINUSE
q4>
VALUE
0
1
2
3
4
5
This command supports output redirection.
Handling Typename Clashes
The commands “catalog” and “info types” will list type names. The details of any type can be displayed
using the commands “fields” and “ptype”. The same type name may have different definitions in different
compilation units. When the same type name has two of more definitions there is said to be a “clash” in q4
terminology. KWDB does not generate the clash information by default. There are two ways for a kwdb user
to generate these type clashes:
1. Invoke kwdb with the command line option “-type-clash”
Chapter 4
127
Command Reference
Q4 Commands
2. When kwdb is running, use the command: “info type-clash <RE>”
When there is a type clash, one type name will be the original name and the others will be the original name
with “_CLASH_<clash#>” appended. There is currently no way to force kwdb to associate the original type
name with any particular clashing type definition. Once KWDB has generated the type clashes, the names
with “_CLASH_<clash#>” can be used wherever type names are used.
Examples:
# kwdb -q /dump/dumps/ia/orca
q4> catalog mblk_t
BYTES
FIELDS
SHAPE
NAME
128
16
typedef mblk_t
q4> info type-clash mblk_t
BYTES
FIELDS
SHAPE
NAME
128
16
typedef mblk_t
192
17
typedef mblk_t-CLASH0
q4> fields -c mblk_t
struct msgb {
struct msgb *b_next;
struct msgb *b_prev;
struct msgb *b_cont;
u_char *b_rptr;
u_char *b_wptr;
struct datab *b_datap;
char *b_pad_osr;
u_char *b_band;
u_char *b_pad1;
u_short b_flag;
u_char b_pad[4];
u_long b_quad[4];
u_int b_flag_priv;
u_int b_flag_extn;
void *b_msgb_extn;
void *b_cachepad[2];
}
q4> fields -c mblk_tCLASH0
struct msgb {
struct msgb *b_next;
struct msgb *b_prev;
struct msgb *b_cont;
u_char *b_rptr;
u_char *b_wptr;
struct datab *b_datap;
char *b_pad_osr;
u_char *b_band;
u_char *b_pad1;
u_short b_flag;
u_char b_pad[4];
u_long b_quad[4];
u_int b_flag_priv;
u_int b_flag_extn;
void *b_msgb_extn;
void *b_cachepad[2];
struck sqe_s b_sq;
}
q4>
128
Chapter 4
Command Reference
Q4 Commands
Listing Kernel Symbols
The symbols command prints a list of kernel symbols and their address. The listing includes the distance to
the next symbol in addition to each symbol’s location and type.
Usage:
symbols re
Where re is a regular expression. The regular expression is not automatically anchored so use ^ or $ to anchor
the match to the head or tail (respectively) of the string.
flags is an optional parameter whose value can be -v. If this value is given, then the output of the symbols
command contains the filename in which the symbol is found.
Example: Look up all the symbols with semaphore in their name.
q4> symbols semaphore
OCTAL
DECIMAL
017531260
4108976
HEX
0x3eb2b0
017534460
4110640
0x3eb930
017717230
4169368
0x3f9e98
020452130
4346968
0x425458
020452200
4347008
0x425480
020466210
4353160
0x426c88
020466410
4353288
0x426d08
050733400
10729216
0xa3b700
DIST
132
TYPE
NAME
FUNC
init_semaphores
20
FUNC
kthread_owns_semaphore
56
FUNC
mq_init_semaphores
40
FUNC
msemaphore_to_msemaphore_32
40
FUNC
msemaphore_32_to_msemaphore
124
FUNC
CopyInMsemaphore
104
FUNC
CopyOutMsemaphore
8
OBJT
semaphore_log_lock
The DIST field gives the distance (in bytes) to the next symbol. This can be useful for deciding whether or not
the symbol points to a structure or is the structure itself.
The TYPE field indicates what kind of symbol it is. These types are as shown by nm.
This command supports output redirection.
q4> symbols -v kwdb_test_1_int_data
static
0126154150
22599784 0x158d868
4 OBJT
/ux/core/kern/common/util/kwdb/kwdb_test_1.c:kwdb_test_1_int_data
Disassembling Functions
The disassemble command prints the assembly code for any kernel function.
Usage:
disassemble [ flags ] CODESPEC
or
code [ flags ] CODESPEC
Chapter 4
129
Command Reference
Q4 Commands
Where CODESPEC is the name of a kernel function or an address or two addresses. If a function name is
specified, the command finds the named function and prints listing of disassembled code. If an address is
specified, the function surrounding that address is dumped. If two addresses are specified, disassembled code
for the range of address between those two addresses is displayed.
Starting with kwdb-3.1.7, the function name can be preceeded by a filename and a colon. The disassembly
will then give the disassembly of the code for the function belonging to the file specified by the filename. If the
specified file does not contain the function specified then the function will be looked up in the vmunix.
It uses the default disassembler of KWDB to do the disassembling. Substitute an alternative disassembler to
use via the environment variable q4Disassemble. See the getasm command for more details.
Flags:
-o
Normally, KWDB gets the code from the crash dump for crash target or from the remote
copy for remote targets. If this flag is used, KWDB will get the code from the local kernel file
instead.
Example: Print the assembly code for link.
q4> disassemble link
Dump of assembler code for function link:
0x178680 <link>:
std %rp,-0x10(%sp)
0x178684 <link+0x4>:
ldo 0x80(%sp),%sp
0x178688 <link+0x8>:
addil L’-0x176000,%dp,%r1
0x17868c <link+0xc>:
ldd 0x130(%r1),%r24
0x178690 <link+0x10>:
ldd 0x440(%r24),%r31
0x178694 <link+0x14>:
ldd 0(%r31),%r26
0x178698 <link+0x18>:
ldi 0,%r24
0x17869c <link+0x1c>:
ldo -0x30(%sp),%ret1
0x1786a0 <link+0x20>:
b,l 0x1768c8 <vn_link>,%r2
0x1786a4 <link+0x24>:
ldd 8(%r31),%r25
0x1786a8 <link+0x28>:
addil L’-0x176000,%dp,%r1
0x1786ac <link+0x2c>:
ldd 0x130(%r1),%r23
0x1786b0 <link+0x30>:
sth %ret0,0x53a(%r23)
0x1786b4 <link+0x34>:
ldd -0x90(%sp),%rp
0x1786b8 <link+0x38>:
bve (%rp)
0x1786bc <link+0x3c>:
ldo -0x80(%sp),%sp
0x1786c0 <link+0x40>:
b,n 0x1786c0 <link+0x40>
0x1786c4 <link+0x44>:
break 0,0
End of assembler dump.
q4>
Example: Print the assembly code for an address range.
q4> disas 0x1786a0 0x1786b8
Dump of assembler code from 0x1786a0 to 0x1786b8:
0x1786a0 <link+0x20>:
b,l 0x1768c8 <vn_link>,%r2
0x1786a4 <link+0x24>:
ldd 8(%r31),%r25
0x1786a8 <link+0x28>:
addil L’-0x176000,%dp,%r1
0x1786ac <link+0x2c>:
ldd 0x130(%r1),%r23
0x1786b0 <link+0x30>:
sth %ret0,0x53a(%r23)
0x1786b4 <link+0x34>:
ldd -0x90(%sp),%rp
End of assembler dump.
q4>
130
Chapter 4
Command Reference
Q4 Commands
If the source file is compiled with debug option, disassemble command will display each source line and
corresponding assembly code interspersed. The following example shows the disassemble output for the
function set_sched_sa() defined as:
int set_sched_sa( kthread_t *kt, caddr_t *arg )
{
proc_t *p = (proc_t *)arg;
if ( ISASCHEDACT(kt) ) {
(void) changepri_policy( kt, p->p_pri,
p->p_schedpolicy );
}
return 0;
}
q4> disassemble set_sched_sa
Dump of assembler code for function set_sched_sa:
;;; File: pm_rtsched.c
;;; {
0x3d3688 <set_sched_sa>:
std %rp,-0x10(%sp)
0x3d368c <set_sched_sa+0x4>:
std,ma %r3,0xa0(%sp)
0x3d3690 <set_sched_sa+0x8>:
std %r4,-0x98(%sp)
0x3d3694 <set_sched_sa+0xc>:
std %r5,-0x90(%sp)
0x3d3698 <set_sched_sa+0x10>:
copy %ret1,%r3
0x3d369c <set_sched_sa+0x14>:
nop
0x3d36a0 <set_sched_sa+0x18>:
copy %ret1,%r5
0x3d36a4 <set_sched_sa+0x1c>:
std %r26,-0x40(%r5)
0x3d36a8 <set_sched_sa+0x20>:
std %r25,-0x38(%r5)
;;;
proc_t *p = (proc_t *)arg;
0x3d36ac <set_sched_sa+0x24>:
ldd -0x38(%r5),%r19
0x3d36b0 <set_sched_sa+0x28>:
std %r19,-0x78(%sp)
;;;
if ( ISASCHEDACT(kt) ) {
0x3d36b4 <set_sched_sa+0x2c>:
ldd -0x40(%r5),%r26
0x3d36b8 <set_sched_sa+0x30>:
b,l 0x4189d0 <IsASchedact>,%r2
0x3d36bc <set_sched_sa+0x34>:
ldo -0x30(%sp),%ret1
0x3d36c0 <set_sched_sa+0x38>:
cmpib,=,n 0,%ret0,0x3d36e8 <set_sched_sa+0x60>
;;;
(void) changepri_policy( kt, p->p_pri, p->p_schedpolicy );
0x3d36c4 <set_sched_sa+0x3c>:
ldd -0x40(%r5),%r19
0x3d36c8 <set_sched_sa+0x40>:
ldd -0x78(%sp),%r20
0x3d36cc <set_sched_sa+0x44>:
ldh 0x64(%r20),%r20
0x3d36d0 <set_sched_sa+0x48>:
ldd -0x78(%sp),%r21
0x3d36d4 <set_sched_sa+0x4c>:
ldw 0x230(%r21),%r24
0x3d36d8 <set_sched_sa+0x50>:
copy %r19,%r26
0x3d36dc <set_sched_sa+0x54>:
copy %r20,%r25
0x3d36e0 <set_sched_sa+0x58>:
b,l 0x3bd328 <changepri_policy>,%r2
0x3d36e4 <set_sched_sa+0x5c>:
ldo -0x30(%sp),%ret1
;;;
return 0;
0x3d36e8 <set_sched_sa+0x60>:
ldi 0,%ret0
;;; }
0x3d36ec <set_sched_sa+0x64>:
copy %ret0,%ret0
0x3d36f0 <set_sched_sa+0x68>:
ldd -0xb0(%sp),%rp
0x3d36f4 <set_sched_sa+0x6c>:
ldd -0x90(%sp),%r5
0x3d36f8 <set_sched_sa+0x70>:
ldd -0x98(%sp),%r4
0x3d36fc <set_sched_sa+0x74>:
bve (%rp)
End of assembler dump.
q4>
q4>disass kwdb_test.c:kwdb_test
Chapter 4
131
Command Reference
Q4 Commands
0x58e6b8 : stw %rp,-0x14(%sr0,%sp)
0x58e6bc :
stw,ma %r3,0x78(%sr0,%sp)
0x58e6c0 :
stw %r26,-0x9c(%sr0,%sp)
0x58e6c4 :
stw %r25,-0xa0(%sr0,%sp)
;;; kwdb_test_1();
0x58e6c8 :
ldi 0,%r20
0x58e6cc :
ldi 0,%r21
0x58e6d0 :
stw %r20,-0x60(%sr0,%sp)
0x58e6d4 :
stw %r21,-0x5c(%sr0,%sp)
;;; kwdb_test_2();
[...]
q4>
This command supports output redirection.
Translating Virtual Addresses
The translate command prints the page directory entry (PDE) or page table entry (PTE) or translation
registers (TR) for any virtual address. (If only the physical address is wanted, the function ltor is a little
easier to use.)
Usage:
translate address
Where address is an expression that evaluates to a virtual address.
Example: PDE for &proc_list on PA system
q4> translate &proc_list
indexof
mapped
spaceof
addrof
physaddrof
realmode
pde_invalid
pde_vpage
pde_space
pde_rtrap
pde_dirty
pde_dbrk
pde_ar
pde_uncache
pde_order
pde_br_predict
pde_ref_trickle
pde_block_mapped
pde_executed
pde_ref
pde_accessed
pde_modified
pde_uip
pde_protid
pde_os
pde_alias
pde_wx_demote
pde_phys_u
132
0
0
0
0x40148a0
0x40148a0
0x1
0
0xa45
0
0
0x1
0
0x10
0
0x1
0
0
0
0x1
0x1
0x1
0x1
0
0
0x1
0
0
0
Chapter 4
Command Reference
Q4 Commands
pde_phys
var_page
pde_next
0xa45
0x4
0xa390d40
Example: TR for &proc_list on IPF system
q4> translate &proc_list
indexof
mapped
spaceof
addrof
physaddrof
realmode
tr_num
tr_type
tr_state
reserved1
tr_tpa.bits.uip
tr_tpa.bits.mod
tr_tpa.bits.alias
tr_tpa.bits.ig1
tr_tpa.bits.ed
tr_tpa.bits.rv1
tr_tpa.bits.ppn
tr_tpa.bits.ar_pl
tr_tpa.bits.d
tr_tpa.bits.a
tr_tpa.bits.ma
tr_tpa.bits.rv2
tr_tpa.bits.p
tr_tpa.val
tr_itir.bits.rv1
tr_itir.bits.key
tr_itir.bits.ps
tr_itir.bits.rv2
tr_itir.val
tr_tva
tr_rr.bits.rv1
tr_rr.bits.rid
tr_rr.bits.ps
tr_rr.bits.rv2
tr_rr.bits.ve
tr_rr.val
q4>
0
0
0
0x887b348
0x887b348
0x1
0x1
0x2
0x2
0
0
0
0
0
0x1
0
0x8000
0x8
0x1
0x1
0
0
0x1
0x10000008000461
0
0xbeef
0x1a
0
0xbeef68
0xe000000100000000
0
0xdead
0xc
0
0x1
0xdead31
Example: PTE for the address 0x208031.0x8003ffff7ffe8000 on IPF system
q4> trans 0x208031.0x8003ffff7ffe8000
indexof 0
mapped 0
spaceof 0
addrof 0x8fbed00
physaddrof 0x8fbed00
realmode 0x1
tpa.bits.uip 0
tpa.bits.mod 0x1
tpa.bits.alias 0
tpa.bits.ig1 0
Chapter 4
133
Command Reference
Q4 Commands
tpa.bits.ed
tpa.bits.rv1
tpa.bits.ppn
tpa.bits.ar_pl
tpa.bits.d
tpa.bits.a
tpa.bits.ma
tpa.bits.rv2
tpa.bits.p
tpa.val
itir.bits.rv1
itir.bits.key
itir.bits.ps
itir.bits.rv2
itir.val
pte_tag.bits.ti
pte_tag.bits.tag
pte_tag.val
next
0x1
0
0x3c880
0x8
0x1
0x1
0
0
0x1
0x9000003c880461
0
0xbeef
0xc
0
0xbeef30
0
0x10403ffff7ffe8
0x10403ffff7ffe8
0
q4>
The PDE or PTE or TR that’s printed can be used to determine the physical address as well as other things
like page ownership and access permissions.
This command supports output redirection.
Tracing Stacks
The trace command prints stack traces.
Usage:
trace
trace
trace
trace
trace
trace
trace
[
[
[
[
[
[
[
flags
flags
flags
flags
flags
flags
flags
]
]
]
]
]
]
]
pc sp
(for PA only)
event #
processor #
process at addr
savestate at addr
thread at addr
pile
Where pc is the starting value of the program counter, sp is the starting (top) value of the stack pointer, # is
the index of a crash event or processor, and addr is the address of a process or kernel thread.
pc, sp, and addr may be expressions that evaluate to addresses. # may be an expression that evaluates to an
integer.
Flags:
-u
Normally, the trace command only prints level, return point, function names and offsets,
one per line of output. This option adds a display of all register values that can be recovered
at the first level or the level specified by the q4UnwLevel variable and up to eight
arguments passed. The registers and argument values displayed may not be valid always.
-v
Print a verbose trace. Normally, the trace command only prints level, return point, function
names and offsets, one per line of output. This option adds the following to each line:
— stack pointer
134
Chapter 4
Command Reference
Q4 Commands
— bsp (for IPF only)
— frame pointer (for PA only)
— save state pointer, if any.
trace command with -f option will show input, local and output registers for every frame
in the stack trace output. Options -frame or -args has the same meaning as option -f.
-f
Output of the trace commands can be controlled by setting following Q4 variables:
q4PrintArgs
Setting this to a non-zero value print arguments for each level and
registers for first level. This is equivalent to using the flag -u.
q4UnwLevel
Start unwinding stack from the level set by q4UnwLevel.
q4MaxStackDepth
Maximum number of levels displayed during stack trace. The default is
250.
The trace event form prints a stack trace for the numbered crash event (a small non-negative integer).
Event zero is the original thing that took the system down. Common first events include:
•
panic
•
transfer of control (often called an INIT or TOC)
•
high priority machine check (often called an HPMC)
Crash events recorded after the initial event are often caused by the first event. Some common reasons for
subsequent crash events are:
•
recursive panic (a processor panics while trying to process a panic)
•
transfer of control (the first processor to panic tells the others to TOC)
•
high priority machine check (this is caused by hardware)
Example: print a stack trace for crash event 1 on a PA crash dump.
q4> trace event 1
crash event was a TOC
stack trace for event 1
#0 0x1b5e3c in wait_for_lock+0x314 ()
#1 0x34c68 in slu_retry+0x1c ()
#2 0x1ab654 in clean_str_spu_sw_q+0xc4 ()
#3 0x1a3880 in osr_pop_subr+0xf0 ()
#4 0x1a5438 in osr_close_subr+0xe90 ()
#5 0x1aaf80 in hpstreams_close_int+0x300 ()
#6 0x1b16f4 in streams_close+0x14 ()
#7 0x156314 in soclose+0x5ac ()
#8 0x192e80 in soo_close+0x90 ()
#9 0x19c984 in closef+0x64 ()
#10 0x19cda0 in close+0x98 ()
#11 0x14c874 in syscall+0x62c ()
#12 0x33f5c in $syscallrtn+0x0 ()
Example: print a stack trace for crash event 0 on an IPF crash dump along with input, local and output
registers at every frame.
q4> trace -args event 0
Event selected is 0. It was a panic
#0 0xe000000000f527c0:0 in
panic_save_regs_switchstack+0x130 ()
Chapter 4
135
Command Reference
Q4 Commands
#1 0xe000000000723dd0:0
r32: 0xe00000000018a9f0
r33: 0x0000000000000e9f
r34: 0xe00000000042fa30
r35: 0x0000000000000005
r36: 0x00fff03c6c616a05
r37: 0x8003ffff7fffa5c0
r38: 0xe000000000723ed0
r39: 0xe000000100441420
r40: 0xe00000010020d578
r41: 0xe00000010020d570
r42: 0xe00000010020d568
r43: 0xe000000000189748
r44: 0xe000000100203f6c
r45: 0x000064cbdc0e79cd
r46: 0xe0000001002041cc
r47: 0xe000000100203f60
r48: 0xe000000100017800
r49: 0xe000000100203f90
r50: 0x00000000ffffffff
r51: 0x0000000000000000
r52: 0x0000000000000000
r53: 0x0000000000000997
r54: 0xe000000000723da0
#2 0xe00000000042fa30:0
r32: 0x8003ffff7fffa600
r33: 0x000000000000000b
r34: 0x0000000000000003
r35: 0x000000000000001c
r36: 0x0000000000000b1b
r37: 0xe000000000430860
r38: 0x00fff03c6c616b5d
r39: 0x8003ffff7fffa5e0
r40: 0x0000000000000001
r41: 0x8003ffff7fffa7d0
r42: 0xe000000116cde3f8
r43: 0x000000000000000b
r44: 0x8003ffff7ffe84e0
r45: 0xe000000100017800
r46: 0x0000000000000002
r47: 0x00000000ffffffff
r48: 0xe000000100204c88
r49: 0x0000000000000000
r50: 0x0000000000000003
r51: 0xe000000108389b80
r52: 0x0000000000000997
r53: 0xe000000100020dc4
r54: 0xe000000100203ff8
r55: 0xe00000000041fcc0
r56: 0x8003ffff7ffe84e0
r57: 0x8003ffff7fffa5c0
r58: 0xe00000010a25e7d0
r59: 0xe00000010a25e7ce
r60: 0x8003ffff7ffe84e8
r61: 0xe00000000018a9f0
r62: 0x0000000000000e9f
#3 0xe000000000430860:0
r32: 0x8003ffff7fffa600
136
in panic+0x300 ()
in0
loc0
loc1
loc2
loc3
loc4
loc5
loc6
loc7
loc8
loc9
loc10
loc11
loc12
loc13
loc14
loc15
loc16
loc17
out0
out1
out2
out3
in post_hndlr+0x8f0 ()
in0
in1
in2
in3
loc0
loc1
loc2
loc3
loc4
loc5
loc6
loc7
loc8
loc9
loc10
loc11
loc12
loc13
loc14
loc15
loc16
loc17
loc18
loc19
loc20
loc21
loc22
loc23
loc24
out0
out1
in vm_hndlr+0x240 ()
in0
Chapter 4
Command Reference
Q4 Commands
r33: 0x0000000000000018 in1
r34: 0x8003ffff7ffe8000 in2
r35: 0x0000000000000288 loc0
r36: 0xe000000000732f90 loc1
r37: 0x8003ffff7ffe8000 loc2
r38: 0x0000000000000002 loc3
r39: 0x0000000000000000 loc4
r40: 0x0000000000000001 loc5
r41: 0x0000000000000003 loc6
r42: 0x8003ffff7ffe84f8 loc7
r43: 0x8003ffff7ffe84e0 loc8
r44: 0x8003ffff7ffe8f24 loc9
r45: 0x8003ffff7ffe84f8 loc10
r46: 0x8003ffff7ffe84e0 loc11
r47: 0x8003ffff7ffe8f24 loc12
r48: 0xe000000100204180 loc13
r49: 0x8003ffff7fffa7cb loc14
r50: 0x000000000000001c loc15
r51: 0x8003ffff7ffe84e0 loc16
r52: 0x0000000000124b31 loc17
r53: 0x0000000000000018 loc18
r54: 0x8003ffff7fffa600 out0
r55: 0x000000000000000b out1
r56: 0x0000000000000003 out2
r57: 0x000000000000001c out3
r58: 0x0000000000000b1b out4
#4 0xe000000000732f90:0 in bubbleup+0xab0 ()
+------------------------- TRAP -------------------------| Data Key Miss Fault in kernel mode at pc =
0xe00000000041a070:1
| save state pointer = 0x2534331.0x8003ffff7fffa600
+----------------------------------------------------------#5 0xe00000000041a070:1 in allocpfd_from_pond+0x3d0 ()
r32: 0xe000000100993c08 in0
r33: 0x8003ffff7fffb2e0 in1
r34: 0x0000000000000001 in2
r35: 0xffffffffffffffff in3
r36: 0x0000000000000997 loc0
r37: 0xe0000000004191e0 loc1
r38: 0xf0ffffff3ffc6b1b loc2
r39: 0x8003ffff7fffb290 loc3
(---------output truncated here-----------)
The trace process at form prints a stack trace for the process whose process table entry starts at the
specified address. If there were multiple kernel threads a trace is printed for every thread. (Use the trace
thread at form to print a trace of one specific kernel thread. In this case, the address specified is that of the
kthread structure. This command only works for kernels that support kernel threads.)
There are a few reasons why a process may not be traceable:
•
There is no process in that process slot (is this the right one?).
•
The process is deactivated (its user area has been pushed to disk).
•
The process was running at the instant the crash dump was initiated.
Example: Print a stack trace for the process at 0x41978040.
Chapter 4
137
Command Reference
Q4 Commands
q4> trace process at 0x41978040
Stack trace for process “vxfsd” at 0x41978040 (pid 35)
Thread at 0x41979040 (tid 35)
Process was not running on any processor
#0 0x2caaa0 in _swtch+0x1b8 ()
#1 0x2d22b8 in 1f_6a7b_cl_real_sleep+0x868 ()
#2 0x2c63d4 in _sleep+0x14c ()
#3 0x2c6d9c in sleep_spinunlock+0x104 ()
#4 0x6f33ac in vx_event_wait+0xdc ()
#5 0x6f26ac in vx_delay2+0x64 ()
#6 0x702cdc in vx_sched_thread+0x174 ()
#7 0x6f3ac0 in vx_postinit+0x168 ()
#8 0x7508c4 in vx_sync+0x24 ()
#9 0x18c3bc in update+0x74 ()
#10 0x18c338 in sync+0x60 ()
#11 0x35b554 in syscall+0x5fc ()
#12 0x33d64 in syscallinit+0x554 ()
Stack trace for process “vxfsd” at 0x41978040 (pid 35)
Thread at 0x41986040 (tid 36)
Process was not running on any processor
#0 0x2caaa0 in _swtch+0x1b8 ()
#1 0x2d1860 in 1c_6a7b_cl_real_sleep+0x1430 ()
#2 0x2c6534 in _sleep_one+0x14c ()
#3 0x703280 in vx_worklist_thread+0x40 ()
#4 0x2a4f44 in kthread_daemon_startup+0x24 ()
#5 0x2a4f20 in kthread_daemon_startup+0x0 ()
#6 0xa9ec0 in trap+0xcc8 ()
Stack trace for process “vxfsd” at 0x41978040 (pid 35)
Thread at 0x4197e040 (tid 37)
. . . . . . // Output truncated here
In the previous example, process vxfsd has many threads and output contains stack trace for all those
threads.
The trace processor form prints a stack trace for the numbered processor. (Use the index of the processor in
the mpproc_info table or the index of the spu in the spu_info table.)
Example: Print a stack trace for the monarch processor (processor 0).
q4> trace processor 0
Processor 0 was running process “syslogd” at 0x4193e040 (pid 319)
Thread at 0x42246040 (tid 338)
Event selected is 1. It was a TOC
#0 0xa8d10 in check_panic_loop+0x38 ()
#1 0xa9ec0 in trap+0xcc8 ()
#2 0x7bcd8 in kgdb_pre_trap+0xa8 ()
#3 0xc1a00 in thandler+0xd14 ()
#4 0xc20a0 in splx+0x70 ()
<--- Trap in Kernel mode
#5 0xc20b4 in splx+0x84 ()
#6 0xc237c in spluser+0x14 ()
#7 0x35b7c4 in syscall+0x86c ()
#8 0x33d64 in syscallinit+0x554 ()
The trace output shows that there was a trap in kernel mode. Run the previous trace with -v option to show
the details of the trap.
138
Chapter 4
Command Reference
Q4 Commands
q4> trace -v processor 0
Processor 0 was running process “syslogd” at 0x4193e040 (pid
319)
Thread at 0x42246040 (tid 338)
Event selected is 1. It was a TOC
#0 0xa8d10 in check_panic_loop+0x38 ()
(sp:fmp
0x5038c00.0x400003ffffff15a8 0x5038c00.0x400003ffffff1598)
#1 0xa9ec0 in trap+0xcc8 ()
(sp:fmp
0x5038c00.0x400003ffffff15a8 0x5038c00.0x400003ffffff1598)
#2 0x7bcd8 in kgdb_pre_trap+0xa8 ()
(sp:fmp
0x5038c00.0x400003ffffff1438 0x5038c00.0x400003ffffff1428)
#3 0xc1a00 in thandler+0xd14 ()
(sp:fmp
0x5038c00.0x400003ffffff1398 0x5038c00.0x400003ffffff1388)
+------------------------- TRAP -------------------------| Trap type 31 in Kernel mode at pc=0xc20a0 splx
|
save state pointer = 0x5038c00.0x400003ffffff0ec8
+----------------------------------------------------------#4 0xc20a0 in splx+0x70 ()
(sp:fmp
0x5038c00.0x400003ffffff0ec8 0x5038c00.0x400003ffffff0eb8)
#5 0xc20b4 in splx+0x84 ()
(sp:fmp
0x5038c00.0x400003ffffff0ec8 0x5038c00.0x400003ffffff0eb8)
#6 0xc237c in spluser+0x14 ()
(sp:fmp
0x5038c00.0x400003ffffff0e48 0x5038c00.0x400003ffffff0e38)
#7 0x35b7c4 in syscall+0x86c ()
(sp:fmp
0x5038c00.0x400003ffffff0dd8 0x5038c00.0x400003ffffff0dc8)
#8 0x33d64 in syscallinit+0x554 ()
(sp:fmp
0x5038c00.0x400003ffffff0c78 0x5038c00.0x400003ffffff0c68)
q4>
The trace savestate at form prints a stack trace for the savestate at the specified address.
q4>
#0
#1
#2
#3
#4
#5
#6
#7
#8
#9
q4>
trace savestate at 0xdead31.0xe000000100016a00
0xe00000000042f370:1 in kfree+0x76 ()
0xe0000000003726a0:0 in vx_worklist_process+0x160 ()
0xe0000000003e42c0:0 in vx_thread_process+0x140 ()
0xe0000000003781c0:0 in vx_fsetupdate+0x70 ()
0xe000000000366ac0:0 in vx_sync1+0x80 ()
0xe0000000003629f0:0 in vx_sync0+0x30 ()
0xe0000000003a8280:0 in vx_walk_fslist+0xe0 ()
0xe0000000003221c0:0 in vx_sync_thread+0x50 ()
0xe0000000003727e0:0 in vx_worklist_process+0x2a0 ()
0xe000000000372480:0 in vx_worklist_thread+0x70 ()
The trace pile form prints a stack trace for every item in the current pile. The underlying data type of the
pile must be one of the following:
•
struct crash_event_table_struct (for PA)
•
struct crash_event (for IPF)
•
struct kthread
•
struct mpinfo
•
struct proc
or any typedef that evaluates to one of these types. For example:
•
crash_event_t
•
kthread_t
Chapter 4
139
Command Reference
Q4 Commands
•
mpinfo_t
•
proc_t
Example: print a stack trace for every active process.
#Invoke kwdb
$ kwdb -q4 -q /var/adm/crash/crash.0
# get all active proc’s
q4> load proc_t from proc_list next p_factp max nproc
loaded 35 struct procs as a linked list (stopped by null pointer)
# keep active proc’s
q4> keep p_stat
kept 35 of 35 struct proc’s, discarded 0
#they were all active
# trace them all
q4> trace pile |more
Stack trace for process “swapper” at 0xb08b00 (pid 0)
Thread at 0xb087c0 (tid 0)
Process was not running on any processor
#0 0x2caaa0 in _swtch+0x1b8 ()
#1 0x2d22b8 in 1f_6a7b_cl_real_sleep+0x868 ()
#2 0x2c63d4 in _sleep+0x14c ()
#3 0x436ae4 in sched+0xcc ()
#4 0x1e4224 in im_launch_sched+0x54 ()
#5 0x417908 in DoCalllist+0xc0 ()
#6 0x1e2c10 in main+0x28 ()
#7 0xbe22c in $vstart+0x48 ()
#8 0x3a760 in $locore+0x94 ()
Stack trace for process “fgrep” at 0x41e93040 (pid 399)
Thread at 0x421f3040 (tid 418)
Process was not running on any processor
#0 0x2caaa0 in _swtch+0x1b8 ()
#1 0x2d1d8c in 1f_6a7b_cl_real_sleep+0x33c ()
#2 0x2c63d4 in _sleep+0x14c ()
#3 0x174b5c in fifo_rdwr+0x3cc ()
#4 0x17e314 in vno_rw+0x104 ()
#5 0x8441ec in read+0x2e4 ()
#6 0x35b554 in syscall+0x5fc ()
#7 0x33d64 in syscallinit+0x554 ()
...
This command supports output redirection.
Setting Context
KWDB supports setting the context to a specific CPU, thread or crash event using commands set cpu, set
thread, and set crash event, respectively. These commands are discussed in the following sections.
Set CPU
Command to select a processor as the view CPU.
Usage:
set cpu n
or
cpu select n
140
Chapter 4
Command Reference
Q4 Commands
While debugging a kernel, KWDB displays the environment of the CPU that was running when the target
stopped due to some event, such as execution of a breakpoint, single step completion, or a Ctrl-c interrupt of
execution. This CPU is known as the “foreground CPU”. Change the foreground CPU using the cpu select#
(or set cpu #) command. This will set the context to the new processor so that any context sensitive
commands like bt, frame, and so forth will be for the new context. This command can be used to set processor
context on crash dumps as well. It is not possible to select a CPU when analyzing a live system using devmem
target.
Set Thread
Command to select a thread at a given address as the current thread context
Usage:
set thread addr
Where addr is the thread address. This command can only be used to set context to a sleeping thread.
Set Crash Event
Command to select an event as the current context
Usage:
set crash event n
Where n is the index of the event in crash_event table. This command is applicable to crash target only.
Loading Data From the Crash Dump/Kernel Memory
KWDB only loads data from the crash dump (if target is crash) or kernel memory (if target is devmem or
remote target) when asked to. The result of each load into the KWDB local memory is called a “pile”. Piles are
kept separate from each other.
A list of the piles loaded during the current session can be displayed using the history command.
Values of each field in the current pile can be printed using the print command. Only the pile at the top of
the history list can be printed or otherwise operated on. Any pile in the history can be copied to the top using
the recall command.
Piles can be named to make it easier to remember which is which. Use the name command to do this.
Piles can be named and set aside to preserve them. Use the brand command to do this.
Piles can be merged (provided they are piles of the same type). Use the merge command to do this.
Piles can be deleted once they’re no longer needed. Use the forget command to do this.
The state of the pile history can be saved and later restored using the pushhistory and pophistory
commands.
To load data from the crash dump or kernel memory use the load command.
Usage:
load [ flags ] [ type ] from address [ options ]
Where type names a data type in the catalog and address is an expression that evaluates to the starting
address of the data. If type is not the name of a typedef, it must be preceded by either the keyword “struct”
or “union”, as appropriate. The type field can be omitted, if type information can be obtained from the type of
from address.
Chapter 4
141
Command Reference
Q4 Commands
Flags:
Real mode, read this data without address translation. The default is to use address
translation.
-r
Options:
skip count
Skip count items before loading anything. The count can be an expression. The default is 0.
max count
Load at most count items. The count can be an expression. The default is 1.
until address
Stop reading if address is reached (as the start address of the next item). The address can be
an expression. The default is not to do this.
next field
Normally when KWDB loads multiple items at a single command, it reads as if from an
array. That is, it loads from sequential structure locations. When a next clause is used, it
loads as if from a linked list, using the specified field as its next pointer. Loading stops
automatically if any of the following conditions are met:
null pointer
KWDB does not try to read from location 0.
bad read
KWDB was not able to read the required number of bytes at the required address.
interrupt
KWDB stops reading if interrupted.
max count
KWDB stops reading if it reaches the limit set by the max option.
until clause
KWDB stops reading if it reaches a structure starting at the address set with the until
option.
loop in linked list
KWDB stops reading if it reaches a structure it has already loaded in the current pile.
Example: Load the entire process table.
q4> load struct proc from proc_list next p_global_proc max nproc
loaded 35 struct procs as a linked list(stopped by null pointer)
Starting with kwdb-3.1.7, the eload command is supported. This command has the same syntax as that of
load command. The advantage of this command is that it first searches the pile cache directory for the pile
data that the user is currently requesting to be loaded. If it is present, then the pile data is read from the file
instead of from the crash dump. In addition to this, if the number of structures loaded is greater than a
pre-defined limit, then the pile contents are written to a file in the pile cache directory. Also a mapping file is
present which contains the command from which the respective file in the pile cache directory is created. This
is used to identify the file from which data has to be read the next time a pile command is executed. The pile
cache directory ( directory where the pile data is stored ) is usually the <crash-dump-directory>/.kwdb/piles
for crash dump or can be configured to any other path using the following command:
q4> set kwdb pile-cache-dir <directory-name>
As mentioned before there is a predefined limit, exceeding which the pile data is written to a file in the pile
cache directory. This limit can be configured using the command:
q4>set kwdb pile-cache-limit < value>
The pileon command can be used to load data from crash dump or kernel memory based on field from
current data structure.
Usage:
pileon [type] from
142
field_name
Chapter 4
Command Reference
Q4 Commands
The pileon command is an extension to the load command. It will add a new pile based on the current pile at
the top of the stack. field_name is a field in the structure of the current pile. Q4 will simulate a print
field_name and load type. type refers to any cataloged type (see the catalog command). If type is not the
name of a typedef, it must be preceded by either the keyword struct or union, as appropriate. If type is not
given type of the field_name will be used.
q4> load proc_t from proc_list next p_factp max 5
loaded 5 struct procs as a linked list (stopped by max
count)
q4> hist
HIST NAME
LAYOUT COUNT TYPE
COMMENTS
1 <none> List
5
struct proc
stopped by max
count
q4> pileon from p_firstthreadp
loaded 5 struct kthreads
q4> hist
HIST NAME
LAYOUT COUNT TYPE
COMMENTS
1 <none> List
5
struct proc
stopped by max
count
2 <none> List
5
struct kthread pileon from
p_firstthreadp
q4>
Starting with kwdb-3.1.5, the load and pileon commands can operate on embedded structures. For example,
if we have the following structure definitions in the kernel:
struct test {
int a;
char c;
};
struct parent_embed {
struct test t;
char z;
struct parent_embed *parent_embed_next;
};
struct parent_embed *p1;
With kwdb-3.1.5 it is possible to execute commands like
q4>load struct parent_embed from p1 next parent_embed_next max 10
loaded 10 struct parent_embed as a linked list(stopped by max count)
q4>pileon struct test from t
loaded 5 struct test
Starting with kwdb-3.1.7, the epileon command is supported. This command has the same syntax as the
pileon command. The advantage of this command is that it first searches the pile cache directory for the pile
data that the user is currently requesting to be loaded. If it is present, then the pile data is read from the file
instead of from the crash dump.
Naming Piles of Data
Usage:
Chapter 4
143
Command Reference
Q4 Commands
name [pile] nickname
Where pile is a history reference to any pile created by a load, merge or recall command. If pile is not
specified current pile is assumed.
The command attaches nickname to current or specified pile. This name is printed by the history command
and can be used with the merge and recall commands to refer to the pile. Nicknames are often easier to
remember than history numbers. Their only use is as an alternative to remembering which history items are
which based only on their ID number.
The nickname is any identifier. It should start with one of these [a–z A–Z_$] and may be followed by some of
these [a–z A–Z 0–9_$]. The nickname must be unique.
$ kwdb -q4 -q /var/adm/crash/crash.0
q4> load proc_t from proc_list
loaded 1 struct proc as an array (stopped by max count)
q4> load from p_firstthreadp
loaded 1 struct kthread as an array (stopped by max count)
q4> hist
HIST NAME
LAYOUT COUNT TYPE
COMMENTS
1
<none> Array 1
struct proc
stopped by max
count
2
<none> Array 1
struct kthread stopped by
max count
q4> name 1 PROC
so named
q4> name THREAD
so named
q4> hist
HIST NAME
LAYOUT COUNT TYPE
COMMENTS
1
PROC
Array 1
struct proc
stopped by max
count
2
THREAD Array 1
struct kthread stopped by
max count
q4>
Saving Piles of Data
Usage:
brand [pile] nickname
Where pile is a history reference to any pile created by a load, merge or recall command. If pile is not
specified current pile is assumed. nickname is any identifier as discussed in the previous section.
The brand command attaches nickname to the current or specified pile and moves it to the bottom of history
stack, and creates a copy of that pile at the top of the history stack. The branded pile will be outside of the
range of the pophistory commands and to delete it must be explicitly forgotten.
Due to memory consideration KWDB keeps at most 100 piles at any time in its local memory. When there are
maximum number of piles already loaded, any new load will delete the oldest pile to make room for the new.
If the oldest pile is a branded pile, it won’t be deleted. To preserve a pile for long, it should be branded.
Example:
q4> load proc_t from proc_list
loaded 1 struct proc as an array (stopped by max count)
q4> load from p_firstthreadp
144
Chapter 4
Command Reference
Q4 Commands
loaded 1 struct kthread as an array (stopped by max count)
q4> hist
HIST NAME
LAYOUT COUNT TYPE
COMMENTS
1
<none> Array 1
struct proc
stopped by
max count
2
<none> Array 1
struct kthread
stopped by
max count
q4> brand THREAD
so named
copied a pile
q4> hist
HIST NAME
LAYOUT COUNT TYPE
COMMENTS
-2
THREAD Array 1
struct kthread stopped by
max count
1
<none> Array 1
struct proc
stopped by
max count
3
<none> Array 1
struct kthread copy of
THREAD
q4> brand 1 PROC
so named
copied a pile
q4> hist
HIST NAME
LAYOUT COUNT TYPE
COMMENTS
-2
THREAD Array 1
struct kthread stopped
by max count
-1
PROC
Array 1
struct proc
stopped by
max count
3
<none> Array 1
struct kthread copy
of THREAD
4
<none> Array 1
struct proc
copy of
PROC
q4>
Saving and Restoring Piles on a File
Using the savepile and restorepile commands, users can save piles to a file for later use in another kwdb
session. This is particularly useful when analyzing very large crashdumps where it might take over half an
hour to load all threads in a crashdump. The pile containing these threads can be saved to a file in a few
seconds, and can be read from the file in a few seconds in a subsequent kwdb/q4 session. This can
significantly speed up analysis of a crashdump over several debugging sessions by one or more users. These
commands allow for saving and restoring individual piles or the entire stack of piles.
savepile
Command for saving piles to a file.
Usage:
savepile [<pile_number>|<pile_name>|all] to <filename>
Pile to be saved can be specified by <pile_number> or <pile_name>. the keyword all will save all the piles to
the <filename>. If the pile to be saved is not specified, current pile will be saved to the <filename>. The piles
saved using the savepile command can be restored later by the restorepile command.
Chapter 4
145
Command Reference
Q4 Commands
restorepile
Command for restoring piles to a file.
The restorepile create piles by reading pile data from a given file. The file had to be created earlier by the
savepile command.
Usage:
restorepile [<pile_number>|<pile_name>|all] from <filename>
Pile to be restored can be specified by <pile_number> or <pile_name>. the keyword all will restore all the
piles from the <filename> and all is the default. Branded piles will be saved and restored as normal piles
and after restoring it will no longer be branded.
Example:
# kwdb -quiet crash.0
q4> load proc_t from proc_list max nproc next p_factp
loaded 5723 struct procs as a linked list (stopped by)
null pointer)
q4> nameit allproc
so named
q4> history
HIST
NAME
LAYOUT
COUNT
TYPE
COMMENTS
1
allproc List
5723
struct proc
stopped
by null pointer
q4> savepile allproc to file1
Saved the pile to file file1
q4> quit
# kwdb -quiet crash.0
q4> restorepile from file1
Restored all piles from file file1
q4> history
HIST
NAME
LAYOUT
COUNT
TYPE
1
allproc List
5723
struct proc
by null pointer
q4>
COMMENTS
stopped
Getting a History of the Loads
Usage:
history
This command prints a list of the piles loaded during the current session. The oldest pile is listed first, the
most recent last. (The current pile is always the most recently loaded one.)
The following information is printed about each history item:
•
History number (an integer from 1 through n, 1 for the oldest pile, n for the current pile). Branded piles
are denoted by negative history number.
•
Nickname of the pile (if any).
•
Organization of the pile (if a pure array or list).
•
Number of items in the pile.
146
Chapter 4
Command Reference
Q4 Commands
•
Data type of the items in the pile.
•
Reason the read terminated (if known).
•
Source of the pile’s data (if the pile is a copy of a previous pile or a combination of two previous piles).
Example:
q4> history
HIST NAME
LAYOUT
1 <none> array
2 <none>
list
3 <none> array
4 <none> array
COUNT TYPE
276 struct
161 struct
1 struct
277 struct
proc
pregion
proc
proc
COMMENTS
stopped by
stopped by
stopped by
merge of 1
max count
loop
max count
and 3
This command supports output redirection.
Recalling Old Piles
Printing and database operations are only defined on the current pile (the one with the highest number in the
history list). To operate on a pile other than the current one, would use the recall command to make that
pile current.
Usage:
recall pile
Where pile is a history reference to any pile created by a load, merge or recall command. This command
copies a specified pile to the current pile.
Merging Piles
Merge an old pile with the current one using the merge command.
A new pile is produced consisting of a union of the two old piles. (That is, every item in either of the original
piles is copied into the result, but none of the items will appear twice.)
The new pile is made the current pile and neither of the original piles is disturbed.
Usage:
merge pile
Where pile is a history reference to any pile created by a load, merge or recall command.
Forgetting Piles
Delete any pile using the forget command.
The forgotten pile is removed along with any nickname it may have had and memory in KWDB’s address
space is freed.
If the forgotten pile was the current pile the previous pile is made current again.
Usage:
forget pile | all
Chapter 4
147
Command Reference
Q4 Commands
Where pile is a history reference to any pile created by a load, merge or recall command. Branded piles have
to be deleted specifically using the nickname. When the keyword all is used, all the loaded piles are forgotten
(except for branded piles, which need to be forgotten explicitly).
Saving and Restoring State
The state of the history pile can be saved and restored so that piles created between the two events are
deleted automatically.
Usage:
pushhistory
Notes the current pile. Any piles created after this command is issued will be deleted by the matching
pophistory.
Usage:
pophistory
Pops back to the matching pushhistory. Any piles created since then will be deleted.
The pushhistory and pophistory commands may be nested. The usual rules about nesting anything apply.
NOTE
Piles explicitly deleted with forget are not restored by pophistory.
The implementation of kwdb prior to kwdb-3.1.5 had a restriction in the total number of piles that could be
accessed at a given point in time. The limit was 100, and there was no tunable mechanism to change that
limit. This was not causing a problem in day-to-day usage; however, this was causing some of the q4 perl
scripts to fail and abort. This restriction has been overcome in kwdb 3.1.5 after the pile rearchitecture work.
In addition to this, earlier kwdb was storing all of the piles in memory while running. This was causing kwdb
to consume more memory during running, especially while debugging large dumps. The new implementation
stores only up to a threshold in memory, and, once the limit is crossed, it flushes the older piles onto the disk
automatically without any intervention by the user. Those (flushed) piles are brought back to memory as soon
as the user does a recall of the older piles. The user can configure the threshold memory limit for pile storage
through the "set kwdb pile-memory-limit" command.
Printing Structure Fields
The print command prints all or part of the current pile. This is the usual way to see the result of a load
(and possible database operations). In addition to printing fields from current pile, print command can also
print variables and symbols.
Usage:
print [ options ... ] [ field [custom_field_format] ... ]
or
print [ options ... ] type from addr
The options may be chosen from this list:
-d
148
Integer fields are normally printed in decimal unless overridden by the KWDB variable
q4PrintRadix or a custom field format. This option overrides q4PrintRadix for every
integer field for the duration of this one print command. Custom field formats can be used
to override this flag on a field-by-field basis.
Chapter 4
Command Reference
Q4 Commands
-H
Column headings are normally printed when the standard output is connected to a tty and
suppressed when it is not. This option turns off column headings regardless.
-h
Column headings are normally printed when the standard output is connected to a tty and
suppressed when it is not. This option turns on column headings regardless.
-o
Sets a default octal format. See -d for more details.
-t
Normally output is printed as a table with each structure on its own line and each field in
its own column. This option (sort of) “transposes” the output. All of the fields for each
structure are grouped together, one field per line, with a blank line between the last field of
each structure and the first field of the next. Each line of data is composed of the name of
the field and the field’s value, respectively.
-x
Sets a default hex format. See -d for more details.
The fields may be zero or more of the following:
•
Any field defined for the structure or union type that comprises the current pile.
•
Any KWDB variable
•
Any KWDB constant
Any of the fields may be followed by a custom field format to modify its appearance in the output.
The default format for integer types is decimal. Here are the ways this can be overridden, listed from lowest
to highest precedence:
•
q4PrintRadix set (to 8, 10, or 16) inside KWDB
•
the -d, -o, or -x options given with the print command
•
a custom field format used on a specific field
The default format for enumerated types is symbolic.
The default format for “embedded” arrays of characters is as a string. There is no direct support for printing
strings that are pointed to by structure fields.
The default format for floating point types is a one of the standard floating point formats.
Any print command that names no fields explicitly prints every element of every array in the underlying
type by default.
Example: Print certain specific fields (lbolt is a kernel symbol).
q4> print p_stat p_flag p_flag%#x p_cntxt_flags p_lastrun_time lbolt
p_stat
p_flag p_flag
p_cntxt_flags p_lastrun_time lbolt
SSLEEP SSYS|SLOAD
0x3
0
29326 29415
SSLEEP SSYS|SLOAD
0x3
0
29326 29415
SSLEEP SSYS|SLOAD
0x3
0
29326 29415
SSLEEP SSYS|SLOAD
0x3
0
29409 29415
SSLEEP SSYS|SLOAD
0x3
0
29355 29415
SSLEEP SSYS|SLOAD
0x3
SSIGABL
29401 29415
SSLEEP SSYS|SLOAD
0x3
SSIGABL
29411 29415
SSLEEP SSYS|SLOAD
0x3
SSIGABL
29408 29415
SSLEEP
SLOAD
0x1
SSIGABL
29409 29415
SSLEEP
SLOAD
0x1
SSIGABL
29353 29415
SRUN
SLOAD
0x1 SSIGABL|SRUNPROC
29412 29415
Example: Print every field (including synthetic fields).
Chapter 4
149
Command Reference
Q4 Commands
q4> load struct utsname from &utsname
loaded 1 struct utsname as an array (stopped by max count)
q4> print -t
indexof 0
mapped 1
spaceof 0
addrof 11818360
physaddrof 11818360
realmode 0
sysname “HP-UX”
nodename “hpadl628”
release “B.11.11”
version “A”
machine “9000/800”
__idnumber “849377401”
Printing Structure From an Address
The second form of print command:
print
[ options . . . ]
type
from
addr
Can be used to print fields of a structure from a given address. The structure is printed in C-style with
address, type, name and value for each fields. The argument type refers to any cataloged type (see the
catalog command). If type is not the name of a typedef, it must be preceded by either the keyword “struct”
or “union”, as appropriate. The type field is optional, if type information can be obtained from the type of
addr. Reading begins at addr, which can be an expression as in load command. All the options supported in
the first form of the print command, discussed in the previous section, is available for this format as well.
150
Chapter 4
Command Reference
Q4 Commands
Example:
q4>
print
intl100_ift_t
0xe000000109835040
0xe000000109835040
0xe000000109835040
0xe000000109835040
0xe000000109835040
0xe000000109835048
0xe000000109835050
0xe000000109835058
0xe000000109835060
0xe000000109835068
0xe00000010983506c
0xe000000109835070
0xe000000109835074
0xe000000109835078
0xe000000109835078
0xe00000010983507c
0xe000000109835080
0xe000000109835084
0xe000000109835088
0xe00000010983508c
0xe000000109835090
0xe000000109835098
0xe0000001098350fc
0xe000000109835100
0xe000000109835104
0xe000000109835118
0xe000000109835120
0xe000000109835128
0xe00000010983512c
0xe000000109835130
0xe000000109835138
0xe000000109835140
0xe000000109835148
0xe000000109835148
0xe00000010983514c
0xe00000010983514c
0xe000000109835150
0xe000000109835154
0xe000000109835158
0xe000000109835160
0xe000000109835168
0xe00000010983516c
0xe000000109835170
. . . . . .
from
0xe000000109835040
struct intl100_ift {
struct lan_ift_s {
struct hw_ift {
struct {
char
*drv_data
0xe000000109835040
intptr_t
(*dlpi_output)()
intl100_resolved_output
int
(*dlpi_build_hdr)()
0
intptr_t
(*dlpi_ioctl)()
hp_dlpi_ioctl
char
*mib_ptr
0xe000000109835384
int
mib_len
0x100
unsigned int
reserved1 0
unsigned int
reserved2 0
unsigned int
reserved3 0
} hp_dlpi
unsigned int
mac_type
0x4
unsigned int
llc_flags
0x1f
unsigned int
mjr_num
0x77
unsigned int
nm_id
0x1
unsigned int
instance_num 0
unsigned int
mtu
0x5dc
char
*name
0xe0000000001b8af8
unsigned char
hdw_path
“0/16/1/5/0”
unsigned int
hdw_state
0
unsigned int
mac_addr_len 0x6
unsigned char
mac_addr
““
unsigned int
features
0x4807
uint8_t
*arpmod_name
0xe0000000001b8e1d
unsigned int
ppa
0
unsigned int
watch_timer 0x1
unsigned int
reserved2
0
lock_t
*hwift_lock
0xe00000010980d400
struct hw_ift
*next
0
} hwift
int
af_supported
0
struct {
int
flag
0
int
timer
0x4
} lantimer
intptr_t
(*hw_req)()
intl100_hw_req
int
(*dma_time)()
intl100_DMA_timeout
unsigned int
BAD_CONTROL
0
unsigned int
UNKNOWN_PROTO 0xa3
unsigned int
RXD_XID
0
// Output truncated here
This command supports output redirection.
Chapter 4
151
Command Reference
Q4 Commands
Examining Memory
Usage:
examine [ flags ] [ addr ] [ for lines ] [ using format ]
Where addr is an expression that evaluates to the starting virtual address of the data, lines is an expression
that evaluates to the number of lines of output wanted, and format is a list of format characters that controls
printing of each item in the output line.
Flags:
-o
Normally, KWDB gets the data from the crash dump or the kernel memory depending on
the target. With this option, KWDB will get the data from the kernel file instead. This is
like the difference between the adb operators ? and /.
-r
Real mode, read this data without address translation. The default is to use address
translation.
If addr is not given, the value of dot leftover from the previous examine command is used.
If lines is not given, the value from the previous examine command is used. The default value for the first
time is 1. If lines is not given, but addr is, the first time default for lines is used.
If format is not given, the value from the previous examine command is used. The default value for the first
time is D. If format is not given, but addr is, the first time default for format is used.
The format characters are mostly borrowed from adb. They are:
o
Print a half-word in octal, increment dot by 2.
O
Print a word in octal, increment dot by 4.
d
Print a half-word in decimal, increment dot by 2.
D
Print a word in decimal, increment dot by 4.
x
Print a half-word in hex, increment dot by 2.
X
Print a word in hex, increment dot by 4.
u
Print a half-word in unsigned decimal, increment dot by 2.
U
Print a word in unsigned decimal, increment dot by 4.
f
Print an IEEE float, increment dot by 4.
F
Print an IEEE double, increment dot by 8.
b
Print a byte in hex, increment dot by 1.
B
Print a byte in octal, increment dot by 1.
c
Print a character, increment dot by 1.
C
Print a character with enough backslash escapes to make it readable, increment dot by 1.
s
Print a string, increment dot by the length of the string (including the trailing null
character).
S
Print a string with enough backslash escapes to make it readable, increment dot by the
length of the string (including the trailing null character).
Y
Print a word as a date-and-time string, increment dot by 4 (see ctime (3C)).
a
Print the value of dot as a symbolic kernel address, dot is not incremented.
152
Chapter 4
Command Reference
Q4 Commands
A
Print the value of dot as a decimal number, dot is not incremented.
p
Print the word dot points to as a symbolic kernel address, increment dot by 4.
^
Decrement dot by the current increment (that is, back up over the previous value retrieved),
nothing is printed.
+
Increment dot by 1, nothing is printed.
-
Decrement dot by 1, nothing is printed.
L
Print 64 bits in hex.
i
Print an instruction, address is incremented by size of instruction.
I
Print a bundle of instructions, address is incremented by size of a bundle.
Any format character preceded by a positive integer is repeated that many times.
Example: What was the panic message?
q4> examine panicstr using s
Data segmentation fault
Example: What was in the console message buffer?
q4> examine &msgbuf+8 using s
WARNING: Bad magic in file /stand/ioconfig (0x2122494f)
expected 0x21224941
Block TLB kernel mapping enabled
16 lanmux0
16.1 lan3
52 scsi1
52.0 target
52.0.0 tape2
52.5 target
...
Example: What time was it when the system dumped memory?
q4> examine &time using Y
Sun Jun 5 17:50:00 1994
Example: How many processors did the system have?
q4> examine &runningprocs using aD
runningprocs 2
Example: Print instruction at a given address.
Examine instruction at an address in a PA crash dump:
$ kwdb -q4 -quiet
Detected PA 64-bit executable.
Invoking /CLO/Components/WDB/Src/gdb/gdb/kwdb64.
q4> ex 0x66a6ec using i
0x66a6ec <pty_init+0x4>:
addil L’-0x27c000,%dp,%r1
q4>
Chapter 4
153
Command Reference
Q4 Commands
Examine instruction at an address in an IA crash dump:
$ kwdb -q4 -quiet
Detected IA64 executable.
Invoking /CLO/Components/WDB/Src/gdb/gdb/kwdb.ia64.
/CLO/Components/WDB/Src/gdb/gdb/kwdb
q4> ex 0xe000000000f2a450 using i
0xe000000000f2a450:0 <pty_init+0x10:0>: [MLX]
mov r37=14
q4>
Examine bundle of instructions in an IA crash dump:
q4> ex 0xe000000000f2a450 using I
Dump of assembler code from 0xe000000000f2a450:0 to 0xe000000000f2a460:0:
End of assembler dump.
0xe000000000f2a450:0<pty_init+0x10:0>:[MLX]mov r37=14
0xe000000000f2a450:1<pty_init+0x10:1>:
movl r38=0xe0000000001dd838;;
q4> ex
Dump of assembler code from 0xe000000000f2a460:0 to
0xe000000000f2a460:0 <pty_init+0x20:0>:[MMB]
adds
0xe000000000f2a460:1 <pty_init+0x20:1>:
adds
0xe000000000f2a460:2 <pty_init+0x20:2>:
br.call.sptk.few b0=0xe00000000047da00:0
End of assembler dump.
0xe000000000f2a470:0:
r36=96,r32
r35=88,r32
<alloc_spinlock>;;
q4>
This command supports output redirection.
Writing into Kernel Files or Memory
KWDB can modify data in kernel files or kernel memory using the write command. The print and set
commands can also be used to modify data in kernel files or memory.
The syntax of the write command is:
write [flags] data at addr [using format]
or
write [flags] {data1, data2, ...} at addr [using format]
The write command writes the given data into memory or kernel file at the address specified by addr.
flags:
-o
Write into kernel file (vmunix), instead of memory. This option is similar to using “?” in
adb instead of “/”.
-r
Write without address translation (real-mode).
The addr can be a C-style expression resulting in either a 32- or 64-bit address. It may also include space in
the form space.offset. When used with the second format (within curly brackets), addr is assumed to
represent an array, and the number of comma elements specified within the braces are written starting from
addr. Writing to an array feature is available from KWDB 3.1.3 onwards.
154
Chapter 4
Command Reference
Q4 Commands
The term format is one of the characters b, w, W, L, c and s. It specifies the type (length) of data to be written
as shown in Table 4-4, “Kernel File/Memory Write Formats.”
Table 4-4
FMT
Kernel File/Memory Write Formats
DETAIL
Number of Bytes Written
b
write a byte
1 byte
w
write a half word
2 bytes
W
write a word
4 bytes
L
write a long word
8 bytes
c
write a character
1 byte
s
write a string
length of string
The default format character for numeric data is W. Data enclosed in double quotes (“”) will be taken as string
by default and data enclosed in single quotes (‘ ’) will be taken by default as character. The delimiter character
“\” is not allowed in the string. Any special character in the string has to be written using other formats like
character format. Maximum length of the string is limited to 4KB. While writing numeric data, alignment is
not considered. However, KWDB displays the warning message “Warning: data not aligned at proper
address boundary.” When data is not aligned at proper address boundary. The write command prints the
value before modification and the new value after the successful write. The format specified is given higher
precedence over the type information of the variable (when debug information is available) and it overrides
the type information.
To allow writing into kernel file or memory KWDB has to be invoked with the -write option. KWDB can not
modify the kernel file or crash dump when the target is crash. If the write or print or set command is
issued before selecting any target using the target command, writing will be done in the kernel file. After
issuing the target command, all writes will be to memory by default. To write to the kernel file after
selecting a target use the write command with -o option. While debugging a remote target, any data written
using write -o will modify only the local copy of the kernel file and not the kernel file on the remote target.
NOTE
Any modification in the kernel file will be permanent until overwritten with new data. Turn on
logging, using the command set kwdb log on.
Writing into Kernel Files
To write into the kernel file invoke kwdb with the kernel file and use the write, print or set command. Since
the target command has not been issued, the -o option for write command is not needed. A set of examples
is provided.
Example: Write a string at a particular address in the kernel file (local vmunix file).
$ kwdb -q -write ./vmunix
(kwdb) write “ -PF ./linkorder -P -noshared -k mapfile
+nodefaultmap +Accept typeMismatch” at 0xb476b8
Writing 76 characters at 0xb476b8 in kernel file
Old value: “xxxxxxxxxxxxxxxxxxxxxxxxxxxxxxxxxxxx”
New value: “ -PF ./linforder -P -noshared -k mapfile
+nodefaultmap +Accept typeMismatch”
(kwdb)
Chapter 4
155
Command Reference
Q4 Commands
Example: Write eight bytes of data at a particular address in kernel file.
(kwdb) write 0xae21f9 at 0xb476c0 using L
Writing 8 bytes at 0xb476c0 in kernel file
Old value: 0x00ae21f972646572
New value: 0x0000000000ae21f9
(kwdb)
As shown in the previous example, if data specified is shorter in length it is right justified (that is, padded
with zeros on the left side).
Example: Write two bytes of data at a particular address in vmunix.
(kwdb) write 0xae21f9 at 0xb476bc using w
Wrong value 0xae21f9 for format w
As shown in the previous example, if the data specified is larger in size than that specified by the format
character it is reported as an error.
(kwdb) write 0xae21 at 0xb476bc using w
Writing 2 bytes at 0xb476bc in kernel file
Old value: 0x0000
New value: 0xae21
Writing into Kernel Files or Memory During Live Memory Analysis
During live memory analysis (or after issuing a target command) all writes using a write, print, or set
command will be to the memory by default. To write to the kernel file use the write command with the -o
option. The print or set command can not be used to write into a kernel file after issuing the target
command.
Example: Write a string data at a particular address in memory (/dev/kmem).
# kwdb -q4 -q -write/stand/vmunix /dev/kmem
(kwdb) write “hpadl879” at 0xac64e1
Writing 9 characters at 0xac64e1 in devmem
Old value: “unknown”
New value: “hpadl879”
(kwdb) ex 0xac64e1 using s
hpadl879
/* from memory*/
(kwdb) ex -o 0xac64e1 using s
unknown
/* from vmunix file*/
Example: Write a string data at a particular address in the kernel file.
(kwdb) write -o “hpadl879” at 0xac64e1
Writing 9 characters at 0xac64e1 in kernel file
Old value: “unknown”
New value: “hpadl879”
(kwdb) ex 0xac64e1 using s
hpadl879
/* from memory*/
(kwdb) ex -o 0xac64e1 using s
hpadl879
/* from vmunix file */
(kwdb)
Example: Modify the value of a kernel symbol in memory using the write, print or set command on a live
system.
# kwdb -q4 -q -write /stand/vmunix /dev/kmem
q4> ex &kgdb_debug_flags
0
156
Chapter 4
Command Reference
Q4 Commands
q4> print kgdb_debug_flags = 1
$1 = 1
q4> ex &kgdb_debug_flags
1
q4> set kgdb_debug_flags = 2
q4> ex &kgdb_debug_flags
2
q4> write 3 at &kgdb_debug_flags
Writing 4 bytes at 0xb2ed34 in devmem
Old value: 0x00000002
New value: 0x00000003
q4> ex &kgdb_debug_flags
3
Example: Modify the value of a symbol in the kernel file using the write command on a live system.
q4> write -o 4 at &kgdb_debug_flags
Writing 4 bytes at 0xb2ed34 in kernel file
Old value: 0x00000000
New value: 0x00000004
q4> ex &kgdb_debug_flags
3
/* from memory */
q4> ex -o &kgdb_debug_flags
4
/* from vmunix file */
During the remote kernel debugging all writes using the write, print or set command will be to the remote
target memory by default. To write to the local kernel file use the write command with the -o option. The
print or set command can not be used to write into the local kernel file after issuing the target command.
Evaluating Expressions
Usage:
evaluate expr
Where expr is an expression.
This command evaluates expr and prints the result in decimal. This command is more useful for scripting as
well as to evaluate expression when KWDB is not in Q4 mode.
The output of this command is never affected by any of the commands, control variables used to set user
preferences. As a result, KWDB programs can use this command to evaluate expressions without fear of the
result being returned in some unexpected format and interactive users can change output formats as they
please without fear of confusing scripts they might be running.
Listing Constants
Generate a list of all of the enumerants defined in the kernel’s symbolic debug area using the constants
command.
Usage:
constants
Example: Produce a list of the enumerants defined by the kernel.
q4> constants -h | head -10
AUTH_OK
0x0
AUTH_BADCRED
0x1
AUTH_REJECTEDCRED
0x2
Chapter 4
157
Command Reference
Q4 Commands
AUTH_BADVERF
AUTH_REJECTEDVERF
AUTH_TOOWEAK
AUTH_INVALIDRESP
AUTH_FAILED
AUTH_KERB_GENERIC
AUTH_TIMEEXPIRE
0x3
0x4
0x5
0x6
0x7
0x8
0x90x10
This command supports output redirection.
Listing Variables
Generate a list of all of the variables that have been defined using the variables command. Some odd
conflicts in the name space between variables and KWDB commands may be found. KWDB commands or an
initial part of a command which KWDB tries to complete as a command or command aliases can not be used
as a variable name. Use variable names that are either meaningful or avoid command name conflicts. For
example “n” or “x” can not be used as a variable name as they are aliases to next command and examine
command respectively. Instead use variable names like number_of_procs or my_var or x1 which don’t conflict
with KWDB command names.
Usage:
variables [ flags ]
Flags:
Column headings are normally suppressed when output is sent to a non-interactive
destination (like a file or pipe). This option forces headers to be printed regardless of the
destination.
-h
Example: Produce a list of the defined variables.
q4> a1 = 1
01
1
0x1
q4> b2 = 2
02
2
0x2
q4> c3 = a1 + b2
03
3
0x3
q4> variables
NAME OCTAL DECIMAL
a1
01
1
b2
02
2
c3
03
3
HEX
0x1
0x2
0x3
The decimal, hex, or octal output may be suppressed by setting the KWDB variable q4PrintDecimal,
q4PrintHex, or q4PrintOctal, respectively, to zero. Any one or two (or none) of them may be suppressed.
This command supports output redirection.
Destroying Variables
Delete any variables created using the unset command.
Usage:
unset names
Where names refers to one or more variable names that have been previously created separated by space.
158
Chapter 4
Command Reference
Q4 Commands
Any kernel global variable obscured by the creation of a new variable will be accessible again after this
variable has been deleted.
Database Operations
Subset piles that have been loaded from the crash dump using the keep and discard commands.
Usage:
keep expr
discard expr
Where expr is any expression.
Both of these commands look at the current pile and produce a new pile based on the expression. The new pile
becomes current. The original is not changed.
The keep command evaluates expr in the context of each item in the current pile. If expr is true, that item is
kept. If it is false, that item is discarded.
The discard command works the same way except that the logic is reversed.
Example: Find all of the processes in process group 751.
q4> load struct proc from proc_list max nproc next p_global_proc
loaded 10795 struct procs as a linked list (stopped by null pointer)
q4> keep p_pgrp==751
kept 4 of 276 struct proc’s, discarded 272
q4> print p_pgrp p_pid p_ppid
p_pgrp p_pid p_ppid
751
754
751
751
753
751
751
751
1
751
756
751
q4> discard p_ppid != 751
kept 3 of 4 struct proc’s, discarded 1
q4> print p_pgrp p_pid p_ppid
p_pgrp p_pid p_ppid
751
754
751
751
753
751
751
756
751
KWDB support string comparison using == and != with keep and discard commands. It can be used in
simple conditional expressions (expression containing only one condition). Both “char *” and “char []” types
are supported.
Example:
q4> load proc_t from proc_list max 2c next p_factp
loaded 2 struct procs as a linked list (stopped by
max count)
q4> print -H p_comm
“swapper”
“ksh”
q4> keep p_comm == “swapper”
kept 1 of 2 struct proc’s, discarded 1
q4> print -H p_comm
“swapper”
q4> recall 1
Chapter 4
159
Command Reference
Q4 Commands
copied a pile
q4> keep p_comm != “swapper”
kept 1 of 2 struct proc’s, discarded 1
q4> print -H p_comm
“ksh”
Database Operations
Create piles based on data already loaded using the pileon command.
Usage:
pileon [ typename ] from field_name
Where typename is any structure available to KWDB and field_name is a field in the structure of the current
pile. If type name is not specified the type of the field_name will be used.
This command looks at the current pile and produces a new pile based on de referencing the field_name. The
new pile becomes current. The original is not changed.
Before pileon, keep only those structures with a valid reference. KWDB will not skip if reference is zero. If
the references are zero any operation on fields from the pile created by the pileon command may give
memory access error.
Example: Find all processes of sleeping kthreads in a process group 10163.
q4> load kthread_t from kthread_list max nkthread next
kt_global_
loaded 11263 struct kthreads as a linked list (stopped by
null pointer)
q4> keep kt_stat==TSSLEEP
kept 9507 of 11263 struct kthread’s, discarded
q4> keep kt_procp
kept 9507 of 9507 struct kthread’s, discarded 0
q4> pileon proc_t from kt_procp
loaded 9507 proc_ts
q4> keep p_pgrp == 10163
kept 48 of 9507 struct proc’s, discarded 9459
q4> print p_stat p_pgrp p_pid p_ppid p_firstthreadp%llx
p_stat p_pgrp p_pid p_ppid p_firstthreadp
SINUSE 10163
10851
10163
0x52c27040
SINUSE 10163
10858
10163
0x52ff4040
SINUSE 10163
10811
10163
0x5619d040
SINUSE 10163
10832
10163
0x564fc040
SINUSE 10163
10841
10163
0x5673c040
SINUSE 10163
10823
10163
0x55e43040
SINUSE 10163
10839
10163
0x5c448040
SINUSE 10163
10835
10163
0x644d9040
SINUSE 10163
10808
10163
0x57690040
SINUSE 10163
10813
10163
0x57040040
. . . //output truncated here
Including PERL Program Files
This command pulls in a PERL script file making the functions and data defined in it available for use.
Usage:
160
Chapter 4
Command Reference
Q4 Commands
include filename
Where filename is the name of any program file in KWDB’s include path.
See Chapter 7, “KWDB PERL Programming Reference,” for more details.
Running PERL Programs
This command runs any function from the PERL scripts already pulled in via the include command.
Usage:
run function [ arguments ... ]
Where function is the name of any function from the PERL scripts already pulled in and the arguments are
anything wanted to pass to it. Arguments are concatenated together with whitespace separators and passed
to the function as a single PERL string.
See Chapter 7, “KWDB PERL Programming Reference,” for more details.
This command supports output redirection.
Adding Type Information
The adddebug command adds type information from a given object file.
Usage:
adddebug
filename
This command reads type information from the named file. The file must be a relocatable file and should
contain debug information. If the filename doesn’t contain the absolute path, it will be searched for in the
current directory and directories specified by shell PATH.
Example:
$ cat mystruct.c
/* define some struct for demo */
struct foo
{
int i;
long l;
}
$ kwdb -q4 -q /var/adm/crash/crash.0
q4> cat
^foo$
BYTES
FIELDS
SHAPE
NAME
q4> adddebug mystruct-lp64.o
Processing file mystruct-lp64.o
warning: File not processed by pxdb--about to process now.
Procedures: 0
q4> cat ^foo$
BYTES
FIELDS SHAPE
NAME
16
2
q4> fields -c struct foo
struct foo {
int i;
Chapter 4
struct
foo
161
Command Reference
Q4 Commands
long l;
}
q4>
Listing DLKM Modules
The command module lists currently loaded DLKM modules.
Usage:
modules
The modules command prints module ID, name, load path, space, BSS, name of dependent modules, and if
the module is processed for debugging or not for every loaded DLKM module.
Example:
$ kwdb -q4
-q .
q4> modules
Module
Module
Module
Module
Module
Module
Module
Name:
iscsi
Id:
4
Load Path: /stand/dlkm/mod.d/iscsi
Space:
0xd3b000
BSS:
0x0
Processed: no
loaded dependent(s): ssii is
Module
Module
Module
Module
Module
Module
Module
Name:
ssii
Id:
3
Load Path: /stand/dlkm/mod.d/ssii
Space:
0xd23000
BSS:
0xccf000
Processed: no
loaded dependent(s): is
Module
Module
Module
Module
Module
Module
Name:
Id:
Load Path:
Space:
BSS:
Processed:
is
2
/stand/dlkm/mod.d/is
0xcc9000
0xcce000
no
This crash dump consists of 3 modules is, ssii and iscsi with dependencies among them.
Processing DLKM Modules
The command addmodule processes DLKM modules for debugging.
Usage:
addmodule module
162
Chapter 4
Command Reference
Q4 Commands
Where module is the name of the module. If the crash dump or the live system (using devmem target) has
loaded DLKM modules, they can be selectively processed for debugging by using this command. If the given
module is dependent on other modules, those modules will be processed first and then the given module will
be processed. KWDB can be invoked with the -m option for processing all the loaded modules. For more details
on how to process DLKM modules on a remote live system see the “Debugging DLKMs” section.
The same example discussed in the previous section is continued here. Look for a symbol iscsi_wrapper.
Example:
q4> sym iscsi_wrapper
OCTAL
DECIMAL
HEX
DIST TYPE
NAME
There is no symbol by the name iscsi_wrapper. Add the module iscsi.
q4> addmodule iscsi
Processing DLKM module is
warning: File not processed by pxdb--about to process now.
.
Procedures: 9
Processing DLKM module ssii
warning: File not processed by pxdb--about to process now.
..
Procedures: 32
Processing DLKM module iscsi
warning: File not processed by pxdb--about to process now.
.
Procedures: 11
The module iscsi depends on is and ssii so they are also processed before iscsi.
q4> sym iscsi_wrapper
OCTAL
063154110
DECIMAL
HEX
13424712 0xccd848
DIST TYPE
48
OBJT
NAME
iscsi_wrapper
The symbol iscsi_wrapper is listed and has come from the module iscsi. List the modules once again.
q4> modules
Module
Module
Module
Module
Module
Module
Module
Name:
iscsi
Id:
4
Load Path: /stand/dlkm/mod.d/iscsi
Space:
0xd3b000
BSS:
0x0
Processed: yes
loaded dependent(s): ssii is
Module
Module
Module
Module
Module
Module
Module
Name:
ssii
Id:
3
Load Path: /stand/dlkm/mod.d/ssii
Space:
0xd23000
BSS:
0xccf000
Processed: yes
loaded dependent(s): is
Module Name:
is
Module Id:
2
Module Load Path: /stand/dlkm/mod.d/is
Chapter 4
163
Command Reference
Q4 Commands
Module Space:
0xcc9000
Module BSS:
0xcce000
Module Processed: yes
All three modules are listed as processed.
If a module doesn’t contain type information, while processing that module KWDB will display the message
no debugging symbols found in DLKM module, as shown in the following example. It will still be able to do
symbolic debugging.
$ kwdb -q4 -q ./crash.0 -m
Processing DLKM module sdsp
(no debugging symbols found in DLKM
Processing DLKM module udpio
(no debugging symbols found in DLKM
Processing DLKM module sonet_proxy
(no debugging symbols found in DLKM
Processing DLKM module sdsp_imaexp
(no debugging symbols found in DLKM
Processing DLKM module sdsp_imacomp
(no debugging symbols found in DLKM
Processing DLKM module sdsp_muexp
Event selected is 0. It was a TOC
#0 0x95b318 in proxy_ctrl_func ()
q4>
module)...
module)...
module)...
module)...
module)...
The show envvars Command
In 11.31, kwdb supports the show envvars command, which lists the value of environment variables and
their values supported by kwdb.The following are the environment variables listed by the show envvars
command :KWDB_TEXT_START This environment variable is used to override
__text_start address. This is particularly
useful when user wants to start kwdb on a
corrupted vmunix/dump.
KWDB_DATA_START This environment variable is used to override
__text_data address. This is particularly
useful when user wants to start kwdb on a
corrupted vmunix/dump.
PXDB
This environment variable can be set to the
path of pxdb on the current machine.
KWDB_CONFIG_FILE This environment variable can be set to the
path of the kwdb configuration file name for
lantron and console targets. Default value
is /etc/opt/kwdb/kwdb.conf
P4_SITE
This environment variable can be set to
specify the path where the kwdb shared
libraries are present. Default value is
/usr/contrib/kwdb/lib.
KWDB_CHECK_PTE_CHAIN This environment variable should be set to
detect chains in the PTE traversal. The
value can range between 10 to 10000.
164
Chapter 4
Command Reference
Q4 Commands
LIBCRASH_ENABLE_CACHE This environment variable is set to 1 in order
to enable caching inside the libcrash for
better performance during crash dump
debugging. Default value is 1.
KWDBCR_PATH
The path of the kwdbcr can be set by this
variable. Default path is
/usr/contrib/kwdb/bin/kwdbcr.
KWDBCR_LOGPATH The path where log files generated by kwdbcr
should be stored is set in this variable.
Default value is /var/opt/kwdb/kwdbcr.log.
DYNFILE
This environment variable is set to the path
where a pre-processed kernel module should
be saved while processing DLKM's.
KWDB_SUPPORTS_LARGE_DUMP This environment variable can be set to 1 to
configure kwdb for reading large crash dump.
When this variable is set kwdb uses larger
memory cache.
Q4_STARTUP_SCRIPT The path of the q4 startup script can be
specified by this variable.
Default value is $HOME/.q4rc.pl
Q4_PERL_PATH
The path of the perl installed on the machine
can be set by this environment variable.
Default value is /opt/perl/bin/perl.
q4Disassembler The environment variable is set to the path of
the disassembler which is used by getasm
command to obtain the assembly level code.
Chapter 4
165
Command Reference
Q4 Commands
166
Chapter 4
5 Analyzing Crash Dumps
This chapter shows the reader how to use KWDB to analyze a crash dump.
Chapter 5
167
Analyzing Crash Dumps
What Kind of Dump is This?
What Kind of Dump is This?
There are basically only two different kinds of Crash Dumps, those where the system crashed, and those
where the system hung.
Crash type dumps are usually caused by kernel panics or High Priority Machine Checks (HPMC). Hang
type dumps are usually caused by a user initiated Transfer of Control (TOC) of an unresponsive system.
First thing to do is to determine what release of the system and what kind of machine. After that, check to see
what kind of dump it is.
What release and what kind of machine was it?
$ kwdb -q4
/var/adm/crash/crash.6
KWDB is free software and you are welcome to distribute copies of it under certain
conditions; type “show” copying to see the conditions.
There is absolutely no warranty for KWDB; type “show warranty” for details.
Hewlett-Packard KWDB 2.0.1 12-Jun-2002 10:00 (based on GDB 4.16)
(built for PA-RISC 2.0 (wide), HP-UX 11.00)
Copyright 1996, 1997 Free Software Foundation, Inc...
crash dump information:
hostname hpfcs322
model
9000/800/L2000-44
panic
Data memory protection fault
release
@(#)B2352B/9245XB HP-UX (B.11.00) #1:
Wed Nov 5 22:38:19 PST 1997
dumptime 964463280 Mon Jul 24 11:28:00 PDT 2000
savetime 964463811 Mon Jul 24 11:36:51 PDT 2000
Event selected is 0. It was a panic
#0 0x2d76a4 in panic ()
q4> load struct utsname from &utsname
loaded 1 utsname as an array (stopped by max count)
q4> print -t
indexof 0
mapped 1
spaceof 0
addrof 6983512
physaddrof 6983512
realMode 0
sysname “HP-UX”
nodename “hpfcs322”
release “B.11.00”
version “A”
machine “9000/800”
__idnumber “138901557”
q4>
The address of utsname is used because it’s declared as a structure in the kernel, not a pointer to a structure.
For pointers to structures leave off the & symbol before the variable name.
From the previous message, it was learned that the system is an S800 A-class server running HP-UX 11.0.
The next question is “was there a panic message?”
168
Chapter 5
Analyzing Crash Dumps
What Kind of Dump is This?
q4> examine panicstr using s
Data memory protection fault
Since there was a panic message, this was a crash, apply the crash debugging techniques.
If this was a hang (which the user TOC’d), the previous command output will look more like this:
q4> examine panicstr using s
TOC, pcsq.pcoq = 7f8a.a4df, isr.ior = 5411.40006a50
********************************************************
assertion failed (spinlock: failed I-bit checks) at line
683 in /ux/core/kern/pa/sync/spinlock.c
********************************************************
Another more direct way to check is to ask for a stack trace of the first crash event. Q4 prints the crash type
before the trace and this will tell if it was a panic or HPMC (suggesting a crash), or a TOC (suggesting a
hang).
Chapter 5
169
Analyzing Crash Dumps
Crashes
Crashes
Assume the system panicked, at this point a stack trace of the panic is wanted. For that, consult the crash
event table. This is a static table in low memory that records each crash event in the order they occur. Look at
the first crash event. (That’s the one that caused the dump in the first place.)
q4> trace event 0
Event selected is 0. It was a panic
#0 0x6a654 in panic+0x6c ()
#1 0xcb374 in report_trap_or_int_and_panic+0x94 ()
#2 0xccaf0 in trap+0x11f0 ()
#3 0x9d6e0 in kgdb_pre_trap+0xa8 ()
#4 0xe49ec in $call_trap+0x2c ()
#5 0x3d3738 in rtprio+0x30 ()
at /ux/core/kern/common/pm/sched/pm_rtsched.c:1048
#6 0x439f28 in syscall+0x790 ()
#7 0x33a1c in $syscallrtn+0x0 ()
A process was in the system call rtprio when it got the data segmentation fault we saw in the panic string. It
panicked there because of the deliberate de-referencing of a null pointer to get this dump,
When one processor panics it tells all of the other processors to TOC. Each of these TOCs generates another
crash event. See them all.
q4> load crash_event_t from &crash_event_table until
crash_event_ptr max 100
loaded 5 crash_event_t’s as an array (stopped by “until”
clause)
q4> print cet_hpa %#x cet_event
cet_hpa cet_event
0xfffa4000
1
0xfffa4000
1
0xfffa0000
2
0xfffa6000
2
0xfffa2000
2
There are five crash events, but four are unique Hard Physical Addresses (HPAs). Be aware that on IPF
the field cet_handle has to be used instead of cet_hps. That suggests there were only four processors.
q4> runningprocs
04
4
0x4
That’s consistent. Since there are more crash events than processors, one of the processors must have gotten
into even more trouble. Look at the second crash event.
q4> trace event 1
Event selected is 1. It was a panic
#0 0x6a654 in panic+0x6c ()
#1 0x6aab4 in assfail+0x3c ()
#2 0x6ac6c in _assfail+0x2c ()
#3 0x3697ac in psema+0x12c ()
#4 0x369a38 in pxsema+0xa8 ()
#5 0x4c4fd4 in ufs_sync+0x5c ()
#6 0x2136c4 in update+0x74 ()
170
Chapter 5
Analyzing Crash Dumps
Crashes
#7
#8
#9
#10
#11
#12
#13
#14
0x6c074 in panic_boot+0x15c ()
0x6b220 in boot+0x320 ()
0x6a73c in panic+0x154 ()
0xcb374 in report_trap_or_int_and_panic+0x94 ()
0xccaf0 in trap+0x11f0 ()
0x9d6e0 in kgdb_pre_trap+0xa8 ()
0xe49ec in $call_trap+0x2c ()
0x3d3738 in rtprio+0x30 ()
at /ux/core/kern/common/pm/sched/pm_rtsched.c:1048
#15 0x439f28 in syscall+0x790 ()
#16 0x33a1c in $syscallrtn+0x0 ()
The bottom of this trace looks like the first trace. It probably means the panicking processor suffered a
recursive panic. Thinking back on the list of crash events received earlier, this makes sense. The first two
crash event’s were associated with the same processor and were both of type CT_PANIC (1). The others were
associated with the other processors and were of type CT_TOC (2).
Systems with Threads
To check the running threads to see what they’re doing on an 11.0 dump:
q4> load struct utsname from &utsname
loaded 1 utsname as an array (stopped by max count)
q4> print -t
indexof 0
mapped
1
spaceof 0
addrof 6983512
physaddrof 6983512
realMode 0
sysname “HP-UX”
nodename “hpfcs322”
release “B.11.00”
version “A”
machine “9000/800”
__idnumber “138901557”
q4>
In 11.0 an array of kthread structures pointed at by kthread contains the memory resident portion of the
thread status: so to look at threads we look at the kthread data. Let’s load it from the dump.
q4> load kthread_t from kthread max nkthread
loaded 499 struct kthreads as an array (stopped by max count)
After 11.10 this load command is performed this way:
q4> load kthread_t from kthread_list max nkthread next kt_factp
loaded 54 struct kthreads as a linked list (stopped by null pointer)
But out of all of those, only the running threads are wanted, so in both cases discard the others.
q4> keep kt_cntxt_flags & TSRUNPROC
kept 1 of 54 struct kthread’s, discarded 53
Chapter 5
171
Analyzing Crash Dumps
Crashes
Now down to 1 thread! Dump the kernel stack for this thread only:
q4> trace pile
process was running on processor 0
processor 0 was running process at 0x4193e040 (pid 319) , thread at 0x42246040 (tid 338)
Event selected is 1. It was a TOC
#0 0xa8d10 in check_panic_loop+0x38 ()
#1 0xa9ec0 in trap+0xcc8 ()
#2 0x7bcd8 in kgdb_pre_trap+0xa8 ()
#3 0xc1a00 in $RDB_trap_patch+0x2c ()
#4 0xc20a0 in splx+0x70 ()
#5 0xc237c in spluser+0x14 ()
#6 0x35b7c4 in syscall+0x86c ()
#7 0x33d64 in $syscallrtn+0x0 ()
Which process was associated with this thread and on what processor was it running? Look at the kt_procp
and the kt_spu fields for this structure.
q4> print -tx kt_stat kt_cntxt_flags kt_flag kt_spu
addrof kt_procp
kt_stat
kt_cntxt_flags
kt_flag
kt_spu
addrof
kt_procp
172
TSRUN
TSSIGABL|TSRUNPROC
TSFIRSTTHREAD
0
0x42246040
0x4193e040
Chapter 5
Analyzing Crash Dumps
Hangs
Hangs
The following procedure describes how to analyze a crash dump caused by a system hang. A summary of steps
follows:
•
“Check Status of System”
•
“Analyze Run Queues”
•
“Analyze Threads”
•
“Check Key System Daemons”
•
“Determine if Memory is Low”
•
“What to Do if System Does Not Look Hung”
Each of these procedures is explained in detail following. Throughout the sections, the sample output was not
always generated from the same core dump.
Check Status of System
1. How many processors are on this system?
q4> runningprocs
4
2. Check the state of the processors. Are they busily running threads or are they idle?
q4> load mpinfo_t from mpproc_info max nmpinfo
loaded 4 mpinfo_t’s as an array (stopped by max
count)
NOTE
The previous command has to be replaced with the following two commands on kernel
versions later than 11.11.
q4> load mpinfou_t from &spu_info max nmpinfo
q4> pileon mpinfo_t from pikptr
q4> call it mpinfo
so named
q4> print indexof addrof
indexof
addrof
0
0x129b000
0x1
0x129e2c8
0x2
0x12a1590
0x3
0x12a4858
threadp curstate
threadp
curstate
0x2ed80b0
SPUSTATE_SYSTEM
0x2e98498
SPUSTATE_SYSTEM
0xffffffff
SPUSTATE_IDLE
0x2eca1f0
SPUSTATE_SYSTEM
As shown in the preceding example, there are four processors on this system. All of them are busy except
for processor two, which is idle. threadp indicates the kthread address for the currently executing thread
on a running processor.
Chapter 5
173
Analyzing Crash Dumps
Hangs
3. Determine the load average for each of the processors.
q4> exam &mp_avenrun for nmpinfo using 3F
22.172
25.523
28.152
34.753
35.934
32.481
0.5532
0.5726
0.569
36.513
37.616
32.497
The preceding example shows the load average of executable processes on each processor in the last 1, 5,
and 15 minutes. It is ordered by processor number. This looks like a fairly busy system, with the exception
of processor two which is idle. Idle processors typically show load averages of less than 1.
4. Determine if any spinlocks are held.
q4> print
indexof
0
0x1
0x2
0x3
indexof addrof held_spinlock spinlock_depth
addrof
held_spinlock spinlock_depth
0x129b000
0
0
0x129e2c8
0x129a4c0
0x1
0x12a1590
0
0
0x12a4858
0
0
Processor 1 is holding a spinlock at address 0x129a4c0. Since its spinlock_depth is 1, it is the only
spinlock it is holding.
Note that held_spinlock is only good on debug kernels.
5. Get information about this spinlock.
q4> load lock_t from 0x129a4c0
loaded 1 lock_t as an array (stopped by max count)
q4> print -x sl_owner sl_lock_caller sl_unlock_caller
sl_owner
sl_lock_caller
sl_unlock_caller
0x129e2c8
0x43bd1c
0x43c8e8
In the previous examples sl_owner is the mpinfo_t struct address of the processor owning the spinlock.
Note that it’s the address for processor one’s mpinfo_t (0x129e2c8).
The sl_lock_caller and sl_unlock_caller are the last locker and unlocker’s return pointer. (On a
non-debug kernel, it will only have sl_owner.)
6. Identify the lock caller and unlock caller.
q4> exam sl_lock_caller using a
migrate_swap+0x2c
q4> exam sl_unlock_caller using a
steal_swap+0x3b8
7. Determine if the spu(s) are enabled.
q4> recall mpinfo
copied 4 items
q4> print indexof spu_state
indexof
0
0x1
174
spu_state
0x1
0x1
Chapter 5
Analyzing Crash Dumps
Hangs
0x2
0x3
0x1
0x1
The spu_state(s) are defined as follows: 1 is SPU_ENABLED, 2 is SPU_DISABLED (Most of the time users
don’t disable their processors, but check just in case.)
8. Get more details on activity, such as ticks since last idle, and ticks since resumed non-real-time thread.
q4> print indexof last_idletime last_tsharetime
indexof last_idletime
last_tsharetime
0
0x158a64
0x15ac3e
0x1
0x15a590
0x15ac3e
0x2
0x153eaf
0x15ac3e
0x3
0x15a8a4
0x15ac3e
Compare the preceding numbers with lbolt (also known as ticks_since_boot), the time in ticks when
the system was brought down:
q4> lbolt
05326102 1420354 0x15ac42
As previously shown, processor 0 was last idle at time 0x158a64, which is calculated as follows:
0x15ac42 - 0x158a64 = 8670 ticks ago
8670 ticks / 100 ticks/sec = 86.7 secs ago
So processor 0 was last idle 86.7 seconds ago.
A low last_idletime (relative to lbolt) would indicate a very busy system, since it means it hasn’t been
idle for a long time. A low last_tsharetime (relative to lbolt) means that real-time threads have been
using that processor for a long time, possibly starving timeshare threads.
Analyze Run Queues
This section discusses the steps to examine run queues. In examining the run queues, look for anomalies that
might cause a thread to never be found and scheduled to run. For example:
•
Fair and even distribution of threads across processors. Stapled threads and gang scheduled threads can
distort this distribution (more on this later).
•
Any corruption in run queue links.
•
Reasonable bestq values. the besqvalue should be set to where next to be looking for threads.
1. Check the run queues to see how full they are.
q4> recall mpinfo
copied 4 items
q4> print mp_rq.nready_free mp_rq.nready_locked
mp_rq.nready_free mp_rq.nready_locked
12
0
9
0
13
1
25
1
Chapter 5
175
Analyzing Crash Dumps
Hangs
length of run queue = mp_rq.nready_free + mp_rq.nready_locked
NOTE
The mp_rq.nready_free is the count of threads in the run queue (for that processor) that can be moved.
In contrast, mp_rq.nready_locked is the count of threads that are “stapled” to that processor and can not
be moved to another one.
Also have mp_rq.nready_free_alpha and mp_rq.nready_locked_alpha, which are similar except that
these threads require an alpha semaphore before they can run. They are not under first consideration
when selecting threads to run. Since alpha semaphores are being phased out, these should be less
frequently used.
2. Examine the per-processor run queues.
Threads with scheduling policies including SCHED_HPUX(2), which is timeshare threads, and
SCHED_RTPRIO (6), which is real-time threads, appear in the pre-processor run queues. It’s best to redirect
this due to the amount of output:
q4> print -t | grep mp_rq > mprq.out
The mp_rq.bestq is the next runq to be examined:
mp_rq.bestq 141
Each run queue corresponds to a priority. The lower the priority, the lower the run queue index, and the
sooner a chance to run. Zero through 127 correspond to real-time run queues. For non-real-time priorities,
there is a range of four priorities mapped to each run queue.
If the run queue is empty, it points back to itself:
mp_rq.qs[8].th_link 19511872
mp_rq.qs[8].th_rlink 19511872
Otherwise, it points to a kthread entry, as in this run queue for mp_rq.bestq:
mp_rq.qs[141].th_link 49515336
mp_rq.qs[141].th_rlink 49782960
The threads are doubly linked through kt_link and kt_rlink. So 49515336’s kt_link will point to the
next thread in run queue 141. The last thread in this run queue is 49782960 (th_rlink).
3. Check out the POSIX real-time run queues, used for SCHED_FIFO (0), SCHED_RR (1), and SCHED_RR2 (5).
These are global run queues, used by all processors for POSIX real-time scheduling policy threads:
q4> load rtsched_info_t from &rtsched_info
loaded 1 rtsched_info_t as an array (stopped by max
count)
q4> print rts_nready rts_bestq rts_qp rts_numpri
rts_nready
1
rts_bestq
0
rts_qp
rts_numpri
1073811456
32
As previously shown, rts_nready is 1, so there is only one thread ready to run. There are 32 priority
levels, which correspond to 32 run queues. The next queue to be searched (which happens to be the only
non-empty one here) is queue 0.
176
Chapter 5
Analyzing Crash Dumps
Hangs
q4> load struct mp_threadhd from rts_qp max rts_numpri
loaded 32 struct mp_threadhd’s as an array
(stopped by max count)
q4> print -t
indexof
0
mapped
1
spaceof
0
addrof
1073811456
physaddrof
83955712
realmode
0
th_link
42081416
th_rlink
42081416
/* output truncated ...*/
Interested in the first entry only, since it’s the only non-empty run queue. th_link and th_rlink are the
forward and backward pointers to kthread entries, just like in the mpinfo_t run queues. The one and
only thread in the rtsched run queues is 42081416. Look at that thread’s kt_link, it will be 1073811456
(the mp_threadhd).
Analyze Threads
This section deals with analyzing the threads themselves, both on and off the run queue.
1. Load up the thread entries.
q4> load kthread_t from kthread max nkthread
loaded 32767 kthread_t’s as an array
(stopped by max count)
NOTE
The previous command has to be replaced with the following command on kernel versions
HP-UX 11.11 and later.
q4> load kthread_t from kthread_list max nkthread next kt_factp
q4> keep kt_stat
kept 1991 of 32767 kthread_t’s, discarded 30776
q4> call it kinuse
so named
2. Next, separate the threads into piles depending on state. (Note that pile names can be anything, as long
as they are unique
q4> recall kinuse
copied 1991 items
q4> keep kt_stat == TSRUN
kept 75 of 1991 kthread_t’s, discarded 1916
q4> call it krun
so named
Chapter 5
177
Analyzing Crash Dumps
Hangs
The preceding example shows the number of threads that are either currently running or are waiting in
the run queue to be scheduled to run. The executing threads are distinguished by the TSRUNPROC flag in
kt_cntxt_flags.
Zero or very few TSRUN threads would tend to indicate a hung system, unless the system is idle. Recall
that an idle system would be evidenced by SPUSTATE_IDLE in most or all processors’ mpinfo_t.curstate.
q4> recall kinuse
copied 1991 items
q4> keep kt_stat == TSSLEEP
kept 1825 of 1991 kthread_t’s, discarded 166
q4> call it ksleep
so named
The previous example shows the number of threads that are sleeping, waiting for an event. They will not
be on the run queue until they get a wakeup. Excessive numbers of sleeping threads (significantly more
than half) may point to a hung system, unless it is idle.
q4> recall kinuse
copied 1991 items
q4> keep kt_stat == TSZOMB
kept 87 of 1991 kthread_t’s, discarded 1904
q4> call it kzomb
so named
The previous example shows the count of threads in exit(), waiting to be reaped by their parents. The
parent must call wait() or waitpid() to clean up these zombies. If this is not happening, examine the
stack trace of the parent processes to see what they are doing. An example will be given later.
q4> recall kinuse
copied 1991 items
q4> keep kt_stat == TSSTOP
kept 2 of 1991 kthread_t’s, discarded 1989
q4> call it kstop
so named
The previous example shows the number of threads in a stopped state, as a result of job control stop,
terminal control, or being traced. Stopped threads are not covered in detail in this discussion since they
are usually only responsible for process hangs, not system hangs. A system hang is possible if a stopped
thread holds a critical system resource, but this is rarely the case.
3. Determine how many threads have run in the last second.
q4> recall kinuse
copied 1991 items
q4> keep kt_lastrun_time > lbolt-hz
kept 127 of 1991 kthread_t’s, discarded 1864
If this many threads have run in the last second, this system can’t be completely hung. Investigate other
issues.
4. Determine if the currently running threads have been sitting on the processors for a long time.
q4> recall krun
/* Retrieve the pile of running and runnable
threads */
copied 75 items
q4> keep kt_cntxt_flags & TSRUNPROC
178
Chapter 5
Analyzing Crash Dumps
Hangs
/* Extract the running threads only */
kept 8 of 75 kthread_t(s), discarded 71
q4> print kt_spu kt_lastrun_time
/* kt_spu is the processor the thread is
executing on */
/* kt_lastrun_time is the time that thread was
dispatched
on the processor */
kt_spu
kt_lastrun_time
4
1325274
3
1162296
5
1325265
7
1325191
0
1325256
2
1325274
6
1325196
1
1325246
q4> lbolt
05034333 1325275 0x1438db
Compare kt_lastrun_time of the running threads against lbolt. Normally, the running threads should
only be 10 or less ticks than lbolt. Look for a value that’s unusually low, like the one for kt_spu 3.
q4> keep kt_spu == 3
kept 1 0f 8 k_thread_t(s), discarded 7
To get an exact idea of how long this thread has been monopolizing processor three, use the previously
used method from comparing lbolt to kt_lastrun_time.
q4> lbolt - kt_lastrun_time
0476243 162979 0x27ca3
q4> 162979/100/60
033
27
0x1b
Twenty-seven minutes is definitely too long to be running on a processor without getting switched out.
Trace processor three to find out what it’s spending all its time in:
q4> trace processor 3
processor 3 was running process at 0x0’2ea78cc0
(pid 2438),
thread at 0x0’309c0 7f8 (tid 2884)
stack trace for event 5
crash event was a TOC
vmtrace_mlog+0xec
vmtrace_kfree+0x44c
kfree_common+0x2ac
freeb+0x114
freemsg+0x18
ar_rput+0x4ac
csq_turnover_with_lock+0xa4
putnext+0x2ac
/* output truncated */
Chapter 5
179
Analyzing Crash Dumps
Hangs
Investigate vmtrace_mlog() after seeing this.
5. Determine if there are an unusually high number of TSSLEEP threads. If so, check to see if there are
clusters of threads waiting on a common kt_wchan.
q4> recall ksleep
/* Retrieve the pile of sleeping threads */
copied 1825 items
The kt_wchan is a “wait channel”, a data or code address that a thread is waiting on. It must receive a
wakeup at this same address to transition from TSSLEEP to TSRUN. Look for many threads with a common
kt_wchan value as a possible cause of a hang.
q4> print addrof kt_lastrun_time kt_wchan |
sort -k 3n,3
| uniq -c -f2 | grep -v “^
1” |
sort
/* output truncated at
36 1532300480 3743634
63 1532671136 1538875
94 1532735288 2642062
162 1532375000 1743925
221 1532301128 3743835
232 1532816288 1730533
258 1532338064 1662340
top */
0
5125154408
5088965224
5405857896
4611690416473833472
4967505000
5089268584
The first column is the number of threads with this kt_wchan as a common value.
The second column is the address of the first thread in the sorted file ktwchan which has this kt_wchan
value.
The third column is the kt_lastrun_time of this thread.
The fourth column is the common kt_wchan value.
Trace the threads which are in big piles. Threads with the same kt_wchan may or may not have the same
stack trace, but they will be executing in the same subsystem. Look at the stack trace to find the identity
of the first parm to sleep(), which becomes kt_wchan. Examine the code further and figure out who is
responsible for the corresponding wakeup() of this sleep(). Determine why that thread is not doing the
wakeup().
Taking the first thread in the pile of 258 threads waiting on kt_wchan 5089268584:
q4> trace thread at 1532338064
Stack trace for process “syncer” at 0x235d1c80 (pid 912)
Thread at 0x5b559f90 (tid 969)
process was not running on any processor
#0 0x18db1c in _sleep_one+0x21c ()
#1 0x1533ec in vx_sleep_lock+0xcc ()
#2 0x12f774 in vx_lockmap+0x14 ()
#3 0xbadcc in vx_getsmap+0x44 ()
#4 0xd5954 in vx_esum_unexpand+0x74 ()
#5 0xf10e0 in vx_sumpushfs+0xc8 ()
#6 0x10090c in vx_fsetupdate+0x5c ()
#7 0x2216b8 in vx_sync1+0x78 ()
#8 0x261118 in vx_sync0+0x18 ()
#9 0x1361f0 in vx_walk_aglist+0xa8 ()
#10 0x96f00 in vx_sync+0x50 ()
180
Chapter 5
Analyzing Crash Dumps
Hangs
#11
#12
#13
#14
0x283dc8 in update+0x48 ()
0x283cd0 in tsync+0x40 ()
0x1687e8 in syscall+0x480 ()
0x34c94 in syscallinit+0x54c ()
In this case look at vx_sleep_lock() for clues to the sleep channel, since it is passed through to
sleep_one().
6. Look for trends in scheduling threads.
Sort all threads by kt_lastrun_time, listing state, schedpolicy, and spu as shown in the following
example. This gives a chronological history of when threads last ran.
q4> recall kinuse
copied 116 items
q4> print addrof kt_lastrun_time kt_stat kt_schedpolicy
kt_spu | sort -k 2n,2
addrof
kt_lastrun_time
17011136
17016960
17022336
16993216
17017856
17018304
17018752
17022784
2163533
2163536
2163536
2163540
2163541
2163541
2163541
2163541
kt_stat
kt_schedpolicy
kt_spu
TSRUN
TSRUN
TSRUN
TSSLEEP
TSRUN
TSRUN
TSRUN
TSRUN
2
2
2
0
2
2
2
2
0
1
0
3
3
2
2
3
Note that lbolt = 2163541 in this dump.
This is what is expected as a “normal” scheduling trend. Many threads have run with kt_lastrun_time
close to lbolt. They are using all available processors (0 through 3 in this case). They are not exclusively
real-time threads (Recall that 2 is SCHED_HPUX).
If all the recently run threads have kt_schedpolicy = 6, real-time threads are hogging the system. This
is corroborated by a low mpinfo_t.last_tsharetime, relative to lbolt.
Sort threads by kt_spu, then by kt_lastrun_time.
q4> print addrof kt_lastrun_time kt_spu | sort -k
3n,3 -k 2n,2
(The output in the previous example has been skipped due to the large number of lines required to detect
trends.) These are some issues to watch for:
•
Are all the spu(s) getting scheduled equally? Make sure there are no spu(s) out of commission.
•
Look at the sorted kt_lastrun_times, and see if there are gaps in time.
•
Look for a trend of high and evenly distributed activity until a certain transition point, after which
only a few selected threads run, or only certain processors get scheduled. If so, look at stack traces of
threads which ran near the time of that transition point to find any suspicious activity. Possibilities
could be real-time threads hogging the processor, a thread that won’t switch off the processor, or a
critical resource being held by a thread (running or sleeping).
•
If there are large numbers of TSRUN threads but scheduling looks unevenly balanced, look for
“stapled” threads as an explanation. These are threads which request to run on a certain spu through
processor affinity.
Chapter 5
181
Analyzing Crash Dumps
Hangs
7. Determine the binding policy of the thread.
q4> recall krun
copied 954 items
q4> keep kt_spu_mandatory != 4
/* Discard all threads which are free to run on any spu */
kept 23 of 954 kthread_t’s, discarded 931
q4> print addrof kt_lastrun_time kt_spu kt_spu_mandatory
kt_cntxt_flags
addrof kt_lastrun_time kt_spu kt_spu_mandatory kt_cntxt_flags
815387520
1318096
1
1
TSSIGABL
815388816
1162113
9
1
TSSIGABL
815390112
1174835
11
1
TSSIGABL
815390760
1318470
12
1
TSSIGABL
815495736
1163162
4
0
0
815496384
1161873
9
0
0
815509992
1161757
10
0
0
815516472
1162711
6
0
0
815524248
1163602
9
0
0
815526192
1161612
10
0
0
815532024
1162296
10
0
TSRUNPROC
The kt_spu_mandatory is the binding policy for the thread. Some possible values are MPC_ADVISORY (0),
MPC_MANDATORY (1), and MPC_NONE (4). The first two indicate that the thread should, and the thread
must, respectively, run on processor kt_spu.
8. If certain threads don’t seem to be getting dispatched even though they are at the top of the run queue,
look for gang scheduling.
Gang scheduling allows multiple threads from a single process or set of processes to be scheduled together
as a gang. Threads are “stapled” to processors for scheduling, and they will not execute until all members
in the gang are ready (i.e., they are executable, and the processors are available).
A difficulty may arise in scheduling if the number of members in the gang is equal to the number of
processors on the system.
To determine if the threads on the system are using gang scheduling:
q4> recall kinuse
copied 1991 items
q4> keep kt_gang != 0
kept 19 of 1991 kthread_t’s, discarded 1972
Common kt_gang values denote threads in the same gang.
9. Are there an excessive number of zombie threads?
Zombie threads are not by themselves cause for a hang. They may be an indication of hangs on their
parents’ part, who are responsible for cleaning them up. But zombies definitely take up proc table slots,
so check to see that their number is not a significant percentage of nproc.
q4> nproc
047064 20020 0x4e34
q4> recall kzomb
copied 87 items
In the preceding case, zombies are clearly not a significant percentage of nproc.
182
Chapter 5
Analyzing Crash Dumps
Hangs
Look to see how long these zombies have been in limbo, and who their parents are. The latter can be a
rather cumbersome process.
q4> print addrof kt_lastrun_time kt_procp | sort -k 3n,3
/* output shortened */
addrof
1542870008
1542931568
1543737032
1541375720
1535316272
1537698320
1543604840
kt_lastrun_time
kt_procp
1608371
1608368
1608350
1651309
1621428
1621378
1621431
1523048128
1523048128
1523048128
1523216768
1523402816
1523402816
1523402816
Notice that lbolt = 3743917 in this dump.
With this select group of zombies, kt_lastrun_time’s are relatively old. Determine what their parents
are doing. kt_procp is a thread’s proc pointer. To make it easier, pick threads with a common kt_procp
such as “1523402816” and load that parent’s proc entry.
q4> load proc_t from 1523402816
/* load up thread’s proc entry */
loaded 1 proc_t as an array (stopped by max count)
q4> load proc_t from p_pptr
/* load up parent’s proc entry */
loaded 1 proc_t as an array (stopped by max count)
q4> trace pile
...
The parent’s stack trace should give an indication of why it is failing to reap the zombies. If repeated, this
search for a parent with another thread’s kt_procp, will frequently find that the parent is the same.
If the parent turns out to be init (pid = 1), the original parent has terminated and given the zombies to
init. The init does not clean up these adopted zombies. They will stay around and take up proc and
kthread table slots, unless terminated with a kill(). The premature termination of the parent process
should be investigated.
An easier but (less complete) method to find zombies is to use zombie processes instead:
q4> load proc_t from proc max nproc
loaded 20020 proc_t’s as an array (stopped by max
count)
NOTE
The previous command has to be replaced with the following command on kernel versions
HP-UX 11.11 and later.
q4> load struct proc from proc list max nproc next p_factp
Chapter 5
183
Analyzing Crash Dumps
Hangs
q4> keep p_stat == SZOMB
kept 29 of 20020 proc_t’s, discarded 19991
q4> print p_pptr | sort
1510756992
1510756992
1510756992
1510859264
1510975680
1510975680
...
Using the parent proc pointer (pptr) allows us to identify common parents among processes. Investigate
these parents to see why they are not reaping their zombie children. Keep in mind that this is a less
complete method than scanning for zombie threads. This is because all threads in a process must be
zombie threads before the process becomes a zombie process.
10. Determine if any of the threads need semaphores or are holding them.
With alpha semaphores being phased out, these fields are less likely to be in use. Both alpha and beta
semaphores use these fields, but not at the same time for a given thread. The definitions are:
•
kt_sleep_sema — alpha or beta semaphore thread is blocked on.
•
kt_needs_sema — on a runq waiting for this alpha semaphore.
•
kt_sema — I’ve got this alpha or beta semaphore.
q4> recall kinuse
copied 1991 items
q4> print addrof kt_sleep_sema kt_needs_sema kt_sema
addrof
kt_sleep_sema
kt_needs_sema
kt_sema
1532332880
1532333528
1532334176
1532334824
1532335472
532336120
1532336768
1532337416
1532338064
...
142923832
142923832
140034936
140034936
0
0
0
0
0
0
0
0
0
0
0
0
0
0
0
0
0
0
0
0
0
0
0
To identify the semaphore:
q4> exam 142923832 using a
streams_mp_sync
A large number of sleeping threads on streams_mp_sync is a normal scenario. streams_blk_sync
usually has two sleepers, and runout has one. Any others should be treated as an exception.
184
Chapter 5
Analyzing Crash Dumps
Hangs
Check Key System Daemons
q4> load kthread_t from kthread_list max nkthread next
kt_factp loaded 54 struct kthreads as a linked list
(stopped by null pointer)
q4> keep kt_kt_stat
kept 54 of 54 struct kthread’s, discarded 0
q4> keep kt_tid < 10
/* tid assignments to daemons can change, assume
less than 10*/
kept 7 of 54 struct kthread’s, discarded 47
q4> trace pile
Stack trace for process “swapper” at 0xb08b00 (pid 0)
Thread at 0xb087c0 (tid 0)
#0 0x2caaa0 in _swtch+0x1b8 ()
#1 0x2d22b8 in 1f_6a7b_cl_real_sleep+0x868 ()
#2 0x2c63d4 in _sleep+0x14c ()
#3 0x436ae4 in sched+0xcc ()
#4 0x1e4224 in im_launch_sched+0x54 ()
#5 0x417908 in DoCalllist+0xc0 ()
#6 0x1e2c10 in main+0x28 ()
#7 0xbe22c in $vstart+0x48 ()
#8 0x3a760 in $locore+0x94 ()
Stack trace for process “init” at 0x417f7040 (pid 1)
Thread at 0x417f8040 (tid 1)
#0 0x2caaa0 in _swtch+0x1b8 ()
#1 0x2d1d8c in 1f_6a7b_cl_real_sleep+0x33c ()
#2 0x2c63d4 in _sleep+0x14c ()
#3 0x31e120 in sigsuspend+0x1a0 ()
#4 0x35b554 in syscall+0x5fc ()
#5 0x33d64 in syscallinit+0x554 ()
Stack trace for process “statdaemon” at 0x417e8040 (pid 3)
Thread at 0x417ea040 (tid 3)
#0 0x2caaa0 in _swtch+0x1b8 ()
#1 0x2d22b8 in 1f_6a7b_cl_real_sleep+0x868 ()
#2 0x2c63d4 in _sleep+0x14c ()
#3 0x2b1834 in statdaemon+0xa4 ()
#4 0x1e31cc in im_statdaemon+0xfc ()
#5 0x417908 in DoCalllist+0xc0 ()
#6 0x1e2c10 in main+0x28 ()
#7 0xbe22c in $vstart+0x48 ()
#8 0x3a760 in $locore+0x94 ()
Stack trace for process “vhand” at 0x417e6040 (pid 2)
Thread at 0x417e7040 (tid 2)
#0 0x2caaa0 in _swtch+0x1b8 ()
#1 0x2d22b8 in 1f_6a7b_cl_real_sleep+0x868 ()
#2 0x2c63d4 in _sleep+0x14c ()
#3 0x417bcc in vhand+0x23c ()
#4 0x1e30c0 in im_vhand+0xf8 ()
#5 0x417908 in DoCalllist+0xc0 ()
#6 0x1e2c10 in main+0x28 ()
Chapter 5
185
Analyzing Crash Dumps
Hangs
#7
#8
0xbe22c in $vstart+0x48 ()
0x3a760 in $locore+0x94 ()
Stack traces for swapper (tid 0), init (tid 1), vhand (tid 2), and statdaemon (tid 3) have been
selected from the preceding example. The swapper and vhand are responsible for paging. statdaemon is
responsible for balancing the run queues. init usually doesn’t do much once the system comes up.
q4> print kt_tid kt_lastrun_time
kt_tid
kt_lastrun_time
0
1
2
3
4
8
9
3743634
3743835
3742935
3743834
3743834
11130
11132
Note that lbolt is 3743917.
The key system daemons (tid 0–3) all seem to have run fairly recently. Their stack traces are also typical of
when they are doing their job properly.
Determine if Memory is Low
Memory problems can be detected by:
•
vhand not running recently (described in the previous section)
•
Zero or very low freemem
•
Deactivated threads
The kernel global variable freemem is the amount of free memory in pages. Zero or a very low value may point
to lack of memory resources as a cause for a hang. freemem should be at least the value of minfree, the
threshold at which deactivation starts, and desfree, the threshold where the paging daemon starts stealing
pages.
q4> freemem
03376 1790 0x6fe
q4> minfree
032000 13312 0x3400
q4> desfree
014400 6400 0x1900
If freemem dips below minfree, deactivation of processes is initiated. deactive_cnt is the number of
deactivated processes.
q4> deactive_cnt
0177 127 0x7f
All the threads of a deactivated process are in turn deactivated, and have their kthread_t->kt_flag’s
TSDEACT bit set. Deactivated threads can be TSRUN (kthread_t->kt_stat), but are not on the run queue
until they are re-activated.
186
Chapter 5
Analyzing Crash Dumps
Hangs
Seeing the above data, this system would appear to have memory problems.
What to Do if System Does Not Look Hung
The system probably is not hung if all of the following are true:
•
The processors are all busy
•
No threads have been hogging the processors
•
The run queues are full
•
The load averages are high
•
No critical resources are being held
•
Key system daemons have run recently
•
Memory resources are sufficient
Once its established that the system was most likely not hung, explore other possible issues. Did the system
respond to the ping command? If not, there was a fundamental networking problem. On the other hand,
perhaps the console was not responding, or certain key processes were not making progress, giving the
perception of a hung system. Investigate further.
Chapter 5
187
Analyzing Crash Dumps
Stack Tracing Tricks
Stack Tracing Tricks
Examples of how to trace every crash event, how to trace every processor, and how to trace all processes on a
crash dump.
Trace Every Crash Event
Load the part of the crash event table that contains valid entries and trace them.
q4> load crash_event_t from &crash_event_table until crash_event_ptr max 100
loaded 4 struct crash_event_table_structs as an array (stopped by “until” clause)
q4> trace pile
Event selected is 0. It was a panic
#0 0x4dd04 in panic+0x14 ()
#1 0x4e18c in assfail+0x3c ()
#2 0x4e344 in _assfail+0x2c ()
#3 0xc2c80 in sl_pre_check+0x120 ()
#4 0xc2a60 in spinlock+0x18 ()
#5 0x2b9420 in lock_try_read+0x40 ()
#6 0x1eb000 in psi_log_event+0xc8 ()
#7 0x4e530 in reboot_system_state+0x68 ()
#8 0x4e674 in boot+0x9c ()
#9 0x75c08 in kgdb_trap+0xcf8 ()
#10 0x7bef4 in kgdb_pre_int+0x1d4 ()
#11 0xc07f0 in skip_int_save_crs2_0+0x38 ()
#12 0x2cb858 in idle+0x5a0 ()
Event selected is 1. It was a TOC
#0
#1
#2
#3
#4
#5
#6
#7
0xa8d10 in check_panic_loop+0x38 ()
0xa9ec0 in trap+0xcc8 ()
0x7bcd8 in kgdb_pre_trap+0xa8 ()
0xc1a00 in $RDB_trap_patch+0x2c ()
0xc20a0 in splx+0x70 ()
0xc237c in spluser+0x14 ()
0x35b7c4 in syscall+0x86c ()
0x33d64 in $syscallrtn+0x0 ()
Event selected is 2. It was a TOC
#0
#1
#2
#3
#4
#5
#6
#7
#8
#9
0x48658 in iodc_wait_n_msec+0x98 ()
0x82894 in kgdb_lan_lasi_ready_check+0x84 ()
0x82cdc in kgdb_lan_lasi_attention+0x44 ()
0x82d78 in kgdb_lan_lasi_read+0x88 ()
0x72cc8 in kgdb_do_poll+0x30 ()
0x7fef10 in clock_int+0x88 ()
0xac934 in mp_ext_interrupt+0x394 ()
0x7be74 in kgdb_pre_int+0x154 ()
0xc07f0 in skip_int_save_crs2_0+0x38 ()
0x2cb72c in idle+0x474 ()
Event selected is 3. It was a TOC
#0
#1
188
0x48ea8 in iodc_mfctl+0x24 ()
0x48654 in iodc_wait_n_msec+0x94 ()
Chapter 5
Analyzing Crash Dumps
Stack Tracing Tricks
#2
#3
#4
#5
#6
#7
#8
#9
#10
0x82894 in kgdb_lan_lasi_ready_check+0x84 ()
0x82cdc in kgdb_lan_lasi_attention+0x44 ()
0x82d78 in kgdb_lan_lasi_read+0x88 ()
0x72cc8 in kgdb_do_poll+0x30 ()
0x7fef10 in clock_int+0x88 ()
0xac934 in mp_ext_interrupt+0x394 ()
0x7be74 in kgdb_pre_int+0x154 ()
0xc07f0 in skip_int_save_crs2_0+0x38 ()
0x2cb72c in idle+0x474 ()
Trace Every Processor on a PA System
Load the processor info table and trace every processor.
q4> load mpinfo_t from mpproc_info max nmpinfo
loaded 4 struct mpinfos as an array (stopped by max count)
NOTE
The previous command has to be replaced with the following two commands on kernel
versions later than 11.11
q4> load mpinfou_t from &spu_info max nmpinfo
q4> pileon mpinfo_t from pikptr
q4> trace pile
processor 0 was running process at 0x4193e040 (pid 319), thread at 0x42246040 (tid 338)
Event selected is 1. It was a TOC
#0
#1
#2
#3
#4
#5
#6
#7
0xa8d10 in check_panic_loop+0x38 ()
0xa9ec0 in trap+0xcc8 ()
0x7bcd8 in kgdb_pre_trap+0xa8 ()
0xc1a00 in $RDB_trap_patch+0x2c ()
0xc20a0 in splx+0x70 ()
0xc237c in spluser+0x14 ()
0x35b7c4 in syscall+0x86c ()
0x33d64 in $syscallrtn+0x0 ()
processor 1 claims to be idle
Event selected is 0. It was a panic
#0
#1
#2
#3
#4
#5
#6
#7
#8
#9
#10
0x4dd04 in panic+0x14 ()
0x4e18c in assfail+0x3c ()
0x4e344 in _assfail+0x2c ()
0xc2c80 in sl_pre_check+0x120 ()
0xc2a60 in spinlock+0x18 ()
0x2b9420 in lock_try_read+0x40 ()
0x1eb000 in psi_log_event+0xc8 ()
0x4e530 in reboot_system_state+0x68 ()
0x4e674 in boot+0x9c ()
0x75c08 in kgdb_trap+0xcf8 ()
0x7bef4 in kgdb_pre_int+0x1d4 ()
Chapter 5
189
Analyzing Crash Dumps
Stack Tracing Tricks
#11 0xc07f0 in skip_int_save_crs2_0+0x38 ()
#12 0x2cb858 in idle+0x5a0 ()
processor 2 claims to be idle
Event selected is 3. It was a TOC
#0
#1
#2
#3
#4
#5
#6
#7
#8
#9
#10
0x48ea8 in iodc_mfctl+0x24 ()
0x48654 in iodc_wait_n_msec+0x94 ()
0x82894 in kgdb_lan_lasi_ready_check+0x84 ()
0x82cdc in kgdb_lan_lasi_attention+0x44 ()
0x82d78 in kgdb_lan_lasi_read+0x88 ()
0x72cc8 in kgdb_do_poll+0x30 ()
0x7fef10 in clock_int+0x88 ()
0xac934 in mp_ext_interrupt+0x394 ()
0x7be74 in kgdb_pre_int+0x154 ()
0xc07f0 in skip_int_save_crs2_0+0x38 ()
0x2cb72c in idle+0x474 ()
processor 3 claims to be idle
Event selected is 2. It was a TOC
#0
#1
#2
#3
#4
#5
#6
#7
#8
#9
q4>
0x48658 in iodc_wait_n_msec+0x98 ()
0x82894 in kgdb_lan_lasi_ready_check+0x84 ()
0x82cdc in kgdb_lan_lasi_attention+0x44 ()
0x82d78 in kgdb_lan_lasi_read+0x88 ()
0x72cc8 in kgdb_do_poll+0x30 ()
0x7fef10 in clock_int+0x88 ()
0xac934 in mp_ext_interrupt+0x394 ()
0x7be74 in kgdb_pre_int+0x154 ()
0xc07f0 in skip_int_save_crs2_0+0x38 ()
0x2cb72c in idle+0x474 ()
Trace Every Processor on IPF System
Load the processor information table and trace every processor.
q4> load mpinfou_t from &spu_info max nmpinfo
loaded 1 union mpinfou as an array (stopped by max count)
q4> pileon mpinfo_t from pikptr
loaded 1 struct mpinfo
q4> trace pile
processor 0 claims to be idle
Event selected is 0. It was a panic
#0 0xe0000000002b1ac0:0 in change_stack_end+0x0 ()
#1 0xe0000000003babd0:0 in panic+0x360 ()
#2 0xe0000000003bbfe0:0 in assfail+0x50 ()
#3 0xe000000000756d60:0 in increment_callout_time+0x280 ()
#4 0xe00000000075a1f0:0 in expire_callouts+0x300 ()
#5 0xe0000000007520f0:0 in hardclock+0x130 ()
#6 0xe000000000295da0:0 in clock_int+0x7e0 ()
#7 0xe0000000003db430:0 in external_interrupt+0x300 ()
#8 0xe0000000003e7630:0 in bubbledown+0x0 ()
190
Chapter 5
Analyzing Crash Dumps
Stack Tracing Tricks
#9 0xe0000000006ba820:0 in idle+0x17c0 ()
q4>
Trace Every Process
Loading the process table:
Pre 11.10:
q4> load struct proc from proc max nproc
loaded 276 struct proc’s as an array (stopped by max count)
q4>
Post 11.10
q4> load struct proc from proc_list max nproc next
p_factp
loaded 35 struct procs as a linked list
(stopped by null pointer)
q4>
To load at every process structure on the system including those not on the active list:
q4> load struct proc from proc_list max nproc next
p_global_proc
loaded 35 struct procs as a linked list
(stopped by null pointer)
q4>
Keep only the active processes.
q4> keep p_stat != 0
kept 35 of 35 struct proc’s, discarded 0
Trace the stacks
q4> trace pile
stack trace for process at 0xb08b00 (pid 0), thread at 0xb087c0 (tid 0)
process was not running on any processor
#0
#1
#2
#3
#4
#5
#6
#7
#8
0x2caaa0 in _swtch+0x1b8 ()
0x2d22b8 in 1f_6a7b_cl_real_sleep+0x868 ()
0x2c63d4 in _sleep+0x14c ()
0x436ae4 in sched+0xcc ()
0x1e4224 in im_launch_sched+0x54 ()
0x417908 in DoCalllist+0xc0 ()
0x1e2c10 in main+0x28 ()
0xbe22c in $vstart+0x48 ()
0x3a760 in istackatbase+0x84 ()
stack trace for process at 0x41e93040 (pid 399), thread at 0x421f3040 (tid 418)
process was not running on any processor
Chapter 5
191
Analyzing Crash Dumps
Stack Tracing Tricks
#0
#1
#2
#3
#4
#5
#6
#7
0x2caaa0 in _swtch+0x1b8 ()
0x2d1d8c in 1f_6a7b_cl_real_sleep+0x33c ()
0x2c63d4 in _sleep+0x14c ()
0x174b5c in fifo_rdwr+0x3cc ()
0x17e314 in vno_rw+0x104 ()
0x8441ec in read+0x2e4 ()
0x35b554 in syscall+0x5fc ()
0x33d64 in $syscallrtn+0x0 ()
stack trace for process at 0x4228f040 (pid 398), thread at 0x42291040 (tid 417)
process was not running on any processor
#0
#1
#2
#3
#4
#5
0x2caaa0 in _swtch+0x1b8 ()
0x2d1d8c in 1f_6a7b_cl_real_sleep+0x33c ()
0x2c63d4 in _sleep+0x14c ()
0x1902ec in select+0x111c ()
0x35b554 in syscall+0x5fc ()
0x33d64 in $syscallrtn+0x0 ()
stack trace for process at 0x42234040 (pid 397), thread at 0x42235040 (tid 416)
process was not running on any processor
#0
#1
#2
#3
#4
#5
0x2caaa0 in _swtch+0x1b8 ()
0x2d1d8c in 1f_6a7b_cl_real_sleep+0x33c ()
0x2c63d4 in _sleep+0x14c ()
0x1902ec in select+0x111c ()
0x35b554 in syscall+0x5fc ()
0x33d64 in $syscallrtn+0x0 ()
...
stack trace for process at 0x417d5040 (pid 8), thread at 0x417d7040 (tid 8)
process was not running on any processor
#0
#1
#2
#3
#4
#5
#6
#7
#8
#9
q4>
192
0x2caaa0 in _swtch+0x1b8 ()
0x2d22b8 in 1f_6a7b_cl_real_sleep+0x868 ()
0x2c63d4 in _sleep+0x14c ()
0x644f0c in str_sched_up_daemon+0xec ()
0x644a40 in str_sched_daemon+0x1b0 ()
0x1e40ec in im_strsched+0x1c ()
0x417908 in DoCalllist+0xc0 ()
0x1e2c10 in main+0x28 ()
0xbe22c in $vstart+0x48 ()
0x3a760 in istackatbase+0x84 ()
Chapter 5
Analyzing Crash Dumps
Other Techniques
Other Techniques
Examples of other commands show information from crash, such as how to print the console message buffer,
how to print the time the system crashed and how to print how long the system had been up before the crash
and more.
Print Console Message Buffer
q4> examine &msgbuf+8 using s
WARNING: Kernel symbol table verification failed
gate64: sysvec_vaddr = 0xc0002000 for 1 pages
NOTICE: nfs3_link(): File system was registered at index 3.
NOTICE: autofs_link(): File system was registered at index 6.
0 sba
0/0 lba
I/O hardware probe timed out at path 0/0/0/0
0/0/1/0 c720
0/0/1/0.7 tgt
0/0/1/0.7.0 sctl
0/0/1/1 c720
0/0/1/1.2 tgt
0/0/1/1.2.0 sdisk
0/0/1/1.7 tgt
0/0/1/1.7.0 sctl
0/0/2/0 c720
0/0/2/0.2 tgt
0/0/2/0.2.0 sdisk
0/0/2/0.7 tgt
0/0/2/0.7.0 sctl
0/0/2/1 c720
0/0/2/1.2 tgt
0/0/2/1.2.0 sdisk
0/0/2/1.7 tgt
0/0/2/1.7.0 sctl
0/0/4/0 asio0
0/0/5/0 asio0
0/1 lba
...
linkstamp:
Wed Jul 19 14:57:30 PDT 2000
_release_version:
@(#)B2352B/9245XB HP-UX (B.11.00) #1: Wed Nov 5 22:38:19 PS
T 1997
__kern_ci_revision: $Header: kern_sequence.c,v 1.6.106.512 97/11/05 18:01:46 mso
sa Exp $
panic: Data memory protection fault
PC-Offset Stack Trace (read across, top of stack is 1st):
0x002d76e4 0x002eb538 0x002eac44
0x0010b130 0x0040359c 0x00403764
0x00403950 0x00346970 0x00108324
0x0010a504 0x00346b24 0x0010b0ac
0x001022e0 0x00104f24
End Of Stack
NOT sync’ing disks (on the ICS) (5 buffers to flush): 5 5 5 5 5 5 5 5 5 5 5 5 5
5 5 5 5 5 5 5 5 5 5 5 5 5 5 5 5 5 5 5 5 5 5 5 5 5 5 5 5 5 5 5 5 5 5 5 5 5 5 5 5
5 5 5 5 5 5 5 5
5 buffers not flushed
Chapter 5
193
Analyzing Crash Dumps
Other Techniques
1 buffer still dirty
q4>
When Did the System Crash?
q4> examine &time using Y
Mon Jul 24 11:28:00 2000
How Long Had the System Been Up Before the Crash
q4> ticks_since_boot/hz
0175
125
0x7d
The system had been up a little over 125 seconds which is a little more than two minutes.
NOTE
For 32 bit systems this value can be negative. Refer to uptime.pl for up to date information
What Was the Load Average?
NOTE
These commands are correct for uniprocessor machines but the values need to be divided by the
number of processors for multiprocessor machines. Look at the uptime.pl script for up to date
information.
The system’s load average is kept in a three element array in kernel global memory.
q4> examine &avenrun using 3F
0.284 0.1068 0.08823
This is the same load average that uptime prints. The kernel also keeps a load average that does not count
stopped or sleeping processes.
q4> examine &real_run using 3F
0.2041 0.06558 0.03763
In both cases the one minute average is first, the five minute average is second, and the 15 minute average is
third. In the previous examples, the trend is toward a higher load average.
What Command Was a Certain Process Running?
Load the process and then examine the p_cmd field.
q4> load struct proc from 0xb0d240
loaded 1 struct proc as an array (stopped by max count)
q4> examine p_cmnd using s
swapper
Pre 11.10 release crash dumps
194
Chapter 5
Analyzing Crash Dumps
Other Techniques
If the command name is wanted. but not the arguments, there is another parallel table for this.
q4> load struct proc
loaded 1 struct proc
q4> p_pindx
056
46
0x2e
q4> load pst_ucomm_t
loaded 1 pst_ucomm_t
q4> print -t s
s “sendmail”
from 0xb0d240
as an array (stopped by max count)
from pst_ucomms skip p_pindx
as an array (stopped by max count)
Post 11.10 release crash dumps
After dynamic process and thread allocation implementation, there are two fields that are interesting, p_comm
and p_cmnd. p_comm is a 15 character array, and p_cmnd is a pointer to a character string, up to 64 characters
long. Once loaded, use either print p_comm or print -x p_cmnd. The pointer value of p_cmnd can be
examined to see the arguments, examine 0x12345678 using s.
q4> load struct proc from 0x42234040
loaded 1 struct proc as an array (stopped by max count)
q4> print -xt p_cmnd
p_cmnd 0x41e4db40
q4> examine 0x41e4db40
/usr/lib/netsvc/yp/ypbind -ypset
q4> print p_comm
p_comm
“ypbind”
Where Is Per-Processor Information Kept?
Per-processor information is kept in the mpproc_info table. It is a dynamic array of mpinfo_t’s. Every live
processor has exactly one entry in this table. The table is maintained and used even when there is only one
processor (the so-called uniprocessor case).
The table may be sparse under rare circumstances. Additionally, the processors may appear in the table in
any order, so it’s best to use look up a processor by referring to its so-called Hard Physical Address (HPA).
The field is called prochpa.
Use a command like this:
q4> load mpinfo_t from mpproc_info max nmpinfo
loaded 4 struct mpinfos as an array (stopped by max count)
NOTE
The previous command has to be replaced with the following two commands on kernel versions
later than 11.11.
q4> load mpinfou_t from &spu_info max nmpinfo
q4> pileon mpinfo_t from pikptr
To load the entire processor info table.
Chapter 5
195
Analyzing Crash Dumps
Other Techniques
Where Are the Crash Events Kept?
When a system crashes the first processor to crash makes note of this event in the Crash Event Table. If the
crash proceeds as it is supposed to, that processor will tell each of the other processors in the machine to do a
Transfer of Control (TOC). Each of these TOCs generates another crash event so that, by the time the dump
is finished, there should be exactly one crash event per processor. In practice, there are often a few extra crash
events recorded in the table. A processor can leave more than one crash event if it suffered a recursive panic.
Use a command like this:
q4> load crash_event_t from &crash_event_table until
crash_event_ptr max 100
loaded 4 struct crash_event_table_structs as an array
(stopped by “until” clause)
To load the entire crash event table.
NOTE
The cet_savestate field in the crash_event_t type and the cpt_hpmc_savestate and
cpt_toc_savestate fields in the crash_proc_t type point to rpb_t’s, not save_state_t’s as
their names might suggest.
Load the Entire Process Table
For pre 11.10 release crash dumps, the entire process table can be loaded using the following command:
q4> load -r struct proc from proc max nproc
loaded 276 struct proc’s as an array (stopped by max count)
The -r flag (real-mode) is used for speed. It doesn’t matter so much with a normal-sized process table (like the
one in the example), but if the crash dump was produced by a big system the command will run a lot faster if
it doesn’t have to do address translation.
For post 11.10 release crash dumps, the entire process table can be loaded using the following command:
q4> load struct proc from proc_list max nproc next p_factp
loaded 35 struct procs as a linked list (stopped by null
pointer)
or use this command to load only the active processes:
q4> load struct proc from proc_list max nproc next
p_global_proc
loaded 35 struct procs as a linked list (stopped by null
pointer
Load the Entire Stack Unwind Table
The entire stack unwind table can be loaded using the following command:
q4> load unwindDesc_t from &$UNWIND_START until
&$UNWIND_END max 100000
loaded 9749 unwindDesc_t’s as an array (stopped by “until”
clause)
196
Chapter 5
Analyzing Crash Dumps
Other Techniques
There is a maintenance command on IPF to display the unwind information. Given the address or function
name, the command maint info unwind function_name|address prints out the corresponding unwind
table entry.
q4> maint info unwind panic
panic:
0xe0000000007333a0 .. 0xe0000000007338e0, end_prologue@0xe000000000733400
Info block version:0x1, flags:0x1000, length:4 * 8 == 32
0x000:
0x001:
0x003:
0x005:
0x007:
0x009:
0x00b:
0x00d:
0x00f:
0x011:
0x014:
0x016:
0x019:
0x01a:
0x01c:
0x01e:
0x01f:
q4>
(12)
(e4)
(b0)
(e6)
(b1)
(e8)
(b1)
(ea)
(b2)
(e0)
(e2)
(61)
(81)
(c0)
(61)
(a1)
(00)
R1prologue
P7rp_when
P3rp_gr
P7pfs_when
P3pfs_gr
P7preds_when
P3preds_gr
P7lc_when
P3lc_gr
P7mem_stack_f
P7spill_base
R3body
B1label_state
B2epilogue
R3body
B1copy_state
R1prologue
rlen=18
t=14
gr=34
t=0
gr=33
t=8
gr=36
t=17
gr=35
t=2 size=2
pspoff=4
rlen=198
label=1
t=5
rlen=36
label=1
rlen=0
How Was the Kernel Built?
The makefile passes certain flags to the C compiler to control the kernel build. These flags have a significant
effect on the way the kernel works. These flags are compiled into the kernel as a debugging aid.
q4> examine &_makefile_cflags using s
-D__ROSE__ -D__ROSEVILLE__ -DSYSCALLTRACE -DSTCP
-DSPP_RUNWAY_ERR_ENABLED -DSPP_OBP_BOOT
-DSEMAPHORE_DEBUG
-DSCSI_ALT_IF_DRIVER -DRDB -DPGPROF -DPARISC -DOSDEBUG -DNEW_RDB
-DNEW_MFCTL_W -DMPDEBUG -DLWSYSCALL -DKGDB_ON -DIVT_INTERCEPT
-DIPSEC -DIDDS -DHPONCPLUS -DCOMB_FLIPPER -DAUDIT -DACLS
-D__hp9000s800 -D__TEMP64__
-D__STDC_EXT__ -D__NO_EM_HDRS
-D_XPG4_EXTENDED -D_UNSUPPORTED -D_KERNEL -D_HPUX_SOURCE
-D_CLEAN_BE
-U__hp9000s700
-D_HDRS_FROM_SRC_TREE -I/ux/core/kern/.include/pa
-I/ux/core/kern/pa/.link
-Iinclude -I/ux/core/kern/common
-Wp,-H300000 +R500 +Omultiprocessor +Hx0 +ESssf +ESsfc +XixdU +Ofastaccess +Oentrysched
+O2 +ESlit
+ES1.Xindirect_calls
q4>
Chapter 5
197
Analyzing Crash Dumps
Other Techniques
Did Anyone Write to /dev/[k]mem?
The kernel keeps track of writes to /dev/mem and /dev/kmem because that information may be useful if the
system crashes.
The log is a circular buffer of the most recent writes. The total number of writes is kept in a kernel global:
q4> kmem_writes
01
1
0x1
Each entry in the log contains the:
•
dev_t of the target device (indicating whether it was /dev/mem or /dev/kmem)
•
kernel address of the write (where the data went)
•
length of the write (in bytes)
•
first word of the data written (most of these writes are a word or less anyway)
•
time of day when the write was performed
•
process ID of the process that did the write
•
(real) user ID of the process that did the write
•
name of the command that did the write
Get the log:
q4> load kmem_log_t from &kmem_log max kmem_log_slots
loaded 16 struct _kmem_log_ts as an array (stopped by max
count)
Keep only the valid entries:
q4> keep kl_len > 0
kept 1 of 16 kmem_log_t’s, discarded 15
Display the most interesting evidence:
q4> print kl_addr %#x kl_len kl_data1 kl_time.tv_sec kl_pid
kl_uid kl_comm
kl_addr kl_len kl_data1 kl_time.tv_sec kl_pid kl_uid
kl_comm
0x3982f8
4
0
0
791
0
“adb”
From this we know that the superuser used adb to poke a zero at location 0x3982f8. Question: Where is that?
q4> examine kl_addr using a
onice+0xc0
This is the branch stub that was poked to get this sample dump in the first place. Aa break instruction was
poked into the long branch stub at this address and then made a system call that would step on it.
198
Chapter 5
Analyzing Crash Dumps
Remote Dump Analysis
Remote Dump Analysis
KWDB supports remote dump analysis. Using this feature KWDB can be used to analyze crash dumps
located on a remote system. To support this feature a program, kwdbcr, has to be run on the remote system
where crash dump is located. The kwdbcr program handles requests from KWDB client to open and read data
from the crash dump. From kwdb 3.1.3 onwards, it is possible to daemonize kwdbcr so that it is unnecessary
to rerun kwdbcr each time to analyze a crash dump from a remote host running kwdb client. Here are the
steps involved in analyzing a remote crash dump.
1. Copy the kernel file, usually vmunix and DLKM modules if any, from the remote system to the local
system where KWDB client is going to be run. KWDB reads all symbols information from these files. Only
data from the crash dump is read from the remote system.
NOTE
From kwdb 3.1.3 onwards, kwdb, when started on a remote crash dump, automatically
copies vmunix and modules from the crash dump and caches them in the host machine
under $HOME/.kwdb/remotefiles. The contents of this cache are intended for kwdb’s own
internal usage, and can be removed by kwdb from time to time. The default size of this
cache is 120 MB, but can be configurable through kwdb by running the set kwdb
remote_file_cache_size <size_in_MB> command. It may also be noted that the size of
this cache can marginally increase during copying of a remote vmunix/module if total usage
of the cache for the current kwdb session is more than 120 MB (or the size specified by
running the set kwdb remote_file_cache_size command).
2. Invoke kwdbcr on the remote system with crash dump directory name as the argument. Specify optional
arguments, a port number to use for connection, and a filename, if desired, to log messages. kwdbcr -help
will display the usage of kwdbcr as shown:
# kwdbcr -help
kwdbcr : Program to be run on remote system for remote crash dump analysis using kwdb.
Usage : kwdbcr [port] [crash_path] [-l logfile]
port - port number for kwdb to connect.
By default a free port above 47001 is used.
crash_path - crash dump directory path.
By default current directory is used.
logfile - filename to log messages.
By default ./kwbcr.log is used.
# kwdbcr -d [-l logfile]
-d option runs kwdbcr as a daemon
#kwdbcr -v
-v option displays the kwdbcr version information
After successfully starting, kwdbcr displays a message (including a port number for use by KWDB) for
connecting to this server program as shown in the following example:
# kwdbcr /var/adm/crash.0
Analysing crash dump at /var/adm/crash.0 through port 47003
Start kwdb on the host using :
kwdb -q4 vmunix remote system:47003
Chapter 5
199
Analyzing Crash Dumps
Remote Dump Analysis
3. Invoke KWDB on the local system using:
# kwdb -q4 [-m] vmunix
remote_system:port_number | crash_path in remote system>
or
# kwdb -q4 [-m] vmunix
(kwdb) target crash remote_system:port_number | crash_path in remote system>
where...
vmunix – is the kernel copied from remote system in step 1. From kwdb 3.1.3 onward, specification of
vmunix is optional.
remote_system – is the name or IP address of the remote host where kwdbcr is running
port_number – is the port number displayed by kwdbcr in step 2
From now on, all the commands and features for analyzing local crash dumps are available for analyzing the
remote crash dump. kwdb uses its own protocol to communicate with the remote crash dump site.
Ending the KWDB session on the local system will terminate the kwdbcr program running on the remote
system. From kwdb 3.1.3 onward, if the daemon option is used, kwdbcr continues to run in the background
(unless explicitly terminated by the user). When executed in daemon mode, kwdbcr creates a logfile at
/var/opt/kwdb/kwdbcr.log.
200
Chapter 5
6 Live Memory Analysis
KWDB is a tool for source level debugging of HPUX kernels and Q4 is a tool used for analyzing HPUX kernel
crash dumps and HPUX systems while they are running. Starting with KWDB version 2.0 all Q4 commands
are implemented in KWDB. With the addition of Q4 commands, KWDB can be used to analyze HPUX kernel
crash dumps and live systems. This chapter explains how KWDB can be used to analyze live systems. In
order to analyze live systems, KWDB uses special device files /dev/kmem and /dev/mem. Superuser privilege
is required to analyze live systems using KWDB.
Why use a live memory analyzer when a remote source level debugger or on-console debugger when studying
a system that is not physically connected or booted for debugging. The database aspects of KWDB can make
live memory analysis a key activity. Loading and keeping just the right objects out of the many that may exist
on a system can be just the thing to do. Develop PERL functions that can be as productive for studying a
running system as the WhatHappened and Analyze function are for working with crash dumps.
Chapter 6
201
Live Memory Analysis
Starting KWDB to Perform Live Memory Analysis
Starting KWDB to Perform Live Memory Analysis
Here are the steps to start KWDB to analyze a live system.
1. Sign on as superuser or account with user privilege.
2. Find the running vmunix. If the kmpath command is available on the system, invoke it to find the
pathname of the vmunix that is currently running on the system.
# kmpath
If the file used in loading the running kernel, as shown by the above command, is not /stand/vmunix, the
proper file has to be substituted for /stand/vmunix in the following steps. KWDB on PA requires the
kernel file to be preprocessed by pxdb. Make sure the kernel file is preprocessed by pxdb before
proceeding to the next step.
# pxdb /stand/vmunix
pxdb64: /stand/vmunix is already preprocessed
PXDB aborted.
#
3. Invoke KWDB with the -q4 option, with vmunix and /dev/kmem or /dev/mem
# kwdb -q4 /stand/vmunix /dev/kmem
-q4: automatically puts KWDB into Q4 command mode.
/stand/vmunix: the running kernel file
/dev/kmem: indicates performing live memory analysis.
This is equivalent to invoking the Q4 command
# q4 /stand/vmunix /dev/kmem
The command in step three starts KWDB to debug the kernel file, sets up the devmem target to read from
/dev/mem and /dev/kmem and sets the KWDB mode to Q4. On the other hand, what was accomplished by the
command in step three can also be done as follows:
# kwdb /stand/vmunix
(kwdb) target devmem
(kwdb) set kwdb q4 on
q4>
The command set kwdb q4 on is used to set the KWDB in Q4 mode. Setting this mode for the crash and
devmem targets provides the user with the standard q4> prompt. There are certain commands, like symbols,
run, print and unset, present both in KWDB and Q4. To invoke as Q4 commands, they have to be prefixed
with q4 as in q4 symbols, q4 run, q4 print and q4 unset. Once KWDB in Q4 mode these ambiguous
commands will be treated as Q4 commands and need not be prefixed with Q4. Turn the Q4 mode off by using
the command set kwdb q4 off.
202
Chapter 6
Live Memory Analysis
Running Commands to Perform Live Memory Analysis
Running Commands to Perform Live Memory Analysis
After starting KWDB to do live memory analysis as explained in the previous section, any of the KWDB or Q4
commands can be executed on the live system. While analyzing crash dumps KWDB reads data from crash
dump images. On the other hand while reading data from live system reading will be done from /dev/kmem or
from /dev/mem depending on whether the address is in kernel space or not.
Synchronization between data in kwdb memory and kernel memory is not always correct. While analyzing a
live system, KWDB runs as a process on the same system. It is possible that after KWDB reads data from a
memory location, it may get changed by another process. Any analysis performed by KWDB using the old
data may not correctly represent the system behavior in real-time.
To analyze a system which is very slow or nearly hung, follow the procedure described on how to analyze a
crash dump caused by a system hang in Chapter 5, “Analyzing Crash Dumps.”
The following example shows how KWDB can be used on a live system for looking at different structures and
doing data collection. Here KWDB explores various callout structures on a live system. These examples are
from a PA-RISC system and outputs will be similar on IPF systems.
Example:
Invoke KWDB on a live system:
# kmpath /stand/vmunix
# kwdb -q4 -quiet /stand/vmunix /dev/kmem
q4>
Here is how we can get system information:
q4> load struct utsname from &utsname
loaded 1 utsname as an array (stopped by max count)
q4> print -tx
indexof 0
mapped 0x1
spaceof 0
addrof 0x704758
physaddrof 0x704758
realmode 0
sysname
nodename
release
version
machine
__idnumber
“HP-UX”
“hpadl628”
“B.11.00”
“U”
“9000/800”
“849377401”
Get a listing of all the structures and typedefs that contain the string of characters “callout”.
q4> cat callout
BYTES FIELDS SHAPE
72
11 struct
4
12
enum
4
12 typedef
72
11 typedef
Chapter 6
NAME
callout
callout_flags
callout_flags_t
callout_t
203
Live Memory Analysis
Running Commands to Perform Live Memory Analysis
The callout structure has 11 fields and is 72 bytes in size. Get a listing of all the fields defined in a callout
structure.
q4> fields -cx struct callout
struct callout {
u_char c_cookie;
u_char c_pad;
enum callout_flags {
DRIVER_CALLOUT = 1,
MP_CALLOUT = 2,
PENDING_CALLOUT = 4,
FREE_CALLOUT = 8,
ABSTIME_CALLOUT = 16,
DYNAMIC_CALLOUT = 32,
HEADER_CALLOUT = 64,
HEADER_HASH_CALLOUT = 128,
HEADER_TIME_CALLOUT = 256,
HEADER_EXPIRED_CALLOUT = 512,
EXPIRED_CALLOUT = 1024,
REALTIME_CALLOUT = 2048
} c_flag;
u_int c_abs_time_hi;
u_int c_abs_time_lo;
struct callout *c_time_next;
struct callout *c_time_prev;
struct callout *c_hash_next;
struct callout *c_hash_prev;
union {
struct {
int (*cc_func)( );
char *cc_arg;
} real_callout;
struct {
struct callout *tc_thdr_next;
} time_header;
struct {
u_int hc_walkcount;
u_int hc_walklength;
} hash_header;
} var;
int c_spu;
}
Load all the callout structures from the callout table.
q4> load struct callout from callout max ncallout
loaded 3016 struct callouts as an array (stopped by max count)
List all the different flag fields in these structures.
q4> print c_flag | sort -u
EXPIRED_CALLOUT|FREE_CALLOUT
FREE_CALLOUT
PENDING_CALLOUT
PENDING_CALLOUT|DRIVER_CALLOUT
PENDING_CALLOUT|MP_CALLOUT
204
Chapter 6
Live Memory Analysis
Running Commands to Perform Live Memory Analysis
Keep only those callout structures with the PENDING_CALLOUT flag set.
q4> keep c_flag & PENDING_CALLOUT
kept 38 of 3016 struct callout’s, discarded 2978
There are 38 callout structures with the flag value PENDING_CALLOUT.
List all the different function addresses pointed to by these structures.
q4> print -x var.real_callout.cc_func | sort -u
0x191a08
0x19e3e8
0x1bd228
. . . . . // all lines from output not shown here
0xc2a20
Get name of kernel routines found in the previous step.
q4> examine 0x191a08 using a
unselect
q4> ex 0x19e3e8 using a
schedttisr
q4> ex 0x8c230 using a
scsi_cleanup_scbs
The kernel routines unselect, schedttisr, and scsi_cleanup_scbs are referred to in callout structures.
Display the instructions of those functions. Choose unselect.
q4> code unselect
Dump of assembler code for function unselect:
0x191a08 <unselect>:std %rp,-0x10(%sp)
0x191a0c <unselect+0x4>:addil L’-0x2800,%dp,%r1
0x191a10 <unselect+0x8>:std,ma %r3,0x60(%sp)
0x191a14 <unselect+0xc>:copy %r26,%r3
. . . . . // all lines from output not shown here
0x191b9c <unselect+0x194>:ldo -0x10(%sp),%ret1
0x191ba0 <unselect+0x198>:b 0x191ac4 <unselect+0xbc>
0x191ba4 <unselect+0x19c>:addil L’-0x2800,%dp,%r1
End of assembler dump.
Look into the near term, mid term and far future events. Load the near term callout headers and list different
types from the flag fields.
q4> load struct callout from callout_time_nr max ncallout until callout_time_md
loaded 256 struct callouts as an array (stopped by “until” clause)
q4> print c_flag | sort -u
HEADER_TIME_CALLOUT|HEADER_CALLOUT
There are 256 near term structures. They are of the type HEADER_TIME_CALLOUT|HEADER_CALLOUT. List the
absolute time fields for these headers.
q4> print indexof c_abs_time_hi c_abs_time_lo
indexof c_abs_time_hi c_abs_time_lo
0
0
76681472
1
0
76681473
2
0
76681474
. . . . . // all lines from output not shown here
Chapter 6
205
Live Memory Analysis
Running Commands to Perform Live Memory Analysis
253
254
255
0
0
0
76681469
76681470
76681471
The structures are in the sequence of c_abs_time_lo numbers and the numerical difference between
adjacent time fields is 1 (one) which corresponds to one clock tic (10 msec.).
Load the mid term callout headers and print the absolute time fields for these headers.
q4> load struct callout from callout_time_md max 256
loaded 256 struct callouts as an array (stopped by max count)
q4> print c_abs_time_hi c_abs_time_lo
c_abs_time_hi c_abs_time_lo
0
76742656
0
76742912
. . . . . // all lines from output not shown here
0
76742144
0
76742400
The structures are in the sequence of the c_abs_time_lo numbers and the numerical difference between
adjacent time fields is 256. Load the callout header for far future events, (there is only single header for all far
future events) and display contents.
q4> load struct callout from callout_time_ff
loaded 1 struct callout as an array (stopped by max count)
q4> print -tx
indexof 0
mapped 0x1
spaceof 0
addrof 0x4097b40
physaddrof 0x4097b40
realmode 0
c_cookie 0x32
c_pad 0
c_flag HEADER_TIME_CALLOUT|
HEADER_CALLOUT
c_abs_time_hi 0
c_abs_time_lo 0x4928e00
c_time_next 0x405a370
c_time_prev 0x10221f888
c_hash_next 0
c_hash_prev 0
var.real_callout.cc_func 0
var.real_callout.cc_arg 0
var.time_header.tc_thdr_next 0
var.hash_header.hc_walkcount 0
var.hash_header.hc_walklength 0
c_spu 0
Load the linked list of structures associated with this and print types and absolute times for each of them.
q4> load struct callout from c_time_next max ncallout next c_time_next
loaded 15 struct callouts as a linked list (stopped by loop)
q4> print c_abs_time_hi c_abs_time_lo c_flag
c_abs_time_hi c_abs_time_lo c_flag
0
77812143
PENDING_CALLOUT
0
78010793
PENDING_CALLOUT
206
Chapter 6
Live Memory Analysis
Running Commands to Perform Live Memory Analysis
0
0
0
0
79255754
82548474
77760000
76824433
0
79922775
0
0
0
0
76723818
85220363
85253174
76816943
0
0
76731230
76714018
0
77054684
0
76713472
PENDING_CALLOUT
PENDING_CALLOUT
PENDING_CALLOUT
DYNAMIC_CALLOUT |
PENDING_CALLOUT |
MP_CALLOUT
DYNAMIC_CALLOUT |
PENDING_CALLOUT |
MP_CALLOUT
PENDING_CALLOUT
PENDING_CALLOUT
PENDING_CALLOUT
DYNAMIC_CALLOUT |
PENDING_CALLOUT |
MP_CALLOUT
PENDING_CALLOUT
DYNAMIC_CALLOUT |
PENDING_CALLOUT |
MP_CALLOUT
DYNAMIC_CALLOUT |
PENDING_CALLOUT |
MP_CALLOUT
HEADER_TIME_CALLOUT |
HEADER_CALLOUT
There were 15 such structures and the last structure is the header structure. The events are not in
chronological order. Also it is a circular list, so load was stopped by finding a loop. Load the hash headers and
display flags, times and links.
q4> load struct callout from callout_hash max 256
loaded 256 struct callouts as an array (stopped by max count)
q4> print -x flag c_abs_time_lo c_time_next c_hash_next
c_flag
c_abs_time_lo c_time_next c_hash_next
HEADER_HASH_CALLOUT|HEADER_CALLOUT 0
0
0x405a490
HEADER_HASH_CALLOUT|HEADER_CALLOUT 0
0
0x4097bd0
. . . . . // all lines from output not shown here HEADER_HASH_CALLOUT|HEADER_CALLOUT 0
0x409c2f8
HEADER_HASH_CALLOUT|HEADER_CALLOUT 0
0
0x409c340
0
The structures are of type HEADER_HASH_CALLOUT and absolute times (c_abs_time_lo) are zeros and there
are links (c_hash_next) to the hash chain. Now let’s load two of the expired headers and display all the fields.
q4> load struct callout from callout_hash skip 256 max 2
loaded 2 struct callouts as an array (stopped by max count)
q4> print -tx
indexof 0
mapped 0x1
spaceof 0
addrof 0x409c388
physaddrof 0x409c388
realmode 0
c_cookie 0x32
c_pad 0
c_flag HEADER_EXPIRED_CALLOUT |
HEADER_TIME_CALLOUT |
HEADER_CALLOUT
c_abs_time_hi 0
c_abs_time_lo 0
Chapter 6
207
Live Memory Analysis
Running Commands to Perform Live Memory Analysis
c_time_next
c_time_prev
c_hash_next
c_hash_prev
var.real_callout.cc_func
var.real_callout.cc_arg
var.time_header.tc_thdr_next
var.hash_header.hc_walkcount
var.hash_header.hc_walklength
c_spu
indexof
mapped
spaceof
addrof
physaddrof
realmode
c_cookie
c_pad
c_flag
c_abs_time_hi
c_abs_time_lo
c_time_next
c_time_prev
c_hash_next
c_hash_prev
var.real_callout.cc_func
var.real_callout.cc_arg
var.time_header.tc_thdr_next
var.hash_header.hc_walkcount
var.hash_header.hc_walklength
c_spu
0x409c388
0x409c388
0
0
0
0
0
0
0
0
0x1
0x1
0
0x409c3d0
0x409c3d0
0
0x32
0
HEADER_EXPIRED_CALLOUT |
HEADER_TIME_CALLOUT |
HEADER_CALLOUT
0
0
0x409c3d0
0x409c3d0
0
0
0
0
0
0
0
0
The (c_flag) fields show the header type as HEADER_EXPIRED_CALLOUT.
208
Chapter 6
Live Memory Analysis
Running PERL Scripts on a Live System
Running PERL Scripts on a Live System
Perl scripts can be run on live systems as well as on crash dumps. Use the -p option while invoking KWDB to
start the PERL session. If the -p option is not specified, the PERL session will be started when trying to
execute the script related commands include or run. Here is an example of running a PERL script on a live
system. Here the script Analyze is run and its output is redirected to the file analyze.out. The output file
analyze.out can be viewed using any editor.
Example:
# kwdb -q4 -quiet -p /stand/vmunix /dev/kmem
script /.q4rc.pl
executable /usr/contrib/Q4/bin/perl
version 5.00502
SCRIPT_LIBRARY = /usr/contrib/Q4/lib/q4lib_11.00
perl will try to access scripts from directory
/usr/contrib/Q4/lib/q4lib_11.00
System memory: 1024 MB
Total Dump space configured: 1536.00 MB
Total Dump space actually used: 0.00 MB
Dump space appears to be sufficient : 1536.00 MB extra
q4> run Analyze > analyze.out
processing................................................................................
......................
.................... done!
q4>
See Chapter 7, “KWDB PERL Programming Reference,” for more details.
Chapter 6
209
Live Memory Analysis
Reading From Locked Pages
Reading From Locked Pages
Reading from a locked page will result in “Device Busy” error message. To read from locked pages, reset the
page_lock_required flag. This may introduce a bit of a cache coherency problem on multiprocessor systems
so do the following mindful of the risk. The page_lock_required flag can be reset using KWDB.
Example:
# kwdb -q4 -quiet /stand/vmunix /dev/kmem
q4> trace thread at 0x3cd4800
Stack trace for process “swapper” at 0x3a15600 (pid 0)
Thread at 0x3cd4800 (tid 0)
Error accessing memory address 0x400003ffffff0008: Device busy.
q4> p page_lock_lock_required = 0
$2 = 0
q4> trace thread at 0x3cd4800
Stack trace for process “swapper” at 0x3a15600 (pid 0)
Thread at 0x3cd4800 (tid 0)
#0 0x10b06c in _swtch+0xd4 ()
#1 0xd1b48 in sema_sleep+0xa0 ()
#2 0xd1a00 in _psync+0x70 ()
#3 0x1dce48 in sched+0x210 ()
#4 0x2a41e4 in main+0x6b4 ()
#5 0x10811c in $vstart+0x48 ()
#6 0x21674c in $locore+0x94 ()
q4> p page_lock_required = 1
$3 = 1
q4>
210
Chapter 6
Live Memory Analysis
Unsupported Commands
Unsupported Commands
Commands which deal specifically with crash targets will not be supported on live targets. Examples for such
commands are trace event #, set crash event #. KWDB will display an appropriate error message when
such commands are attempted on a live system.
Commands like break, continue, step next, etc., are used for debugging may not be used while analyzing a
live system. KWDB will report an appropriate error message when these commands are attempted on a live
system.
While running KWDB on a live system using the devmem target, KWDB does not have control of the running
processes on the system. Therefore, it does not make sense to trace a running thread or to set thread context
to a running thread. Appropriate error messages will be displayed when such commands are tried while
analyzing a live system.
Chapter 6
211
Live Memory Analysis
Unsupported Commands
212
Chapter 6
7 KWDB PERL Programming Reference
KWDB is a source level debugger for HP-UX kernel and drivers. KWDB can be used for source level
debugging of remote systems or for analyzing crash dumps or for analyzing live systems.
As explained earlier in Chapter 4, “Command Reference,” KWDB allows execution of any system commands or
executables or shell scripts from within KWDB using the commands system or shell. Similarly, a set of
KWDB commands which has to be executed many times can be stored in a file and invoked from within
KWDB using the command source. KWDB can also use PERL to input KWDB commands and process
KWDB output.
This chapter describes KWDB’s PERL programmer’s interface. Programs can be written in PERL to analyze
crash dumps or live systems or remote systems running under KWDB. To write PERL programs and after
reading Chapter 4, “Command Reference,” this chapter is the next logical step.
Analyzing crash dumps or live systems can be divided into two sub problems:
•
Reconstruction of data types — examining a structure, looking at fields in a structure, and printing a
structure are examples of reconstruction.
•
Navigation through data structures — collecting a number of related structures by getting an array,
walking a linked list, selecting items of interest or traversing a tree are examples of navigation.
Reconstruction is built into KWDB. Reconstruction is fully automatic, and all of the information needed to
reconstruct a data type is embedded in the kernel itself.
Navigation is provided by an outboard programming language, PERL (the subject of this chapter), and a few
simple but carefully chosen support commands embedded within KWDB. By making navigation the
responsibility of the PERL scripts, KWDB becomes more portable. As the scripts are not built into KWDB,
they can be made part of the kernel source environment. This means the PERL scripts can be owned and
maintained by the people who own the kernel code that the scripts navigate.
Before we discuss Running and Writing Scripts, we will compare the data flow in KWDB with and without
the PERL option and then cover some installation issues.
Chapter 7
213
KWDB PERL Programming Reference
How KWDB Works With PERL
How KWDB Works With PERL
In a normal debugging session KWDB is interactive. Type commands that are read by KWDB. KWDB looks
up what was asked for in the dump files (vmunix and crash dump image for crash target or other sources
depending on the target selected) and prints the answer on the screen. If asked for output redirection the
answer goes to the file or pipe instead. Normal KWDB flow without using PERL is illustrated in Figure 7-1 on
page 214 (the arrows indicate the direction information flows).
Figure 7-1
Invoking KWDB Without PERL
Screen
Screen
File or Pipe
File or Pipe
KWDB
Keyboard
vmunix
Crash Dump
/dev/[k]mem
+
DLKM Modules
Remote System
Things change a little when turning on PERL programming. Instead of talking directly to KWDB talk to
PERL (KWDB runs PERL, don’t invoke it). PERL sends the commands typed to KWDB. When KWDB
responds PERL forwards the output.
When issuing an include command PERL loads the named script. When issuing a run command PERL
invokes the named PERL script. The PERL script does whatever it wants to do, which may include conversing
with KWDB and displaying results, and then returns interactive control to the keyboard. This is illustrated in
Figure 7-2 on page 215 (the arrows indicate the direction information flows).
214
Chapter 7
KWDB PERL Programming Reference
How KWDB Works With PERL
Figure 7-2
Invoking KWDB With PERL Option -p
Screen
Screen
File or Pipe
File or Pipe
PERL
Keyboard
KWDB
vmunix
Crash Dump
/dev/[k]mem
+
DLKM Modules
Remote System
Verify PERL is Installed
To invoke PERL, KWDB searches for an executable file called PERL in the following order:
1. $Q4_PERL_PATH (Q4_PERL_PATH is an environment variable set by user)
2. $Q4_ROOT/bin/PERL (Q4_ROOT is an environment variable set by user)
3. /usr/contrib/Q4/bin/PERL
4. PERL in the directories set by PATH environment.
If PERL is already installed on the system, KWDB can be made to use it by setting the environment variable
$Q4_PERL_PATH or setting the PATH appropriately. If PERL in not installed, contact the system administrator
to have it installed.
Verify the Scripts are Installed
Scripts are installed as part of KWDB installation. During the installation of KWDB a directory called
/usr/contrib/Q4/lib will be created. This directory contains a set of directories q4lib, q4lib_10.20,
q4lib_11.00, q4lib_11.11, q4lib_11.20, and so forth. These are the directories where scripts for
corresponding versions of HP-UX operating systems are kept. The directory q4lib contains scripts for the
latest version of HP-UX and is the default directory to be used. During startup KWDB looks for the version of
vmunix and decides which scripts to use.
The last step before starting KWDB with PERL session is to create a startup file in the home directory. The
easiest way to do this is:
$ cp /usr/contrib/Q4/lib/q4lib/sample.q4rc.pl ~/.q4rc.pl
Read the comments in the file for customization hints and rules.
Chapter 7
215
KWDB PERL Programming Reference
Running Scripts
Running Scripts
Installation of KWDB includes many scripts designed to help analyze what happened and is happening on the
system. To take advantage of these scripts, include and run the scripts. This section includes information to
help debug the scripts if that becomes necessary.
Invoking KWDB
There are two KWDB commands, include and run, associated with PERL programming. If starting KWDB
without the -p option and invoke either of the two commands, KWDB will start the PERL session and prompt
to continue with the commands.
Another way to use the PERL programming features of KWDB is to add the -p flag when invoking it. For
example:
For crash dumps:
$ kwdb -q4 -p crash_dump_directory
For live systems:
$ kwdb -q4 -p /stand/vmunix /dev/[k]mem
For remote targets:
$ kwdb -p vmunix
KWDB will run PERL and make the necessary connections as shown in Figure 7-2, “Invoking KWDB With
PERL Option -p.”
Once everything has been initialized. get the usual prompt at which time use KWDB just like normal.
Including Program Files
To run programs, first load them and use the include command.
For example, load the programs that know how to manipulate processes:
$ kwdb -q4 -p crash_directory_path
...
q4> include processes.pl
loading ./q4lib/processes.pl ...
loading ./q4lib/misc.pl ...
loading ./q4lib/commands.pl ...
loading ./q4lib/credentials.pl ...
loading ./q4lib/user.pl ...
loading ./q4lib/vm.pl ...
q4>
PERL prints the name of each file as it loads it. Other files were loaded as well because processes.pl
included them. It probably did this because one or more of the functions it defines rely on functions defined in
these other files. (The include command knows what it’s already seen so multiple includes of the same file
will only read it once.)
If there are files to include every time, consider adding some include commands to the .q4rc.pl file.
216
Chapter 7
KWDB PERL Programming Reference
Running Scripts
NOTE
KWDB can not tell if the scripts included in the previous script were successfully included. The
script must be written so that the last line of the file, outside the scope of any function, is a
print statement that indicates the file was successfully loaded. For example: print "loaded
MyScriptName.pl\n";
Invoking Scripts
Once loaded the necessary files are ready to run programs. Use the run command to do this.
For example, emulate an analyze UAP:
$ kwdb -q4 -p crash_directory_path
...
q4> include analyze.pl
...
q4> run Analyze options
Function arguments are optional (depending on the individual function’s requirements).
If multiple arguments are specified they are concatenated together (with white space separators) and passed
to the function as a single PERL string argument. The function may use any of PERL’s built in mechanisms
for splitting it up if it chooses.
For example,
q4> run Analyze UAP
turns into
&Analyze("UAP")
inside PERL scripts.
q4> run Analyze U A P
would turn into
&Analyze(“U A P”)
Redirecting Script Output
Output generated by PERL programs can be redirected in one of two ways. The program can choose (for its
own reasons) to write its output anywhere it wants or redirect the default output of the command (using the
standard notation).
For example, run the program PrintMessageBuffer and pipe its output to more:
q4> run PrintMessageBuffer | more
Tracing Dialog Between PERL and KWDB
Trace the dialog between the PERL process and the KWDB process. There is a global variable, $traceDialog,
which can be set to the filename for logging the dialog. The name of this file can be set by entering the
following line in the startup script file ~/.q4rc.pl.
$traceDialog =Filename;
Chapter 7
217
KWDB PERL Programming Reference
Running Scripts
If $traceDialog is defined, every message sent and received by the PERL process will also be written to that
file. There are functions TraceOn and TraceOff defined in .q4rc.pl which can help control tracing.
q4> run TraceOn dialog file
q4> run script of interest
q4> run TraceOff
Interactively turn tracing on as shown in the previous example and then from another session tail the dialog
file while KWDB is processing the script. See the last exchange, it may have to recreate the problem
interactively to understand what is failing. The TraceOn and TraceOff functions can also be called within a
script to trace a certain section of a script.
Debugging PERL Scripts
It is possible to debug PERL scripts by starting PERL in debug mode. This can be done by invoking KWDB
with -P option as shown in example below. The system administrator must have installed a version of PERL
that supports the debugging functionality
$kwdb -q4 -P /var/adm/crash/crash.0 -quiet
Using debug mode for PERL script
Loading DB routines from PERL5db.pl version 1.01
Emacs support available.
Enter h or ‘h h’ for help.
main::(/home/mmuthira/.q4rc.pl:7):
7:
local($PROGRAM_NAME);
DB<1> n
main::(/home/mmuthira/.q4rc.pl:8):
8:
local($EXECUTABLE_NAME);
The Two Scripts Most Often Run
The two scripts most often run are WhatHappened and Analyze. Include whathappened.pl and analyze.pl
to run them. WhatHappened is also known as WH.
What Happened
The WhatHappened is a tool for diagnosing apparent system hangs. Use the word apparent because there are
a number of things that can make a system seem like it’s hung when it really isn’t. When this happens it’s
fairly common for someone to get impatient and force a reboot (and a dump). WhatHappened is designed to
look over the dump and determine if one of the common problems have occurred. If so, the problem is
explained. If not, it says so and further work is needed.
Here are some of the things WhatHappened checks:
•
What brought the system down? If it was a panic or HPMC (high priority machine check) then it wasn’t a
system hang.
•
Were there real-time processes soaking up lots of CPU time? If there were enough of these to cover every
processor (and they look like that’s what they were doing) might have the cause right there. The offending
processes may have exited before the dump started.
218
Chapter 7
KWDB PERL Programming Reference
Running Scripts
•
Were there a lot of zombie processes lying around? If so, they may have been holding a lot of valuable
resources. It’s also suggestive of an application that was not cleaning up after itself.
•
Was the process table full? If so, it may have been difficult or impossible to launch new processes.
•
Were any specific users out of processes? The system imposes a limit on the number of processes each user
may have in existence at any one time. If anyone was at this limit they would not be able to launch any
new processes.
•
Is memory scarce? There are many things the system cannot do (or do well) when memory is in short
supply. When processes try to do these things they often sleep and are sometimes uninterruptible.
•
Are cblocks scarce? If so, it could account for the difficulty users may have been having trying to type or
get console echo.
To run WhatHappened do this:
$ kwdb -q4 -p crash_directory_path
...
q4> include whathappened.pl
...
q4> run WhatHappened
or
q4> run WH
The output is printed to stdout and there may be more than a screen’s worth, to redirect it to a file or to a
program like more (1).
Analyze
The Analyze tool is used primarily to analyze crash dumps. It can also be run on live systems.
Run it like this:
$ kwdb -q4 -p crash_directory_path
...
q4> include analyze.pl
...
q4> run Analyze
The output is printed to stdout and there will almost certainly be more than a screen’s worth, redirect it to a
file or to a program like more (1).
When run as shown above (without options) get the following information:
•
Brief system description (uname -a)
•
System uptime
•
System load averages (1, 5, and 15 minutes)
•
Console message buffer
•
VM tables
•
VM values
•
VM stats
•
Processes (including the text of the command, most process structure fields, and a stack trace)
Chapter 7
219
KWDB PERL Programming Reference
Running Scripts
The command syntax is run Analyze [options] where options is any combination of A, M, P, or U. Adding
options adds information:
Option A
•
Many kernel global variable addresses
•
The crash processor table
•
The crash event table
•
The registers from the processor that crashed
•
Stack trace of the processor that crashed
•
Per-processor information
Option M
•
The mounted filesystems
•
The file table
Option P
•
Process vas’
•
Process pregions
•
Process regions
Option U
•
Various per-process user area fields
•
The per-process user credentials
The options can be combined as in the following equivalent examples:
q4> run Analyze UAP
...
q4> run Analyze U A P
...
Analyzing with UAP options is very time consuming, and the output generated is very large.
220
Chapter 7
KWDB PERL Programming Reference
Perl Shell Interface for KWDB
Perl Shell Interface for KWDB
Starting from kwdb-3.1.5, a Perl Shell Interface has been added to kwdb. This provides a shell-based interface
wherein the user can execute shell commands as well as kwdb commands from a single user interface prompt.
Perl Shell is basically free software available from the internet. It provides an extensible shell-based
interface. The kwdb commands have been added to this interface, and this enables the kwdb commands to be
run directly from within this shell-based interface.
The Perl Shell interface can be started using:
# kwdb -P crash-dump-directory>
[..]
q4>ls
/dump1/dumps/ia/crash.1
q4>load proc_t from proc_list next p_factp max 10
loaded 10 struct procs as a linked list stopped by max count
q4>
As can be seen from the above, the shell command ls and the kwdb command load are both executed from
the kwdb q4 prompt which in fact represents the perl shell prompt. The perl constructs can be used at the q4
prompt as shown below.
q4>sub myload {
‘load kthread_t from kthread_list next kt_factp max 10‘
‘print -tx kt_tid‘
}
q4>myload
loaded 10 struct kthreads as a linked list stopped by max count
<thread id’s of 10 kthreads starting from kthread_list and with the next pointer as
kt_factp>
q4>
As can be seen from the above, the keyword sub is a perl construct used to define a procedure. So myload is a
perl procedure defined at the perl shell prompt. This procedure uses the kwdb load and kwdb print
commands. Once the procedure is defined it can be invoked from within the perl shell just by mentionng the
name of the procedure ( in the same way any perl procedure is called ).
Existing perl scripts can be included using the include command as before
#kwdb -P <dump-directory-name>
[..]
q4>include analyze.pl
loaded analyze.pl
q4>Analyze
[ output of analyze function ]
q4>
Chapter 7
221
KWDB PERL Programming Reference
Perl Shell Interface for KWDB
As can be seen in the -p mode, to run a perl procedure the run command needs to be executed followed by the
procedure name. In the Perl shell mode, there is no need to give the run command. The procedure can be
invoked directly by referring to the name of the procedure.
222
Chapter 7
KWDB PERL Programming Reference
Writing Scripts
Writing Scripts
Stealing from existing PERL scripts programs is probably the best way to learn to write new ones. Still, there
are things that need to be known that may not be well documented in the scripts. Some of these things are
covered here including a style guide.
Basic Program Operation
PERL programs do their work by conversing with KWDB just as the interactive user does. The program sends
KWDB commands, receives the response and acts on what happens. It returns control to the user when it’s
done it’s job.
This back and forth communication is fairly primitive so the program must at all times make sure it reads
KWDB’s response completely. If it doesn’t PERL and KWDB will get out of sync. This usually results in
confusing behavior. Fortunately it’s easy to avoid this. There is a whole library of supplied routines to make
PERL/KWDB communications easy and painless. Most of these routines are in a file called q4.pl present in
every version of the scripts. These routines will be loaded during PERL start up.
The functions are grouped into:
•
“Communicating With KWDB”
•
“Scripts That Implement Q4 Commands”
•
“Output Formatting”
•
“Interruption Handling”
•
“Fields, Values and Expressions”
•
“Miscellaneous”
•
“Style Guide”
Communicating With KWDB
These routines manage the communications link between PERL and KWDB. They help send commands and
receive the response.
•
Send
Send transmits a line of text to KWDB as if the user typed the command.
For example, these two are equivalent:
q4> load -r struct proc from proc max nproc
and
&Send("load -r struct proc from proc max nproc");
To keep PERL and KWDB in sync with each other every Send should be followed by one call to either
TossResponse or PrintResponse or the proper number of calls to Receive. If wrong, the program will not
work.
Send is defined in q4.pl.
•
Receive
Receive gets one line of response from KWDB.
Chapter 7
223
KWDB PERL Programming Reference
Writing Scripts
The newline at the end of the line is automatically removed. Receive returns undef if there is no more
text to read from the current response.
For example,
&Send(“load struct proc from proc_list”);
$result = &Receive();
$more = &Receive();
might set the PERL variable $result to “loaded 1 struct proc as an array (stopped by max count)”.
The PERL variable $more would be set to undef because the load command only returns one line of
output.
Always continue to call Receive until it returns undef. Each line of response text that KWDB returns
must be answered with a call to Receive. If it isn’t, PERL and KWDB will get out of sync. Think of
KWDB’s output stream as containing a marker indicating where each response ends. This is how Receive
knows when to tell that there is no more text in the response. These virtual markers must have a
corresponding Receive or there will be trouble.
Receive is defined in q4.pl.
•
TossResponse
TossResponse reads an entire response from KWDB and throws it away.
This is most useful when issuing a command and are not interested in what KWDB has to say about it.
For example,
&Send("q4PrintOctal = 0"); # don’t want octal output
&TossResponse();
TossResponse is defined in q4.pl.
•
PrintResponse
PrintResponse reads an entire response from KWDB and prints it.
This is most useful when the program is not interested in a command’s output but the user is.
For example,
&Send("trace event 0");
&PrintResponse();
# trace the first crash event
If PrintResponse is passed a string argument that string is prepended to every line of output in the
current response. This is most often used to make the output a little more readable.
For example,
print(STDOUT ’Stack Trace:\n’); # print the title
&Send("trace event 0"); # trace the first crash event
&PrintResponse(’ ’); # indent a little for readability
PrintResponse is defined in q4.pl.
•
PushPrintFlag and PopPrintFlag
Output from PrintResponse can be turned on and off at will with PushPrintFlag and PopPrintFlag.
&PushPrintFlag(1) turns printing on and &PushPrintFlag(0) turns it off. &PopPrintFlag() restores it
to the setting in use before the previous call to PushPrintFlag.
Mostly used to temporarily disable printing in some routines that don’t implement controls of their own.
PushPrintFlag and PopPrintFlag are defined in q4.pl.
224
Chapter 7
KWDB PERL Programming Reference
Writing Scripts
Scripts That Implement Q4 Commands
There are many routines which implement Q4 commands and are convenient wrappers for common
operations. All these routines are applicable in KWDB as well.
•
Evaluate
Evaluate sends an expression to KWDB for evaluation. The answer is always returned in decimal
regardless of the settings of any KWDB control variables (depending on the expression, the answer may
still be a 64 bit number, however).
For example,
$bytes = &Evaluate("sizeof(struct proc)"); # size of a process structure
Evaluate is defined in misc.pl.
•
Examine
Examine sends an examine command to KWDB for evaluation.
The first argument is an expression that evaluates to the starting address. The second is an examine
format string.
The first line of the response is separated at the whitespace and the parts are returned as an array. Any
lines in the response after the first are discarded.
For example,
@loadAverage = &Examine(’&avenrun’, ’3F’); # get the load averages
Examine is defined in misc.pl.
•
Forget
Forget sends a forget command to KWDB.
The argument is a pile history reference.
The response from KWDB is discarded.
Forget is most useful in utility routines that disturb the history list in some strange way. Routines that
only add piles they are going to remove before they return can use PushHistory and PopHistory. For
those routines that need to leave one or more piles in the history and clean up the rest Forget is the best
choice.
For example,
&Forget(-1); # forget the previous pile
Forget is defined in misc.pl.
•
Keep
Keep sends a keep command to KWDB.
The argument is a boolean expression.
Keep returns the number of items kept or -1 if the command fails for some reason.
For example,
&LoadAllProcesses();
$n = &Keep(’p_stat!=0 && p_pid==10’); # find some process
if ($n==-1) {
# something went wrong
...
Chapter 7
225
KWDB PERL Programming Reference
Writing Scripts
}
else if ($n==0) {
# no matches
...
}
else if ($n==1) {
# got it
...
}
else {
# got several
...
}
Keep is defined in misc.pl.
•
Load
Load sends a load command to KWDB.
The argument is a load command. Load returns the number of items loaded or -1 if the command fails for
some reason.
For example, load the process table:
if ((&Load(’struct proc from proc_list next p_factp max nproc’)) == -1) {
# load failed
...
}
For example, load the process table entry at the location indicated by the PERL variable $procp:
if ((&Load(“struct proc from $procp max 1”)) == -1){
# load failed
...
}
In this example note the switch from single quotes to double quotes. The double quotes allow for PERL
variable substitution within the string, the single quotes don’t.
Load is defined in misc.pl.
•
NameIt
NameIt sends a name it command to KWDB.
The argument is the nickname to assign to the current pile.
NameIt returns 1 if it succeeds, 0 otherwise.
For example,
&LoadAllProcesses();
if (!&NameIt(’AllProcesses’)) {
# it didn’t work
...
}
NameIt is defined in misc.pl.
•
PushHistory and PopHistory
PushHistory and PopHistory send pushhistory and pophistory commands to KWDB, respectively.
Neither function takes an argument.
226
Chapter 7
KWDB PERL Programming Reference
Writing Scripts
Neither function returns a value.
They are most often used to bracket the code in utility routines that create new piles that will need
cleaning up before the routine returns. se Forget, but more often than not it’s possible (and easier) to
throw it all away with a single sweeping gesture.
For example,
&PushHistory();
# do some things that may leave unwanted piles on the history list
&PopHistory();
PushHistory and PopHistory are defined in misc.pl.
•
RecallByName
RecallByName sends a recall command to KWDB.
The argument is a pile history reference.
RecallByName returns 1 if the pile was recalled, 0 if something went wrong.
For example,
if (&RecallByName(’AllProcesses’)) {
# got it
...
}
RecallByName is defined in misc.pl.
Output Formatting
These routines help format output in a number of useful ways.
•
Adjust
Call it just like calling printf, but it produces output like adjust (1).
Each line of output is broken into pieces at the whitespace. Each piece is added to the current output line
until that line would be too long. At that point the current line is flushed and a new line is begun. This
makes it easy for a program to print paragraphs of prose that contain items of variable length (like
numbers and string extracted from the dump) without having to do a lot of gymnastics to keep the output
readable.
For example,
&Adjust(“The statdaemon hadn’t run in over %s
(1 second is
normal).”,
&Elapsed(($ticks_since_boot-$p_lastrun_time)
/$hz, ’%.2f’));
if ($nRTProcesses) {
&Adjust(“At least %d real-time process%s ran”.
“ since the last time the statdaemon ran.”,
$nRTProcesses,
&Plural($nRTProcesses, ’’, ’es’));
}
else {
&Adjust(“No real-time processes can be *proven*”.
“ to have been running during this time.”);
}
Chapter 7
227
KWDB PERL Programming Reference
Writing Scripts
&Adjust(“They are probably monopolizing all of the”.
“processors since at least”.
“ one of them has run recently on every processor.”.
“ This may account for what looked like a hang.\n\n”);
might produce
The statdaemon hadn’t run in over 1.02 minutes (1 second is normal). At least 2 real-time
processes ran since the last time the statdaemon ran. They are probably monopolizing all of
the processors since at least one of them has run recently on every processor. This may
account for what looked like a hang.
Adjust is defined in adjust.pl.
•
OpenTable, AddToTable, CloseTable and PrintTable
The routines OpenTable, AddToTable, CloseTable and PrintTable provide a simple mechanism for
printing primitive tables.
In the context of these routines a table is defined as a two dimensional array of items printed on the page.
The sequence of operations is as follows:
1. Call OpenTable to start a new table. The first argument will be a printf format string used to print
each table cell. The second argument will be a separator to print between each cell on a line. The third
argument will be the number of columns to print on each line. (The last line of the table is allowed to
have fewer cells.)
2. Call AddToTable for each cell wanted in the table. The entries will be added left to right, starting with
the first row and proceeding down. The first argument is the label for the cell. The second argument is
the value for the cell.
3. Call CloseTable once everything added in the table. It will flush the current line and clean up.
NOTE
Only have one table open at a time.
Use OpenTable, AddToTable and CloseTable make sure the table isn’t too wide for the page. It will work
even if wrong, but the lines may wrap or be truncated. For fully automatic table printing, use
PrintTable.
PrintTable takes two arguments; a list of cell labels and a list of cell values. It scans them all choosing a
format string and number of columns that will accommodate a typical screen. Then it prints the entire
table (the cell values are printed in hex).
OpenTable, AddToTable, CloseTable and PrintTable are defined in tables.pl.
•
PrintFields
PrintFields takes a list of field names referring to the structure(s) in the current pile and prints a table
of the specified fields (names and value in hex).
NOTE
Only the first structure in the current pile is printed.
PrintFields is defined in tables.pl.
•
PrintExprs
PrintExprs takes a list of expressions and prints a table of the expressions and their values (in hex)
PrintExprs is defined in tables.pl.
228
Chapter 7
KWDB PERL Programming Reference
Writing Scripts
Interruption Handling
Interrupting PERL programs via keyboard generated signals (SIGINT) is supported as long as care is taken to
keep KWDB and PERL in sync with each other. Here’s how it works.
•
Interrupted
When sending a keyboard interrupt, it is received by both KWDB and PERL. KWDB stops what it’s doing
and sends a message to PERL saying it’s done with the current request. PERL notes the signal and
resumes it’s work. As soon as Receive sees this end marker it raises an exception that will abort the
current operation and return control to the main loop.
If doing something time consuming in PERL and don’t expect to call Receive anytime soon consider
calling Interrupted periodically to check for interrupts.
Interrupted takes no arguments. It returns 1 if there is a keyboard interrupt pending, 0 otherwise.
Keyboard interrupts are cleared automatically when execution returns to the main loop for another user
command.
For example, suppose the code is doing something from a loop that could take a while but it’s all right to
abort if interrupted. Put something like this in the loop:
die ’interrupted’ if &Interrupted();
Interrupted is defined in q4.pl.
Fields, Values and Expressions
These routines help get structure fields and evaluate expressions.
•
GetFieldsDec/GetFieldsHex
GetFieldsDec gets the value of one or more specific fields from the current pile. The arguments are the
names of any fields in the structure underlying the current pile. The GetFieldsDec routine gets the
values in decimal (%#lld) format. The GetFieldsHex routine behaves similarly to GetFieldsDec except
that the values are in hex (%#llx) format.
If GetFieldsDec or GetFieldsHex is called with more than one argument, the return value is an array of
values, one for each field requested from the first structure in the current pile. They are returned in the
same order they appear in the argument list.
For example, get the process ID, parent process ID, process group ID and session ID of the process just
fetched:
($pid, $ppid, $pgrp, $sid) = &GetFieldsDec(’p_pid’, ’p_ppid’, ’p_pgrp’, ’p_sid’);
or
($pid, $ppid, $pgrp, $sid) = &GetFieldsDec(’p_pid p_ppid p_pgrp p_sid’);
If GetFieldsDec or GetFieldsHex is called with one argument the return value is an array of values,
one for every structure in the current pile. They are returned in the same order they appear in the pile.
For example, print all of the process ID’s in use:
&LoadAllProcesses();
@pids = &GetFieldsDec(’p_pid’);
for $pid (@pids) {
print(STDOUT $pid, “\n”);
}
GetFieldsDec and GetFieldsHex are defined in misc.pl.
Chapter 7
229
KWDB PERL Programming Reference
Writing Scripts
•
GetAllFieldNames
GetAllFieldNames returns an array naming every field in the structure underlying the current pile.
It takes no arguments. The field names are returned in the order they are defined in the structure. The
list of field names includes the synthetic fields defined by KWDB.
For example, print all of the fields in the current structure:
@fields = &GetAllFieldNames();
for $field (@fields) {
print(STDOUT $field, “\n”);
}
GetAllFieldNames is defined in misc.pl.
•
GetAllFieldValues
GetAllFieldValues returns an array of every value in the structure underlying the current pile.
It takes no arguments. The field names are returned in the order they are defined in the structure. The
list of field values includes the synthetic fields defined by KWDB. The values match the field names
returned by GetAllFieldNames one-for-one.
GetAllFieldValues only supports piles containing a single structure. Its behavior on piles containing
several structures is not defined.
For example, print all of the fields in the current structure:
@values = &GetAllFieldValues();
for $value (@values) {
print(STDOUT $value, “\n”);
}
GetAllFieldValues is defined in misc.pl.
•
GetSymbolicField
GetSymbolicField gets the symbolic value of one specific field from the first structure in the current pile.
The argument is the name of the field in the structure underlying the current pile. The return value is the
symbolic value of the field requested. This is most useful for enumerated types. (The value returned for
nonenumerated types will be numeric.)
For example, get the process state of the process just fetched:
$state = &GetSymbolicField(’p_stat’);
If p_stat==3, this would return SRUN.
GetSymbolicField is defined in misc.pl.
•
GetValues
GetValues evaluates one or more expressions and returns their values.
The arguments are one or more expressions. The return value is an array of the values of each of the
expressions (returned in the same order as the expressions appear in the argument list).
For example, find out how many processors the system had and what the per-user process limit was:
($numCPUs, $perUserLimit) = &GetValues(’runningprocs’, ’maxuprc+1’);
GetValues is defined in misc.pl.
230
Chapter 7
KWDB PERL Programming Reference
Writing Scripts
Miscellaneous
These routines provide miscellaneous, but frequently used services.
•
Include
Include is used to bring in additional PERL code from another file. It takes the name of the file as its
argument.
Include mimics the PERL built-in require in two ways:
— If the filename is not rooted the directories named in the array @INC are searched to find the file.
— The file is not read a second time if it has already been Included.
Include differs from require if the file has been modified since it was last Included. In that case it will
be read again. This means staying inside KWDB while making changes to a script in another window.
For example, include the process handling library:
&Include(’processes.pl’);
Include is defined in q4.pl. Don’t include anything to use it.
If there is a syntax error in the file, will not get any diagnostic, but if a print command is added at the end
of the script, outside the scope of all the functions defined, PERL will execute that statement when the
script is included successfully.
print "loaded YourNameHere.pl\n";
•
Elapsed
Format an amount of time in an easy to read format.
The first argument is the amount of time (in seconds). The second argument is a printf format string for
the numeric part of the result.
Examples:
&Elapsed(5, ’%d’) produces 5 seconds
&Elapsed(60, ’%d’) produces 1 minute
&Elapsed(70, ’%d’) produces 1 minute
&Elapsed(70, ’%.2f’) produces 1.17 minutes
&Elapsed(86400, ’%.2f’) produces 1 day
Elapsed is defined in misc.pl.
•
Plural
Plural takes a value and two strings (a singular form and a plural). If the value is equal to 1, Plural
returns the singular string, otherwise the plural one.
For example, print some number of processes:
printf(STDOUT “There %s %d %s.\n”,
&Plural($processes, ’is’, ’are’),
$processes,
&Plural(ticks, ’process’, ’processes’));
The output might look like this:
There is 1 process.
or
Chapter 7
231
KWDB PERL Programming Reference
Writing Scripts
There are 3 processes.
Plural is defined in misc.pl.
•
Unique
Unique takes an array of values and returns a sorted array of the those same values in which each of the
values appears exactly once (it’s similar to sort -u).
The arguments are one or more arrays of values. The return value is an array of the values sorted in
ascending order with all duplicates removed.
For example, make a list of the process ID’s of processes that have children:
&LoadAllProcesses();
@parents = &Get1Field(’p_ppid’); # make a list of every parent pid
@parents = &Unique(@parents); # lose the dup’s
The Unique step is required in this example because some parent processes may have more than one
child.
Unique is defined in misc.pl.
Style Guide
Here are some hints to help write scripts that are more robust, usable and portable.
General Hints
•
Remember that every Send must be matched by the right number of calls to Receive. Either the script
takes care of it or some routine being called does, but it must be done or PERL and KWDB will get out of
sync and things get very confusing when that happens.
•
Remember that in addition to matching every line of the response with a Receive, the end-of-response
marker must be Received as well. In fact, looking for the end marker is usually the best way to know
when the whole response has been seen.
•
Remember that while KWDB is fairly kernel independent, some scripts may not be.
— As a script user, try to use the scripts that match the kernel that dumped.
— As a script writer, try to make the scripts written handle any version of the kernel (more on this
under the Making Kernel Differences Transparent section).
•
There are two ways to ask KWDB to evaluate expressions. One works better in scripts than the other. To
evaluate expression 1+2, do this:
&Send(’1+2’);
$answer = &Receive();
&TossResponse(); # toss to end of response marker
or this:
$answer = &Evaluate(’1+2’);
The second is preferred partly because it is easier to do but more importantly because the first example
depends on the settings of the variables q4PrintDecimal, q4PrintHex, and q4PrintOctal. (The example
assumes that q4PrintDecimal is on and q4PrintHex and q4PrintOctal are off.) The user has probably set
them according to his preference which may not be what the script expects and tampering with them in the
script means restoring them after they are done or leaving them in a state the user didn’t expect. It’s far safer
and easier to use Evaluate instead.
232
Chapter 7
KWDB PERL Programming Reference
Writing Scripts
Making Kernel Differences Transparent
KWDB solves the reconstruction problem, but leaves the navigation problem to the scripts. This makes
KWDB (mostly) independent of changes to all but a tiny few data structures and algorithms. (See the Kernel
Developer’s Guide for details.) Therefore, one version of KWDB suffices for any kernel.
This means the burden of handling most kernel revision specific changes falls to the scripts. This is an
improvement over the old situation because the scripts are written in a higher level (that is, more power for
less effort) language (PERL vs. C) that doesn’t require recompilation when changes are made. Therefore, as
the kernel changes over time, the user should remember to use the scripts that were delivered with the
version of the kernel that dumped.
But suppose some users forget or mistakenly grab the wrong set of scripts. For most kernel changes it should
be possible to write the scripts so they can handle each of the different cases automatically. Here is an
example.
In older versions of HP-UX, processes were kept in a table which is allocated at boot. Once created it is fixed.
It will never grow (to allow for more processes) or shrink (to save space).
A PERL script fragment to load every process might look like this:
# get the whole process table
&Send(’load struct proc from proc max nproc’);
&TossResponse(); # real routines should check for errors
# keep only the valid entries
&Keep(’p_stat != 0’);
# the “keep” created a new pile, clean up the previous one
&Forget(-1);
If the process table is turned into a linked list, as done in later kernels, process structures could be created
and destroyed at will saving memory when the load was light but still providing for heavy loads.
A PERL script fragment to handle the linked list might look like this:
# get the process list
# (the 1000000 is an upper bound we don’t expect to hit)
&Send(’load struct proc from proc_list next p_factp max 1000000’);
&TossResponse(); # real routines should check for errors
# no need for a “Keep” since the list only contains real processes
# no need for a “Forget” because we only created the pile we want
Now both of these examples are pretty simple, but if a change like this were made in the kernel the user
would have to know which kernel produced the dump to know which script to use. This is a real nuisance and
is error prone besides.
It would be far better if the script was prepared for either kernel. This can be very easy to do if just a little
care is taken making the kernel changes. One such example is introduction of a kernel variable,
dpta_supported, with the introduction of dynamic process table allocation. By looking at the value of
dpta_supported, can tell whether the kernel supports dynamic process table allocation or not.
Here is a replacement for the previous examples that can handle either data structure automatically.
# does this kernel support dynamic process allocation?
local($res) = &Evaluate(“dpta_supported”);
local($dpta);
if ($res =~ /no/) {
Chapter 7
233
KWDB PERL Programming Reference
Writing Scripts
$dpta = 0;
} else {
$dpta = 1;
}
#
#
#
#
the kernel global, dpta_supported, was added so only the
linked list version of the kernel has this variable and we
can use it to differentiate between the two types of kernel
at debug-time.
if ($dpta == 0 ) {
$aplr = &Load(’struct proc from proc max nproc’);
if($aplr <= 0) {
printf( “Fatal error, no processes to load!\n”);
die;
} else {
# keep only the used ones
$aplr = &Keep(’p_stat != 0’);
&Forget(-1);
}
} else { # This is DPTA
$aplr = &Load(’struct proc from proc_list max nproc next
p_global_proc’);
if($aplr <= 0) {
printf( “Fatal error, no processes to load!\n”);
die;
} else {
# keep only the used ones
$aplr = &Keep(’p_stat != 0’);
&Forget(-1);
}
} # end DPTA case
By isolating this knowledge of the data structure in a single routine make the rest of the library of debugging
routines independent of the navigation required to get the data structures. This will pay off down the road
when the data structures change again and have less debugging code to change when the schedule can least
afford it.
234
Chapter 7
8 Command Quick Reference
The most commonly used KWDB commands for kernel debugging are listed here. For a complete list of
commands and details of each command with examples, may use the help command from within KWDB.
KWDB allows partial commands to be entered as long as there is no ambiguity. All address arguments are
virtual addresses unless specified otherwise.
Chapter 8
235
Command Quick Reference
Commands
Commands
The command groups in this chapter are described in the most probable order of use:
Starting KWDB
kwdb [options] kernel_file
Start KWDB on a copy of the target kernel executable file on the host system. Options for all
the Starting KWDB commands are:
-m
Process loaded DLKM modules for debugging
-p
Start KWDB to run PERL scripts
-q4
Start KWDB in Q4 mode
-write
Allow writing into kernel files or memory
-s=SYMFILE
Source symbols from file specified by SYMFILE
kwdb [options] [kernel_file] crash_dump_directory
Start KWDB for crash dump analysis
kwdb [options] kernel_file remote_system:port
Start KWDB for remote crash dump analysis
kwdb [options] kernel_file /dev/[k]mem
Start KWDB for live memory analysis
Further control how KWDB starts by using GDB command line options.
Stopping KWDB
INTERRUPT
Ctrl-c terminate current command, or interrupt target kernel
quit
Exit KWDB; also q or EOF (Ctrl-d)
Getting Help
help
list classes of commands
help command
describe command
Attaching and Debugging Targets
attach 0 [target_id]
236
Attach to target:
target_id is:
Console target
Not used
Halfdome SUB/SINC
Partition name
IPF LAN
Ethernet MAC address of target LAN
IPF RS-232
Not used
Chapter 8
Command Quick Reference
Commands
Lantron serial
Not used
NDDB 11.0 or earlier
Ethernet MAC address of target LAN
S700/S800 RS-232
Not used
S700/S800/V-Class LAN
Ethernet MAC address of target LAN
UDP connection
Not used
detach
release target from KWDB control and allow it to continue
kill
release target from KWDB control and reboot
target console lantron_name:20nn
Debug using the on-console debugger and KWDB via the remote console. nn is the port
number for the remote console
target crash crash dump
Specify that the target is a crash dump. The attach command is not used with this target.
target devmem
KWDB runs on the target system and debugs live memory using /dev/mem or /dev/kmem.
The attach command is not used with this target.
target ia64_kern comm_server[:47001]
Set up LAN-based debugging via KWDB server on comm_server for IPF architecture.
target serial devicefile
Set up RS-232-based debugging via specified serial device file.
target lantron_serial lantron_name:30nn
Set up Lantron serial debugging. nn is the serial port on the target system.
target nddb -h comm_server -t ethernet_address
Debug an 11.0 or earlier kernel using nddb compatibility mode.
target pa_kern comm_server[:47001]
Set up LAN-based debugging via kwdbd server on comm_server for PA-RISC architecture.
target sub name_of_sub:[:47001]
Set up Superdome/Matterhorn/Keystone/Orca debugging via SUB/SINC.
target udp ip-address
Set up udp-based debugging. ip-address is the IP address of the target.
Breakpoints
b[reak] [file:] line
Set breakpoint at line number [in file]
break [file:] func
Set breakpoint at function func [in file]
break *addr
Chapter 8
237
Command Quick Reference
Commands
Set breakpoint at address addr
break
Set breakpoint at next instruction
break [location]if expr
Break conditionally on nonzero expr at next instruction (or location specified as line or
address or function)
break [location]thread thread_id
Break conditionally on thread number specified by thread_id at the location specified as line
or address or function
hbreak [file:] line
Set hardware breakpoint at line number [in file]
hbreak [file:] func
Set hardware breakpoint at function func [in file]
hbreak *addr
Set hardware breakpoint at address addr
hbreak
Set hardware breakpoint at next instruction
hbreak [location]if expr
Break (hardware breakpoint) conditionally on nonzero expr at next instruction (or location
specified as line or address or function)
hbreak [location]thread thread_id
Break (hardware breakpoint) conditionally on nonzero expr at next instruction (or location
specified as line or address or function)
clear
Delete breakpoints at next instruction
clear [file:] func
Delete breakpoints at entry to func()
clear [file:] line
Delete breakpoints on source line
commands n [silent] command-list end
Execute command-list every time breakpoint n is reached
cond n [expr]
New conditional expression on breakpoint n; make unconditional if expr is omitted
delete [n]
Delete breakpoints [or breakpoint n]
disable [n]
Disable breakpoints [or breakpoint n]
238
Chapter 8
Command Quick Reference
Commands
enable [n]
Enable breakpoints [or breakpoint n]
ignore n count
Ignore breakpoint n, count times
info break
Show breakpoints and watchpoints
info module addr
Show the module to which a given address belongs. The address may belong to the text or
data segment of the module
info func func-name
Show all the inlined instances of the function func-name along with the places where this
function is inlined along with the line numbers in the caller where this function is inlined.
info target
Gives detailed information about the target to which kwdb is attached.
tbreak … [args]
Like break command except the breakpoint is temporary; disabled when reached. It accepts
args as in break command.
watch *addr
Set watchpoint at address addr - by default; four bytes will be watched
watch name
Set watchpoint at global symbol specified by name
watch name length length
Set watchpoint starting from address corresponding to the symbol indicated by the name to
address + length
watch_target addr
This command takes addr as a pointer and puts a watchpoint on the target of that address.
Kernel Stack
backtrace [n], bt [n]
Trace all frames in stack; or of n frames – innermost if n<0, outermost if
n>0
down n
Select frame n frames down
frame [n]
Select frame n or frame at address n; if no n, display current frame
info all-reg
Display all registers including floating point registers (not supported in
PA-RISC architecture)
info args
Arguments of selected frame
info frame [addr]
Describe selected frame, or frame at addr
info locals
Locals of selected frame
info reg [rn]
Register values [for reg rn] in selected frame
Chapter 8
239
Command Quick Reference
Commands
up n
Select frame n frames up
Execution Control
call function(arg1, arg2,...arg8)
Call function with up to eight 64-bit sized arguments
continue [count]
Continue running; if count specified, ignore this breakpoint count times
finish
Run until current function returns
jump *address
Resume execution at specified address
jump line
Resume execution at specified line number
next [count]
Like step command but do not step into functions
nexti [count] ni [count]
Like stepi command but do not step into functions
return [expr]
Pop selected stack frame without executing [setting return value]
set var = expr
Evaluate expr without displaying it; use for altering kernel variables
step [count] s [count]
Execute until another source line is reached; repeat count times if
specified
stepi [count], si [count]
Step by machine instructions rather than source lines
until [location]
Run until next instruction (or location specified as line or address or
function)
Display
disassem [addr]
Display memory as machine instructions for the function at addr
disassem [func]
Display memory as machine instructions starting at function func
disassem filename:[func]
Display memory as machine instructions starting at function func present
in the file filename.
print [/f] [expr]
Show value of expr [or last value $] according to format f:
x [Nuf] expr
a
address, absolute and relative
c
character
d
signed decimal
f
floating point
o
octal
t
binary
u
unsigned decimal
x
hexadecimal
Examine memory at address expr; optional format specs are:
N
count of how many units to display
u
unit size; one of
b — individual bytes
g — giant words (eight bytes)
240
Chapter 8
Command Quick Reference
Commands
h — half words (four bytes)
w — words (four bytes)
f
printing format. Any print format, or
i — machine instructions
s — null-terminated string
Automatic Display
disable disp n
Disable display for all expression(s) or one or more expressions specified
by list number.
display [/f] expr
Show value of expr each time kernel stops [according to format f listed
with x command]
display
Display all enabled expressions on the list created with display command.
enable disp n
Enable display for all expression(s) or one or more expressions specified by
list number.
info display
Numbered list of display expression(s)
undisplay n
Remove all or one or more expressions specified by list number from list of
automatically-displayed expressions
Expressions
expr
An expression in C or any language supported by the WDB code base, or:
addr@len
an array of len elements beginning at addr
file::nm
a variable or function nm defined in file
(type)addr
read memory at addr as specified type
$
Most recent displayed value
$_
last address examined with x
$__
Value at address $_
$n
nth displayed value
$var
Convenience variable; assign any value
$$
Displayed value previous to $
$$n
nth displayed value back from $
Symbol Table
info var [regex]
Show names, types of global variables (all, or matching regex)
info address s
Show where symbol s is stored
info func[regex]
Show names, types of defined functions (all, or matching regex)
ptype [expr]
ptype type
Describe type, struct, union, or enum
whatis [expr]
Show data type of expr (or $) without evaluating
Chapter 8
241
Command Quick Reference
Commands
Source Files
dir names
Add directory names to front of source path
dir
Clear source path
forw regex
Search following source lines for regex
info line num
Show starting, ending addresses of code for source line num
info source
Show name of current source file
info sources
List all source files in use
list
Show next ten lines of source list
list -
Show previous ten lines
list f,l
From line f to line l
list lines
Display source surrounding lines, specified as:
*addr
line containing addr
[file:]num
line number [in named file]
[file:]func
beginning of function [in named file]
+off
off lines after last printed
-off
off previous to last printed
rev regex
search preceding source lines for regex
show dir
show current source path
DLKM Commands
catch load [modname]
Stop on loads of module modname. If modname omitted, catch all loads.
catch unload [modname]
Stop on unloads of module modname. If modname omitted, catch all unloads.
info sharedlibrary
Display information about loaded modules
path directory
Add directory to search path for kernel modules
tcatch load [modname]
Like catch but temporary — deleted when hit. If modname omitted, catch
all loads.
tcatch unload [modname]
Like catch but temporary — deleted when hit. If modname omitted, catch
all unloads.
uncatch load [modname]
Do not catch load for modname. If modname omitted, do not catch any loads.
uncatch unload [modname]
Do not catch unload for modname. If modname omitted, do not catch any
unloads.
Special Kernel Debugging Commands
cpu select n, cs n, set cpu n
Select CPU #n as the viewed CPU.
set crash event n
Set crash event n as current context, n is the index of event in crash event table.
242
Chapter 8
Command Quick Reference
Commands
set kwdb cache [on|off]
Turn memory caching on or off.
set kwdb controlregs [on|off]
Enable/disable display of IPF control registers.
set kwdb floatregs [on|off]
Enable/disable display of IPF floating point registers.
set kwdb log [on|off]
Set logging of KWDB output to file kwdb-log.
set kwdb logfile name
Change name of log file from kwdb-log to name.
set kwdb memory_cache number
Set number of pages for caching memory read from crash dump. Default is 10007 pages.
set kwdb ntimeout number
Set number of retries for remote network I/O.
set kwdb performanceregs [on|off]
Enable/disable display of IPF performance registers.
set kwdb remotelog [on|off]
Log data packet communications to and from the target to file kwdb-remote-log for support
purposes.
set kwdb q4 [on|off]
Set KWDB to q4 mode or turn q4 mode off.
set kwdb spaceid sid
Set virtual space ID for memory access.
set kwdb timeout number
Set timeout for remote network I/O in tenths of seconds.
set kwdb pile-cache-dir directory
Set the directory for storing the pile objects in kwdb.
set kwdb pile-cache-limit number
Set the limit on the number of structures in the piles, exceeding which the pile object will be
written to the file.
set kwdb recursive-backtrace [on/off]
Enables printing of stacktraces of recursive (inlined or non-inlined) functions.
set kwdb pile-memory-limit <number>
Set the maximum limit for in-memory storage of piles (in bytes)
set kwdb ttyoutput [on|off]
Set terminal output on/off.
Chapter 8
243
Command Quick Reference
Commands
set print strings [on|off]
Control printing of strings referenced by character pointers.
set thread addr
Set thread with given address addr as current context. To find out what threads are
running on the target system, use the info threads command.
Q4 Commands
Some of the q4 commands are prefixed with q4 because the same commands exist in KWDB with different
behavior. If KWDB is run in q4 mode, this prefix is not required.
adddebug file
Add type information from an object file file.
addmodule modname
Process the DLKM module modname for debugging.
catalog [-h] regex
Print cataloged types matching regex.
-h
option to print header even if output is redirected.
code [-o] [name|addr], disassemble [name|addr]
Prints the assembly code for function name or function surrounding the address addr.
-o — read from local copy of the kernel file, not from crash dump or remote target.
constant
Print enumerants in symbol table with values.
discard [cond_expr]
Discards structures satisfying a condition cond_expr.
disassemble [name|addr]
Prints the assembly code for function name or function surrounding the address addr.
evaluate expr
Evaluate expression expr, it may contain:
ltor (vaddr)
Get physical address corresponding to the virtual
address vaddr; vaddr can be an expression.
tooffset (long_addr)
Get space of long_addr.
tospace (long_addr)
Move offset of long_addr to space.
var_name = value
Create a variable var_name with value value.
examine [flags] [ addr] [for lines] [using [n] fmt]
Print contents of memory from address addr using the format specified.
244
-o
Flag to read the data from the kernel file and not from the crash dump or
to read from the local copy while doing remote debugging.
-r
Flag to read the memory from given address without translation.
Chapter 8
Command Quick Reference
Commands
addr
Start reading memory from the value of addr, addr can be an expression.
If not given, use its value from previous run.
for lines
To specify how many lines to read; lines can be an expression. If not given,
use value from previous run. Default value is 1.
using [n] fmt
Print n items per line as per format specified by fmt, which can be any of
the following characters:
^
Decrement address by the current increment (that is, back up over the previous value retrieved),
nothing is printed.
+
Increment address by one, nothing is printed.
-
Decrement address by one, nothing is printed.
a
Print the value of dot as a symbolic kernel address, address is not incremented.
A
Print the value of dot as a decimal number, address is not incremented.
b
Print a byte in hex, increment address by one.
B
Print a byte in octal, increment address by one.
c
Print a character, increment address by one.
C
Print a character with backslash escapes to make it readable, increment address by one.
d
Print a half-word in decimal, increment address by two.
D
Print a word in decimal, increment address by four.
f
Print an IEEE float, increment address by four.
F
Print an IEEE double, increment address by eight.
i
Print an instruction, address is incremented by size of instruction.
I
Print a bundle of instructions, address is incremented by size of a bundle.
L
Print 64 bit in hex, address is incremented by eight.
o
Print a half-word in octal, increment address by two.
O
Print a word in octal, increment address by four.
P
Print the word dot points to as a symbolic kernel address, increment address by four.
s
Print a string, increment address by the length of the string (including the trailing null character).
S
Print a string with enough backslash escapes to make it readable, increment address by the length
of the string.
u
Print a half-word in unsigned decimal, increment address by two.
U
Print a word in unsigned decimal, increment address by four.
x
Print a half-word in hex, increment address by two.
X
Print a word in hex, increment address by four.
Y
Print a word as a date and time string, increment address by four (see ctime (3C).
Chapter 8
245
Command Quick Reference
Commands
expr
Evaluate expression expr (in KWDB q4 mode only)
fields [flags] [struct|union] type
Listing fields in type in format specified by following flags:
-c
Option to print fields in C style.
-h
Option to print header even if output is redirected.
-v
Print fields with offset and size in C style.
-x
Option to expand any embedded structures in C style.
find [-r|-o] value [from addr|until addr|max num|mask pattern]
search a value in kernel file. Options -o and -r have the same meanings as in the examine
command.
forget [num |-num|name]
delete current pile or a pile specified by:
num
num as the pile number
-num
num piles before the current pile
name
the pile name
getasm [args]
Prints assembly code using external disassembler.
help q4
Prints list of q4 commands.
help q4 cmd
Prints help message for q4 command cmd.
history
Print the history of loaded data structures.
include file
Load PERL script from file.
keep [cond_expr]
Selects structures satisfying a condition cond_expr.
load [-r] [type] from addr [max expr |skip expr] next next_field | until addr]
Reads a collection of structures:
246
-r
Option to read the structures without address translation.
type
Type of the data structure to read; if the type is not given, will use type of
addr if available.
from addr
Start reading structures from the value of addr; addr can be an
expression.
max expr
Read at most expr number of structures.
skip expr
Skip expr number of structures before starting to read.
Chapter 8
Command Quick Reference
Commands
next next_field
Name of the field in the structure which points to the next structure in a
linked list.
until addr
Read structures until addr is reached; addr can be an expression.
merge [num |-num |name]
Merge data from a pile, specified by argument as in forget command, to current pile.
modules
Prints details of currently loaded DLKM modules.
name it [num |-num|name], call it [num |-num|name]
Name the current pile or the pile specified with name.
pileon [type] from field
Read structures of type from values of field from current pile.
pophistory
Pop piles marked by last pushhistory.
pushhistory
Save state of current pile history for future popping.
q4 print [options] field1 [%fmt],field2 [%fmt], ...]
Print fields in current pile. The options are:
%fmt
Prints numerical value of the field using format %fmt; format characters
for printf can be used in fmt.
-d
Prints integer fields in decimal format.
-h
Turns on column headings even if the output is redirected.
-H
Turns off column headings even if the output is not redirected.
-o
Prints integer fields in octal format.
-t
Prints fields one per line than in multiple columns.
-x
Prints integer fields in hexadecimal format.
q4 print [options] [ type] from addr
Print a structure from the value of addr; addr can be an expression:
options
All the options available for the first form of q4 print command shown
above are valid.
type
Type of the data structure to print; if the type is not given, use type of
addr if available.
from addr
Start printing structures from the value of addr; addr can be an
expression.
q4 run func [args]
Run a PERL script function func [with args].
q4 symbols regexp
Print kernel symbols matching regexp.
Chapter 8
247
Command Quick Reference
Commands
q4 unset var_name
Remove a user defined variable var_name.
recall [num|-num |name]
Make a pile, specified by argument as in forget command above, current pile.
system cmd
Execute shell command cmd.
q4 trace [options] event num
Display stack trace for crash event # num (for crash target only). The options for all the
trace commands are:
-f
Print input, local and output registers for each frame.
-u
Print arguments for each level and registers for first level.
-v
verbose
Output of the trace commands can be controlled by setting following q4
variables:
q4PrintArgs
Print arguments for each level and registers for first
level.
q4UnwLevel
Start unwinding stack from the level set by q4UnwLevel.
q4MaxStackDepth Maximum number of levels displayed during stack
trace. The default is 250.
q4 trace [options] pc sp
Display stack trace with pc & sp (PA only).
q4 trace [options] pile
Display stack trace for structures from current pile for process, processor, thread and crash
event structures.
q4 trace [options] process at addr
Display stack trace for process at addr.
q4 trace [options] processor num
Display stack trace for processor # num.
q4 trace [options] savestate at addr.
Display stack trace for savestat at addr.
q4 trace [options] thread at
addr
Display stack trace for thread at addr.
Options are:
q4 translate addr
Display page table entry or translation registers used for translating addr.
variables
248
Chapter 8
Command Quick Reference
Commands
Display all user defined q4 variables and values.
write [-o | -r] data at addr {using fmt}
Write the data into the kernel file or memory at address addr using the format specified by
the format character “fmt”. Flags -o or -r have the same meaning as in the examine
command. The fmt characters can be:
Chapter 8
b
write a byte
w
write a half-word (2 bytes)
W
write a word (4 bytes)
L
write a long word (8 bytes)
c
write a character
s
write a string
249
Command Quick Reference
Other Commands and Features
Other Commands and Features
Other HP WDB commands supported by KWDB but not listed in the quick reference include:
•
cd dir
•
define cmd
•
document cmd
•
file [file]
•
pwd
•
set param value (see exceptions)
•
shell cmd
•
show param
•
source script
HP WDB commands not supported by KWDB include:
•
core [file]
•
exec [file]
•
gdb program core
•
handle signal
•
run
•
set args
•
set env
•
signal
•
throw | exec | fork | vfork]
•
tty
HP WDB features also supported by KWDB that are not discussed in detail here are:
•
The csh like history substitution.
•
The Emacs style and vi style inline editing of commands.
•
Storage and recall of command history across debugging sessions.
•
User defined commands, command hooks, and command files.
250
Chapter 8
9 Troubleshooting
This chapter contains information to help recognize and resolve some common problems encountered when
debugging remote targets and when running KWDB with PERL. At the end of this chapter, there is a list of
error messages and the corresponding corrective actions recommended for each error message.
Chapter 9
251
Troubleshooting
Problems While Debugging Remote Targets
Problems While Debugging Remote Targets
❏
Networking services fail to start at system startup on a target being debugged via LAN communications.
The most common cause of this problem is that the LAN interface used for KWDB communication is also
configured for HP-UX networking. See Chapter 2, “Setting Up KWDB for Remote Debugging,” for more
information.
❏
KWDB cannot connect to the target. Check all of the following:
— On the target, verify the correct boot flags were used to boot the kernel.
Verify that target waits for a KWDB connection at boot time (if booted with boot-and-wait flags
appropriately). The target should print waiting for kwdb to attach, or for older kernels it will
hang after the size and start address line is printed and not proceed until you resume execution
after connecting with KWDB.
If the target boots up without waiting for a KWDB connection, it may mean that the hpux -f flag
value is incorrect for PA or that the flag value is incorrect for IPF. It may also mean that no LAN or
RS-232 device was found that may be used for KWDB communications. See Chapter 2, “Setting Up
KWDB for Remote Debugging,” for information on what devices are needed.
— Verify the correct communications link information is specified to the host debugger.
For RS-232 communications, verify the proper serial device on the host is selected. The default serial
device used on the host is /dev/tty1p0; if you have connected the RS-232 cable to a different serial
port you must specify the correct device file.
For LAN communications, verify that the correct hostname, where the kwdbd communications server
executes, has been entered, and that the correct Ethernet station address has been entered.
— Verify the communications link is correct.
For RS-232, verify the correct cables are connected to the correct ports. See Chapter 2, “Setting Up
KWDB for Remote Debugging,” for more information.
For LAN, verify the kwdbd communications server is executing (receive a connection refused error
if not), that the kwdbd system has a LAN interface that is connected to the same subnet as the target
system, and that kwdbd is configured to manage connections over that LAN interface using the -f
runstring option (normally set in file /etc/rc.config.d/kwdbd). See Chapter 2, “Setting Up KWDB
for Remote Debugging,” for additional information.
❏
Debug information is not present in the kernel file or DLKM module.
Ensure that the modules to generate debug information are actually compiled with the symbolic debug
turned on (-g). For IPF the +noobjdebug flag must also be specified.
If debugging vmunix or a DLKM module, ensure the module in which you are interested is actually loaded
into the kernel. Check whether the kernel or DLKM module you are debugging has been stripped of
debug info using different utilities depending on whether you are debugging a PA or IPF system. On PA,
use odump -spaces or odump64 -h on your file. On IPF use elfdump -h. A file with source level debugging
info will contain a $DEBUG$ space (32-bit SOM) or .debug_gntt section (64-bit ELF) on PA and on IPF
will contain a section called .debug. The presence of debug info indicates that the kernel contains some
debug information, but does not necessarily indicate that the debug information includes the routines and
data types in which you are interested. All “debug” flavor kernel builds originally contain some debug
information for use by crash dump analyzer, and so the presence of debug information does not
necessarily indicate that it has successfully compiled the debug info of interest into the kernel.
252
Chapter 9
Troubleshooting
Problems While Debugging Remote Targets
❏
The kernel boots without pausing for a KWDB connection.
Check that the kernel is booted with the appropriate boot flag. Refer to Chapter 3, “Getting Started with
Remote Debugging.”
This may also mean that no LAN or RS-232 device was found that may be used for KWDB
communications. See Chapter 3, “Getting Started with Remote Debugging,” for information on what
devices are needed.
❏
KWDB can not set breakpoints at functions or read variables, complaining that the address cannot be
read. The address looks like an invalid value.
This often means the file has been compiled with incorrect options, such as options that specify
optimization that is incompatible with source level debugging.
❏
Attach to a kernel booted to stop and wait for a client connection does not say the kernel is stopped at
kgdb_break (PA) or kwdb_kern_break (IPF) but reports some other symbol instead.
This often means the versions of the kernel executable files on the host and target systems do not match.
Make sure the kernel file on the host system is for the same build as the kernel file booted on the target.
❏
Ctrl-c does not interrupt KWDB.
The stty setting might not be correct. Make sure that interrupt is defined as Ctrl-c.
Chapter 9
253
Troubleshooting
Problems While Running KWDB with PERL
Problems While Running KWDB with PERL
❏
Customization Issues
Because the PERL extensions to KWDB can be configured in many flexible ways, be aware of the ways
that the system may be custom configured. Here is how to customize KWDB to run PERL scripts.
— Move the Q4 subdirectory out of /usr/contrib/ to the directory of choice. Study the
$Q4_ROOT/bin/set_env script. There the KWDB/Q4 installation can be moved from the default
/usr/contrib/Q4 subdirectory to any directory and change the Q4_ROOT and your PATH env
parameters.
— Install an alternative version of PERL. Set your Q4_PERL_PATH env variable to use the version.
— Use an alternative startup script. Set your Q4_STARTUP_SCRIPT env variable to indicate your desired
startup script.
— Modify the startup script. Change the @INC PERL array. This array should include desired load path
which controls the resolution of use, and require functions in interactive use and in the PERL
scripts and modules. Modify the startup script so the choice of scripts are included and executed as
part of startup.
❏
KWDB does not use the best PERL available on the system.
Verify your Q4_PERL_PATH env variable points to the new PERL installation. If no Q4_PERL_PATH env
variable, KWDB will look first for $Q4_ROOT/bin/perl and if there is no executable at
$Q4_ROOT/bin/perl, KWDB will test for an executable in your path.
❏
KWDB can not find the q4.pl script
Verify that the startup script exists. This file can be specified by the Q4STARTUP_SCRIPT env variable. If
this variable does not exist check the $HOME/.q4rc.pl script. If no $HOME/.q4rc.pl script, check the
/.q4rc.pl script.
An informative message should be received about which subdirectory was searched when KWDB was
trying to access the q4.pl file.
❏
Included script does not work
Check to make sure the script can be processed by PERL with no compile error by running PERL with the
-w option like so: perl -w myscript.pl.
❏
Scripts hang
Here’s how to debug a hanging script.
Trace the dialog between the PERL process and the KWDB process. There is a global variable,
$traceDialog, which can be set to the value of file path. If $traceDialog is defined then every message
sent and received by the PERL process will also be written to that file. There are functions TraceOn and
TraceOff defined in sample .q4rc.pl which can help control tracing. Interactively turn tracing on and
then from another session tail the dialog file while KWDB is processing the script. See the last exchange.
The problem may have to be recreated interactively to understand what is failing. The TraceOn and
TraceOff functions can also be called within a script to build the trace under program control.
It is possible to debug PERL scripts by starting PERL in debug mode. This can be done by invoking
KWDB with the -P option, but install a version of PERL that supports the debugging functionality.
254
Chapter 9
Troubleshooting
Error Messages
Error Messages
These are some of the common KWDB specific warning and error messages. This section is not an extended
list of all gdb error messages.
❏
Bad File Number
This message might occur after issuing the target command when attempting to connect the KWDB
remote client to the target. Usually it means that the KWDB communications server is not running.
Corrective Action: Make sure that the kwdbd program is running on the system selected as the
communications server host.
❏
Can’t Attach to Task
This message might occur after issuing the attach command when attempting to connect the KWDB
remote client to the target.
Corrective Action: For PA-RISC systems it might mean that a kernel is older than 11.0 and need to use
kwdb in nddb compatibility mode.
❏
Can’t Complete Breakpoint Transfer, You’re in Big Trouble Now
This message indicates an internal error in KWDB.
Corrective Action: Contact the HP support representative with a complete description of the target
machine, target kernel and exactly what events occurred prior to getting this message.
❏
Can’t Do That Without a Running Program; Try “break main” “run” First
This message occurs when trying to set a data watchpoint before attaching the program.
Corrective Action: Issue the attach command before setting a data watchpoint.
❏
Couldn’t Construct Load Module Descriptor for Unwinding
This message could occur when first attaching KWDB or when interrupting a running kernel. This
message is sometimes harmless and KWDB will continue to function normally.
Corrective Action: If this message is repeated with each command entered or if the target appears to
hang, contact the HP support representative with a complete description of the target machine, target
kernel and exactly what events occurred prior to getting this message.
❏
Error 14 While Unwinding
This message could have a number of causes and needs to be analyzed on a case by case basis. These are a
few reasons for this message:
— The host and target versions of the kernel or DLKM module don’t match.
Corrective Action: Verify the host and target kernel and DLKM modules match.
— The DLKM module has multiple unwind sections on an IPF system. This could happen if using C++ in
a DLKM module.
Corrective Action: Use the elfdump -h command on the DLKM module and look for the IA64
unwind section. If there is more than one, that is the cause of the problem. This problem will be fixed
in 11.23 and a patch is available for 11.22. Contact the HP support representative to obtain the patch.
— If the message occurs after issuing a step or next command, see if the line or instruction was a
function call. If so, the unwind information in the function might be faulty or missing.
Chapter 9
255
Troubleshooting
Error Messages
Corrective Action: Set a breakpoint immediately after the function call and do a continue rather
than a next or step command.
❏
Kernel module <name> not found. Try adding the directory in which it lives to your path
environment variable.
This message occurs when a load of a DLKM module occurs and the remote KWDB client cannot find a
local copy of the DLKM module.
Corrective Action: Copy the DLKM module from the target to the host system and use the path
command if necessary to specify the directory in which it is located.
❏
KWDB: kdebug_kern_ttrace() kdebug_errno:<number>
This message is sometimes displayed by KWDB when a command was not able to complete properly. The
<number> is usually the standard UNIX errno value. This message can occur when setting a breakpoint
or watchpoint, or accessing registers or memory. The problem is often intermittent and caused by
communication problems between the host and target systems.
Corrective Action: If it persists or if the message is repeated for every command issued, contact the HP
support representative with specific details regarding the target system, target kernel, and exactly what
sequence of commands caused the problem. A KWDB “screenshot” would be helpful.
❏
No Debugging Symbols Found
This message indicates that KWDB did not find any symbolic debugging information in the kernel.
Corrective Action: See Debug information is not present in kernel file or DLKM module in the Problems
While Debugging Remote Targets section.
❏
No Debugging Symbols Found in DLKM Module
This message indicates that KWDB did not find any symbolic debugging information in the DLKM
module.
Corrective Action: See Debug information is not present in kernel file or DLKM module in the Problems
While Debugging Remote Targets section.
❏
Pxdb Internal Warning: Unimplemented gntt kind 256
This message can occur when debugging a DLKM module from a 32 bit PA-RISC system. It is usually
accompanied by many more like it.
Corrective Action: Install patch PHCO_22899 on the target 32 bit system.
❏
Unsupported Feature Number From Remote Stub: <number>
This message means that the version of KWDB that is embedded in the vmunix kernel is newer than the
remote KWDB client.
Corrective Action: Upgrade to the latest version of KWDB to make use of all the features that the
vmunix kernel provides.
❏
Warning: pxdb not found at standard location: /opt/langtools/bin kwdb will not be able
to debug <filename>. Please install pxdb at the above location and then restart kwdb.
Warning: File <filename> not processed by pxdb. No symbolic debugging will be possible
- assembly level debugging only!
This message is issued when KWDB needs to run pxdb utility on a file and is not able to find pxdb in
standard location. The pxdb utility processes PA-RISC symbolic debug information into a form that
KWDB can understand. Without it, only assembly level debugging is possible. This message can occur in
two separate circumstances:
256
Chapter 9
Troubleshooting
Error Messages
1. When KWDB catches a load or unload of a DLKM module. In this case, the <filename> refers to a
temporary version of the DLKM module stored in /var/tmp.
2. When first invoking KWDB on a vmunix kernel file. In this case, the <filename> refers to the vmunix
file.
Corrective Action: As the message suggests, install pxdb at standard location: /opt/langtools/bin. If
the pxdb is in another directory, assign the full pathname of the pxdb executable to the exported shell
variable PXDB (all caps). KWDB will then invoke the version of pxdb defined by the PXDB shell variable. If
this message is issued for the vmunix file, also run pxdb on that kernel manually and restart KWDB (this
will not work for DLKM modules). For DLKM modules, use a version of pxdb that processes 64-bit ELF
files. This message is specific to PA-RISC systems and will not occur when the target system is IPF.
Chapter 9
257
Troubleshooting
Error Messages
258
Chapter 9
10 Guide to Writing KWDB Compatible Code
This chapter describes how to add KWDB support to the kernel and DLKM modules for new data structures
and how to make changes to the kernel without disturbing the existing support for debugging remote systems
and analyzing crash dumps and live systems.
Chapter 10
259
Guide to Writing KWDB Compatible Code
How to Write KWDB Compatible Kernel Code
How to Write KWDB Compatible Kernel Code
This section presents guidelines on how to write code that can be debugged using KWDB, and how to make
changes to the HP-UX kernel that are compatible with KWDB.
If modifying code in the HP-UX kernel, and the existing code contains sections that are #ifdef’d with symbol
KGDB_ON, or references to variables or functions that begin with identifier kdebug_, kgdb_, kwdb_, or rdb_,
then the code in question interacts with KWDB. Discuss any proposed changes to the code with the KWDB
team first to ensure that KWDB continues to function on the target kernel after the changes.
Kernel locations that currently contain KWDB “hooks” include the following:
•
$locore, $ihandler, and $thandler
•
Level 1 (real mode) I/O configuration
•
io_scan operation for various CDIOs
•
Clock interrupt code
•
realmain callouts
KWDB depends on the following functionality:
•
Reading and writing kernel memory.
•
Intercepting interrupts and traps such as I_BRK_INST and I_EXT_INTP. Note that KWDB services
interrupts even during real mode.
•
Interrupting execution of a running kernel, either by polling the communication device during a clock tick
interrupt or through the normal PA EIR mechanism, depending on the device. KWDB’s interrupt is
enabled for all SPL levels except SPL7.
•
Communicating over its communications device at all times. If intervening hardware such as bus
adapters are configured, reconfigured, have coherent I/O turned on, and so forth, KWDB may need to
reconfigure its own communications over the device. Note that KWDB begins communicating during real
mode, even before level 2 I/O configuration during virtual mode.
•
Accessing the save_state_t data structure. If a particular machine register is not saved in the kernel’s
save_state then KWDB reads and writes the register directly, rather than modifying save_state fields.
If the set of registers saved in save_state changes, KWDB may also need to change.
•
Freezing execution of the system for long periods of time without panicking or causing other serious
disturbance to system operation. See Chapter 4, “Command Reference,” for more information.
260
Chapter 10
Guide to Writing KWDB Compatible Code
Adding New Data Structures
Adding New Data Structures
KWDB can manipulate and print any kernel data structure — which appears in the kernel’s symbolic debug
information. This means add support for favorite data structures without having to change KWDB.
What’s Needed
Access to these data structures during debugging is usually through global variables or local variables if at
breakpoint.
In addition to struct’s and union’s KWDB can also handle enum’s. KWDB prints the values of fields declared
as enumerated types symbolically, therefore debugging is easier if fields are declared using enumerated types
rather than int’s and #define’s.
Adding a New Data Structure
Here is the simple recipe for adding a new data structure:
1. Create a source file for your subsystem or driver’s KWDB debug information. It should be a real source
file (foo.c), not a header (foo.h). If such a file is already created for other data structures, reuse it here.
2. Define the data structure in the file. The most common way to do this is to #include in this file whatever
header file actually defines the data structure.
3. Arrange for this file to be compiled with symbolic debug turned on (-g and +noobjdebug) and the
optimizer turned off (no -O).
4. Arrange for the object file produced from this source (foo.o) to be linked into the kernel whenever the
subsystem or driver is linked in. This may mean:
— explicitly pulling it out of a library and linking it in, or
— including in it a symbol definition that is referenced in your subsystem or driver’s code.
There are several caveats worth mentioning:
•
This file should not be used for anything but KWDB definitions. Since symbolic debug will be turned on
for the entire file any code appearing in it will not be optimized (or optimized poorly). Also, symbolic
debug info will be generated for this code which will make the vmunix file bigger but which KWDB will
not use.
•
If a data structure already appears in the symbolic debug info try not to include it again. Doing so doesn’t
break anything, but it does make the vmunix file bigger.
Chapter 10
261
Guide to Writing KWDB Compatible Code
Adding New Data Structures
Testing New Entry
After adding a definition for the new data structure, test it before shipping. The obvious way to do this is to
use KWDB.
The approach is:
1. Build two kernels, one with the subsystem or driver included, one without.
2. Verify that the data structure appears in the first kernel and is correct.
3. Verify that the data structure does not appear in the second kernel and that this kernel is smaller (size of
the vmunix file) than the first. (The data structure may appear anyway and the vmunix files may be the
same size if another subsystem or driver included in the kernel has defined it. Don’t worry about this case
unless the data structure was not defined.)
To find out if the data structure has been included in the kernel run KWDB on the kernel (don’t need a dump
for this) and use the catalog command to look for it.
For example, suppose the data structure is called a struct timeval. It might look like this:
$ kwdb vmunix
(kwdb) catalog timeval
BYTES FIELDS SHAPE
NAME
8
2 struct ki_timeval
8
2 struct lvm_timeval
16
2 struct timeval
8
2 struct timeval_new
32
3 struct timeval_record
(kwdb)
In this case, look for in the third line of output below the heading. It is possible to limit the output by
modifying the command as:
(kwdb) catalog
^timeval$
BYTES FIELDS SHAPE
NAME
16
2 struct timeval
(kwdb)
Now that the definition is there, make sure it’s right. Use the fields command for that. Continuing the
previous example:
(kwdb) fields -c struct
struct timeval {
u_int tv_sec;
long tv_usec;
}
(kwdb)
timeval
If this is the correct definition we’re done.
262
Chapter 10
Guide to Writing KWDB Compatible Code
Adding New Data Structures
Adding New Constants
Since KWDB can manipulate fields symbolically that were declared to be of an enumerated type, use this
mechanism rather than int’s and #define’s.
For example,
enum flags (
FOO = 1,
BAR = 2,
BAZ = 4
);
struct sample (
...
enum flags s_flags;
...
);
is better than
#define FOO
#define BAR
#define BAZ
1
2
4
struct sample (
...
int s_flags
...
);
If print an s_flags field with the second set of definitions (might see 6). With the first set see BAZ|BAR which
is usually more useful.
Even though KWDB uses the symbolic enumerants by default (when the definitions are present) always
override it and use the numeric form. Without the definitions, however, don’t go back the other way because
the information just isn’t there.
To add KWDB support for existing data structures, if these structures have already been seen by customers it
may not be free to change #define’d constants to enumerants. Work around it as in this example:
Imagine a field signo declared as an int with the following possible values:
#define SIGHUP 1
#define SIGINT 2
#define SIGQUIT 3
Create a new enumerated type like this:
enum signals {
sighup = SIGHUP,
sigint = SIGINT,
sigquit = SIGQUIT
};
and change the declaration of signo to an enum signals.
Chapter 10
263
Guide to Writing KWDB Compatible Code
Adding New Data Structures
KWDB can now manipulate and print the field symbolically without requiring any customer code be
rewritten, recompiled or relinked. Because the enumerants are defined in terms of the original constants, the
chance of mis-typing or an other error setting the wrong value, is reduced.
It may be that a case like the one above, except the field is declared as a char or short. Knowing that
enumerated types are the same size as int’s.
The HP-UX C compilers permit the constructs char enum and short enum (which do the obvious thing).
If compiling in ANSI mode, consider switching to extended ANSI mode (-Ae to the C compiler) which permits
use of these constructs in an otherwise ANSI C environment.
Testing New Constants
Testing enumerated types is done the same way as structures and unions.
When printing an enumerated type, it will be something like this:
(kwdb) fields -c enum proc_state
enum proc_state {
SUNUSED = 0,
SWAIT = 1,
SIDL = 2,
SZOMB = 3,
SSTOP = 4,
SINUSE = 5
}
(kwdb)
264
Chapter 10
Guide to Writing KWDB Compatible Code
How to Avoid Breaking KWDB
How to Avoid Breaking KWDB
For most accesses into the crash dump KWDB is able to use the symbolic debug information compiled into the
kernel to figure out what’s in a structure and how it’s organized.
There are a few things in the dump, however, that KWDB has to know more about. These are things like the
address translation and stack tracing algorithms where knowing the layout of the data structures is not
enough.
For these subsystems KWDB is actually hard coded with its own version of the algorithm the kernel uses. If
the workings of any of these subsystems is changed KWDB must be changed with it. Therefore, it is strongly
suggested these things not be changed or, if one of them must be changed for some reason, please:
1. Notify the KWDB project of the changes far enough in advance that can have an updated KWDB ready for
use when the changed subsystem is checked in.
2. Make sure there is some way to tell from the vmunix and image files alone which version of the code was
used. One such example is introduction of dynamic process table allocation. A kernel variable,
dpta_supported, was added with the introduction of dynamic process table allocation. By looking at the
value of dpta_supported, we can tell that whether the kernel supports dynamic process table allocation
or not. This is explained in more detail in Chapter 7, “KWDB PERL Programming Reference.”
Kernel Symbols Used
KWDB uses the following kernel global variables:
utsname
HPUX_Support_String
_release_version
crash_processor_table
crash_event_table
crash_event_ptr
ct_normal
ct_panic
ct_toc
ct_hpmc
panic_save_state
panic_second_save_state
tr_desc
vhpt
vhpt_size
em_as_limits
htbl
htbl2_0
nhtbl2_0
pdirhash_type
inverted_space_hash_mask
mid_variable_page_power
Chapter 10
265
Guide to Writing KWDB Compatible Code
How to Avoid Breaking KWDB
mpproc_info
nmpinfo
spu_info
modhead
proc
proc_list
Address Translation
To be able to find things in a crash dump or in /dev/[k]mem on a live system, KWDB has to know how to
translate virtual addresses into physical address. Any change in the address translation algorithm has to be
taken care of in KWDB as well.
In addition to knowing the address translation algorithm and associated kernel variables, KWDB uses the
following fields in the following data structure. Though using only the listed fields for the time being, it may
be possible to use other fields as well in future. It will be good if any change in these structures is
communicated.
•
struct hpde
pde_next
pde_vpage
pde_phys
pde_space
pde_valid
•
struct hpde2_0
pde_invalid
pde_next
pde_phys
pde_vpage
•
struct tr_entry_t
tr_state
tr_tpa
tr_itir
tr_tva
tr_rr
•
union rr
bits.rid
bits.ps
•
union itir
bits.ps
•
union tpa
bits.ppn
bits.p
266
Chapter 10
Guide to Writing KWDB Compatible Code
How to Avoid Breaking KWDB
•
struct pte
tpa.bits.p
tpa.bits.ppn
itir.bits.ps
pte.tag
Stack Traces
In addition to knowing the algorithm for stack tracing, KWDB uses following fields in the following data
structures. Though using only the listed fields for the time being, it may be possible to use other fields as well
in future. Therefore, it will be good if any change in these structures is communicated.
•
crash_event_t
cet_event
cet_hpa
cet_savestate
cet_handle
•
frame_marker_t
•
kthread_t
kt_nextp
kt_procp
kt_tid
kt_upreg
•
union mpinfou
pdkptr
pikptr
•
mpinfo_t
ibase
prochpa
procp (used only with nonthreads kernels)
threadp (used only with threads kernels)
•
preg_t
p_space
p_vaddr
•
proc_t
p_firstthreadp
p_lastthreadp
p_pid
p_comm
•
rpb_t
// most of the fields
Chapter 10
267
Guide to Writing KWDB Compatible Code
How to Avoid Breaking KWDB
•
save_state_t
// most of the fields
•
stubDesc_t
addr
length
type
•
unwindDesc_t
args_stored
end_ofs
frame_size
hpux_int
millicode
save_mrp_in_frame
save_rp
save_sp
start_ofs
•
user_t
u_pcb.jb.lb_cmn.rp.val
u_pcb.jb.lb_cmn.sp.val
u_pcb.jb.lb_cmn.ar_bsp.val
u_pcb.jb.lb_cmn.ar_pfs.val
u_pcb.ar_rnat
u_procp
•
struct pcb
pcb_r2
pcb_r30
pcb_sr5
DLKM
KWDB uses following fields from the data structures listed below for handling DLKM modules.
•
struct modobj
md_mcl
md_path
md_bss
md_space
•
struct modctl
mc_id
mc_version
mc_name
mc_modp
mc_next
268
Chapter 10
Guide to Writing KWDB Compatible Code
How to Avoid Breaking KWDB
•
struct modctl_list
mcl_mcp
mcl_next
•
struct module
mod_obj.md_path
mod_obj.md_space
mod_obj.md_bss
mod_obj.md_mcl
Chapter 10
269
Guide to Writing KWDB Compatible Code
Endianism
Endianism
KWDB assumes all the code be Big Endian at the very lowest levels. KWDB may become flexible about this in
the future, but it isn’t at present.
Object File Format
KWDB expects HP-UX kernels to be stored in the form of Spectrum Object Modules (SOMs) or in the form
of Executable and Link Format (ELF) objects. KWDB will require modification if this ever changes.
Symbolic Debug Format
On PA targets KWDB expects the kernel’s symbolic debug information to be stored in the SOM or ELF object
that the kernel was loaded from and the format to be defined by the symtab.h or symtab64.h file provided by
the compiler delivery lab. On IPF targets KWDB supports ELF64 objects and the DWARF2 debug format.
KWDB will require modification if this ever changes.
270
Chapter 10
Glossary
A
32-Bit Program A program compiled to run in
32-bit mode. For example. programs compiled for the
PA RISC 1.X processors.
64-Bit Program A program compiled to run in
64-bit mode. For example, programs compiled for the
PA-RISC 2.0 processor in wide mode.
100BT 100BASE-T is the technical term for the Fast
Ethernet or IEEE802.3u standard. See also, Fast
Ethernet.
Adapter Card Physical hardware, under software
control, which is typically attached either directly to
an I/O bus or to an auxiliary bus (e.g., SCSI)
attached to a directly connected adapter. A device
typically combines a hardware controller with the
mechanism (e.g., disk controller with disk).
ANSI American National Standards Institute.
Area Allocator The memory attribute based
allocated in HP-UX kernel which replace the old
MALLOC()/FREE() interface. The advanced features
include object caching, improved fault isolation,
reduced memory fragmentation and better scaling.
ARP Address Resolution Protocol.
Attach Chain A linked list of driver attach routines
(<drv>_attach). As a hardware module is being
configured, this list is walked to allow each driver in
the system a chance to recognize and claim the
hardware module.
Autoload
A capability made possible via the DLKM feature. It
occurs when the kernel detects a particular loadable
module is required to accomplish some task, but the
module is not currently loaded. The kernel
automatically loads the module. During an autoload,
the kernel also loads any modules that the module
being loaded depends upon, just as it does during a
demand load.
B
BAR Base Address Register. On a PCI card, one of
the registers in PCI configuration space that
contains the size and alignment requirements
needed to map the card’s registers. Each BAR also
Glossary
contains information (encoded in the low-order bits
of the register) indicating whether they are base
registers for PCI memory space or for PCI I/O space.
The system reads and decodes this information and
writes a PCI address back into these registers when
it initially maps them in. BARs contain PCI
addresses when properly set up.
BDR Boot Data Record.
Beta Semaphores Mutually-exclusive, blocking
semaphores. When a thread acquires a beta
semaphore, it is released. The owning thread may
subsequently block (i.e., sleep) and still keep
ownership. Threads waiting to acquire an owned
beta semaphore are blocked.
Big Endian A format for storage or transmission of
binary data in which the most significant bit or byte
comes first. See also, Little Endian.
bit mask A patter of binary values, typically used in
bitwise operations.
Bit An atomic unit of data representing either a 0 or
a 1.
Bitwise Operation A bitwise operation treats its
operands as a vector of bits rather than a single
number.
BN-CDIO Bus Nexus CDIO, low-level kernel
software that manages platform-dependent bus
connection hardware.
Broadcast Address A well-known multicast
address signifying the set of all stations.
Bundle A collection of filesets, possibly from several
different products, “encapsulated” for a specific
purpose. Bundles can consist of groups of filesets or
products.
Bus Mastering The act of taking over a bus and
generating cycles on it. A bus master is any piece of
hardware that creates read or write cycles on the
PCI bus. Typical cards become bus masters only
when they perform DMA operations, although any
card-initiated cycle (for example, a peer-to-peer
transaction) is an example of bus mastering.
Bus Nexus Connection between two buses.
271
Glossary
Cache Coherence
C
Cache Coherence Consistency of data in host
memory as viewed by processor caches and I/O
devices.
Cacheline The smallest unit of memory that can be
transferred between the main memory and the
cache. Typically, Cacheline is hardware dependent.
Canonical format Synonymous with Little Endian
format.
ccNUMA Cache-Coherent Non-Uniform Memory
Architecture. See also, NUMA.
CDB Command Descriptor Block.
CDIO Context Dependent I/O module. A module in
GIO framework which contains all bus specific
and/or driver environment specific functionality.
Central Bus CDIO (CB-CDIO) The BN-CDIO
which is responsible for discovering and initializing
CEC components.
CKO Checksum Offload.
Class A logical grouping of device or hardware
modules by type. For instance the class “tape” would
include all tape devices regardless of bus interface.
Coherent I/O Accesses to data in host memory by
I/O devices are consistent with accesses by CPU
caches. Hardware in the platform maintains the
consistent view of data in host memory as DMA
transactions flow through the hardware.
Continuous DMA A type of DMA that makes a
host memory buffer continuously available to an I/O
device. This type of DMA is mainly used for control
structures and circular queues that are shared
between the device driver and the hardware device.
CSMA/CD Carrier Sense, Multiple Access with
Collision Detection.
D
Data Link layer The second layer of the
seven-layer OSI model, responsible for frame
delivery across a single link.
Datagrams (1) A frame or packet transferred using
connectionless communications. (2) A frame or
packet sent using best-effort service. (3) An IP
packet.
Decapsulation The process of removing protocol
headers and trailers to extract higher-layer protocol
information carried in the data payload. See also,
Encapsulation.
Depot A repository of software products managed
by SD/UX. A depot consists of a directory or physical
media such as tapes, CD-ROMS, or DVDs.
Device Driver The software used to provide an
abstraction of the hardware details of a network or
peripheral device interface. Device drivers allow
higher-layer entities to use the capabilities of a
device without having to know or deal with the
specific implementation of the underlying hardware.
Device Driver Environment (DDE) A defined set
of services and entry points which allow a driver to
function.
DLKM Dynamically Loadable Kernel Module. A
feature available in HP-UX 11.0 that supports
dynamic loading and unloading of kernel modules, to
avoid wasting kernel memory by keeping modules in
core when they are not in use.
DLPI Data Link Provider Interface.
DLSAP Data Link Service Access Point.
Core Electronics Complex (CEC) The chipset
which interfaces directly to the processor in the
processor-memory interconnect. In simple systems,
this usually includes memory controllers and I/O
adapters. On more complex systems, it might include
high-speed interconnects and coherency controllers.
DMA Direct Memory Access. I/O transactions for
which the device interacts directly with memory
without processor intervention.
CPU Central Processing Unit
DSAP Destination Service Access Point.
272
Driver Software module which controls a device,
interface card or bus-nexus. See also, Device Driver
Glossary
Glossary
Installed Product Database (IPD)
E
H
Encapsulation The process of taking data provided
by a higher-layer entity as the payload for a
lower-layer entity and applying a header an trailer
as appropriate for the protocol in question. See also,
Decapsulation.
Half duplex A mode of communication in which a
device can either transmit or receive data across a
communications channel, but not both
simultaneously. See also, Full duplex.
HBA Host Bus Adapter.
ENET HP-UX sample Native STREAMS DLPI
network interface driver.
Ethernet The popular name for a family of LAN
technologies standardized by IEEE 802.3.
F
Fast Ethernet An Ethernet system operating at
100 Mb/s.
Filesets Include all the files and scripts that make
up a product. They can only be part of a single
product. They are the lowest level object managed by
SD.
Header A protocol-specific field or fields that
precede the encapsulated higher-layer data payload
(e.g., the MAC addresses in a Data Link frame). See
also, Trailer.
High Availability (HA) Used to describe a
computer system that has been designed to allow
users to continue with specific applications even
though there has been a hardware or software
failure.
HP-DLPI’s HP’s own implementation of the DLPI
layer.
I
Fragmentation A technique whereby a packet is
subdivided into small packets so that they can be
sent through a network with a smaller MTU. See
also, Reassembly.
Frame The Data Link layer encapsulation of
transmitted or received information
Frame Check Sequence A block check code used
to detect errors in a frame. Most LANs use a CRC-32
polynominal as their FCS.
Full Duplex A mode of communication whereby a
device can simultaneously transmit and receive data
across a communications channel. See also,
Half-duplex.
G
Gigabit Ethernet An Ethernet system operating at
1000 Mb/s.
ICMP Internet Control Message Protocol.
IELAN HP-UX sample non-native HP-DLPI based
network interface driver.
IHV Independent Hardware Vendor.
ILP32 C language data model where int, long and
pointer data types are 32 bits in size.
Init Function This is an attribute in driver
modules modmeta file. An “initfunc” statement
specified an initialization function, provided y the
module, that the system should call during driver
initialization.
Init List A linked list of device driver init routines
(<drv>_init) which is built as the drivers configure
themselves and run as the I/O system configuration
is completed to perform any device driver-specific
initialization.
GIO General I/O System.
Group Address Synonymous with multicast
address.
Glossary
Installed Product Database (IPD) SD uses the
Installed Product Database (IPD) to keep track of
what software is installed on a system. The IPD is a
series of files and subdirectories that contain
information about all the products that are installed
under the root directory (/). For depots, this
273
Glossary
Interface Select Code (ISC)
information is maintained in catalog files beneath
the depot directory. The SD commands
automatically add to, change and delete IPD and
catalog information as the commands are executed.
Interface Select Code (ISC) Each instance of an
adapter card has an ISC entry that the system
maintains in an internal table. Each ISC entry is
used by WSIO to maintain interface device driver
information.
Interface Service Routine (ISR) A function that
handles interrupts that are received for a specific
device driver. A pointer to this routine is linked to a
system vector table. When an interrupt occurs, it is
routed to the ISR that is placed in the section of the
Interrupt Vector Table that corresponds to the
received interrupt.
Interrupt Service Routine A function that
handles interrupts that are received for a specific
device driver. A pointer to this routine is linked to a
system vector table. When an interrupt occurs, it is
routed to the ISR that is placed in the section of the
Interrupt Vector Table that corresponds to the
received interrupt.
I/O Tree Data structure for recording the I/O
subsystem configuration information.
IOVA I/O Virtual Address. Address used by I/O
devices to access host memory. Platforms that are
semicoherent or coherent, or where the
processor/memory interconnect is greater than
32-bits wide, generally implement IOVAs.
IP Internet Protocol.
IPF Itanium Processor Family.
IRQ Interrupt Request.
ISC Interface Select Code. Usually used as a pointer
to an element of a table of isc_table_type
structures (one per interface card). Each ISC entry is
used by WSIO to maintain interface device driver
information.
ISCSI SCSI over IP.
ISR Interrupt Service Routine. A driver-specific
routine which handles interrupts from the device.
ISV Independent Software Vendor
Instance A number assigned to an I/O tree node.
The number is unique within a driver class.
I/O Adapter Hardware to provide IOVA translation
between an I/O bus and the processor/memory
interconnect devices on the I/O bus issue bus
transactions to IOVA memory targets and the I/O
adapter translates IOVA memory targets to physical
addresses. The I/O adapter also participates in the
coherency protocol of the processor caches for
platforms that are coherent or semicoherent.
I/O Bus Interconnect bus for I/O cards and devices.
PCI is an example of an I/O bus.
I/O Node An element of an I/O tree which includes
all relevant information needed for configuring a
single hardware module.
I/O PDIR I/O Page Directory. Address translation
table associated with an I/O adapter. The I/O PDIR
is analogous to the PDIR used by CPUs for
virtual-to-physical address translations. It is a table
maintained by the kernel to provide mappings
between IOVAs and physical addresses.
274
J
Jumbo Frame A frame longer than the maximum
frame length allowed by a standard. Specifically
used to describe the 9-Kbyte frames on Ethernet
LANs.
K
Kcweb The HP-UX Kernel Configuration tool user
interface uses as a web browser.
Kernel module A section of code responsible for
supporting a specific capability or feature. Normally,
such code is maintained in individual object files
and/or archives, enabling modules to be
conditionally included or excluded from the kernel,
depending on whether or not the features they
support are desired.
L
LAN Local Area Network. A network with a
relatively small geographical extent.
Glossary
Glossary
MP Safe
LBI Line Based Interrupt.
Length Encapsulation The Ethernet frame
format where the length/Type field contains the
length of the encapsulated data rather than a
protocol type identifier. Length Encapsulated frames
typically use LLC to multiplex among multiple
higher-layer protocol clients. See also, Type
Encapsulation.
Little Endian A format for storage or transmission
of binary data in which the least significant bit or
byte comes first. See also, Big Endian.
LLC Line Based Interrupt.
Logical Address See Multicast Address.
LP64 C language data model where the int data
type is 32 bits wide, but long and pointer data types
are 64 bits wide.
LSB Least significant bit or least significant bit.
LUN Logical Unit Number.
LVM The Logical Volume Manager is a disk
management subsystem that offers access to file
systems as well as features such as disk mirroring,
disk spanning, and dynamic partitioning.
and updates the corresponding base register to point
to this range. This is taken care of by the system
(firmware and/or the kernel) at the time of the card's
initialization.
Map PCI to Port Handle Mapping a PCI I/O
space address to a port handle is the act which
allows a driver to access the I/O space using
pci_read_port_uintNN_isc() and
pci_write_port_uintNN_isc(), passing in the port
handle as a argument. The mapping is done through
a call to pci_get_port_handle_isc().
Map PCI to Virtual Address Mapping a PCI
memory space address to a virtual address is the act
that allows a driver to access PCI space using
READ_REG_UINTNN_ISC() or
WRITE_REG_UINTNN_ISC() with that virtual
address. The mapping is done through a call to
map_mem_to_host().
mblk Message block. Data structure used in
networking stack.
mbuf Message buffer. Data structure used in mass
storage stack.
Metadata The metadata for a module are used by
the kernel configuration tools when configuring a
module, they are also used by various kernel
services while the module is in use.
M
MAC Medium Access Control.
MAC Address A bit string that uniquely identifies
one or more devices or interfaces as the sources or
destination of transmitted frames. IEEE 802 MAC
addresses are 48 bits in length and may be either
unicast (source or destination) or multicast
(destination only).
Memory Mapped I/O (MMIO) I/O that occurs by
mapping the devices’s I/O to system memory.
Module type A module type is distinguished by the
mechanism used to maintain the modules of that
type within the kernel. DLKM modules are classified
according to a fixed number of supported module
types.
MP Multi-Processor
MAC Algorithm The set of procedures used by the
stations ion a LAN to arbitrate for access to the
shared communication channel (e.g., CSMA/CD,
Token Passing).
Map PCI Device/Function
The act of mapping a PCI device or function involves
determining the size and alignment requirements
for each memory or I/O range described by an
implemented configuration-space base register.
Using these requirements, PCI Services finds a
suitable hole in the memory or I/O address space
Glossary
MP Safe Describes a module which is protected in
an MP environment through the use of various
spinlocks and semaphores. Note that MP-safeness
does not imply any performance considerations due
to the granularity of the semaphores (e.g., use of a
single I/O Empire semaphore or separate
semaphores for each instance all imply
MP-safeness).
275
Glossary
MP Scalable
MP Scalable Describes an MP module which may
add components without causing more drain on
other MP modules. An MP-scalable driver will
provide a separate spinlock for each instance of the
driver. Non MP-scalable drivers may still be MP-safe
but perhaps only provide a single semaphore and
spinlock for all instances of the driver. Adding more
instances of a non MP-scalable driver will therefore
cause additional taxing of those resources for each
instance added to the system.
Modwrapper The additional code and data
structures added to a DLKM module to make it
dynamic.
MSB Most significant bit, or most significant byte.
O
On-Line Addition and Replacement (OLA/R)
The ability to insert adapter cards and replace such
cards while a system is being used (Hot Plug).
On-Line Delete (OLD) The ability to delete
adapter cards.
Operating System The low-level software
responsible for managing the underlying hardware
in a computer, scheduling tasks, allocating storage.
OSI Open Systems Interconnect.
P
MTU Maximum Transmission Unit.
PA Precision Architecture.
MTU Discovery A process whereby a station can
determine the largest frame or packet that can be
transferred across a internetwork without requiring
fragmentation.
Multicast Address A method of identifying a set of
one or more stations as the destination for
transmitted data. Also known as logical address or
group address.
N
NFS Network File System.
Package A collection of files that need to be
distributed. It is created by a SD command.
Packet The Network layer encapsulation of
transmitted or received information.
Packet DMA A type of DMA that maps a host
memory buffer temporarily. This is used when
pre-existing memory objects must be mapped for
DMA, or when a mapping only needs to be
temporary.
NIC Network Interface Card or Network Interface
Controller.
PCI Peripheral Component Interconnect. An
industry standard bus used mainly by current
generations of HP platforms as a means of providing
expansion I/O.
Noncoherent I/O Accesses to data in host memory
by I/O devices are not made consistent with
processor caches by hardware. Software must
explicitly flush the processor caches prior to starting
a DMA transaction by an I/O device; and, in the case
of data read from an I/O device, purge the processor
caches after the DMA transaction completes.
PCI Address An address in the PCI memory or I/O
space. This is the type of address found in a PCI
memory or I/O base address register. It is NOT a
virtual address or an I/O port handle, which a driver
could use to access a card.
NUMA Non-Uniform Memory Architecture. A
memory architecture, used in multiprocessors,
where the access time depends on the memory
location. A processor can access its own local
memory faster than non-local memory (memory
which is local to another processor or shared
between processors). See also, ccNUMA.
276
PCI Card A PCI bus can have up to 32 devices; each
device can have up to eight functions. A PCI card can
have single or multiple devices; each device can have
single or multiple functions. For example, a four-port
LAN card is a multi-device PCI card, but none of
these devices is multi-functional. On the other hand,
a dual-port SCSI card is a single device, but it has
two functions.
Glossary
Glossary
Semicoherent I/O
PCI Configuration Space This always-accessible
space allows a driver to configure and obtain status
from PCI devices or functions.
Product Specification File (PSF) A master file
where all bundle configuration information
(attributes) exists.
PCI I/O Space The space that is addressed by an
I/O cycle on the PCI bus. This is a less often used
way to access card registers on cards who choose to
respond to PCI I/O accesses. Most cards have
registers that are in PCI memory space instead of
I/O space (i.e., they respond to PCI memory cycles,
not PCI I/O cycles).
Promiscuous Mode A mode of operation of a
network interface in which it receives (or attempts to
receive) all traffic regardless of Destination Address.
PCI Memory Space
The space that is addressed by a memory cycle on
the PCI bus. It is called memory space to indicate
that it is memory-mapped input/output, as opposed
to a special I/O style of input/output. The current PA
Workstation I/O architecture allows the PA
processor to directly access PCI memory space (i.e., a
single instruction). Typical cards map their registers
into PCI memory space, meaning they can only be
accessed by PCI memory cycles.
pSCSI Parallel SCSI. See also, SCSI.
Perl A procedural programming language created
by Larry Wall. It’s ancestors include awk, sed and C.
Physical Address Real address by which host
memory or an I/O device register is accessed.
Physical Layer The lowest layer of the seven-layer
OSI model, responsible for transmission and
reception of signals across the communication
medium.
Ping A utility program used to test for network
connectivity by using the Echo Request and Echo
Response mechanisms of ICMP.
Port Handle The kernel resource associated with a
mapped range of PCI I/O space. This handle is used
to access the I/O space addresses by calling
pci_read_port_uintNN_isc() and
pci_write_port_uintNN_isc().
Port I/O (PIO) Communication with an I/O device
using the device’s ports.
PPA Physical Point of Attachment
Product Collections of filesets and (optionally)
subproducts and control scripts.
Glossary
Protocol A set of behavioral algorithms, message
formats, and message semantics used to support
communications between entities across a network.
Q
QLISP HP-UX sample parallel
Quiesce (networking) To render quiescent, i.e.,
temporarily inactive or disabled. For example to
quiesce a device (such as a digital modem). It is also
a system command in MAX TNT software which is
used to “Temporarily disable a modem or DS0
channel”.
R
Reassembly The process of reconstructing a packet
from its fragments. See also, Fragmentation.
Root In SD, a system on which depot software is
installed.
S
SAM System Administration Manager. A GUI based
application for HP-UX system administration.
SAP Service Attach Point
SCSI Small Computer System Interface. An
industry standard external I/O bus available on all
HP9000 systems.
SDTR Synchronous Data Transfer Request.
Semicoherent I/O Similar to coherent I/O.
However, for the case of data read from an I/O
device, software must synchronize the data that
have been read into host memory after the DMA
transaction completes.
277
Glossary
Series 700
Series 700 HP9000/7XX family of PA-RISC
workstations.
TCP Transmission Control Protocol.
Series 800 HP9000/8XX family of PA-RISC
business servers.
Token Ring A LAN whose MAC algorithm uses
token passing among stations on a logical ring
topology (i.e., IEEE 802.5).
Server I/O (SIO) I/O environment for port-server
drivers with origins in S/800 systems.
Topology The physical or logical layout of a
network.
SGML Acronym meaning Standardized General
Markup Language, this template contains macros
that convert your document into SGML.
Trailer A protocol-specific field or fields that follow
the encapsulated higher-layer data payload (e.g., the
FCS in a Data Link Frame). See also, Header.
SIO Server I/O; I/O environment for port-server
drivers with origins in S/800 systems.
Type Encapsulation The Ethernet frame format
in which the Length/Type field identifies the
protocol type of the encapsulated data rather than
its length. See also, Length Encapsulation.
SNAP Sub-Network Access Point
Software Distributor (SD) The software
distributor tool for HP-UX operation system.
U
UDP User Datagram Protocol.
Software Objects Can be a bundle, product or
filesets.
Spinlock Basic locking primitive used by the kernel
for short-term locks. When a thread acquires a
spinlock, the thread’s current processor becomes the
effective owner until the spinlock is released.
Threads (processors) waiting to acquire an owned
spinlock will spin while waiting; they do not block.
For the duration that a processor owns a spinlock,
external interrupts to the processor are disabled.
Stream A connection supported by the STREAMS
facilities between a user process and a device driver.
It is a structure made up of linked modules, each of
which processes the transmitted information and
passes it to the next module. Use STREAMS to
connect to a wide variety of hardware and software
configurations, using building blocks, or modules,
that can be stacked together. STREAMS drivers and
modules are similar in that they both must declare
the same structures and provide the same interface.
Only STREAMS drivers manage physical hardware
and must therefore be responsible for handling
interrupts if appropriate.
V
Virtual Address Address used by processors, when
executing in virtual mode, to access host memory.
Address translation hardware converts a virtual
address to a physical address before host memory is
accessed. Virtual addresses may also be used to map
and access I/O device registers.
W
WDTR Wide Data Transfer Request.
WSIO Workstation and Server I/O. A CDIO, also the
HP-UX Driver Development Environment (DDE).
X
XML Acronym meaning eXtensible Markup
Language. A subset of SGML (Standardized General
Markup Language), this template contains macros
that convert your document into XML.
T
Target Either a host (the host’s file system) or a
depot that resides on a host.
TBI Transaction Based Interrupt.
278
Glossary
Index
A
adddebug
Q4 command, 161, 244
adding new data structures, 261
addmodule
Q4 command, 162, 244
address translation, 266
addresses, 117
memory, 100
AddToTable routine, 228
Adjust routine, 227
alias
command defining, 83
analysis
live memory, 201
remote dump, 199
analysis commands
live memory, 203
analyze threads, 177
assembly code
examining, 95
attach
KWDB command, 236
attach and boot target
UDP, 61
attaching target system , 46
automatic display, 241
automatic display commands
disable, 241
display, 241
enable, 241
info, 241
undisplay, 241
B
backtrace
KWDB command, 102, 239
basic PERL operation, 223
basics
KWDB, 43
boot and attach
Keystone, 47
Matterhorn, 47
Orca, 47
Superdome, 47
boot and attach target
UDP, 61
boot time, 38
boot-and-wait, 46
booting target system, 46
boot-without-wait, 46
brand
Q4 command, 144
break
KWDB command, 86, 237, 238
breakpoint commands
break, 237, 238
clear, 237, 238
commands, 237, 238
cond, 237, 238
delete, 237, 238
disable, 237, 238
enable, 237, 238
ignore, 237, 238
info break, 237, 238
tbreak, 237, 238
watch, 237, 238
breakpoints, 85, 237, 238
conditional, 89
deleting, 87
listing, 87
setting, 86
setting temporary, 86
btlan, 32
C
call
KWDB command, 84, 240
called functions
stepping over, 92, 93
cards
LAN, 29
catalog
Q4 command, 124, 244
searching, 124
catch
KWDB command, 108, 242
changing value variable, 99
char* variable, 98
check system daemons, 185
check system status, 173
class
machine, 22
clear
KWDB command, 238
client connection, 46
CloseTable routine, 228
code
compiling, 67
debug, 114
Q4 command, 244
timeouts in effect, 114
comm server, 20
LAN communication, 20, 24
starting, 37
command
stepi, 92
command alias
defining, 83
command completion, 81, 123
command quick reference, 236
command scripts
q4, 225
command structure, 117
commands
DLKM, 242
invoking, 85
KWDB, 77, 236
KWDB command, 88, 238
live memory analysis, 203
not supported, 250
279
Index
Q4, 116, 244
reading, 82
special kernel debugging, 242
supported, 250
unsupported, 211
common problems, 251
communicating with KWDB, 223
communication
console debugger, 21, 28
dedicated device, 20
device, 25
method selecting, 21
serial, 21
serial Lantron, 21
SONIC LAN, 26
SUB/SINC, 25
UDP, 24
UPD, 20
communication methods, 20
compatible code
KWDB, 259
compiling code, 67
completion
command, 81, 123
cond
KWDB command, 89, 238
conditional breakpoints
setting, 89
configuration file
comm server, 39
connection
client, 46
console debugger communication, 21, 28
console message buffer
print, 193
constant
Q4 command, 244
constants
listing, 157
Q4 command, 157
context
setting, 140
continue
KWDB command, 94, 240
continuing execution, 94
control
execution, 240
controlling KWDB
set command, 83
cpu
KWDB command, 242
set, 140
cpu select
Q4 command, 140
crash dumps
analyzing, 167
crash event
set, 141
trace, 188
crash events, 196
crashes, 170
280
creating debugger variables, 99
custom field formats, 122
D
data structure fields
DLKM, 268
listing, 124
data structures
adding, 261
data type catalog, 124
searching, 124
data types, 117
database operations, 159
debug code, 114
debug DLKMs, 107
debug format
symbolic, 270
debug session, 45
KWDB, 45
debugger
console, 28
debugger communication
console, 21
debugger variables
creating, 99
debugging, 66
multiple processor systems, 106
remote, 19
source level, 67
debugging commands
special kernel, 242
debugging DLKMs, 107
debugging PERL scripts, 218
debugging session
beginning, 78
ending, 79
debugging target
Keystone, 48
Matterhorn, 48
Orca, 48
Superdome, 48
dedicated device communication, 20
define
KWDB command, 83
defined function information
displaying, 105
defining command alias, 83
delete
KWDB command, 87, 238
deleting breakpoints, 87
destroying variables, 158
detach
KWDB command, 79, 237
determine machine class, 22
determine operating system , 22
device communication
dedicated, 20, 25
differences
kernel, 233
dir
KWDB command, 94, 242
Index
direct connection
target and host, 27
disable
KWDB command, 238, 241
disas
KWDB command, 95
disassem
KWDB command, 240
disassemble
Q4 command, 129, 244
disassembling functions, 129
discard
Q4 command, 159, 244
display, 240
automatic, 241
KWDB command, 98, 241
display commands
disassem, 240
print, 240
x, 240
displaying source code, 94
displaying symbol location, 104
displaying values, 98
DLKM
Dynamically Loadable Kernel Module, 107
DLKM commands, 242
catch, 242
info, 242
path, 242
tcatch, 242
uncatch, 242
DLKM data structure fields, 268
DLKM modules
listing, 162
processing, 162
DLKMs
debug, 107
debugging, 107
document
KWDB command, 83
down
KWDB command, 103, 239
dump analysis
remote, 199
dump type determination, 168
Dynamically Loadable Kernel Module
DLKM, 107
E
Elapsed routine, 231
enable
KWDB command, 238, 241
endianism, 270
ending KWDB session, 80
enumerants, 118
EOF Ctrl-d
KWDB command, 80
error messages, 255
evaluate
Q4 command, 157, 244
Evaluate routine, 225
evaluating expressions, 157
examine
Q4 command, 152, 244
Examine routine, 225
examining assembly code, 95
examining instructions, 100
examining memory, 99, 152
examining memory addresses, 100
examining registers, 101
examining source code, 94
examining variables, 96
Executable and Link Format
ELF, 270
executing KWDB on DLKMs, 108
execution
continuing, 94
execution control, 240
execution control commands
call, 240
continue, 240
finish, 240
jump, 240
next, 240
nexti, 240
return, 240
set, 240
step, 240
stepi, 240
until, 240
exiting KWDB, 66
expr
Q4 command, 245
expressions, 119, 241
evaluating, 157
fields and values, 229
F
features and commands
other, 250
field formats
custom, 122
fields
Q4 command, 124, 246
synthetic, 121
values and expressions, 229
file
logging output, 82
file format
object, 270
files
source, 242
find
Q4 command, 246
finding frame information, 103
finish
KWDB command, 91, 240
forget
Q4 command, 147, 246
Forget routine, 225
formats
custom, 122
281
Index
formatting
output, 227
forw
KWDB command, 242
frame
KWDB command, 103, 239
frame information
finding, 103
functions
called, 92, 93
disassembling, 129
G
GDB, 17
GetAllFieldNames routine, 230
GetAllFieldValues routine, 230
getasm
Q4 command, 246
GetFieldsDec routine, 229
GetFieldsHex routine, 229
GetSymbolicField routine, 230
getting help, 236
getting help commands
help, 236
GetValues routine, 230
global variable information
displaying, 105
H
handling
interruption, 229
hangs, 173
Hard Physical Addresses
HPAs, 170, 195
help, 123
getting, 80, 236
KWDB command, 80, 236
Q4 command, 123, 246
High Priority Machine Checks
HPMC, 168
history
load, 146
Q4 command, 146, 246
history references, 122
HPAs
Hard Physical Addresses, 170, 195
HPMC
High Priority Machine Checks, 168
I
iether card, 51
igelan, 32
igelan card , 51
ignore
KWDB command, 239
include
Q4 command, 160, 246
include command, 216
Include routine, 231
including program files, 216
info
282
KWDB command, 239, 241, 242
info break
KWDB command, 87
information
frame, 103
preprocessor, 195
version, 123
input
redirecting, 122
input and output
redirecting, 122
installation
verification, 215
installation verification
PERL, 215
instructions
examining, 100
INT Ctrl-c
KWDB command, 79
INTERRUPT
KWDB command, 236
Interrupt Server Routines
ISRs, 115
Interrupted routine, 229
interruption handling, 229
intl100, 32
intl100 card, 51
invoking commands, 85
invoking KWDB, 216
invoking scripts, 217
invoking shell scripts, 85
IPF LAN cards, 34
IPF system processor
trace, 190
IPF target
boot and attach, 51
Lantron Serial, 56
RS-232, 53
ISRs
Interrupt Server Routines, 115
J
jump
KWDB command, 92, 240
K
keep
Q4 command, 159, 246
Keep routine, 225
kernel
controlling, 66
kernel build method, 197
kernel debugging commands
special, 242
kernel differences
transparent, 233
kernel execution
controlling, 66
kernel files
writing, 154, 155
kernel stack, 239
Index
kernel stack commands
backtrace, 239
down, 239
frame, 239
info, 239
up, 239
kernel symbols, 265
listing, 129
kernels
11.0 and earlier, 63
kill
KWDB command, 79, 237
KWDB
communicating, 223
compatible code writing, 259
invoking, 216
setting up, 19
stopping, 236
kwdb
KWDB command, 236
KWDB basics, 43
KWDB command
attach, 236
backtrace, 102, 239
break, 86, 237, 238
call, 84, 240
catch, 108, 242
clear, 238
commands, 238
cond, 89, 238
continue, 94, 240
cpu select, 242
define, 83
delete, 87, 238
detach, 79, 236
dir, 94, 242
disable, 238, 241
disas, 95
disassem, 240
display, 98, 241
document, 83
down, 103, 239
enable, 238, 241
EOF Ctrl-d , 80
finish, 91, 240
forw, 242
frame, 103, 239
help, 80, 236
ignore, 239
info, 239
info break, 87
INT Ctrl-c, 79
INTERRUPT, 236
jump, 92, 240
kill, 79, 236
kwdb, 236
list, 94, 242
next, 92, 93, 240
nexti, 92 , 93, 240
nnTab, 81
path, 108, 242
print, 84, 96, 240
ptype, 105, 241
q, 80
quit, 236
return, 240
rev, 242
set, 82, 240, 242
set kwdb, 83
shell, 85
show, 242
source, 82
step, 91, 240
stepi, 240
system, 85
target, 237
tbreak, 86, 239
tcatch, 108, 242
uncatch, 108, 242
undisplay, 241
until, 240
up, 103, 239
watch, 90, 239
whatis, 241
write, 249
x, 100, 240
KWDB commands, 77, 236
set kwdb q4, 118
KWDB debug session, 44
KWDB debugger
starting, 45
KWDB exiting, 66
KWDB on DLKMs
executing, 108
KWDB PERL interaction, 214
KWDB session
ending, 80
KWDB set up instructions, 24
KWDB with PERL problems, 254
kwdb_config_kern utility, 40
L
LAN
Local Area Network, 20, 43
SONIC, 20
LAN card
installing, 33
LAN Cards
btlan, 32
igelan, 32
int100, 32
LAN cards, 29
IPF, 34
obtaining, 36
PA-RISC, 29
LAN communication, 20
comm server, 20, 24
Lantron serial communication, 21
list
283
Index
KWDB command, 94, 242
listing breakpoints, 87
listing constants, 157
listing kernel symbols, 129
listing variables, 158
live memory analysis, 201
commands, 203
starting, 202
load
Q4 command, 141, 246
load average, 194
load history, 146
load process table, 196
Load routine, 226
Local Area Network
LAN, 20, 43
locked pages
reading, 210
LOF
Executable and Link Format, 270
log files
comm server, 38
M
machine class
determine, 22
memory
examining, 99, 152
writing, 154
memory addresses
examining, 100
memory analysis
live, 201
memory status check, 186
merge
Q4 command, 147, 247
merging piles, 147
message buffer
console, 193
messages
error, 255
miscellaneous routines, 231
mode
q4, 118
modules
Q4 command, 162, 247
multiple processor systems
debugging, 106
N
name
Q4 command, 143, 247
NameIt routine, 226
navigating the stack, 102
Network Interface Card
NIC, 36
new constants
testing, 264
new data structures
adding, 261
new entry
284
testing, 262
next
KWDB command, 92, 93, 240
nexti
KWDB command, 92, 93, 240
NIC
Network Interface Card, 36
nnTab
KWDB command, 81
numbers, 117
O
object file format, 270
obtaining LAN cards, 36
obtaining stack trace, 102
OpenTable routine, 228
operating system
determine, 22
operations
database, 159
other tricks, 193
output formatting, 227
P
PA system , 189
PA system processor
trace, 189
panics
trapping, 106
PA-RISC
trapping panics, 106
PA-RISC LAN cards, 29
path
KWDB command, 108, 242
PERL
scripts debugging, 218
PERL installation verification, 215
PERL KWDB interaction, 214
PERL operation
basic, 223
PERL program files, 160
PERL programming reference, 213
PERL programs, 161
running, 161
PERL scripts, 209
debugging, 218
PERL with KWDB problems, 254
pileon
Q4 command, 142, 160, 247
piles
merging, 147
Plural routine, 231
pophistory
Q4 command, 148, 247
PopHistory routine, 226
PopPrintFlag routine, 224
popular scripts, 218
preprocessor information, 195
print
KWDB command, 84, 96, 240
Q4 command, 148
Index
PrintExprs routine, 228
PrintFields routine , 228
printing structure fields, 148
printing variable value, 96
PrintMessageBuffer routine , 217
PrintResponse routine, 224
PrintTable routine, 228
problems
common, 251
KWDB with PERL, 254
remote target, 252
process
trace, 191
processing DLKM modules, 162
processor
IPF system, 190
trace, 189
program files
including, 216
programming reference
PERL, 213
ptype
KWDB command, 105, 241
pushhistory
Q4 command, 148, 247
PushHistory routine, 226
PushPrintFlag routine, 224
Q
q
KWDB command, 80
Q4 command
adddebug, 161, 244
addmodule, 162, 244
brand, 144
catalog, 124, 244
code, 244
constant, 244
constants, 157
cpu select, 140
disassemble, 129, 244
discard, 159, 244
evaluate, 157, 244
examine, 152, 244
expr, 245
fields, 124, 246
find, 246
forget, 147, 246
getasm, 246
help, 123, 246
history, 146, 246
include, 160, 246
keep, 159, 246
load, 141, 246
merge, 147, 247
modules, 162, 247
name, 143, 247
pileon, 142, 160, 247
pophistory, 148, 247
print, 148
pushhistory, 148, 247
q4 print, 247
q4 run, 247
q4 symbols, 247
q4 unset, 247
recall, 147, 248
run, 161
set cpu, 140
set crash event, 141
set thread, 141
symbols, 129
system, 248
trace, 134, 248
translate, 132, 248
unset, 158
variables, 158, 248
write, 154
q4 command scripts, 225
Q4 commands, 116, 244
q4 mode, 118
q4 print
Q4 command, 247
q4 run
Q4 command, 247
q4 symbols
Q4 command, 247
q4 unset
Q4 command, 247
quick reference
command, 236
quit
KWDB command, 236
R
reading commands, 82
reading locked pages, 210
reattaching
KWDB, 66
rebooting target system, 67, 79
recall
Q4 command, 147, 248
RecallByName routine, 227
Receive routine, 223
redirecting
input and output, 122
redirecting input, 122
redirecting script output, 217
reference
PERL programming, 213
references
history, 122
register support
additional, 102
registers
examining, 101
remote debugging, 19
remote dump analysis, 199
remote target problems, 252
restoring state, 148
return
KWDB command, 240
285
Index
rev
KWDB command, 242
routine
AddToTable, 228
Adjust, 227
CloseTable, 228
Elapsed, 231
Evaluate, 225
Examine, 225
Forget, 225
GetAllFieldNames, 230
GetAllFieldValues, 230
GetFieldsDec, 229
GetFieldsHex, 229
GetSymbolicField, 230
GetValues, 230
Include, 231
Interrupted, 229
Keep, 225
Load, 226
NameIt, 226
OpenTable, 228
Plural, 231
PopHistory, 226
PopPrintFlag, 224
PrintExprs, 228
PrintFields, 228
PrintMessageBuffer, 217
PrintResponse, 224
PrintTable, 228
PushHistory, 226
PushPrintFlag, 224
RecallByName, 227
Receive, 223
Send , 223
TossResponse, 224
Unique, 232
routines
miscellaneous, 231
run
Q4 command, 161
run command, 217
run queues, 175
analyze, 175
running scripts, 216
S
saving state , 148
script
analyze, 219
script installation verification, 215
script output
redirecting, 217
scripts
invoking, 217
PERL, 209
popular, 218
q4 command, 225
running, 216
286
writing, 223
selecting communication method, 21
Send routine, 223
serial communication, 21
Lantron, 21
server
KWDB, 37
set
KWDB command, 82, 240 , 242
set command, 83
KWDB, 82
set cpu
Q4 command, 140
set crash event
Q4 command, 141
set kwdb
KWDB command, 83
set kwdb q4
KWDB command, 118
set thread
Q4 command, 141
set up instructions
KWDB, 24
setting breakpoints, 86
setting conditional breakpoints, 89
setting context, 140
setting temporary breakpoints, 86
setting up KWDB, 19
setting watchpoints, 90
shell
KWDB command, 85
shell scripts
invoking, 85
show
KWDB command, 242
SOMs
Spectrum Object Modules, 270
SONIC LAN, 20
SONIC LAN communication, 26
source
KWDB command, 82
source code
displaying, 94
examining, 94
source files, 94, 242
finding, 94
source files commands
dir, 242
forw, 242
info, 242
list, 242
rev, 242
show, 242
source level debugging, 67
special kernel debugging commands, 242
cpu, 242
set, 242
Spectrum Object Modules
SOMs, 270
stack
kernel, 239
moving, 103
Index
navigating, 102
stack trace
obtaining, 102
stack traces, 267
stacks
tracing, 134
starting comm server, 37
starting KWDB commands
kwdb, 236
write, 249
starting KWDB debugger, 45
state
restoring, 148
saving, 148
status
system, 187
status check
memory, 186
step
KWDB command, 91, 240
stepi
KWDB command, 240
stepi command, 92
stopping KWDB, 236
stopping KWDB commands
INTERRUPT, 236
quit, 236
string variables
printing, 98
structure
command, 117
structure fields
DLKM, 268
printing, 148
style guide, 232
SUB/SINC, 20
SUB/SINC communication, 25
supported commands
other, 250
symbol location
displaying, 104
symbol table, 241
symbol table commands
info, 241
ptype, 241
whatis, 241
symbol table information
displaying, 104
symbolic debug format, 270
symbols
kernel, 265
Q4 command, 129
synthetic fields, 121
system
KWDB command, 85
Q4 command, 248
system crash, 194
system daemons
check, 185
system processor
IPF, 190
PA , 189
system status, 187
check, 173
system target
detaching, 66
systems debugging
multiple processor, 106
systems with threads, 171
T
table
symbol, 241
target
KWDB command, 237
remote problems, 252
target system
attaching, 46
booting, 46
detaching, 66, 79
rebooting, 67, 79
targets
attaching and debugging, 236
tbreak
KWDB command, 86, 239
tcatch
KWDB command, 108, 242
temporary breakpoints
setting, 86
testing new constants, 264
testing new entry, 262
threads
analyze, 177
timeouts in effect
code, 114
TOC
Transfer of Control, 168, 196
TossResponse routine, 224
trace
Q4 command, 134, 248
trace crash event, 188
trace IPF system processor, 190
trace process, 191
traces
stack, 267
tracing stacks, 134
Transfer of Control
TOC, 168, 196
translate
Q4 command, 132, 248
translating virtual addresses, 132
translation
address, 266
trapping panics, 106
PA-RISC, 106
troubleshooting, 251
U
UDP communication, 20, 24
UDP target
boot and attach, 61
uncatch
KWDB command, 108, 242
287
Index
undisplay
KWDB command, 241
Unique routine, 232
unset
Q4 command, 158
until
KWDB command, 240
up
KWDB command, 103, 239
using breakpoints, 85
utility
kwdb_config_kern, 40
V
values
displaying, 98
expressions and fields, 229
variable
char*, 98
variable value
printing, 96
variables, 118
debugger, 99
destroying, 158
examining, 96
listing, 158
Q4 command, 158, 248
V-class target, 48
boot and attach, 48
version information, 123
virtual addresses
translating, 132
virtual space IDs
specifying, 100
W
watch
KWDB command, 90, 239
watchpoints
setting, 90
whatis
KWDB command, 241
write
KWDB command, 249
Q4 command, 154
writing kernel files, 154, 155
writing KWDB
compatible code, 259
writing memory, 154
writing scripts, 223
X
x
KWDB command, 100, 240
288