1
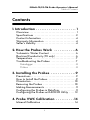
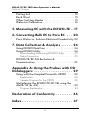
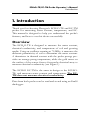
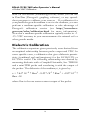
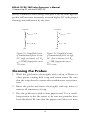
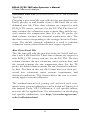
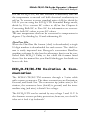
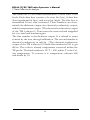
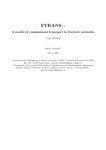
ECH2O-TE/EC-TM
Water Content, EC
and Temperature Sensors
Operator’s Manual
Version 5
©2007 Decagon Devices, Inc.
All rights reserved.
Decagon Devices, Inc.
2365 NE Hopkins Court
Pullman WA 99163
10370-05
ECH2O-TE/EC-TM Probe Operator’s Manual
Table of Contents
Contents
1. Introduction . . . . . . . . . . . . . . . . . . . . . . 1
Overview . . . . . . . . . . . . . . . . . . . . . . . . . . . . . . . . . . 1
Specifications . . . . . . . . . . . . . . . . . . . . . . . . . . . . . . 2
Contact Information . . . . . . . . . . . . . . . . . . . . . . . . . 4
Warranty Information . . . . . . . . . . . . . . . . . . . . . . . 4
Seller’s Liability . . . . . . . . . . . . . . . . . . . . . . . . . . . . . 4
2. How the Probes Work . . . . . . . . . . . .6
Volumetric Water Content . . . . . . . . . . . . . . . . . . . 6
Electrical Conductivity (TE only) . . . . . . . . . . . . . . . 6
Temperature . . . . . . . . . . . . . . . . . . . . . . . . . . . . . . . 7
Troubleshooting the Probes . . . . . . . . . . . . . . . . . . 7
Datalogger . . . . . . . . . . . . . . . . . . . . . . . . . . . . . . . . . 8
Probes . . . . . . . . . . . . . . . . . . . . . . . . . . . . . . . . . . . . . 8
3. Installing the Probes . . . . . . . . . . . . . .9
Precautions . . . . . . . . . . . . . . . . . . . . . . . . . . . . . . . . . 9
How to Install the Probes . . . . . . . . . . . . . . . . . . . . . 9
Orientation . . . . . . . . . . . . . . . . . . . . . . . . . . . . . . . . 10
Removing the Probes . . . . . . . . . . . . . . . . . . . . . . . 10
Making Measurements . . . . . . . . . . . . . . . . . . . . . . . 11
Configuring the Probes in DataTrac . . . . . . . . . . . 11
Configuring the Probes with ECH2O Utility . . . . 12
4. Probe VWC Calibration . . . . . . . . . . 14
Mineral Calibration . . . . . . . . . . . . . . . . . . . . . . . . 14
i
ECH2O-TE/EC-TM Probe Operator’s Manual
Table of Contents
Potting Soil . . . . . . . . . . . . . . . . . . . . . . . . . . . . . . . .
Rock Wool . . . . . . . . . . . . . . . . . . . . . . . . . . . . . . . .
Other Soil-less Media . . . . . . . . . . . . . . . . . . . . . .
Dielectric Calibration . . . . . . . . . . . . . . . . . . . . . . .
15
15
15
16
5. Measuring EC with the ECH2O-TE . . 17
6. Converting Bulk EC to Pore EC . . . 20
Pore Water vs. Solution Electrical Conductivity 22
7. Data Collection & Analysis . . . . . . 24
Using ECH2O DataTrac . . . . . . . . . . . . . . . . . . . . .24
Using ECH2O Utility . . . . . . . . . . . . . . . . . . . . . . . .24
Downloading Data using ECH2O Utility . . . . . . . 25
Data Conversion . . . . . . . . . . . . . . . . . . . . . . . . . . . 25
ECH2O-TE/EC-TM Excitation &
Communication . . . . . . . . . . . . . . . . . . . . . . . . . . . .27
Appendix A: Using the Probes with CSI
Dataloggers . . . . . . . . . . . . . . . . . . . . . 29
Using with the Campbell Scientific CR10X . . . . . 29
Explanation . . . . . . . . . . . . . . . . . . . . . . . . . . . . . . . . 29
Sample Program for the CR10X . . . . . . . . . . . . . . . 30
Multiplexing the ECH2O-TE/EC-TM using the
AM16/32 (or 416) . . . . . . . . . . . . . . . . . . . . . . . . . . 33
Program Explanation . . . . . . . . . . . . . . . . . . . . . . . . 33
Declaration of Conformity . . . . . . . . . 36
Index . . . . . . . . . . . . . . . . . . . . . . . . . . . . 37
ii
ECH2O-TE/EC-TM Probe Operator’s Manual
1. Introduction
1. Introduction
Thank you for choosing Decagon’s ECH2O-TE and EC-TM
probes for measuring water content, temperature, and EC.
This manual is designed to help you understand the probe’s
features, and how to use this device successfully.
Overview
The ECH2O-TE is designed to measure the water content,
electrical conductivity, and temperature of soil and growing
media. Using an oscillator running at 70 MHz, it measures the
dielectric permittivity of soil to determine the water content.
A thermistor in thermal contact with the probe prongs provides an average prong temperature, while the gold traces on
the surface of the sensor form a four-probe electrical array to
measure electrical conductivity (see Figure 1).
The ECH2O EC-TM is the same in design as the ECH2OTE, and measures water content and temperature. The ECTM does not measure electrical conductivity.
Data from both probes can be read and stored using an Em50
datalogger.
1
ECH2O-TE/EC-TM Probe Operator’s Manual
1. Introduction
Specifications
connection cable
thermal sensor
(thermistor)
4-probe
electrical
array
(TE Only)
dielectric VWC
sensor
Figure 1: ECH2O-TE/EC-TM components
Dimensions: 10cm (l) x 3.2cm (w) x 0.7cm (d)
Prong Length: 5.2 cm
Power requirement: 3-15 VDC, 0.3 mA quiescent, 10 mA
for 9 ms measurement
Dielectric measurement frequency: 70 MHz
Output: 3.5 mm stereo plug RS-232 or SDI-12 (contact
Decagon for information on SDI-12 mode)
Compatibility: EM50 Datalogger, CSI loggers w/ serial digital I/O
2
ECH2O-TE/EC-TM Probe Operator’s Manual
1. Introduction
Calibration: Mineral soil, rockwool, and potting soil supplied
in DataTrac. Calibrations for other growing media may be
available. Contact Decagon for information.
Volumetric water content:
Range: 0 - 100% VWC
Resolution:
Mineral soil: 0.1% VWC
Rockwool, Perlite, Potting Soil: 0.25% VWC
Accuracy:
Mineral soil: ±3% VWC, up to 8 dS/m*
Rockwool: ± 3% VWC, 0.5 to 8 dS/m
Potting Soil: ± 3% VWC, 3 to 14 dS/m
NOTE: Electrical conductivities were measured by saturation
extract (solution EC).
*With a soil specific calibration you can achieve an accuracy of
±1-2% VWC for all mineral soils.
Temperature:
Range: -40 to + 50 °C
Resolution: 0.1 °C
Accuracy: ±1 °C
Electrical Conductivity (ECH2O-TE only):
Range: 0 to 50 dS/m (Bulk)
Resolution: 0.01 dS/m from 0 to 10 dS/m; 0.1 dS/m from 0
to 50 dS/m (Extended EC Range mode)
Accuracy: ±10% 0 to 6 dS/m (bulk)**; user calibration
required at higher EC
**Note that the 6 dS/m upper limit for the 10% accuracy represents a “bulk EC” not solution EC. Even a saline soil with
3
ECH2O-TE/EC-TM Probe Operator’s Manual
1. Introduction
very high solution EC (>20 dS/m) may not have a bulk EC
higher than 6 dS/m. Thus, even those who are working in
saline soils often will not need bulk EC measurements above 6
dS/m.
Contact Information
If you need to contact Decagon:
• Call us at (509) 332-2756
• Fax us at (509) 332-5158
• E-mail us at [email protected].
Warranty Information
All Decagon products have a 30-day satisfaction guarantee
and a one-year warranty.
Seller’s Liability
Seller warrants new equipment of its own manufacture against
defective workmanship and materials for a period of one year
from date of receipt of equipment (the results of ordinary
wear and tear, neglect, misuse, accident and excessive deterioration due to corrosion from any cause are not to be considered a defect); but Seller’s liability for defective parts shall in
no event exceed the furnishing of replacement parts F.O.B. the
factory where originally manufactured. Material and equipment covered hereby which is not manufactured by Seller shall
be covered only by the warranty of its manufacturer. Seller
shall not be liable to Buyer for loss, damage or injuries to persons (including death), or to property or things of whatsoever
kind (including, but not without limitation, loss of anticipated
profits), occasioned by or arising out of the installation, operation, use, misuse, nonuse, repair, or replacement of said material and equipment, or out of the use of any method or
4
ECH2O-TE/EC-TM Probe Operator’s Manual
1. Introduction
process for which the same may be employed. The use of this
equipment constitutes Buyer’s acceptance of the terms set
forth in this warranty. There are no understandings, representations, or warranties of any kind, express, implied, statutory
or otherwise (including, but without limitation, the implied
warranties of merchantability and fitness for a particular purpose), not expressly set forth herein.
5
ECH2O-TE/EC-TM Probe Operator’s Manual
2. How the Probes Work
2. How the Probes Work
The following paragraphs will explain in greater detail the
principles behind how the ECH2O-TE and EC-TM operate.
Volumetric Water Content
Both probes use an electromagnetic field to measure the
dielectric permittivity of the surrounding medium. The probes
supply a 70 MHz oscillating wave to the probe prongs that
charges according to the dielectric of the material. The stored
charge is proportional to soil dielectric and soil volumetric
water content. The ECH2O-TE/EC-TM microprocessor
measures the charge and outputs a value from the probe.
Electrical Conductivity (TE only)
Electrical conductivity (EC) is the ability of a substance to
conduct electricity and can be used to infer the amount of
polar molecules that are in solution (see chapter on EC). It is
measured by applying an alternating electrical current to two
outer electrodes, and measuring the voltage between two inner
ones. Both this voltage and the current are used to determine
conductance. Conductivity is then derived by multiplying voltage and conductance by the cell constant (the ratio of the distance of the electrodes to their area).
The ECH2O-TE uses a 4-probe array to measure the EC. The
array is located on the four strips of gold on two of the
ECH2O-TE prongs. Care should be taken not to damage the
gold surface as doing so could reduce the reliability of the
6
ECH2O-TE/EC-TM Probe Operator’s Manual
2. How the Probes Work
measurement; excessive insertion into abrasive material like
sand will speed deterioration of the material. If the gold surface appears dull, it can be cleaned with a cleanser containing a
small amount of grit or pumice. Be careful not to contaminate
the gold traces with skin oils or other non-conducting material. Small amounts of oil from skin contact with the gold
traces will cause significant inaccuracy in the EC measurement. See Chapter 5 on EC for instructions on cleaning the
probes if contamination occurs.
Temperature
The ECH2O-TE and EC-TM use a surface-mounted thermistor to take temperature readings. It is located underneath
the probe overmold, next to one of the prongs. Because it is
soldered to the copper ground trace on the board, it is in thermal contact with the probe prongs and will read an average
temperature along the prong surface. Both probes will output
temperature in °C unless otherwise stated in your preferences
file in either the ECH2O DataTrac or ECH2O Utility programs.
It is important to note that if the black plastic overmold of the
probe is in direct sunshine, the temperature measurement may
read high. If your application requires putting the probe overmold in the sun, you may want to consider techniques to
reduce the radiation load such as shading, burying completely
in the soil, or painting the overmold white.
Troubleshooting the Probes
If you encounter problems with the ECH2O-TE or EC-TM
probe, they most likely will manifest themselves in the form of
7
ECH2O-TE/EC-TM Probe Operator’s Manual
2. How the Probes Work
incorrect or erroneous readings. Before contacting Decagon
about the sensor, do the following:
Datalogger
1. Check to make sure the connections to the data logger are
both correct and secure.
2. Ensure that your data logger's batteries are not dead or
weakened.
3. Check the configuration of your probes in ECH2O Utility
or ECH2O DataTrac to make sure you have selected
“ECH2O-TE Moisture/Temp/EC” or “EC-TM Moisure/Temp” under Sensor Type, and that you have chosen
a calibration equation under the “Calibration” tab to use
with the probes.
Probes
1. Ensure that your probes are installed according to the
“Installation” section of this manual.
2. Check probe cables for nicks or cuts that could cause a
malfunction.
3. Check your electrical conductivity sensor traces to ensure
that they are not tarnished, damaged, or contaminated.
If you require additional customer service, please contact
Decagon at (509) 332-2756 or at [email protected].
8
ECH2O-TE/EC-TM Probe Operator’s Manual
3. Installing the Probes
3. Installing the Probes
Precautions
Before you select a site for installation, remember that the soil
next to the probe surface has the strongest influence on its
readings. It is important to avoid air gaps or extremely compact soil around the probe, which can skew readings. Do not
install the ECH2O-TE or EC-TM next to large metal objects,
which can attenuate the probes’ electromagnetic field and distort output readings. Because the probes have gaps between
their prongs, it is also important to consider the size of the
media you are inserting the probe into. It is possible to get
sticks, bark, roots or other material stuck between the probe
prongs, which will adversely affect readings. Finally, be careful
when inserting the probes into dense soil, as the prongs will
break if excessive force is used when pushing them in.
Note: The probes were designed to measure VWC in place. Although it
is possible to use them as a push-in probe at several holes, it is likely that
the gold electrical conductivity array will be damaged by repeated insertion
in hard material like sand or dry soil.
How to Install the Probes
The ECH2O-TE and EC-TM can be inserted directly into
growing media or soil. The tip of each prong has been sharpened to make it easier to push the probe in. Be careful around the
sharpened tips! The probe needs to be completely covered by
soil, as shown in Figure 2.
9
ECH2O-TE/EC-TM Probe Operator’s Manual
3. Installing the Probes
Figure 2: ECH2O-TE/EC-TM installed correctly
The probes may be difficult to insert into extremely compact
or dry soil. If you have difficulty inserting the probe, try loosening the soil somewhat or wetting the soil. Never pound the
probe in.
Orientation
Both probes can be oriented in any direction. Because the
probes have prongs instead of a blade (like the EC-10 and EC20), the probe can be placed in any orientation that meets your
requirements.
Removing the Probes
When removing either probe, do not pull it by the cable! This
could break the internal wires and cause the probe to malfunction or not function at all.
10
ECH2O-TE/EC-TM Probe Operator’s Manual
3. Installing the Probes
Making Measurements
The ECH2O-TE and EC-TM have been designed to work
specifically with the Em50 datalogger. To download data to
your computer, you will need to install ECH2O Utility,
ECH2O DataTrac or a terminal-port program on your computer. Please see Chapter 6 for more information.
Configuring the Probes in DataTrac
1. Make sure that the ECH2O-TE or EC-TM is properly
connected to an Em50, and that the Em50 is connected to
your computer.
2. Open the program. Select the appropriate COM port and
click Connect.
3. Double click on your Em50 (under New Devices in the
left-hand “Device Directory” window)
4. Under the “Logger” tab, configure your logger as appropriate
5. Under the “Configuration” tab, in the “Sensors” section,
select the Port to which your probe is connected. Under
“Sensor Type”:
- Select ECH2O-TE Moisture/Temp/EC if using the
ECH2O-TE probe; or
- Select EC-TM Moisture/Temp if using the EC-TM
probe.
6. Be sure to set the calibration for your probe under “Calibration” tab. If you don't, no data will be shown in your
graph window. Choose the calibration appropriate for
your growing medium or soil. These calibration equations
were derived from material obtained at the factory. If a
11
ECH2O-TE/EC-TM Probe Operator’s Manual
3. Installing the Probes
more precise calibration is desired, you should follow
directions found in http://www.decagon.com/appnotes/echocal.pdf. You can also ask about Decagon’s
custom calibration service.
7. You can alter other settings as well, such as the graph line
color, axis range, etc. Click OK to make the settings permanent.
8. Once you have exited back to Chart View, click “Download”. After all information has finished processing, the
computer will automatically update the chart or table,
applying any color or line settings you have made.
Note: You can also use a terminal-port program to take readings. Please refer to Appendix A for instructions, as well as
explanations of the types of readings.
Configuring the Probes with ECH2O
Utility
1. Make sure the ECH2O-TE or EC-TM is properly connected to an Em50, and that the Em50 is connected to
your computer.
2. Open ECH2O Utility. Select the appropriate COM port
and click Connect.
3. In the "Measurement" window, click on the drop down
menu by the port to which your ECH2O-TE/EC-TM is
connected, and select ECH2O-TE Moisture/Temp/EC
if using the TE, or EC-TM Moisture/Temp if using the
EC-TM. If the bulk EC of your soil is likely to exceed
10 dS/m, then you should choose ECH2O-TE Extended
12
ECH2O-TE/EC-TM Probe Operator’s Manual
3. Installing the Probes
EC Range (available with Em50 firmware version 1.12 or
greater).
4. Under the Edit menu, select “Preferences”. Configure the
preferences for the units in which you wish ECH2O Utility to display the ECH2O-TE Water Content, Temperature, and Electrical Conductivity, or EC-TM Water
Content and Temperature, data.
5. Be sure to select an appropriate measurement interval.
6. Click "Apply" to save your settings.
13
ECH2O-TE/EC-TM Probe Operator’s Manual
4. Probe VWC Calibration
4. Probe VWC Calibration
The ECH2O-TE and EC-TM have been calibrated in media
types including mineral, organic, and potting soil and rock
wool. The goal of these calibrations was to create a generic
calibration equation that will work in all types of each media,
with an accuracy of better than ± 3% volumetric water content (VWC). If you need more accuracy, you can perform a
media-specific calibration to get the accuracy down to ±1-2%.
For more information on how to perform your own soil-specific calibration, or to have Decagon’s calibration service perform one for you, visit http://www.decagon.com/echo/
calibration.html.
Mineral Calibration
The probes were tested in four types of soil (sand, sandy loam,
silt loam, and clay) at solution electrical conductivities of 0.1
to > 5 dS/m and water contents from 0 to 35% volumetric
water content (VWC). The calibration equation generated
from these tests is:
θ = 1.087 * 10-3* Raw - 0.629
where θ is vol. water content and Raw is the output of the
probe sensors (see appendix). It is worth noting here that this
equation is linear. In fact, the linear fit provided as good a fit
in the mineral soil range as did a higher order polynomial, with
the added benefit that it is relatively easy to work with in datalogger programs, etc. However, one drawback with this
14
ECH2O-TE/EC-TM Probe Operator’s Manual
4. Probe VWC Calibration
approach is that, immersed in water, this calibration gives a
water content of ~80% VWC. This is because the calibration,
although linear in the mineral soil water content range we
tested (0 to ~35% VWC), actually is quadratic from 0 to 100%
VWC. This fact is apparent when calibrating probes in rockwool and other low-density material. If you want to develop
your own quadratic equation, perform a medium-specific calibration, or use Decagon's calibration service, see http://
www.decagon.com/echo/calibration.html.
Potting Soil
The comparatively higher porosity of organic soils like those
used for potting plants requires a different calibration equation. It is interesting to note that the main difference between
the calibrations is caused by the high air volume in the organic
soils that lowers the starting (dry media) dielectric of the sensor. The calibration for several potting soils at salinities ranging from 0 to > 8 dS/m is given:
θ = 1.04 * 10-3* Raw - 0.50
Using this equation, the output for the ECH2O-TE/EC-TM
in water will give you ~100% VWC.
Rock Wool
The calibration equation for rock wool growing media is:
θ = 5.15* 10-7 * Raw 2 + 1.41* 10-4 * Raw - 0.160
Other Soil-less Media
It is not possible to provide calibrations for all growing media.
We will, however, try to maintain a database of soil calibra15
ECH2O-TE/EC-TM Probe Operator’s Manual
4. Probe VWC Calibration
tions on our website (www.decagon.com) which you can use
in DataTrac (Decagon's graphing software), or any spreadsheet program to calibrate your sensors. If a calibration for
your particular growth medium is not in the database, you can
perform a medium-specific calibration or take advantage of
Decagon's calibration service (see http://www.decagon.com/echo/calibration.html for more information).
Note that a medium-specific calibration typically results in ~1
-2% VWC accuracy in your measurements for mineral soil or
other growth media.
Dielectric Calibration
The calibration equations given previously were derived from
an empirical relationship between probe output and VWC. In
some specific cases, a calibration that gives dielectric permittivity (combined real and imaginary) for the ECH2O-TE or
EC-TM is useful. The following relationship was derived by
measuring dielectric with a Campbell Scientific, Inc. TDR100
and a mini-TDR probe and correlating it with the output of
the probes. The dielectric of the medium, ε, is given by:
ε = 7.64* 10 -8 * Raw3 - 8.85* 10-5 * Raw2 + 4.85* 10-2 *
Raw -10
where Raw is the raw water content output of the probe.
16
ECH2O-TE/EC-TM Probe Operator’s Manual
5. Measuring EC with the ECH2O-TE
5. Measuring EC with the
ECH2O-TE
The ECH2O-TE uses a gold, four electrode array to measure
the bulk EC of the surrounding medium. The bulk EC measurement is calibrated at the factory to be within ±10% from
0 to 6 dS/m. This range is adequate for most field, greenhouse, and nursery applications. However, some special applications in salt affected soils may require measurements with
bulk EC greater than the specified range. The ECH2O-TE
will measure bulk EC up to at least 50 dS/m in the Extended
EC Range mode. However, the user will need to perform a
calibration on each probe in the extended range to ensure
accurate measurements.
Contamination on the EC Traces
The EC measurement is very sensitive to the presence of nonconducting contamination on the gold traces, especially at
high EC. The most common source of contamination is skin
oil from handling the gold traces with bare hands. Figure 3 a
and b show the simplified electrical circuit resulting from a
finger print on the gold traces in a low EC soil and high EC
soil, respectively. It is apparent that in a low EC soil, the
effects of contamination are relatively small, because the resistance in the soil dominates the total resistance. However, in a
high EC soil, the effects of contamination become very large.
This demonstrates the need to keep the traces clean, especially
when the probe is to be used in high EC soil. Contamination
of the gold traces during handling and shipping prevent the
17
ECH2O-TE/EC-TM Probe Operator’s Manual
5. Measuring EC with the ECH2O-TE
factory calibration from being valid past 6 dS/m, although the
probes will measure accurately at much higher EC with proper
cleaning and calibration by the user.
excitation
excitation
Rfinger print = 1 Ω
Rfinger print = 1 Ω
Rsoil = 100 Ω
Rsoil = 4 Ω
gnd
gnd
Figure 3b: Simplified circuit
of contaminated probe in high
EC (low resistance) soil. Rtotal=5Ω, fingerprint causes
25% error
Figure 3a: Simplified circuit
of contaminated probe in low
EC (high resistance) soil. Rtotal=101Ω, fingerprint causes
1% error.
Cleaning the Probes
1. Wash the gold traces thoroughly with a drop of Dawn or
other grease cutting dish soap and warm water. Be sure
that the soap doesn’t contain skin conditioners or moisturizers.
2. Rinse the probe and traces thoroughly with tap water to
remove all remnants of soap.
3. Dry the gold traces with a clean paper towel. Use a scrubbing motion to dry the traces to be sure any particles have
been detached. Be sure that the paper towel does not have
18
ECH2O-TE/EC-TM Probe Operator’s Manual
5. Measuring EC with the ECH2O-TE
any skin conditioners or moisturizers in it, as this will
undo all of the cleaning that you have just accomplished.
4. Be sure not to touch the gold traces with an un-gloved
hand or to contact them with any source of oil or other
non-conducting residue.
19
ECH2O-TE/EC-TM Probe Operator’s Manual
6. Converting Bulk EC to Pore EC
6. Converting Bulk EC to Pore
EC
For many applications, it is advantageous to know the electrical conductivity of the solution contained in the soil pores
(σp), which is a good indicator of the solute concentration in
the soil. Traditionally, σp has been obtained by extracting pore
water from the soil and measuring σp directly. As one would
expect, this is a time consuming and labor intensive process.
The ECH2O-TE measures the electrical conductivity of the
bulk soil surrounding the probes (σb). A considerable amount
of research has been conducted to determine the relationship
between σb and σp. Recent work by Hilhorst (2000), has taken
advantage of the linear relationship between the soil bulk
dielectric permittivity (εb) and σp to allow accurate conversion
from σb to σp if the εb is known. The ECH2O-TE measures
εb and σb nearly simultaneously in the same soil volume. It is
therefore well suited to this method.
The pore water conductivity can be determined from (see Hilhorst, 2000 for derivation):
(1)
σp =
ε 'p σ b
ε 'b −ε 'σ b =0
where σp is the pore water electrical conductivity (dS/m); εP is
the real portion of the dielectric permittivity of the soil pore
water (unitless); σb is the bulk electrical conductivity, (dS/m),
20
ECH2O-TE/EC-TM Probe Operator’s Manual
6. Converting Bulk EC to Pore EC
which is measured directly by the ECH2O-TE; εb is the real
portion of the dielectric permittivity of the bulk soil (unitless);
is the real portion of the dielectric permittivity of dry soil
(unitless).
εp can be calculated from soil temperature using:
εp = 80.3 - 0.37 * (Tsoil - 20)
(2)
where Tsoil is the soil temperature (C) measured by the
ECH2O-TE.
εb is also measured by the ECH2O-TE. Raw VWC counts can
be converted to bulk dielectric by the ECH2O-TE dielectric
calibration:
εb = 7.64* 10 -8 * Raw3 - 8.85* 10 -5 * Raw2 +4.85* 10-2 *
Raw -10
(3)
Finally, εσb = 0 is an offset term loosely representing the
dielectric permittivity of the dry soil. Hilhorst (2000) recommended that εσb = 0 = 4.1 be used as a generic offset. However, our research in several agricultural soils, organic, and
inorganic growth media indicates that εσb = 0 = 6 results in
more accurate determinations of σp. Hilhorst (2000) offers a
simple and easy method for determining for individual soil
types, which will improve the accuracy of the calculation of σp
in most cases.
Our testing indicates that the above method for calculating σp
results in good accuracy (± 20%) in moist soils and other
growth media. In dry soils where VWC is less than about 0.10
21
ECH2O-TE/EC-TM Probe Operator’s Manual
6. Converting Bulk EC to Pore EC
m3/m3, the denominator of equation 1 becomes very small,
leading to large potential errors. We recommend that σp not
be calculated in soils with VWC < 0.10 m3/m3 using this
method.
Pore Water vs. Solution Electrical
Conductivity
As noted in the previous section, pore water electrical conductivity can be calculated from bulk EC using the probe-measured dielectric permittivity of the medium. However, pore
water EC is not the same as solution EC. Pore water EC is the
electrical conductivity of the water in the pore space of the
soil. One could measure this directly if the soil was squeezed
under high pressure to force water out of the soil matrix and
that water was collected and tested for EC. Solution EC is the
electrical conductivity of pore water removed from a saturated
paste. In this case, the soil is wetted with distilled water until
the soil saturates, then it is placed on filter paper in a vacuum
funnel and suction is applied. An electrical conductivity measurement on the water removed from the sample will give the
solution electrical conductivity. Theoretically, the two are
related by the bulk density. An example calculation will illustrate this relationship: A soil is at 0.1 m3/m3 VWC, has a pore
water EC of 0.7 dS/m, and a bulk density of 1.5 Mg/m3. We
can calculate the solution EC as follows.
1.5
ρb
= 1−
= 0.43
ρs
2.65
σ pθ + σ d (φ − θ ) 0.7(0.1) + 0
Solution EC =
=
= 0.162 dS/m
φ
0.43
φ = 1−
22
ECH2O-TE/EC-TM Probe Operator’s Manual
6. Converting Bulk EC to Pore EC
In this example, ø is the porosity, ρb is bulk density, ρs is density of the minerals (assumed to be 2.65 Mg/m3), subscript d
is distilled water, and θ is volumetric water content. We
assume that the EC of the distilled water is 0 dS/m. In practice, solution EC calculated from this method and solution EC
taken from a laboratory soil test may not agree well because
wetting soil to a saturated paste is very imprecise.
Converting Bulk EC to Pore EC using
ECH2O DataTrac and ECH2O Utility
Both the ECH2O DataTrac and ECH2O Utility programs will
display electrical conductivity measurements from the
ECH2O-TE as either bulk or pore water EC. The ECH2OTE measures bulk EC directly, and the conversion described
in the previous section is used to calculate pore water EC. In
ECH2O DataTrac, you can choose which EC unit to display
under Setup > DataTrac Preferences (See DataTrac user
manual for more information). In the ECH2O Utility program, you can choose which EC unit to display under Edit >
Preferences. If the volumetric water content of the soil is less
than 0.10 m3/m3, then the software will not perform the conversion to solution EC, and then no data will be displayed if
solution EC is chosen in the preferences. Bulk EC will be displayed regardless of volumetric water content.
Reference:
Hilhorst, M.A. 2000. A pore water conductivity sensor. Soil
Sci. Soc. Am. J. 64: 1922-1925.
23
ECH2O-TE/EC-TM Probe Operator’s Manual
7. Data Collection & Analysis
7. Data Collection & Analysis
When using the ECH2O-TE or EC-TM with Em50 loggers,
data are typically downloaded using the ECH2O DataTrac or
ECH2O Utility programs. Following is a description of these
programs. When using the probes with other loggers, (e.g.
Campbell Scientific) please refer to Appendix A for information on programming.
Using ECH2O DataTrac
ECH2O DataTrac is designed for collecting and interpreting
data from ECH2O dataloggers and probes. For information
on how to configure a probe and download data using
DataTrac, please see the DataTrac user’s manual.
Using ECH2O Utility
ECH2O Utility is the free software that comes with all Em50
and Em5b loggers. It enables you to program and configure
your loggers as well as download data in a format that can be
used in a spreadsheet program for analysis. To use the
ECH2O probes with ECH2O Utility, you must first configure
your Em50 to read each probe.
1. Make sure the probe you will use is properly connected to
an Em50, and that the Em50 is connected to your computer.
2. Open ECH2O Utility. Select the appropriate COM port
and click Connect.
3. In the “Measurement” window, click on the drop down
menu by the port to which your TE is connected, and
select ECH2O-TE Moisture/Temp/EC if using the
24
ECH2O-TE/EC-TM Probe Operator’s Manual
7. Data Collection & Analysis
ECH2O-TE, or EC-TM Moisture/Temperature if using
the EC-TM. If the bulk EC of your soil is likely to exceed
10 dS/m, then you should choose ECH2O-TE Extended
EC Range (available with Em50 firmware version 1.12 or
greater).
4. Be sure to select an appropriate measurement interval.
5. Click "Apply" to save your settings.
Next you need to set your preferences for how ECH2O Utility
performs its data conversion. To do this, select Edit > Preferences. Then configure the preferences for the units in which
you wish ECH2O Utility to display the ECH2O-TE Water
Content, Temperature, and Electrical Conductivity data.
Downloading Data using ECH2O Utility
After collecting data, you download data from the Em50 using
ECH2O Utility.
1. Make sure that the Em50 is properly connected to your
computer.
2. Open ECH2O Utility. Select the appropriate COM port
and click Connect.
3. Click on the download Icon.
4. Select your preferred data file format (see below).
Data Conversion
ECH2O Utility has the ability to convert data saved on the
Em50 into several formats described below.
Using the “Scan” function in DataTrac and ECH2O Utility
You can take an instantaneous probe reading using the “Scan”
feature in DataTrac and ECH2O Utility by simply clicking
scan on the main screen. Do not scan more than every 5 seconds or the ECH2O-TE/EC-TM processor will not have rest
and will give only “ *** ” on the screen.
25
ECH2O-TE/EC-TM Probe Operator’s Manual
7. Data Collection & Analysis
Processed Data File (Processed Excel File or Tab-Delimited
Text File)
Choosing a processed file type will take the raw data from the
Em50, process it, and format it into a MS Excel file or tabdelimited text file. Three data columns are output for each
ECH2O-TE sensor, and two for the EC-TM. The first column contains the volumetric water content data, and the second contains the temperature data. For the TE probe, the
third column contains the electrical conductivity data. The
data have units corresponding to the settings chosen in Preferences. The default (mineral) calibration is used to calculate
volumetric water content from the raw output of probes.
Raw Data Excel File
This file type will take the raw data from the Em50 and format it into a MS Excel file. Three data columns are output for
each ECH2O-TE sensor, and two for the EC-TM. The first
column contains the raw volumetric water content data, and
the second contains the raw temperature data. For the TE
probe, the third column contains the raw electrical conductivity data. The data in this raw file format have not been processed into volumetric water content, temperature, and
electrical conductivity. This format allows the user to conveniently apply a custom calibration.
The standard mineral soil, potting soil, and rock wool volumetric water content calibrations can be found in Chapter 4 of
this manual: Probe VWC Calibration. A soil specific calibration can also be applied here. For information on developing
soil specific calibrations, visit http://www.decagon.com/
echo/calibration.html.
26
ECH2O-TE/EC-TM Probe Operator’s Manual
7. Data Collection & Analysis
For the ECH2O-TE, the raw electrical conductivity data are
the temperature corrected soil bulk electrical conductivity in
mS/m. To convert to more standard units of dS/m, divide by
100. If you are using the ECH2O-TE Extended Range mode,
divide by 10 to convert EC values to dS/m. See Chapter 6:
Converting Bulk EC to Pore EC for information on converting the bulk EC values to pore EC values.
The raw temperature data can be converted to temperature in
degrees C by dividing by 10 and subtracting 40.
DataTrac File
When the DataTrac file format (.dxd) is downloaded, a single
10 digit number is downloaded for each sensor. The .dxd format is easily imported into Decagon's convenient DataTrac
graphing software. It also has the advantage that it can be converted with ECH2O Utility to the other file formats listed
above. See the manual for your Em50 datalogger for details on
how to do this.
ECH2O-TE/EC-TM Excitation & Communication
The ECH2O-TE/EC-TM connects through a 3-wire cable
with a stereo connector. The three connections are Excitation,
Ground, and Serial Out. The connector tip (white wire) is Excitation, the connector base (shield) is ground, and the intermediate ring (red wire) is Serial Out voltage.
The ECH2O-TE can be excited by any voltage 3 and 15 V. It
also features reverse-polarity protection; however, care should be
taken not to hook it up backwards!
27
ECH2O-TE/EC-TM Probe Operator’s Manual
7. Data Collection & Analysis
The serial out is 1200 baud asynchronous CMOS with 3 volt
levels. Each data byte consists of a start bit (low), 8 data bits
(least significant bit first), and a stop bit (high). The first byte is
transmitted 50 ms after excitation. Three numbers are transmitted; the dielectric output, the electrical conductivity output,
and the temperature output. (The electrical conductivity output
of the TM is always 0.) Power must be removed and reapplied
for it to read and transmit again.
The first number is the dielectric output. It is related to water
content by the user through calibration. The second number is
electrical conductivity in mS/m. (The electrical conductivity
output of the TM is always 0.) Divide this number by 100 to get
dS/m. This value is already temperature corrected within the
TE probe. The final number is 10*T + 400, where T is the Celsius temperature. To convert it to temperature, subtract 400
and divide by 10.
28
ECH2O-TE/EC-TM Probe Operator’s Manual
Appendix A: Using the Probes with CSI Dataloggers
Appendix A:
Using the Probes with CSI
Dataloggers
This appendix presents example programs for CSI dataloggers
with the hope that the user will be able to take the basic components and apply them to other datalogger types. More sample programs for are available from the Decagon website, and
can be found at http://www.decagon.com/instruments/
agdownload.html.
Using with the Campbell Scientific
CR10X
Because the probes use digital rather than analog communication, they require special considerations when connecting to a
Campbell Scientific datalogger.
Explanation
To obtain a reading from the ECH2O-TE or EC-TM, the
datalogger supplies a 0.5 second pulse at 12 V to the probe
excitation (white wire). The ECH2O-TE outputs the data after
80 ms, but the TE is kept on to ensure complete data reception. After the probe has been read, there also must be a delay
between excitations to allow the probe to return to its quiescent state (we used 5 seconds which is a minimum)*.
* Note: There must be at least a 5 second delay between
ECH2O-TE/EC-TM excitations. This will allow the processor to fully rest.
29
ECH2O-TE/EC-TM Probe Operator’s Manual
Appendix A: Using the Probes with CSI Dataloggers
All probe excitations can be wired into one Switched 12 V
port. The probe will output (red wire) a 0 to 3 V ASCII TTL
signal at 1200 baud that will give three numeric values separated by a space and a character. Using the P15 command (see
program example), these three values will automatically be
read into three successive input locations on the datalogger.
Once they have been collected, they must be moved to
another input location or into final storage if you would like
them to be saved (not done in the program).
The probes each have a three-wire interface which comes in
two varieties: a 3-conductor 3.5 mm stereo plug and a blunt
cable with three bare wires. If you have the 3.5 mm stereo
plug, you need to either cut off the plug and strip the wires or
purchase a probe adapter pigtail from Decagon. The plug is
wired with the tip as excitation, ring (middle conductor) as
output, and the sleeve (bottom conductor) as ground.
The probes must be wired with the all white (excitation) wires
connected to the Switched (SW) 12 V excitation, red wires
connected to individual control ports starting at C4, bare
wires connected to ground, and a jumper wire from C3 to SW
12V Ctrl port.
To convert raw data to values of water content, EC, and temperature, refer to chapters 4 and 5. Please note that although
the TM will output three parameters, the EC will always be 0.
Sample Program for the CR10X
;Program: ECHO TE/EC-TM-CR10X Measurement.csi
;{CR10X}
;This program is an example of how to hook up ECHO-TE/EC-TM probes to
;the CR10X datalogger. This was written to leave Control Ports 1 and
;2(C1 & C2) free for other control purposes. C3 is wired to the Con
30
ECH2O-TE/EC-TM Probe Operator’s Manual
Appendix A: Using the Probes with CSI Dataloggers
;trol port of the Switched 12 V and there were five probes in all that
;were being measured. It is expected that you will modify this pro
;gram to your individual needs. However, you should consider the timing of this program to be the minimum timing possible to get good
;probe readings.
;Wiring:
;
;
;
;
All white wires (5 in this example) wired to SW 12V Channel on 10X
Individual red wires for Probe 1 to 5 in C4 to C8
Bare wires to ground
Jumper wire from SW 12 V Ctrl to C3
*Table 1 Program
01: 10
Execution Interval (seconds)
1: Do (P86)
1: 43
Set Port 3 High
2:
1:
2:
3:
4:
5:
6:
7:
8:
9:
10:
11:
12:
;
; Excites probes with 12 V using SW 12V
Port Serial I/O (P15)
1
Reps
0
8-Bit, TTL ASCII, 1200 Baud
0
TX after CTS
40
C4 TX/RX, No RTS/DTR (OS>1.14) ; Read probe w/
Control Port 4
1
Start Loc for TX [ P1_VWC_Ra ]
0
Number of Locs to TX
256
Termination Character for RX
50
Max Characters to RX
50
Time Out for CTS (TX) and/or RX (0.01 sec units)
1
Start Loc for RX [ P1_VWC_Ra ]
1
Mult for RX
0
Offset for RX
REPEAT PROCESS
3: Do (P86)
1: 53
Set Port 3 Low
4:
1:
2:
3:
4:
;
Turn excitation to probes off
Excitation with Delay (P22) ; Wait 0.5 sec to stabilize
1
Ex Channel
0
Delay W/Ex (0.01 sec units)
50
Delay After Ex (0.01 sec units)
0
mV Excitation
5: Do (P86)
1: 43
Set Port 3 High
6:
1:
2:
3:
4:
5:
6:
7:
Port Serial I/O (P15)
1
Reps
0
8-Bit, TTL ASCII, 1200 Baud
0
TX after CTS
50
C5 TX/RX, No RTS/DTR (OS>1.14)
1
Start Loc for TX [ P1_VWC_Ra ]
0
Number of Locs to TX
256
Termination Character for RX
31
ECH2O-TE/EC-TM Probe Operator’s Manual
Appendix A: Using the Probes with CSI Dataloggers
8:
9:
10:
11:
12:
50
50
4
1
0
Max Characters to RX
Time Out for CTS (TX) and/or RX (0.01 sec units)
Start Loc for RX [ P2_VWC_RA ]
Mult for RX
Offset for RX
7: Do (P86)
1: 53
Set Port 3 Low
8: Excitation with Delay (P22)
1: 1
Ex Channel
2: 0
Delay W/Ex (0.01 sec units)
3: 50
Delay After Ex (0.01 sec units)
4: 0
mV Excitation
;Repeat process
9: Do (P86)
1: 43
Set Port 3 High
10:
1:
2:
3:
4:
5:
6:
7:
8:
9:
10:
11:
12:
Port Serial I/O (P15)
1
Reps
0
8-Bit, TTL ASCII, 1200 Baud
0
TX after CTS
60
C6 TX/RX, No RTS/DTR (OS>1.14)
1
Start Loc for TX [ P1_VWC_Ra ]
0
Number of Locs to TX
256
Termination Character for RX
50
Max Characters to RX
50
Time Out for CTS (TX) and/or RX ; (0.01 sec units)
7
Start Loc for RX [ P3_VWC_RA ]
1
Mult for RX
0
Offset for RX
11: Do (P86)
1: 53
Set Port 3 Low
12: Excitation with Delay (P22)
1: 1
Ex Channel
2: 0
Delay W/Ex (0.01 sec units)
3: 50
Delay After Ex (0.01 sec units)
4: 0
mV Excitation
;Repeat process
13: Do (P86)
1: 43
Set Port 3 High
14:
1:
2:
3:
4:
5:
6:
7:
8:
9:
10:
11:
Port Serial I/O (P15)
1
Reps
0
8-Bit, TTL ASCII, 1200 Baud
0
TX after CTS
70
C7 TX/RX, No RTS/DTR (OS>1.14)
1
Start Loc for TX [ P1_VWC_Ra ]
0
Number of Locs to TX
256
Termination Character for RX
50
Max Characters to RX
50
Time Out for CTS (TX) and/or RX (0.01 sec units)
10
Start Loc for RX [ P4_VWC_Ra ]
1
Mult for RX
32
ECH2O-TE/EC-TM Probe Operator’s Manual
Appendix A: Using the Probes with CSI Dataloggers
12: 0
Offset for RX
15: Do (P86)
1: 53
Set Port 3 Low
16: Excitation with Delay (P22)
1: 1
Ex Channel
2: 0
Delay W/Ex (0.01 sec units)
3: 50
Delay After Ex (0.01 sec units)
4: 0
mV Excitation
;Repeat process
17: Do (P86)
1: 43
Set Port 3 High
18:
1:
2:
3:
4:
5:
6:
7:
8:
9:
10:
11:
12:
Port Serial I/O (P15)
1
Reps
0
8-Bit, TTL ASCII, 1200 Baud
0
TX after CTS
80
C8 TX/RX, No RTS/DTR (OS>1.14)
1
Start Loc for TX [ P1_VWC_Ra ]
0
Number of Locs to TX
256
Termination Character for RX
50
Max Characters to RX
50
Time Out for CTS (TX) and/or RX (0.01 sec units)
13
Start Loc for RX [ P5_VWC_Ra ]
1
Mult for RX
0
Offset for RX
19: Do (P86)
1: 53
Set Port 3 Low
Multiplexing the ECH2O-TE/EC-TM
using the AM16/32 (or 416)
The most effective way to measure large numbers of ECH2OTE/EC-TM probes on non-Decagon dataloggers is to use the
AM16/32 (or 416) multiplexer from Campbell Scientific. You
can multiplex up to 32 probes on each multiplexer. An example CR10X program has been included to help you set up the
probes correctly. It is written for five probes with the expectation that you will modify the program according to your
needs.
Program Explanation
This program will excite, read, and collect data from five
ECH2O-TE/EC-TM probes. A wiring explanation is given in
33
ECH2O-TE/EC-TM Probe Operator’s Manual
Appendix A: Using the Probes with CSI Dataloggers
the text of the program. When you wire the multiplexer to the
datalogger, there are a few things you MUST do. First, set
your multiplexer in 2 x 32 mode using the dip switch on the
multiplexer. Second, wire up all the control ports (RES, CLD,
GRD, 12V, etc.) exactly as indicated in the text of the program.
Failure to do this is the primary reason people struggle with
multiplexer measurements. Third, note that you can hook up
the SW-12V excitation (port H) and SE Ch. 1 (port L) to
either COM-Odd or COM-Even ports (they are tied
together).
To modify this program to your individual needs, simply
adjust the loop counts to the number of probes you will be
reading on the multiplexer. Note: This program does not have
any output instructions by design. Please modify add output
instructions to suit your needs.
Program:
;{CR10X}
;Program: 1200 BAUD RM1 SETUP PROGRAM.csi
;{CR10X}
; Example program to read 5 ECHO-TE probes
; using an AM16/32
; The multiplexer is running in 2x32 mode
; The ECHO TE/EC-TM has three wires that go to the
; following on the multiplexer:
;
;
;
;
;
;
;
;
;
;
;
;
;
Probe 1 (repeat
White --->
Red
--->
Bare --->
for probes 2 through 5)
1H (2H for probe 2, etc)
1L (2L for probe 2, etc)
Grnd
The multiplexer wiring should be as follows
CR10X
C1
--->
C2
--->
12 V --->
G
--->
C4
--->
SW 12V--->
AM16/32
Res
Clk
12V
G
Odd L
Odd H
Other wiring on the CR10X should be:
34
ECH2O-TE/EC-TM Probe Operator’s Manual
Appendix A: Using the Probes with CSI Dataloggers
;
C3
---) SW 12 V CTRL
*Table 1 Program
01: 5
Execution Interval (seconds)
cation
;
; Change to meet appli-
Turn on the multiplexer
1: Do (P86)
1: 41
Set Port 1 High
;
;
Sets the number of times to increment the
AM16/32
2: Beginning of Loop (P87)
1: 0
Delay
2: 5
Loop Count
;
Moves the multiplexer to the first channel
3: Do (P86)
1: 72
Pulse Port 2
4: Step Loop Index (P90)
1: 3
Step
;
Turns on the switched 12V, powers up the ECHO-TE
5: Do (P86)
1: 43
Set Port 3 High
;
;
;
;
;
;
;
;
;
;
;
;
Reads in the serial data from ECHO-TE.
Delays to make sure all data has been delivered.
The TX/RX command (#4) can be 40 or 3. It
appears that 40 may not work on older dataloggers
It should wait 50 ms to receive the data.
Any shorter and it will miss the info in.
(The ECHO-TE is communicating at 1200 baud)
The start location is incremented by 3 each time through the pro
gram because the ECHO-TE is outputting three numbers each time.
Please note the double dashed lines (--) in line 10: this
must be present or the datalogger will overwrite data from each
successive probe into the same 3 input locations.
6:
1:
2:
3:
4:
5:
6:
7:
8:
9:
10:
11:
12:
Port Serial I/O (P15)
1
Reps
0
8-Bit, TTL ASCII, 1200 Baud
0
TX after CTS
40
C4 TX/RX, No RTS/DTR (OS>1.14)
1
Start Loc for TX [ P1_VWC_Ra ]
0
Number of Locs to TX
13
Termination Character for RX
50
Max Characters to RX
50
Time Out for CTS (TX) and/or RX (0.01 sec units)
1
-- Start Loc for RX [ P1_VWC_Ra ]
1
Mult for RX
0
Offset for RX
35
ECH2O-TE/EC-TM Probe Operator’s Manual
Appendix A: Using the Probes with CSI Dataloggers
8:
7: Do (P86)
1: 53
Set Port 3 Low
End (P95)
36
ECH2O-TE/EC-TM Probe Operator’s Manual
Declaration of Conformity
Declaration of Conformity
Application of Council Directive:
Standards to Which Conformity
is Declared:
Manufacturer’s Name:
EN61326 : 1998
EN51022 : 1998
Decagon Devices, Inc.
2365 NE Hopkins Court
Pullman, WA 99163 USA
Type of Equipment:
Model Number:
89/336/EE6
Dielectric soil
moisture probe
ECH2O-TE/ECH2O EC-TM
Year of First Manufacture:
2005
This is to certify that the ECH2O-TE and ECH2O EC-TM
dielectric soil moisture probes, manufactured by Decagon
Devices, Inc., a corporation based in Pullman, Washington,
USA meet or exceed the standards for CE compliance as per
the Council Directives noted above. All instruments are built
at the factory at Decagon and pertinent testing documentation
is freely available for verification.
37
ECH2O-TE/EC-TM Probe Operator’s Manual
Index
Index
C
calibration
dielectric 16
mineral 14
potting soil 15
soil-less media 15
Communication protocol 27
contact information 4
converting bulk EC to pore EC 17, 20
CSI loggers
sample program for CR10X 30
using ECH2O TE probes with 29
D
DataTrac
configuring the ECHO TE in 11
downloading data
using ECH2O Utility 25
E
ECH2O Utility
downloading data 25
Excitation voltage 27
H
how the TE works
electrical conductivity 6
temperature 7
37
ECH2O TE Probe Operator’s Manual
Index
volumetric water content 6
I
installation
orientation 10
precautions 9
removing the probe 10
M
Multiplexing
using the CSI AM16/32 (or 416) 33
S
seller’s liability 4
T
Temperature
how ECH2O TE measures 7
W
warranty information 4
38