1
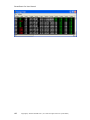
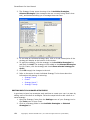
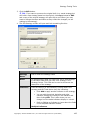
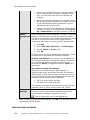
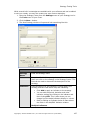
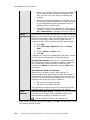
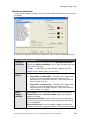
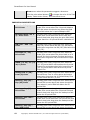
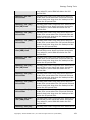
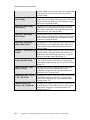
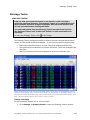
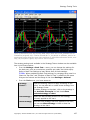
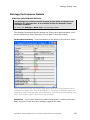
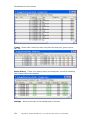
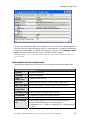
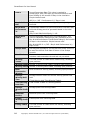
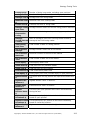
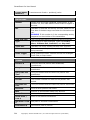
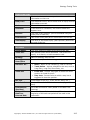
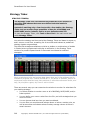
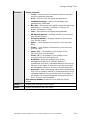
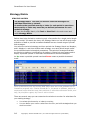
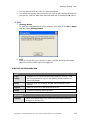
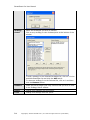
STREETSMART PRO®
STRATEGY TESTING TOOLS
Strategy Testing Tools ............................................................................. 177
Strategy Overview .................................................................................... 178
Strategy Center ........................................................................................ 183
Strategy Tester ........................................................................................ 193
Strategy Performance Details ..................................................................... 199
Strategy Ticker......................................................................................... 206
Strategy Matrix ........................................................................................ 212
177
StreetSmart Pro User Manual
Strategy Overview
Find out how you would have done in the market if you had used a
particular technical strategy. The Strategy Tester is our backtesting tool
that combines technical analysis strategies with historical market data
to help you make future trading decisions.
You can load results from the Strategy Tester into the Chart tool and
the Strategy Ticker® tool to help you find buy or sell opportunities in
real-time.
To open the Strategy Tester, click
in the Toolbar.
StreetSmart Pro® offers a comprehensive suite of tools that work in concert to
assist in providing a more user-friendly approach to technical analysis than is often
found in institutional trading software. If you use trading strategies based on
technical analysis principles or if you are interested in using back testing as part of
your stock selection process, the following tools aim to facilitate your efforts:
Strategy Center - At the heart of the Strategy tools is the Strategy Center, where
you create, save, and manage all the strategies you use in the Strategy tools. A
strategy consists of one or more indicators (such as a price crossover on Bollinger
Bands, Moving Average, Envelope, etc.) with an associated trade action (such as
Long Entry, Short Exit, etc).
The information you get from each strategy depends on what tool you apply it in.
For example, applying a strategy in the Strategy Tester tool or in a Chart will apply
the strategy for a certain period of time going backwards to see how well the
selected strategy would have performed historically for a stock or list of stocks.
Whereas in the Strategy Ticker and Strategy Matrix, the strategies are applied to
real-time data in order to flag occurrences of the selected strategy crossing
whatever threshold is set by the strategy.
The Strategy Center is accessible from any of the Strategy tools or from your
Charts.
178
Copyright © Charles Schwab & Co., Inc. 2006. All rights reserved. (0106-5667)
Strategy Testing Tools
Strategy Tester - Provides the ability to search through historical performance
results of back-tested technical strategies. It can help you identify the following:
•
Best performing Securities for a given Technical Strategy and Bar Size
•
Best performing combination of multiple Securities, Technical Strategies, and
Bar Sizes
•
Best 50 performing Technical Strategies for a Security and Bar Size
Stock symbols and price and volume data shown here and in the software are for
illustrative purposes only. Charles Schwab & Co., its parent or affiliates, and/or its
employees and/or directors may have positions in securities referenced herein, and
may, as principal or agent, buy from or sell to clients.
Charts - Visualize your back testing entry and exit points for individual positions in
your charts. The Charts tool has the same strategies available to it as the Strategy
Copyright © Charles Schwab & Co., Inc. 2006. All rights reserved. (0106-5667)
179
StreetSmart Pro User Manual
tools, and many of the studies in the Charts can be viewed in concert with the
corresponding Strategy to help you identify what triggered each trade.
EXAMPLE In the image below, we have a Bollinger Band study along with a
strategy utilizing a Bollinger Band indicator. You can see where the closing price of
any 15 minute bar crosses over the lower line, an entry is triggered, and where it
crosses above the top line, the position is exited.
Strategy Performance Details - For the historical testing tools like the Strategy
Tester and Charts, Performance Details provide a wealth of data for each stock and
strategy combination being tested. It not only summarizes all the data collected in
the process of the test, such as performance percentages, buy & hold performance
stats, winning/losing trade stats, hold times, etc., but it also breaks down each
execution, each round trip trade, and tracks equity history.
You can even change your Strategy Tester settings (i.e. changing the estimated
commission per trade, quantity per trade, initial equity, period for the test, etc.) to
see immediately how they affect the bottom line in the test.
180
Copyright © Charles Schwab & Co., Inc. 2006. All rights reserved. (0106-5667)
Strategy Testing Tools
Strategy Matrix™ - The Strategy Matrix tool lets you monitor technical strategies
for individual securities or indexes crossing thresholds specified by the strategies
being monitored.
Strategy Ticker® - The Strategy Ticker tool monitors the entire market and/or a
defined set of equity or index symbols in real-time for triggers against specific
technical strategies.
Once you have established one or more strategies to use in your trading, the
Strategy Ticker and Matrix tools will help identify opportunities based on those
strategies using real-time data.
Copyright © Charles Schwab & Co., Inc. 2006. All rights reserved. (0106-5667)
181
StreetSmart Pro User Manual
182
Copyright © Charles Schwab & Co., Inc. 2006. All rights reserved. (0106-5667)
Strategy Testing Tools
Strategy Center
STRATEGY CENTER OVERVIEW
The Strategy Center, which is accessible from any of the Strategy tools and the
Charts, is the heart of the Strategy suite of tools. It is the window in which you can
create, save, and manage all the strategies you use in the Strategy tools.
What is a Strategy?
A strategy consists of one or more indicators (such as a price crossover on Bollinger
Bands, SMA, Envelope, etc.) with an associated trade action (such as Long Entry,
Short Exit, etc).
The information you get from each strategy depends on what tool you apply it in.
For example, applying a strategy in the Strategy Tester or in a Chart will apply the
strategy for a certain period of time going backwards to see how well the selected
strategy would have performed historically for a stock or list of stocks.
Alternately, in the Strategy Ticker® and Strategy Matrix™, the strategies are
applied to real-time data in order to flag occurrences of the selected strategy
crossing whatever threshold is set by the strategy.
Using Strategies
You can apply strategies in several ways. Follow the links below to learn about each
approach:
•
Apply a built-in strategy
•
Create a new strategy, either based on a built-in strategy or from scratch
•
Edit a built-in or saved strategy and then apply it
To learn how to understand the results of running your strategies in any of the
Strategy Tools, click on the specific tool name below:
•
Strategy Tester
•
Charts
•
Strategy Matrix™
•
Strategy Ticker™
APPLYING BUILT-IN OR SAVED STRATEGIES
Several common strategies are provided with your software to get you started.
Using these at first can help you learn the tools as well as learn to create your own
strategies.
TIP: The following steps apply to any of the Strategy Tools. The only difference
is that the Chart window only allows one Strategy to be applied at a time, whereas
the other tools allow multiple strategies at once. Exceptions for this difference are
noted below.
1. In the strategy tool of choice, click Settings > Strategy Center... in the
menu (for Charts, click Tools > Strategy Center...)
Copyright © Charles Schwab & Co., Inc. 2006. All rights reserved. (0106-5667)
183
StreetSmart Pro User Manual
2. The Strategy Center opens showing a list of Available Strategies,
Selected Strategies (the strategies that are currently being used in that
tool), and buttons allowing you to manage these two lists:
3. To see what an individual strategy does, click on it and a description of the
strategy will display at the bottom of the window.
4. To apply the strategy, click the strategy in the Available Strategies list
and then click Add. The strategy will be added to the Selected Strategies
list (for Charts, click the strategy and check Show selected strategy on
chart).
5. Click OK to apply the changes to the tool.
6. Refer to the topics for each individual Strategy Tool to learn about the
information the strategy is returning:
•
Strategy Tester
•
Charts
•
Strategy Matrix™
•
Strategy Ticker®
EDITING BUILT-IN OR SAVED STRATEGIES
A good way to learn how strategies work and how to create your own is to start by
editing some of the built-in strategies. Follow the steps below to edit a built-in or
saved strategy:
1. Open the Strategy Center from the Settings menu of your Strategy tool or
the Tools menu of your Chart.
2. Click on a Strategy either in the Available Strategies or Selected
Strategies list.
184
Copyright © Charles Schwab & Co., Inc. 2006. All rights reserved. (0106-5667)
Strategy Testing Tools
3. Click the Edit button.
TIP: If you want to preserve the original built-in or saved strategy but
still build a new strategy based on the original, click Copy instead of Edit
and a copy of the original strategy will open with a new name (you may
want to change the name and Notes so they reflect the changes you are
making to the strategy).
4. The Edit Strategy window will open and look something like this:
EDIT STRATEGY FIELDS
Strategy
Name
Edit or enter the strategy name
Notes
An optional field. What you type here will be what displays
in the Notes field when you click on a strategy in the
Strategy Center. This field can be used to document the
description of the strategy.
Indicators
Lists the name(s) of the indicator(s) being used in the
strategy and the Trade Action they are indicating.
•
Click Add to apply another indicator to the strategy.
•
You can edit the period, deviation and other
indicator settings by clicking on the indicator and
then clicking Edit. This is also where you can
change how the trade indicators display in a chart.
•
Refer to Editing an Indicator to learn about the fields
in the Add/Edit Indicator window.
Multiple Indicators
Copyright © Charles Schwab & Co., Inc. 2006. All rights reserved. (0106-5667)
185
StreetSmart Pro User Manual
Money
Managemen
t
•
While it may simplify analysis to use one indicator at
a time (and then apply multiple strategies to the
tool), you can have more than one indicator per
strategy.
•
When using multiple indicators, the indicator at the
top of the list takes precedence over each one below
it, the second highest takes precedence over the
indicators below it and so forth.
•
Change the order of the indicators by clicking on the
indicator you wish to move and then clicking Move
Up or Move Down to change its position in the list.
Money Management tells the strategy to trigger a trade exit
based on a pre-determined Profit Exit, Stop Loss and/or
Trailing Stop percentage. If the Money Management criteria
are met, a Long Exit or Short Exit will trigger and the
strategy will start over by looking for Entry opportunities.
1. Click Add
2. Select Profit Exit, Stop Loss, or Trailing Stop
3. Set the %Gain or %Loss, and
4. Click OK.
To add two or more Money Management indicators, repeat
the steps above and select the remaining indicator.
On Back Test Assume: This option is only available with
the Trailing Stop Money Management indicator and allows
you to determine whether the test is based on more
conservative (Worst) or aggressive/positive (Best) back
test results.
More about On Back Test Assume
Because only bar data is used in back testing (i.e.
high/low/open/close) rather than tick data, the software
doesn't know in what order the high and low occurred. So,
to use the Trailing Stop Money Management function, the
software looks at two price action scenarios:
1. The Low occurs before the High
2. The High occurs before the Low
The software then labels the scenario that gives the most
profitable result as "Best" and the other one "Worst".
Chart
Settings
Connect Entry/Exit Points - A dashed line from the entry
to the exit point of each trade is displayed when this is
checked and the strategy is applied to a chart.
- Click to change the color of the dashed line.
5. When you are finished editing the strategy, click OK. This will return you to
the Strategy Center window.
CREATING NEW STRATEGIES
186
Copyright © Charles Schwab & Co., Inc. 2006. All rights reserved. (0106-5667)
Strategy Testing Tools
While several built-in strategies are available with your software and can be edited
to suit your needs, you may also create your own custom strategies.
1. Open the Strategy Center from the Settings menu of your Strategy tool or
the Tools menu of your Chart.
2. Click the New... button.
3. The New Strategy window will open and look something like this:
NEW STRATEGY FIELDS
Strategy
Name
Enter the strategy name
Notes
An optional field. What you type here will be what displays
when you click on the strategy in the Strategy Center. This
field can be used to document the description of the
strategy.
Indicators
Lists the name(s) of the indicator(s) being used in the
strategy and the Trade Action they are indicating.
•
Click Add to apply an indicator to the strategy.
•
You can edit the period, deviation and other
indicator settings by clicking on the indicator and
then clicking Edit. This is also where you can
change how the trade indicators display in a chart.
•
Refer to Editing an Indicator below to learn about
the fields in the Add/Edit Indicator window.
Multiple Indicators
Copyright © Charles Schwab & Co., Inc. 2006. All rights reserved. (0106-5667)
187
StreetSmart Pro User Manual
Money
Managemen
t
•
While it may simplify analysis to use one indicator at
a time (and then apply multiple strategies to the
tool), you can have more than one indicator per
strategy.
•
When using multiple indicators, the indicator at the
top of the list takes precedence over each one below
it, the second highest takes precedence over the
indicators below it and so forth.
•
Change the order of the indicators by clicking on the
indicator you wish to move and then clicking Move
Up or Move Down to change its position in the list.
Money Management tells the strategy to trigger a trade exit
based on a pre-determined Trailing Stop, Profit Exit, and/or
Stop Loss percentage. If the Money Management criteria
are met, a Long Exit or Short Exit will trigger and the
strategy will start over by looking for Entry opportunities.
1. Click Add
2. Select Profit Exit, Stop Loss, and/or Trailing
Stop.
3. Set the %Gain or %Loss, and
4. Click OK.
To add two or more Money Management indicators, repeat
the steps above and select the remaining indicator.
On Back Test Assume: This option is only available with
the Trailing Stop Money Management indicator and allows
you to determine whether the test is based on more
conservative (Worst) or aggressive/positive (Best) back
test results.
More about On Back Test Assume
Because only bar data is used in back testing (i.e.
high/low/open/close) rather than tick data, the software
doesn't know in what order the high and low occurred. So,
to use the Trailing Stop Money Management function, the
software looks at two price action scenarios:
1. The Low occurs before the High
2. The High occurs before the Low
The software then labels the scenario that gives the most
profitable result as "Best" and the other one "Worst".
Chart
Settings
Connect Entry/Exit Points - A dashed line from the entry
to the exit point of each trade is displayed when this is
checked and the strategy is applied to a chart.
- Click to change the color of the dashed line.
4. When you are finished creating the strategy, click OK. This will return you to
the Strategy Center window.
188
Copyright © Charles Schwab & Co., Inc. 2006. All rights reserved. (0106-5667)
Strategy Testing Tools
EDITING AN INDICATOR
From the Edit Strategy window, you can edit the individual indicators that comprise
a strategy.
A number of important settings are found here, each of which is described below:
EDIT INDICATOR FIELDS
Available
Indicators
Select an indicator from this set list of Available Indicators
and set the Period, Deviation, or any other variables that may
exist for the indicator.
TIP:
A description of each indicator displays near the
bottom of the window when you click on it.
Trade
Action
Chart
Display
Settings
Select which trade action types you want the indicator to flag.
•
Long Entry and Short Exit - If checked, will trigger when
a price or level cross takes place that, based on the
parameters of the selected indicator, may mean the stock
price is about to go up.
•
Long Exit and Short Entry - If checked, will trigger when
a price or level cross takes place that, based on the
parameters of the selected indicator, may mean the stock
price is about to go down.
Text Labels: Check the boxes to display labels showing the
Trade Action and/or Indicator Name when the Strategy is
applied to a chart.
Trade Action Pointer: Check to display an arrow pointing to
the exact price point at which the action takes place along the
bar or candlestick.
Directional Arrow: Check to display an up arrow when the
indicator parameters suggest an upturn in the stock price and a
Copyright © Charles Schwab & Co., Inc. 2006. All rights reserved. (0106-5667)
189
StreetSmart Pro User Manual
down arrow when the parameters suggest a downturn.
to change the color of the Text
Click the color wheel buttons
Labels, Trade Action Pointer, and Directional Arrow.
INDICATOR DESCRIPTIONS
Adaptive RSI (14) Price Cross
Strategy that enters long/exits short when the
trade price moves above the 14 period Adaptive
RSI and enters short/exits long when the trade
price falls below the 14 period Adaptive RSI.
Bollinger Bands (20, 2,
2) - Price Cross
Strategy that enters long/exits short when the
trade price moves above the lower band and
enters short/exits long when the price falls below
upper band on a 20 period BB with a deviation of
2.
DM(+DI) - DMI (-DI)
Cross
Strategy that enters long/exits short when the
DM(+DI) moves above the DM (-DI) and enters
short/exits long when the DM(+DI) falls below the
DM (-DI).
Envelope (21, 3%) Price Cross
Strategy that enters long/exits short when the
trade price moves above the lower band on a 21
period 3% Moving Average Envelope and enters
short/exits long when the price falls below upper
band.
MACD (12, 26) - SL (12,
26, 9) Cross
Strategy that enters long/exits short when the
(12, 26) period MACD moves above the 9 period
Signal Line and enters short/exits long when the
(12, 26) period MACD falls below the 9 period
Signal Line.
Money Flow % (20) Level (0) Cross
Strategy that enters long/exits short when the 20
Period Money Flow % moves above and enters
short/exits long when the 20 Period Money Flow
% falls below the zero (0) line.
Mov Avg - Exp (10) Exp (20) Cross
Strategy that enters long/exits short when the 10
period EMA moves above and enters short/exits
long when 10 period EMA falls below the 20
period EMA.
Mov Avg - Exp (20) Price Cross
Strategy that enters long/ exits short when the
trade price moves above the 20 period EMA and
enters short/exits long when the trade price falls
below the 20 period EMA.
Mov Avg - Exp (200) Price Cross
Strategy that enters long/ exits short when the
trade price moves above the 200 period EMA and
enters short/exits long when the trade price falls
below the 200 period EMA.
Mov Avg - Exp (50) Exp (200) Cross
Strategy that enters long/exits short when the 50
period EMA moves above and enters short/exits
190
Copyright © Charles Schwab & Co., Inc. 2006. All rights reserved. (0106-5667)
Strategy Testing Tools
long when 50 period EMA falls below the 200
period EMA.
Mov Avg - Exp (50) Price Cross
Strategy that enters long/ exits short when the
trade price moves above the 50 period EMA and
enters short/exits long when the trade price falls
below the 50 period EMA.
Mov Avg - Geo (10) Geo (20) Cross
Strategy that enters long/exits short when the 10
period GMA moves above and enters short/exits
long when 10 period GMA falls below the 20
period GMA.
Mov Avg - Geo (20) Price Cross
Strategy that enters long/ exits short when the
trade price moves above the 20 period GMA and
enters short/exits long when the trade price falls
below the 20 period GMA.
Mov Avg - Geo (200) Price Cross
Strategy that enters long/ exits short when the
trade price moves above the 200 period GMA and
enters short/exits long when the trade price falls
below the 200 period GMA.
Mov Avg - Geo (50) Geo (200) Cross
Strategy that enters long/exits short when the 50
period GMA moves above and enters short/exits
long when 50 period GMA falls below the 200
period GMA.
Mov Avg - Geo (50) Price Cross
Strategy that enters long/ exits short when the
trade price moves above the 50 period GMA and
enters short/exits long when the trade price falls
below the 50 period GMA.
Mov Avg - Sim (10) Sim (20) Cross
Strategy that enters long/exits short when the 10
period SMA moves above and enters short/exits
long when 10 period SMA falls below the 20
period SMA.
Mov Avg - Sim (20) Price Cross
Strategy that enters long/ exits short when the
trade price moves above the 20 period SMA and
enters short/exits long when the trade price falls
below the 20 period SMA.
Mov Avg - Sim (200) Price Cross
Strategy that enters long/ exits short when the
trade price moves above the 200 period SMA and
enters short/exits long when the trade price falls
below the 200 period SMA.
Mov Avg - Sim (50) Price Cross
Strategy that enters long/ exits short when the
trade price moves above the 50 period SMA and
enters short/exits long when the trade price falls
below the 50 period SMA.
Mov Avg - Sim (50) Sim (200) Cross
Strategy that enters long/exits short when the 50
period SMA moves above and enters short/exits
long when 50 period SMA falls below the 200
period SMA.
Mov Avg - Smo (10) -
Strategy that enters long/exits short when the 10
Copyright © Charles Schwab & Co., Inc. 2006. All rights reserved. (0106-5667)
191
StreetSmart Pro User Manual
Smo (20) Cross
period SmMA moves above and enters short/exits
long when 10 period SmMA falls below the 20
period SmMA.
Mov Avg - Smo (20) Price Cross
Strategy that enters long/ exits short when the
trade price moves above the 20 period SmMA and
enters short/exits long when the trade price falls
below the 20 period SmMA.
Mov Avg - Smo (200) Price Cross
Strategy that enters long/ exits short when the
trade price moves above the 200 period SmMA
and enters short/exits long when the trade price
falls below the 200 period SmMA.
Mov Avg - Smo (50) Price Cross
Strategy that enters long/ exits short when the
trade price moves above the 50 period SmMA and
enters short/exits long when the trade price falls
below the 50 period SmMA.
Mov Avg - Smo (50) Smo (200) Cross
Strategy that enters long/exits short when the 50
period SMA moves above and enters short/exits
long when 50 period SmMA falls below the 200
period SmMA.
RSI(14) - Level (70, 30)
Cross
Strategy that enters long/exits short when the 14
period Relative Strength Index moves above 30
and enters short/exits long when the 14 period
Relative Strength Index falls below 70.
Stoch %D (14, 3) Level (75, 25) Cross
Strategy that enters long/exits short when the
(14, 3) period %D moves above 25 and enters
short/exits long when the (14, 3) period %D falls
below 75.
Stoch %K (14) - %D
(14, 3) Cross
Strategy that enters long/exits short when the
(14) period %K moves above and enters
short/exits long when the (14) period %K falls
below the (14, 3) period %D.
Stoch RSI (14) - Level
(.75, .25) Cross
Strategy that enters long/exits short when the 14
period Stoch RSI moves below .75 and enters
short/exits long when the 14 period Stoch RSI
moves above .25.
Williams %R (14) Level (-25, -75) Cross
Strategy that enters long/exits short when the 14
period Williams %R moves below -25 and enters
short/exits long when 14 period Williams %R
moves above -75.
192
Copyright © Charles Schwab & Co., Inc. 2006. All rights reserved. (0106-5667)
Strategy Testing Tools
Strategy Tester
STRATEGY TESTER
Find out how you would have done in the market if you had used a
particular technical strategy. The Strategy Tester is our backtesting tool
that combines technical analysis strategies with historical market data
to help you make future trading decisions.
You can load results from the Strategy Tester into the Chart tool and
the Strategy Ticker® tool to help you find buy or sell opportunities in
real-time.
To open the Strategy Tester, click
in the Toolbar.
The Strategy Tester provides the ability to search through historical performance
results of back-tested technical strategies. It can help you identify the following:
•
Best performing Securities for a given Technical Strategy and Bar Size
•
Best performing combination of multiple Securities, Technical Strategies and
Bar Sizes
•
Best 50 performing Technical Strategies for a Security and Bar Size.
Stock symbols and price and volume data shown here and in the software are for
illustrative purposes only. Charles Schwab & Co., its parent or affiliates, and/or its
employees and/or directors may have positions in securities referenced herein, and
may, as principal or agent, buy from or sell to clients.
Testing a Strategy
To test a strategy against one or more symbols:
1. Click Settings > Strategy Center to open the Strategy Center window.
Copyright © Charles Schwab & Co., Inc. 2006. All rights reserved. (0106-5667)
193
StreetSmart Pro User Manual
2. Click on a strategy (notes with a description of each will appear at the
bottom of the window when clicked) and click Add. Repeat to add multiple
strategies.
3. If you wish to edit the strategy, you may also do this from the Strategy
Center.
4. Click OK to apply the strategy(ies).
Next, you will need to add the symbol(s) to test against.
1. Click Settings > Symbol List.
2. Add the symbol(s) to the list by typing the symbol and clicking Add, or by
loading a saved stock list by clicking Load List.
3. Click OK when you are satisfied with you Symbol List.
Now, you need to set up the parameters for the test:
1. Click Settings > Bar Sizes. The Bar Size, combined with the Number of
Bars to Test in the Back Test Settings (see below) determine the period for
which the test is executed.
2. Check one or more bar sizes. For scalping and other fast turnaround
techniques, a 5 Min bar size would be more appropriate, whereas a Daily
bar size would be better for someone with a longer term focus in their
trading. A separate test will be run for each bar size selected.
3. Click OK, and you should begin to see some data in your Strategy Tester if
you haven't already.
4. Finally, click Settings > Back Test.
5. Choose the desired Back Test Settings for the test:
BACK TEST SETTINGS
Number of Bars
for Test
This is used along with the Bar Size to determine
how far back to test and how frequently the price is
updated over that period.
EXAMPLE If Bar Size = 5 Min and Number of
Bars to Test = 100, the test will cover the last 500
minutes and base the test on the last trade price at
the end of each 5 minute interval.
Initial Equity
Choose from $10,000, $50,000, or $100,000 as
the "play money" being used in the test.
When the first trade is placed in the test, it will start
with the initial equity amount. Then, as trading
continues, your equity will increase or decrease
depending on the success of the trades.
Best
Performance
Determination
Your selection here will determine the initial sort
order of the list upon running the test.
APR% - Annual Percentage Rate. This value is
reached by multiplying a year (365 days) by the
Performance % and then dividing by the number of
days in the simulation. Simple interest used.
Sharpe Ratio - Risk adjusted profitability for the test
time period. $IRX will be used for the Risk Free Rate
194
Copyright © Charles Schwab & Co., Inc. 2006. All rights reserved. (0106-5667)
Strategy Testing Tools
of Return in the Sharpe formula.
Total Profit - Total Profit or Loss (includes open
positions)
Quantity per
Trade
Select how many shares or contracts to trade each
time a trade is triggered.
Equities - Choose from 100 Shares, 1000 Shares,
10% of Available Equity, or $5,000.
Commission per
Enter an approximate commission amount if you
want to factor that into your P&L.
TIPS:
•
Keep strategy/symbol/bar size combinations simple while you are learning to
use the tool so that you avoid getting frustrated by information overload.
Start by testing one symbol against a few strategies (or vice versa) and
selecting only one or two bar sizes at a time.
•
When establishing Back Test settings for a strategy being used in a Chart,
this setting will not be available. The "Bar Size" and “Number of Bars for
Test” is effectively the same thing as the Interval and the Range in the Chart
settings.
STRATEGY TESTER COLUMN DESCRIPTIONS
The following columns are available in the Strategy Tester window. To learn how to
configure columns, refer to Configuring Strategy Tester Columns.
STRATEGY TESTER COLUMNS
Symbol
Symbol for security
Strategy
Name of Technical Strategy
Bar Size
Time length of bar (e.g., 5 Min, 60 Min, Daily, etc.)
Closed P&L
Total profit or loss for closed positions
Open P&L
P&L from positions still open at the end of the test
Performance
%
A percentage measure of how much profit or loss the system
generated based on its initial equity
Performance % = ( Profit $ + Open P&L $) / Initial Equity($) *
100%
APR %
Annual Percentage Rate. This value is reached by multiplying
a year (365 days) by the Performance % and then dividing by
the number of days in the simulation. Simple interest used.
APR % = (365 * Performance %) / Days in test
Buy & Hold
P&L
Profit from a buy and hold strategy. Buy at beginning of test
and hold.
Buy & Hold
Performance
%
A percentage measure of how much profit or loss the a buy
and hold strategy would of generated based on its initial
equity.
Copyright © Charles Schwab & Co., Inc. 2006. All rights reserved. (0106-5667)
195
StreetSmart Pro User Manual
(Buy & Hold P&L/Initial Equity) * 100
Buy & Hold
APR %
Annual Percentage Rate for buy and hold strategy. This value
is reached by multiplying a year (365 days) by the Buy & Hold
Performance % and then dividing by the number of days in
the simulation. Simple interest used.
Buy & Hold APR % = (365 * Buy & Hold Performance %) /
Days in test
Sharpe Ratio
Risk adjusted profitability for the test time period. $IRX will be
used for the Risk Free Rate of Return in the Sharpe formula.
Winning
Trades
The total number of trades that made money, excluding open
positions.
Losing
Trades
The total number of trades that lost money, excluding open
positions.
Trade Profit $ Total profit from all profitable trades, excluding open
positions.
Trade Loss $
Total loss from all losing trades, excluding open positions.
Final Equity $ Ending equity from test (includes equity in open positions).
Highest
equity
balance
Highest amount of cash + position(s) value
Lowest
equity
balance
Lowest amount of cash + position(s) value
Note: Calculation is based on closing price of each bar and
includes open positions.
STRATEGY TESTING IN CHARTS
See a graphical representation of your Strategy Tester results in a
chart. View the entry and exit points the strategy identifies and
instantly see if the stock really did move up or down.
To set up, click Tools > Strategy Center in the Chart menu.
The image below shows long entry and exit points based on the Bollinger Band
strategy, which was applied to the chart.
196
Copyright © Charles Schwab & Co., Inc. 2006. All rights reserved. (0106-5667)
Strategy Testing Tools
Stock symbols and price and volume data shown here and in the software are for
illustrative purposes only. Charles Schwab & Co., its parent or affiliates, and/or its
employees and/or directors may have positions in securities referenced herein, and
may, as principal or agent, buy from or sell to clients.
The strategy testing tools available in the Strategy Tester window are also available
here in the Chart window:
•
From the Settings > Back Test... menu, you can change the settings for
the back test, such as commissions, quantity per trade, and initial equity.
Refer to Back Test Settings to learn about each of those settings.
TIP: When establishing Back Test settings for a strategy being used in a
Chart the "Bar Size" and “Number of Bars for Test” is effectively the same
thing as the Interval and the Range in the chart Settings > General.
•
From the Tools menu, you have access to:
Strategy
Center...
Open the Strategy Center to apply a strategy to the
chart. You can also edit or create a new strategy from
the Strategy Center.
To add a strategy to the chart, click on the strategy in
the Available Strategies list and check Show
selected strategy on chart.
Edit Strategy...
Opens the Edit Strategy window for the strategy
currently applied to the chart.
Show Strategy
Once an initial strategy has been applied to the chart,
you can use Show Strategy to hide or show the
strategy on the chart.
Copyright © Charles Schwab & Co., Inc. 2006. All rights reserved. (0106-5667)
197
StreetSmart Pro User Manual
Strategy
Performance
Details...
198
The Strategy Performance Details window breaks down
the details and statistics of the strategy being tested in
the Chart window.
Copyright © Charles Schwab & Co., Inc. 2006. All rights reserved. (0106-5667)
Strategy Testing Tools
Strategy Performance Details
STRATEGY PERFORMANCE DETAILS
The Strategy Performance Details window breaks down the details and
statistics of a strategy test. It is available in both the Strategy Tester
and Chart windows.
To view, click Settings > Back Test in the Strategy Tester.
The Strategy Performance Details window has 5 tabs, each described below. Click
on the tab names to view a description of the fields in each tab window.
Performance Summary - A total breakdown of the details of the test as a whole.
Stock symbols and price and volume data shown here and in the software are for
illustrative purposes only. Charles Schwab & Co., its parent or affiliates, and/or its
employees and/or directors may have positions in securities referenced herein, and
may, as principal or agent, buy from or sell to clients.
Executions - A list of each execution sorted chronologically, including information
about the type of trade and which strategy triggered the trade.
Copyright © Charles Schwab & Co., Inc. 2006. All rights reserved. (0106-5667)
199
StreetSmart Pro User Manual
Trades - Shows each round trip trade, entry/exit time and price, gross and net
P&L, etc.
Equity History - Tracks your starting equity chronologically, as well as indicating
where commissions were applied.
Settings - Shows a summary of the settings used in the test.
200
Copyright © Charles Schwab & Co., Inc. 2006. All rights reserved. (0106-5667)
Strategy Testing Tools
You can also change the Back Test settings from the Performance Details window to
see how having a different starting equity or trade quantity, or adding commissions
to the cost of the trades, will affect the outcome of the test. Click Settings > Back
Test in the Performance Details menu to configure those settings.
Strategy testing past performance data should not be construed as indicative of
future results.
PERFORMANCE DETAIL DESCRIPTIONS
Following are descriptions of the fields in the Strategy Performance Detail tabs:
PERFORMANCE SUMMARY
Symbol
Symbol for security
Strategy
Name of Strategy
Test
Date/Time
When the test was run
Bar Size
Time length of bar (e.g., 5 Min, 60 Min, Daily, etc.)
Back Test Bars
Maximum number of bars for which the test was run
Start
Date/Time
Date and time of the first bar of the test
End Date/Time
Date and time of the last bar of the test
Closed P&L
Total profit or loss from closed positions
Open P&L
Profit or loss on open positions at the end of the test
Performance
%
A percentage measure of how much profit or loss the
system generated based on its initial equity
Performance % = ( Profit $ + Open P&L $) / Initial Equity($)
* 100%
Copyright © Charles Schwab & Co., Inc. 2006. All rights reserved. (0106-5667)
201
StreetSmart Pro User Manual
APR %
Annual Percentage Rate. This value is reached by
multiplying a year (365 days) by the Performance % and
then dividing by the number of days in the simulation.
Simple interest used.
APR % = (365 * Performance %) / Days in test
Buy & Hold
P&L
Profit from a buy and hold strategy. Buy at beginning of test
and hold.
Buy & Hold
Performance
%
A percentage measure of how much profit or loss the a buy
and hold strategy would of generated based on its initial
equity.
(Buy & Hold P&L/Initial Equity) * 100
Buy & Hold
APR %
Annual Percentage Rate for buy and hold strategy. This
value is reached by multiplying a year (365 days) by the
Buy & Hold Performance % and then dividing by the number
of days in the simulation. Simple interest used.
Buy & Hold APR % = (365 * Buy & Hold Performance %) /
Days in test
Sharpe Ratio
Risk adjusted profitability for the test time period. $IRX will
be used for the Risk Free Rate of Return in the Sharpe
formula.
Total Trades
Total number of trades entered and exited. Does not
include a trade entered at the end and not yet exited.
Winning
Trades
The total number of trades which made money, excluding
open positions.
Winning Longs
Number of winning long trades, excluding open positions.
Winning Shorts Number of winning short trades, excluding open positions.
Most
Consecutive
Winning
Most consecutive winning trades, excluding open positions.
Average
Winning Hold
Time
Average number of bars for which a winning position was
held
Total Winning
Hold time
Total number of bars in a winning position
Average
Winning Profit
$
Average profit from winning trades
Maximum
Profit $
Maximum profit from a winning trade
Lowest
Winning Profit
$
Lowest profit from a winning trade
Losing Trades
The total number of trades which lost money, excluding
open positions.
202
(Total Winning Hold Time/Winning Trades)
Copyright © Charles Schwab & Co., Inc. 2006. All rights reserved. (0106-5667)
Strategy Testing Tools
Losing Longs
Number of losing long trades, excluding open positions.
Losing Shorts
Number of losing short trades, excluding open positions.
Average Loss $
Average loss from losing trades
Maximum Loss
$
Maximum loss from a losing trade
Lowest Loss $
Lowest $ loss from a losing trade
Average Losing Average number of bars for which a losing position was held
Hold Time
Most
Consecutive
Losing
Most consecutive losing trades, excluding open positions.
Average
Profit$/Averag
e Loss$
Ratio of average $ profit from winning trades divided by
average $ loss from losing trades.
Total Losing
Hold Time
Total number of bars in a losing position
Out of Market
Average
Average number of bars out of the market
Out of Market
Maximum
Maximum number of bars out of the market
Out of Market
Total
Total number of bars out of the market
Initial Equity
Initial equity used in test
Trade Profit $
Total profit from all profitable trades
Trade Loss $
Total loss from all losing trades
Commissions $
Total commissions paid in test
Final Equity $
Ending equity from test (includes equity in open positions)
Open Position
$
The dollar value for any position still open at the end of the
test
Highest Cash
Balance $
Highest amount “cash” in account.
Lowest Cash
Balance $
Lowest amount “cash” in account
Highest
Position Value
$
The most your open positions were worth simultaneously
during the test
Highest Open
Drawdown $
The largest equity dip (relative to the initial investment)
based on open position
Highest Closed
Drawdown $
The largest equity dip (relative to the initial investment)
based on closed out position.
Highest Equity
Balance $
Highest amount of cash + position(s) value
Copyright © Charles Schwab & Co., Inc. 2006. All rights reserved. (0106-5667)
203
StreetSmart Pro User Manual
Lowest Equity
Balance $
Lowest amount of cash + position(s) value
EXECUTIONS
Number
Shows when this order happened, consecutively. If this
number is 4, this order was the fourth order to happen in
the test.
Bar
Indicates on what bar the activity occurred, based on the
first date of the date range used when the simulation was
run.
EXAMPLE If this number is 6, the corresponding activity
happened on the sixth bar of the tested data.
Date and Time
Tells you the date and time when the activity occurred.
Type
Lists the type of order executed. Types include Buy,
Short, Indicator Exit, Profit Exit, and Stop Loss.
Trade Size
Indicates how many shares/contracts were executed.
Price
Shows the execution price of any order type if the order is
being executed.
Order Trigger
What initiated the order. Possible sources are Strategies,
Profit Exits, or Stop Losses.
TRADES
Position #
Tells you when the position was established,
consecutively.
Entry Bar
This number indicates on what bar the position was
established.
Entry Date and
Time
Tells you the date and time when the position was
established.
Entry Price
Price at which position was established.
Exit Bar
This number indicates on what bar the position was
exited.
Exit Date and
time
Tells you the date and time when the position was exited.
Exit Price
Price at which position was exited.
Bars
Number of bars between trade entry and exit
Trade Size
Number of shares/contracts of the position
Gross Profit /
Loss $
Profit or loss before commissions
Net Profit / Loss
$
Net profit or loss after commissions
Commission $
Commission paid on position
204
Copyright © Charles Schwab & Co., Inc. 2006. All rights reserved. (0106-5667)
Strategy Testing Tools
EQUITY HISTORY
Bar
The bar in the test that corresponds to the rest of the
information on that row.
Date/Time
The date and time on which the bar and its equity account
information occurred.
Cash
The cash balance
Overdraft
If the account is overdrawn, the amount below zero
appears here.
Position
The value of any position. (will be calculated using the
close price of each bar.)
Commissions
How much money was paid in commissions for this bar.
Total Equity
The value of the entire equity (cash+position) account at
the end of this bar.
SETTINGS
Initial Equity
The initial amount of equity at the start of the test
Trade Size
How position sizes where calculated. Can be as % of
equity, # of shares, or total transaction cost.
Strategy
Name of Strategy used for test
Strategy
Description
Detailed description of the strategy
Indicator #1...
Trade Exit
•
Name - Name of the indicator(s) used for the test
•
Trade Action - Actions selected for the test, such as
Long Entry, Long Exit, Short Entry, etc.
•
Profit Exit - Percent value gain at which the whole
position is closed for profit
•
Stop Loss - Percent value at which a stop loss is
triggered to close the position.
Bar Size
Time length of bar (e.g., 5 Min, 60 Min, Daily, etc.)
Back Test Bars
Number of bars for which the test was run (e.g., 100
bars)
Commissions
(Equities)
Per trade commission value (based on the Back Test
Settings)
Sharpe Ratio
Risk Free
Interest Rate
% used in Sharpe Ratio calculation. $IRX value at the
beginning of the back test period will be used in this
calculation.
Copyright © Charles Schwab & Co., Inc. 2006. All rights reserved. (0106-5667)
205
StreetSmart Pro User Manual
Strategy Ticker
STRATEGY TICKER®
The Strategy Ticker tool can continuously scans the entire market for
securities and indexes that meet pre-defined technical analysis
parameters.
Instead of watching only a few charts with a few studies, the Strategy
Ticker tool can monitor large quantities of data for all NASDAQ and
NYSE/AMEX stocks, indexes, and/or a user defined symbol list.
To open the Strategy Ticker, click Tools > Start Tool in the main menu and
select Strategy Ticker.
You select the strategy and time period the Strategy Ticker tool bases its scans on,
and it returns a real-time, streaming list of securities and indexes as predefined
strategy signals are generated.
The technical strategies available are similar to studies or combinations of studies
in Charts but are programmed to display a notification in the Strategy Ticker
window of a possible upward trend or downward trend based on selected
strategies.
Stock symbols and price and volume data shown here and in the software are for
illustrative purposes only. Charles Schwab & Co., its parent or affiliates, and/or its
employees and/or directors may have positions in securities referenced herein, and
may, as principal or agent, buy from or sell to clients.
There are several ways you can customize the window to monitor for what best fits
your trading strategy:
•
You select whether to monitor some or all of NASDAQ, NYSE/AMEX, and/or
Index symbols
•
You can define your own or select from the 30+ pre-built strategies that you
wish to monitor.
•
You can choose what bar sizes you want considered.
•
You can filter out securities and indexes above or below a certain price, as
well as securities and indexes whose five day average volume is below a
certain amount.
206
Copyright © Charles Schwab & Co., Inc. 2006. All rights reserved. (0106-5667)
Strategy Testing Tools
•
Finally, you can select from up to 15 columns of data to display in your
Strategy Ticker window.
TIP: Strategy Notes
To view the Notes/description of the strategy signal generated, right-click
on a row and select Strategy Notes.
STRATEGY TICKER® MENU BAR
FILE
Load Stock List
Selecting this feature will allow you to load a previously
saved Stock List into your Strategy Ticker.
Save Stock List
As
Selecting this feature will allow you to save your current
stock list to a file on your computer, which you can load
later.
Clear Stock List
Unloads the current Stock List leaving you with a blank
Strategy Ticker window. This enables you to start a new
Stock List from scratch (see Symbol List below for more
info on adding and deleting symbols).
Page Setup
Enables you to customize the current page for printing.
Read the Printing Windows topic in the Getting Started
section for more information.
Print
Prints the current stock list.
Export
Saves the current stock list to a text (.txt) file in your
SSPro folder, which can then be opened in Excel or other
third-party software.
0, 1, 2, 3...
Strategy Ticker will remember the last 9 files that have
been opened. To toggle between files, click on any of
them. This will be faster than going into the Symbol List
option.
Close
Closes the Strategy Ticker window.
Copyright © Charles Schwab & Co., Inc. 2006. All rights reserved. (0106-5667)
207
StreetSmart Pro User Manual
SETTINGS
General
•
Securities: Select one or all security types to monitor:
NASDAQ, NYSE/AMEX, Indexes, or a Symbol List.
•
Bar Size: Select the bar size you want used (i.e., 5
Minutes, 15 Minute, Daily, etc.
•
Generate Signals at: To generate signals at the closing
price of the bar, select End of Bar. Otherwise, select Intrabar to generate signals within the timeframe of the
bar.
Symbol
List
Adding Symbols:
1. Click Settings > Symbol List.
2. In the Symbol List window type in the stock or index
3. After typing each, press Enter on your keyboard or click
the Add button
4. After all the stocks and indices have been entered, click
OK.
Saving a Symbol List:
1. Click File > Save Stock List As...
2. In the Save window that appears, type in the file name
you would like to save the list as, then click Save.
208
Copyright © Charles Schwab & Co., Inc. 2006. All rights reserved. (0106-5667)
Strategy Testing Tools
Strategy
Center
Select the Strategies you wish to monitor. Click on any strategy
to view its description at the bottom of the window.
To add a strategy to the Selected Strategies list, click on it in the
Available Strategies list and click the Add button.
To remove a strategy from the Selected list, click on it and then
click the Remove button.
Copyright © Charles Schwab & Co., Inc. 2006. All rights reserved. (0106-5667)
209
StreetSmart Pro User Manual
Filters
Price Range
The Price Range filter allows you to set the price level below
which, and above which, a security or index will be ignored.
Click on the arrow buttons provided to increase or decrease the
prices within the Ignore Below and Ignore Above settings. Prices
are based on yesterday's close. The minimum "below" setting is
$1 and the maximum "above" setting is $1000.
Five Day Avg Volume Filter
To ignore securities or indexes with a five day average volume
below a certain value, use the up and down arrows to specify
that value.
210
Copyright © Charles Schwab & Co., Inc. 2006. All rights reserved. (0106-5667)
Strategy Testing Tools
Columns
Visible Columns:
•
Trend – Green up arrow for possible uptrend, red down
arrow for possible downtrend
•
Price – Price at which the signal was generated
•
Technical Strategy – Name of the strategy that
generated the notification
•
Bar Size – Size of each bar used for which the signal was
generated (i.e. 5 Minute, 10 Minute, 15 Minute, 30
Minute, 60 Minute, or Daily)
•
Time – Date and time the signal was generated
•
20 Day Avg Volume – Average volume for the security
over the last 20 days
•
5 Day Avg Volume – Average volume for the security
over the last 5 days
•
Open* – Point change in the security’s price since the
Open
•
Close* – Point change in the security’s price since the
previous Close
•
Open* (%) – Percentage in price change in the
security’s price since the Open
•
Close* (%) – Percentage in price change in the
security’s price since the Close price
•
Profit Exit - When the strategy has a Money
Management Profit Exit % indicator defined, a
hypothetical Profit Exit is calculated based on the price at
the time of the signal. If the trend is Up, the percentage
will be added to the price. If Down, it will be subtracted.
•
Stop Loss - When the strategy has a Money Management
Stop Loss % indicator defined, a hypothetical Stop Loss is
calculated based on the price at the time of the signal. If
the trend is Up, the percentage will subtracted from the
price. If Down, it will be added.
Hide Column Header: Check the box to hide the column
names.
Colors
Change color settings with this option.
Fonts
Change font settings with this option.
Copyright © Charles Schwab & Co., Inc. 2006. All rights reserved. (0106-5667)
211
StreetSmart Pro User Manual
Strategy Matrix
STRATEGY MATRIX
The Strategy MatrixTM tool lets you monitor technical strategies for
individual securities or indexes.
It monitors the specified security or index for each period to see where
that security or index may meet the pre-defined parameters for each
technical strategy.
To open the Strategy Matrix, click Tools > Start Tool in the main menu and
select Strategy Matrix.
Rather than being limited to monitoring only a few studies for a single period length
as you would if you watch the chart, the Strategy Matrix tool can sift through large
quantities of data to provide immediate feedback across a broad range of periods
and strategies.
You select the technical strategy and time periods the Strategy Matrix tool displays,
and it displays in real-time whether each strategy over each period length meets
the pre-defined technical analysis parameters. The technical strategies available
are similar to studies or combinations of studies in Charts but are programmed to
display a possible upward or downward trend based on selected strategies.
An Up means a possible upward trend and Down means a possible downward
trend.
Stock symbols and price and volume data shown here and in the software are for
illustrative purposes only. Charles Schwab & Co., its parent or affiliates, and/or its
employees and/or directors may have positions in securities referenced herein, and
may, as principal or agent, buy from or sell to clients.
There are several ways you can customize the window to monitor for what best fits
your trading strategy:
•
You select which security or index to monitor.
•
You can define your own or select from the 30+ pre-built strategies that you
wish to monitor.
212
Copyright © Charles Schwab & Co., Inc. 2006. All rights reserved. (0106-5667)
Strategy Testing Tools
•
You can choose what bar sizes you want considered.
•
You select the earliest date from which you wish to get technical analysis for
the security, and any data older than that date will be changed to N (None).
TIPS:
•
Strategy Notes
To view the notes/description of the strategy, right-click on the Up or Down
flag and select Strategy Notes.
•
Info
Click on a trend flag (Up or Down) to open a window showing information
about the last time that signal was triggered.
STRATEGY MATRIX MENU BAR
FILE
Page
Setup
Enables you to customize the current page for printing. Read
the Printing Windows topic in the Getting Started section for
more information.
Print
Select to print the Strategy and Bar data displayed in the
window
Export
Select to export to a tab-delimited text file
Close
Closes the Strategy Matrix window
SETTINGS
General
Select the earliest date from which you wish to get technical
analysis for the security.
Copyright © Charles Schwab & Co., Inc. 2006. All rights reserved. (0106-5667)
213
StreetSmart Pro User Manual
Strategy
Center
Select the Strategies you wish to monitor.
Click on any strategy to view its description at the bottom of the
window.
To add a strategy to the Selected Strategies list, click on it in the
Available Strategies list and click the Add button.
To remove a strategy from the Selected list, click on it and then
click the Remove button.
Columns
Check the period length (bar size) columns that you wish to view
in the Strategy Matrix window.
Colors
Change color settings with this option.
Fonts
Change font settings with this option.
214
Copyright © Charles Schwab & Co., Inc. 2006. All rights reserved. (0106-5667)