1
STREETSMART PRO®
CHARTS
Charts ...................................................................................................... 143
Charting Overview .................................................................................... 144
Studies and Trends ................................................................................... 162
143
StreetSmart Pro User Manual
Charting Overview
Charts provide a quick way to absorb data and understand a security's
performance. They provide vast amounts of data in an efficient, userfriendly, customizable format, making it easy to analyze price and
volume movements in real time.
Add Studies, Trend Lines, and even technical analysis Strategies to
charts to enhance your ability to spot trends and buy/sell opportunities.
To open, click
in the Toolbar.
StreetSmart Pro® software has advanced charting tools that give you the freedom
to customize your charting experience to your precise specifications. Features
available include more than 25 customizable studies (or indicators); trend lines and
studies including SMA, EMA, Bollinger Bands and Envelopes; chart types, including
point and figure, bar, line, and candlestick; and much more.
You may display up to 6 chart windows in a single layout with up to 20 tabs (each
with unique chart settings) in each window, effectively allowing you to display up to
120 charts in one layout. Each tab can be setup to copy the setting from another
tab or be unique to the tab itself.
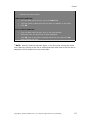
Stock symbols and price and volume data shown here and in the software are for
illustrative purposes only. Charles Schwab & Co., its parent or affiliates, and/or its
employees and/or directors may have positions in securities referenced herein, and
may, as principal or agent, buy from or sell to clients.
144
Copyright © Charles Schwab & Co., Inc. 2006. All rights reserved. (0106-5667)
Charts
CHARTING MENU BAR
FILE
Load Default
Loads the Default settings to a chart or tab.
Set as Default
Click Set as Default when you want the Chart window or
individual tab to open with the current settings every time
you open a new chart.
TIP: The defaults work on an individual tab basis, so if
you set a default in one tab, it is the settings of that tab
that become the default; not the settings of the whole
chart window.
Reset Default
Return to the program Default settings.
Page Setup
Enables you to customize the current page for printing.
Read the Printing Windows topic in the Getting Started
section for more information.
Print
Click to print the chart currently displayed.
Close
Click to close the chart currently displayed.
Printing Charts Tip: If charts are not printing clearly, try changing the
background color to white.
EDIT
Symbol
Changes the symbol current being displayed in the Chart.
! NOTE: This can also be done by right clicking on the
chart or by just typing a new symbol when the Chart
window is active
Tick Data
Allows you to change specific bad data displayed in a chart
that may impact the technical studies you are using. To
edit tick data:
1. Click on the bar, line, or candle that has bad data.
2. Click on Edit > Edit Tick Data
3. The date at the top should be for the date you last
clicked, if it is not, you can select the date or time
from the pull-down menu.
4. Make the appropriate changes to Open, High,
Low, or Close.
5. Click OK.
Delete Selected
Item
1. Select the item to remove by clicking on the label for
any study or trend line, or for support and resistance
lines, click on the line itself.
Copyright © Charles Schwab & Co., Inc. 2006. All rights reserved. (0106-5667)
145
StreetSmart Pro User Manual
2. Select Delete Selected Item to remove it from the
chart.
3. You can also delete the selected line or label by
pressing Delete on your keyboard or right-clicking on
the label or line and selecting Delete.
Delete All
Deletes all of the available items for a group. The groups
are Studies, Trend Lines, Support Lines and Resistance
Lines.
VIEW
Time
Lines
If checked, lines marking the time frame the chart spans (i.e.,
hours, days, months, etc.) are visible.
Price
Lines
If checked, lines marking various price levels are visible.
VAP
If checked, lines marking where the highest Volume Average
Prices have occurred.
Stock symbols and price and volume data shown here and in the
software are for illustrative purposes only. Charles Schwab & Co.,
its parent or affiliates, and/or its employees and/or directors may
have positions in securities referenced herein, and may, as
principal or agent, buy from or sell to clients.
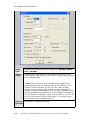
Info
Window
The Info Window provides the statistical data for the point on the
chart you have clicked on. When you first open the window from
the pull-down, today's data will be displayed. To change the
displayed data, either left-click on a specific point on the chart or
hold down the left mouse button and move the mouse to find the
date you want.
If you haven't made any changes to the chart, the data in the
window will include that day's Open, High, Low, Close, Volume,
and BOL (Bollinger Bands). When you add more studies to the
146
Copyright © Charles Schwab & Co., Inc. 2006. All rights reserved. (0106-5667)
Charts
chart, they will also appear in the window. As you increase the
number of viewed studies, you may not be able to see all of the
statistical data in the window. To view all of the data available,
you may need to resize the window by dragging the corner with
the cursor until the all data is displayed.
NOTE: You can access Settings, Views, Tools, and Trend lines by either using
the respective pull-downs or right-clicking on the chart.
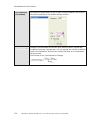
INSERT
Studies
The software allows you to add a vast number of studies to your
chart for technical analysis.
1. Highlight the study you wish to add in the left column.
2. Click the >> to move it to the box on the right.
3. Choose the Show In option and place the study in any of
the options in the drop down menu.
4. Click OK.
Go to Chart Studies for information on each available study.
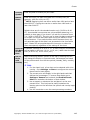
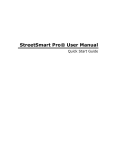
Trend line
•
Select the Type of trend line to display. Go to Trend Lines for
more information on which Trend lines are available.
•
Type a label for the trend line so that you can identify it on
the chart. In the chart below, we have identified an upward
trend.
•
Right-click on the label to Edit or Delete the line.
Support
Adds a horizontal GREEN line wherever you click on the chart to
indicate the Support levels you want to identify in the chart you
are viewing.
Resistance
Adds a horizontal RED line wherever you click on the chart to
indicate the Resistance levels you want to identify in the chart you
are viewing.
SETTINGS
GENERAL
Copyright © Charles Schwab & Co., Inc. 2006. All rights reserved. (0106-5667)
147
StreetSmart Pro User Manual
Data Options
Chart
Type
Choose the period the chart will be based on: Monthly, Weekly,
Daily, Intraday.
Range
(days)
Enter number of periods up to 240 months for Monthly charts,
3,000 days for Daily charts, 250 weeks for Weekly charts, 30 days
for an Intraday chart.
! NOTE:
The number of days available on an Intraday chart
decreases along with your Interval setting. For instance, if you
choose 1 minute intervals, you will only see 4 days of data;
however, as you increase your interval, you can increase the
number of days back available to view. 60 days of Intraday charts
are only available when the interval is 10 or higher in intervals of
5. For example you can get 10 days for Intervals of 10, 15, 20, 30,
60. You can only get 5 days for Intervals of 1-5 minutes or any
other number that is not devisable by 5.
Interval
(minutes
)
148
Applicable to Intraday charts only.
Copyright © Charles Schwab & Co., Inc. 2006. All rights reserved. (0106-5667)
Charts
Overlay
Symbol
Enter a symbol to overlay on your chart.
Market
Hours
Enter the hours you want chart data for in military time (for
example, 1600 for 4:00 p.m. ET).
! NOTE: Beginning time can be no earlier than 0600 and no later
than 0930 ET. Closing time can be no earlier than 1600 and no
later than 2000 ET.
Default times are for the standard session only (09:30 to 16:00
ET). As extended hours quotes are only available streaming, it is
possible to have gaps in you chart if you ask for all session times
(i.e., 0600 to 2000 ET). The only way to view this data consistently
on a chart is to leave that chart open during Pre Market or After
Hours Sessions. If you switch stocks within the same chart, this
will generate gaps as the data is not presented to the chart while
open. Charts will not populate data for times prior to when the
chart was opened, regardless of the settings of the chart.
Chart 60
Min Bars
on the
Hour
If checked, starting at 10:00 a.m. ET, a chart using 60 minute bars
will be based on the hour (10-11, 11-12, etc.) rather than the halfhour (9:30-10:30, 10:30-11:30, etc.)
Use %
Scale
with
Overlay
When overlaying another symbol on the chart, checking this box
will change the display to a percent scale. Percentages are based
off the performance over the time period (intraday, daily, monthly,
etc.)
TIPS:
1. For the classic look, a line chart can be selected with a line
overlay. Go to Settings > Colors to configure the colors of
these lines for best display.
2. The current price will display in the right-hand scale that
defines the percentages. To remove that display go to
Settings > General and uncheck the Show last trade
label box located at the bottom of that window.
3. Use a support or resistance line and place it at the zero
percent level. This level can be easily located as the
starting point on the left when the symbol and overlay begin
plotting.
4. Use the crosshairs to see the exact percentage numbers.
Copyright © Charles Schwab & Co., Inc. 2006. All rights reserved. (0106-5667)
149
StreetSmart Pro User Manual
Display Options
Graph
Style
Bar
•
On a daily chart, each bar is one day. On an intraday chart,
each bar represents one interval.
•
On Bar charts, the left rung indicates the opening price of
the stock, and the right rung indicates the closing/last price
of the stock for the day or interval.
•
The top and bottom of the bar represent the high and low
for that day or interval.
•
Green indicates the security's closing/last price for the day
or interval was higher than today's opening price.
•
Red indicates the security's closing/last price for the day or
interval was less than or equal to today's opening price.
Calculate Change From Open/Close
•
Allows you to select the basis for the calculation of bars. By
default this setting is Change from Open, which calculates a
bar as up or down based on the difference between the
open and closing price. When set to Change from Close, the
color (or change) of each bar is determined by the
difference between the previous bars closing price and the
current bars last (or closing) price.
Candlestick
150
•
On a daily chart, each stick is one day. On an intraday
chart, each stick represents between 1 and 120 minutes.
•
Green indicates the security's closing/last price for the day
Copyright © Charles Schwab & Co., Inc. 2006. All rights reserved. (0106-5667)
Charts
or interval was higher than today's opening price.
•
Red indicates the security's closing/last price for the day or
interval was less than today's opening price.
•
Gray indicates the security's closing/last price for the day or
interval was equal to today's opening price.
•
The top and bottom of the line behind it represent the high
and low for the day/period.
Outline Candlesticks
•
Check or uncheck your preference to have the Candlesticks
outlined or not. This is only available when candlestick is
selected as graph style.
Line
•
Yellow Opening price for that day or interval.
•
Green High price for that day or interval.
•
Red Low price for that day or interval.
•
Blue Closing/last price for that day or interval.
Line Graph
•
When selected, you can choose which lines to view: Open,
High, Low or Close.
Point & Figure Charts
When selected, you can choose how to display the following items
for Point & Figure:
•
Box size from 0.05 to 500
•
Using either High/Low or Close
•
Reversal from 1 to 5.
Overlay
Style
If applying an overlay of a second symbol, the style is set here.
Graph
Line
Width
This gray field is adjustable with the up or down arrows to the
right of the field. The higher the number, the bolder the line in the
chart.
! NOTE:
A higher setting may cause distortion to the graph.
Study
Line
Width
This gray field is adjustable with the up or down arrows to the right
of the field. The higher the number, the bolder the line in the chart.
Data to
show
Specify the number of days to display in the chart at any one time.
Show all
data
If checked, shows chart for the time frame specified in the Range
(days).
! NOTE:
A higher setting may cause distortion to the graph.
! NOTE:
This is only applicable when the Show all data field is
unchecked.
Copyright © Charles Schwab & Co., Inc. 2006. All rights reserved. (0106-5667)
151
StreetSmart Pro User Manual
If unchecked, this will display what is indicated in the Data to show
field. A scroll bar will appear at the bottom of the chart allowing
you to move back and/or forth through Range (days) selected.
Price
scale
($'s)
Specify the increments for the price scale, from .05 to Auto or
Logarithmic. Once a price interval is selected (not Auto or
Logarithmic), you can manually input an interval. You should select
an interval that is appropriate to the price range of the security you
are charting for the selected Range (days).
•
Default is Auto, which allows the software to select the
optimal scale based on the size of the chart.
•
Logarithmic, or percentage, scaling will change the price
scale's appearance by making the vertical spacing between
two points correspond to the percentage change between
those numbers. So, for instance, the vertical distance
between 10 and 20 and the vertical distance between 50
and 100 will be the same. This helps provide a truer picture
of charts with large vertical ranges.
Show
Last
Trade
Label
Highlights the last trade price in the Price Scale.
Show
Price
Scale on
Left
The Default will display the Price Scale on the right. By checking
this field, the Price Scale will display on the left.
Show
High,
Low,
Open,
Close
Values
on Chart
Overlays the lines for High, Low, Open and Close on the chart.
Chart
Type
Allows you to quickly change between Monthly, Weekly, Daily, and
Intraday charts.
The Settings > General window determines how many days or
intervals are displayed.
Back
Test
You can change the Back Test settings when applying a Strategy to
the chart to see how having a different starting equity or trade
quantity, or adding commissions to the cost of the trades, will
affect the outcome of the test.
Fonts
Click to change the font style in the chart.
1. When the Font box opens, select the type, style and size.
2. Click OK.
! NOTE:
Large font sizes may not allow for a clean view of the
text displayed in the chart.
152
Copyright © Charles Schwab & Co., Inc. 2006. All rights reserved. (0106-5667)
Charts
Colors
To change the colors in a chart:
•
Select the item you wish to change, then press the color
button to change, and click OK.
TABS
For more on tabs visit the Adding Tabs to Windows topic
Enable
Clicking Enable will create 2 tabs in the Chart Window,
your current chart, plus an additional chart which you can
customize separately using the Tabs > Edit menu item.
Insert
Add more tabs than the 2 added when enabled.
Edit
Edit the selected tab.
Remove
Remove the selected tab
Use same
symbol for all
tabs
When checked, all of the tabs within the Chart window will
use the same symbol. When unchecked, all of the tabs can
have specific symbols saved within the tabs.
TOOLS
Studies
The software allows you to add a vast number of studies to
your chart for technical analysis.
1. Highlight the study you wish to add in the left
column.
2. Click the >> to move it to the box on the right.
3. Choose the Show In option and place the study in
any of the five options in the drop down menu.
4. Click OK
Go to Chart Studies for information on each available
Copyright © Charles Schwab & Co., Inc. 2006. All rights reserved. (0106-5667)
153
StreetSmart Pro User Manual
study.
Strategy Center
Open the Strategy Center to apply a strategy to the chart.
You can also edit or create a new strategy from the
Strategy Center.
To add a strategy to the chart, click on the strategy in the
Available Strategies list and check Show selected
strategy on chart.
Edit Strategy
Opens the Edit Strategy window for the strategy currently
applied to the chart and will allow you to make changes to
both the Strategy details and the chart display.
Show Strategy
Once an initial strategy has been applied to the chart, you
can use Show Strategy to hide or show the strategy on
the chart.
Strategy
Performance
Details
The Strategy Performance Details window breaks down the
details and statistics of the strategy being tested in the
Chart window.
Crosshairs
Select to change your cursor to display a crosshair when
you click on the chart. The Crosshair pointer can help you
pinpoint prices on a chart more easily than when using the
regular cursor.
Select again to turn off Crosshairs.
Zoom In
Allows you to zoom in on a smaller area of a chart without
having to change your Chart settings.
1. Click Zoom In
2. Click and hold the mouse button on the point within
the chart where you wish to start to zoom in
3. Drag your mouse across to the point where you wish
to end the zoom in and release the mouse button.
TIP: Right-Click Charts Shortcut
Right-clicking on a chart opens a menu allowing you to:
154
•
Recent Stories for [Symbol]
•
Research/Ext. Quote for [Symbol]
•
Apply an Alert to [Symbol]
•
Change Symbol...
•
View: Time Lines, Price Lines, VAP (Volume At Price), and Info
Window
•
Chart Type (Monthly, Weekly, Daily or Intraday)
•
Show all Data
•
Trend, Support, and Resistance lines
•
Tools: Studies, Strategies, Crosshairs, Edit Tick Data, Zoom-in
•
Hide/Show Menu
Copyright © Charles Schwab & Co., Inc. 2006. All rights reserved. (0106-5667)
Charts
CHART TOOL BAR
The Chart Toolbar allows quick access to the most commonly used chart
features.
To enable, click Toolbars > Chart Toolbar in the main menu.
•
Most buttons clicked in the Chart Toolbar will affect the most recently
accessed Chart window.
EXAMPLE You have 3 chart windows open, and you most recently clicked
on Chart #2. When you click the Add/Edit Studies button, it will open for
Chart #2. If you want the button you press to affect another chart, click that
chart first and then click the button in the toolbar.
•
The Regular, Snap to, and Best Fit trendlines are the exceptions and can be
clicked in the toolbar and applied to any chart in your layout.
•
Click anywhere in the main menu, and then hover your mouse over a button
to see a Tool Tip that says what the button will do.
•
All the buttons in the Chart Toolbar correspond to a feature also found in the
menu of each Chart window.
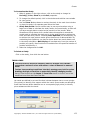
Customizing the Chart Toolbar
Customize which icons are displayed on your chart toolbar. Select Toolbars >
Customize > Chart Tool Bar from the main menu or right-click on the Chart Tool
Bar and select Customize... The Chart Tool Bar customization window will open.
You can then select which tools you want displayed on your toolbar.
•
Use the Add/Remove buttons to move buttons between the Available and
Current columns.
•
Use the Move Up/Move Down buttons to put the buttons in the Current
toolbar in the order you prefer.
•
Click Close when you are finished customizing your Chart Toolbar.
Moving the Chart Toolbar
The Chart Toolbar can be displayed vertically on the left/right hand side, or the top
or bottom of the frame, or it can be removed to be a free-floating window.
1. Move your mouse pointer to the thin bar on the left side of the Chart Tool
Bar.
2. Click on that bar and then drag the window to the location of your choosing.
3. Let go of the mouse button.
Toolbar Features
Not all buttons are displayed by default. To add a button, click Toolbars >
Customize > Chart Tool Bar in the main menu.
Chart General
Settings
Open the General Settings for the most recently
accessed Chart window.
Copyright © Charles Schwab & Co., Inc. 2006. All rights reserved. (0106-5667)
155
StreetSmart Pro User Manual
Crosshairs
Select to change your cursor to display a crosshair
when you click on the chart. The Crosshair pointer
can help you pinpoint prices on a chart more easily
than when using the regular cursor.
Select again to turn off Crosshairs.
Chart Type
Choose Monthly, Weekly, Daily, Intraday, or Tick
Chart Interval
Choose from 5 to 120 minutes or select Other to
open the Chart Settings window where you can enter
a different interval.
Only applies to Intraday chart types.
Add/Edit
Studies
Click to open the Add/Edit Studies window, which
lets you add technical analysis studies to your chart.
Go to Chart Studies for information on each available
study.
Trend Lines
Click to draw Trend Lines on the chart. The pointer
will change to a pencil icon. Click and drag to draw
the trend line.
Click the Trend Line button again to stop drawing
trend lines (or select another button).
Edit Trend
Lines
Click and select from the drop-down list which Trend
Line you wish to edit. The button is only available
when the most recently selected chart has trend
lines drawn on it.
The Edit Trend Line window lets you select the type
of trend line (regular, Fibonacci, best fit (regression),
etc.), as well as the color and label (name) for the
line.
Support
Adds a horizontal GREEN line wherever you click on
the chart to indicate the Support levels you want to
identify in the chart you are viewing.
Resistance
Adds a horizontal RED line wherever you click on the
chart to indicate the Resistance levels you want to
identify in the chart you are viewing.
New Tab
Click to add a new tab to the most recently accessed
chart window.
You must have Tabbing enabled for the chart in
order to click the New Tab icon.
Show All Data
If checked, shows chart for the time frame specified
in the Range (days).
If unchecked, this will display what is indicated in the
Data to show field. A scroll bar will appear at the
bottom of the chart allowing you to move back
and/or forth through Range (days) selected.
156
Copyright © Charles Schwab & Co., Inc. 2006. All rights reserved. (0106-5667)
Charts
Edit Tick Data
Allows you to change bad chart price data, which
may impact the technical studies enabled on the
chart.
Click the Edit Tick Data button in the toolbar and
then click the price point you need to edit on the
chart. A window will open that allows you to change
all four price points for that period (open, close,
high, low).
Delete
Click the Delete icon to see a list of studies and trend
lines in the most recently accessed chart so that you
may delete one or more of them. You can also chose
Delete All Studies to clear all studies from the
chart.
Delete will not clear support and resistance lines. You
must right-click on the line and select Delete to
remove it.
Graph Style
Switch between Bar, Candlestick, Line or Point &
Figure chart types.
Read more about each of these graph styles in the
Chart Menu Bar topic.
Time Lines
Click to hide or show the vertical time lines on the
chart.
Price Lines
Click to hide or show the horizontal price lines on the
chart.
Best Fit
Click the button and then click on the chart to apply
a Best Fit Regression trend line to the chart.
Read more about Best Fit in the Trend Lines topic.
Snap To
Click the button and then click and drag a line on the
chart to apply a trend line that "snaps to" the open,
high, low, or close of the trend being studied.
To change which price the trend line snaps to (the
default setting is Close), click the Edit Trend Lines
button in the toolbar and choose the Snap To line
you wish to edit.
Read more about Snap To in the Trend Lines topic.
Fibonacci
Retracement
Click the button and then click on the chart to draw a
Fibonacci Retracement line.
Read more about Fibonacci lines in the Trend Lines
topic.
Fibonacci Fan
Click the button and then click on the chart to draw a
Fibonacci Fan line.
Read more about Fibonacci lines in the Trend Lines
topic.
Copyright © Charles Schwab & Co., Inc. 2006. All rights reserved. (0106-5667)
157
StreetSmart Pro User Manual
Fibonacci Arc
Click the button and then click on the chart to draw a
Fibonacci Arc line.
Read more about Fibonacci lines in the Trend Lines
topic.
VAP
Click to show lines bars on the chart where the
highest Volume Average Prices have occurred.
Alerts
Click to add a Conditional Order or Alert on the
security in the most recently accessed Chart window.
Help
Open the Online Help directly to information on using
Charts in StreetSmart Pro.
CHART WINDOW SETTINGS
Chart Settings
StreetSmart Pro® software gives you real-time interactive charting capability with
a wide range of customizable features. You can:
Open a New Chart
Open as many as six charts at one time.
1. Go to the Toolbar.
2. Click the chart icon
.
Link Charts to the Trading Window
A chart, or multiple charts, will automatically load the symbol of the stock in the
Trading window if they are linked.
To link charts to the Trading window:
1. From the Trading Window, select Settings > Links.
2. This allows you to link from a Trading Window to any chart or combination
of charts. To link to multiple charts, such as Chart 2, Chart 2 must be open
prior to going to Settings > Links.
Open Charts That Are Not Linked to the Trading Window
1. Highlight the chart by clicking it.
2. Type the symbol you want and press Enter.
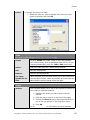
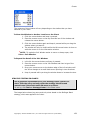
Get Chart Statistics
While in the chart, click the left mouse button and the following information window
will appear:
158
Copyright © Charles Schwab & Co., Inc. 2006. All rights reserved. (0106-5667)
Charts
The contents of this window will vary depending on the studies that you have
selected in your chart.
To Move the Window to Another Location on the Chart:
1. Click the mouse button and keep it pressed.
2. Place the mouse cursor on the top blue title bar of the window and
release the mouse button.
3. Click the mouse button again and keep it pressed while you drag the
window where you want it.
4. The window will only be visible while the left mouse button is down or
while the cursor is on the information window.
! NOTE: To make the Info Window easier to move or always open, click
View > Info Window.
To Expand the Detail of the Info Window:
1. Left-click the mouse button and keep it pressed.
2. Place the mouse cursor on the Info Window and then let go of the
mouse button.
3. Drag your mouse cursor to the bottom edge of the info window until
the arrow changes to a small black arrow pointing in two directions.
4. Keep it pressed while you drag the window down to increase the size.
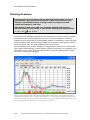
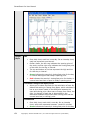
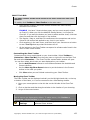
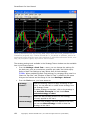
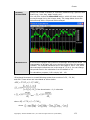
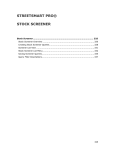
STRATEGY TESTING IN CHARTS
See a graphical representation of your Strategy Tester results in a
chart. View the entry and exit points the strategy identifies and
instantly see if the stock really did move up or down.
To set up, click Tools > Strategy Center in the Chart menu.
The image below shows long entry and exit points based on the Bollinger Band
strategy, which was applied to the chart.
Copyright © Charles Schwab & Co., Inc. 2006. All rights reserved. (0106-5667)
159
StreetSmart Pro User Manual
Stock symbols and price and volume data shown here and in the software are for
illustrative purposes only. Charles Schwab & Co., its parent or affiliates, and/or its
employees and/or directors may have positions in securities referenced herein, and
may, as principal or agent, buy from or sell to clients.
The strategy testing tools available in the Strategy Tester window are also available
here in the Chart window:
•
From the Settings > Back Test... menu, you can change the settings for
the back test, such as commissions, quantity per trade, and initial equity.
Refer to Back Test Settings to learn about each of those settings.
TIP: When establishing Back Test settings for a strategy being used in a
Chart the "Bar Size" and “Number of Bars for Test” is effectively the same
thing as the Interval and the Range in the chart Settings > General.
•
From the Tools menu, you have access to:
Strategy
Center...
Open the Strategy Center to apply a strategy to the
chart. You can also edit or create a new strategy from
the Strategy Center.
To add a strategy to the chart, click on the strategy in
the Available Strategies list and check Show
selected strategy on chart.
160
Edit Strategy...
Opens the Edit Strategy window for the strategy
currently applied to the chart.
Show Strategy
Once an initial strategy has been applied to the chart,
you can use Show Strategy to hide or show the
strategy on the chart.
Copyright © Charles Schwab & Co., Inc. 2006. All rights reserved. (0106-5667)
Charts
Strategy
Performance
Details...
The Strategy Performance Details window breaks down
the details and statistics of the strategy being tested in
the Chart window.
Copyright © Charles Schwab & Co., Inc. 2006. All rights reserved. (0106-5667)
161
StreetSmart Pro User Manual
Studies and Trends
CHART STUDIES
Chart Studies use a stock's price movements, volume, and other
historical information to attempt to find patterns that may indicate
shifting price trends.
By learning what a particular study may be indicating and then
applying that study to your charts, you may be able to identify trading
opportunities, points of support or resistance at certain price
thresholds, price trends, and more.
Add Studies to a chart from the Tools > Studies menu.
StreetSmart Pro® software allows you to incorporate studies into your charts for
technical analysis. Studies can:
•
Overlay on the price chart
•
Display below the price chart (use the Show In drop-down located in the
Studies window to put additional studies in separate panels in the Chart
Window.)
! NOTE:
The same study can be displayed in both places.
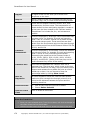
Choose from the following default study parameters:
Study Name
Description
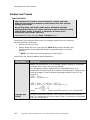
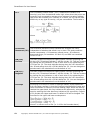
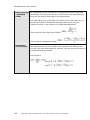
Adaptive RSI
Adapts the standard RSI to a smoothing constant. Default of 14 periods
(minutes, hours, days, etc.) can be changed.
For calculation purposes, Adaptive RSI is somewhat similar to an
exponential moving average, but instead of averaging prior values using a
fixed percentage, it uses a variable percentage based on the RSI. The
formula is
for t < n
for t >= n
where
Average DM
(ADX)
162
and n is the RSI period (i.e. an n-period RSI).
Average Directional Movement is an oscillator that fluctuates between 0
and 100, reading above 60 are relatively rare. It's values are interrelated
with +DI, -DI and DX.*
Copyright © Charles Schwab & Co., Inc. 2006. All rights reserved. (0106-5667)
Charts
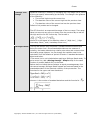
Average True
Range
Measures a security's volatility by averaging the True Range over a period
of time you specify when setting up the study. True Range is the greatest
of the following:
•
The current high minus the current low.
•
The absolute value of the current high less the previous close.
•
The absolute value of the current low less the previous close.
Default of 14 periods can be changed.
The ATR formula is an exponential average of the true range. True range
takes into account any gap up or down from the previous day as well as
the high and low for the current day. The formula is
where TR is the largest of the absolute values of | High-Low |, | HighYesterdays Close |, and | Yesterdays Close-Low |.
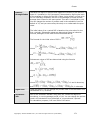
Bollinger Bands
The top and bottom lines are placed n-standard deviations above and
below the center line*. Since standard deviations are a measure of
volatility, the bands widen during volatile price action and contract when
the trading range tightens. You can change the variables used in the
calculation from the defaults of period=20 and n=2 standard deviations
above and below.
*The center line is not included when applying a Bollinger Bands study. To
get a center line, add a Moving Average - Simple study for the same
number of periods (default=20) to the chart.
Rather than two bands that are always an equal percentage away from
the central average, Bollinger Bands expand and contract based on the
standard deviation of the historical volatility of the price action. The
formulas for the upper and lower bands are
where m is the number of standard deviations and the formula for
Copyright © Charles Schwab & Co., Inc. 2006. All rights reserved. (0106-5667)
163
is
StreetSmart Pro User Manual
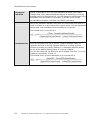
CCI
The Commodity Channel Index ("CCI") measures the variation of a
security's price from its statistical mean. High values show that prices are
unusually high compared to average prices whereas low values indicate
that prices are unusually low. Contrary to its name, the CCI can be used
effectively on any type of security, not just commodities. The formula is
where
Directional
Movement (DX)
The Directional Movement study indicates the strength of a trend,
independent of whether that trend is up or down. The study combines
several components: +DI measures upward moves, -DI measures
downward moves, DX combines +DI and -DI, and ADX is a smoothed
version of DX.*
DM(+DI)
Positive
The basic Directional Movement trading system involves comparing the
14-day +DI ("Directional Indicator") and the 14-day -DI. This can be done
by plotting the two indicators on top of each other or by subtracting the
+DI from the -DI. The study indicates buying when the +DI rises above
the -DI and selling when the +DI falls below the -DI. You can change the
periods used in the calculation from the default of 14.*
DM(-DI) Negative
The basic Directional Movement trading system involves comparing the
14-day +DI ("Directional Indicator") and the 14-day -DI. This can be done
by plotting the two indicators on top of each other or by subtracting the
+DI from the -DI. The study indicates buying when the +DI rises above
the -DI and selling when the +DI falls below the -DI. You can change the
periods used in the calculation from the default of 14.*
Envelope
Employing an Envelope is similar to Bollinger Bands, except equidistant
from the center average, in that the Envelope helps define the upper and
lower boundaries of a security's normal trading range. When the security
reaches the upper band, this may indicate a sell opportunity, whereas the
security reaching the lower band may indicate a buy opportunity. Default
of 20 periods with Upper and Lower % default of 6 can be changed. The
formulas for the upper and lower envelopes are
where F is a factor such as 6% (i.e. 0.06 for the formulas above).
164
Copyright © Charles Schwab & Co., Inc. 2006. All rights reserved. (0106-5667)
Charts
Historical
Volatility
Reflects how far an equity's price has deviated from its average price over
the number of periods you specify. This study only applies to Daily,
Weekly, and Monthly charts. Default of 20 periods can be changed.
Historical volatility is calculated:
Keltner
Channels
Keltner Channels consist of two bands that are not equidistant from the
SMA.
Rather than two bands that are always an equal percentage away from
the SMA, Keltner Channels expand and contract based on a moving
average of the True Range (TR). The formulas for the upper and lower
bands are
where F is a factor,
, and
Copyright © Charles Schwab & Co., Inc. 2006. All rights reserved. (0106-5667)
165
StreetSmart Pro User Manual
Last Close
(Intraday)
When selected with an intraday chart, a line will display indicating the
prior day's close price.
Stock symbols and price and volume data shown here and in the software
are for illustrative purposes only. Charles Schwab & Co., its parent or
affiliates, and/or its employees and/or directors may have positions in
securities referenced herein, and may, as principal or agent, buy from or
sell to clients.
Moving Average
Conv/Divergen
ce (MACD)
A trend-following momentum indicator using 3 exponential moving
averages: a short or fast average, a long or slow average, and an
exponential average of their difference (the last used as a signal or trigger
line). You can change the periods used in the calculation from the defaults
of 12 and 26. Used with Signal Line below.
MACD
Histogram
A variation of the MACD that plots the difference between the Signal Line
and MACD. Changes in the spread between these two lines may be
spotted faster, potentially leading to earlier trading signals. You can
change the periods used in the calculation from the defaults of 12, 26, and
9.
Momentum
Measures the amount the price of a security has changed over the last 14
days. If the current trading session today hasn't closed yet, it uses the
last sale price. You can change the periods used in the calculation from
the default of 14.
The formula for an n-period Momentum is
Money Flow
Money Flow keeps a running total of the money flowing into and out of a
security. The direction of the Money Flow line is the important component
to watch, not the actual dollar amount. This indicator can be used to
confirm underlying strength or weakness of a price trend.
The formula for an n-period Money Flow is
166
Copyright © Charles Schwab & Co., Inc. 2006. All rights reserved. (0106-5667)
Charts
Money Flow
Percent
Money Flow Percent normalizes the Money Flow calculation above by
dividing by the cumulative volume for the period.
You can change the periods used in the calculation from the default of 14.
The formula for an n-period Money Flow Percent is
Moving Average
Exponential
(EMA)
While similar to the SMA, the exponential moving average uses a
"smoothing factor" to give more weight to recent prices, while allowing all
prices in the window to influence the average. The default of 20 periods
can be changed.
The EMA formula is an inductive formula; that is, the value at time t is
based on the value at time t-1 and a current amount. The formula is
where Price is set to the Average
variable you select when you set up the study. F (Factor) can theoretically
be any value between 0 and 1 but is generally related to an n-period SMA
by the formula
Moving Average
Simple (SMA)
The average of the last 8-periods close values including current day. If
current trading session hasn't closed yet, the last sale price is used. The
default of 8 periods can be changed.
The formula for an n-period SMA is
Moving Average
- Geometric
(GMA)
A moving average weighted on the price movement relative to the stock
price, so that a $1 increase in a $5 stock is represented on the chart as a
much greater move than a $1 increase in a $75 stock.
where
The formula for an n-period GMA is
Price is set to the Average variable you select when you set up the study.
Copyright © Charles Schwab & Co., Inc. 2006. All rights reserved. (0106-5667)
167
StreetSmart Pro User Manual
Moving Average
- Smoothed
(OMA)
An exponential moving average with a longer period used to determine
the average, as older prices are never removed from the calculation but
are given less weight. Best used in trending markets.
The initial value of an n-day OMA is the same as the initial value of an nperiod SMA indicator. Subsequent values are determined using an
inductive formula, in the manner of the EMA described above.
The formula for the initial value of OMA is
The formula for subsequent values is
On Balance
Volume (OBV)
This indicator relates volume to price changes by adding volume to a
running total when the price closes up for a period, then subtracts the
volume if the stock closes down for a period. You can overlay the study on
or underneath the price chart.
The formula is
where
and
168
if
if
Copyright © Charles Schwab & Co., Inc. 2006. All rights reserved. (0106-5667)
Charts
Parabolic SAR
The Parabolic SAR (stop and reverse) is a trend-following indicator that
may help establish stop loss parameters, as well as signaling opportune
times to buy or sell a stock. Because it's a trend-following indicator, it
tends to be less useful in a sideways market and more useful in a strongly
trending market.
A line above the price may indicate a bearish trend, and a line below the
price may point to a bullish stock.
The formula is
SARTomorrow = SARToday + AF (EPTrade – SARToday)
where AF (Acceleration Factor) is one of a progression of numbers
beginning at .02 and ending at .20. The AF is increased by .02 each day
that a new high is made. You can change these values by editing the
Minimum Step and Maximum Step fields when setting up the study on
your chart.
And EPTrade = Extreme Price Point of the trade made so far. If you choose
Long from the Position drop-down, EP is the extreme high price for the
trade; if Short, EP is the extreme low price for the trade.
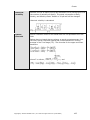
Pivot Points
(Intraday)
Uses the previous day high, low, close, and open price to generate a pivot
line, two support levels (S1 & S2), and two resistance levels (R1 & R2).
This study is only displayed on Intraday charts. In the Studies window,
you may check the lines you wish to view: R2, R1, Pivot, S1, S2
! NOTE:
Pivot Point lines may not be visible depending on the price scale
you have set in Settings > General, and the price discrepancy between
the previous and the current trading day.
Pivot Points are calculated:
Pivot = ( YesterdaysHigh + YesterdaysLow + YesterdaysClose ) / 3.0;
S1 = 2.0 * Pivot - YesterdaysHigh;
R1 = 2.0 * Pivot - YesterdaysLow;
S2 = Pivot - ( R1 - S1 );
R2 = Pivot + ( R1 - S1 );
Copyright © Charles Schwab & Co., Inc. 2006. All rights reserved. (0106-5667)
169
StreetSmart Pro User Manual
Price Relative
(to Symbol)
Compares the performance of the symbol currently loaded in the chart to
the symbol specified in the studies settings window.
Rate of Change
Change in price between the current price and the close 5 periods ago,
divided by the price 5 periods ago. You can change the number of periods
used in the calculation, and you can overlay the study on or underneath
the price chart.
The formula for an n-period Rate of Change
is
170
Copyright © Charles Schwab & Co., Inc. 2006. All rights reserved. (0106-5667)
Charts
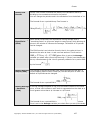
Relative
Strength Index
Indicates the degree of positive and negative movement by the stock on a
scale of 0 (weakest) to 100 (strongest). Determined by figuring the ratio
of the average up closes for the last 14 days (using today's current price
for the 15th day) divided by the sum of the average up closes and the
average down closes for the same period. This ratio is multiplied by 100.
You can change the number of periods used in the calculation from the
default of 15, and you can overlay the study on or underneath the price
chart.
The initial value of an n-period RSI is based on the price action for the
first n periods. Subsequent values are determined using an inductive
formula, analogous to the EMA formula described earlier.
The formula for the initial value of RSI is
for all
where
and
for all
Subsequent values of RSI are determined using the formula
where
and
where
and
if
>0 and 0 otherwise,
if
<0, 0 otherwise
Signal Line
Used with MACD. You can change the periods used in the calculation from
the defaults of 12, 26 and 9.
Stochastic %D
Part of the stochastic indicator along with %K. Shows the degree of
smoothing, or moving average period, of %K. You can change the periods
used in the calculation from the default of 14 periods and 3 periods.
For calculation purposes, %D is an SMA of %K below.
Copyright © Charles Schwab & Co., Inc. 2006. All rights reserved. (0106-5667)
171
StreetSmart Pro User Manual
Stochastic %D Slow
Similar in principle to %D, %D Slow represents a slower, less volatile
indicator that simply adds an additional degree of smoothing, or moving
average period, to the original %D. You can change the period used in the
calculation from the default of 14 periods, 3 periods, and 3 periods.
For calculation purposes, %D Slow is an SMA of %D above.
Stochastic - %K
Part of the stochastic indicator along with %D. Shows the price level of a
stock in relation to its price range over a given period. You can change the
period used in the calculation from the default of 14 periods.
The formula for an n-period %K is
Stochastic RSI
Plots the Stochastic %D line of the RSI (Relative Strength Index) to
represent the level of the RSI indicator relative to its range over the
number of periods you specify. Default of 14 Stochastic and RSI periods,
as well as the default Slowing Factor of 1 can be changed.
You can also check the Ten Grid Lines box to display lines from 0.1 to 0.9
instead of two lines at .25 and .75.
The formula for an m-period stochastic of an n-period RSI is
172
Copyright © Charles Schwab & Co., Inc. 2006. All rights reserved. (0106-5667)
Charts
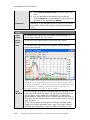
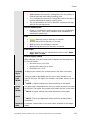
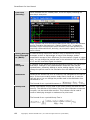
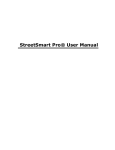
Volume/
Volume SMA
Simply the number of shares (or contracts) traded during a specified time
frame (e.g., hour, day, week, month, etc).
You may also choose the Show SMA feature, which will show a simple
moving average line in the Volume study. The image below shows the
Volume study with a 20 period SMA overlayed.
Williams % R
A momentum indicator that measures overbought and oversold levels. The
interpretation of Williams %R is very similar to that of the %K stochastic
indicator. The oversold indications are in the range of -80 to -100, while
the overbought indications are in the range of -20 to 0. You can change
the periods used in the calculation from the default of 12.
For calculation purposes, %R is simply %K - 100.
*Directional Movement is a trend-following system that consists of +DI, - DI, DX,
and ADX. These values are interrelated as shown below.
if the denominator > 0; 0 otherwise
and
where
,
where
Copyright © Charles Schwab & Co., Inc. 2006. All rights reserved. (0106-5667)
173
StreetSmart Pro User Manual
is
otherwise. If both
if > 0; 0 otherwise.
is
and are > 0, the smaller is set to 0.
F (Factor) is related to an n-day SMA by the formula
if > 0; 0
.
TIP: Right-Click Shortcut to Add a Study or Trend Line
•
Right-click in the chart.
•
Go to Tools and select Studies or Trend lines and select New or Delete.
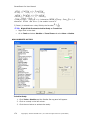
ADD OR DELETE A STUDY
To Add a Study:
1. Click Tools > Studies and the Studies Set-up panel will appear.
2. Click on a study in the left column.
3. Click the >> button to activate the study.
174
Copyright © Charles Schwab & Co., Inc. 2006. All rights reserved. (0106-5667)
Charts
To Customize the Study:
1. When it appears in the right column, click on the study to change its
Period(s), Color, Show in, and Label properties.
2. To change the default period, click in the window and add the new variable
for your period.
3. Use the Show In drop-down to overlay the study in the main chart window
or place the study in a separate pane below the chart.
4. Study Data Points: Certain studies may be more precise when using a
larger set of data to calculate the study results, but occasionally, a chart will
not have enough data to maximize the precision of the results. What
StreetSmart Pro® charts do for studies where this applies is extend the
period used to calculate the study up to 4x the study period to achieve the
most accurate study results. Checking Auto Optimize will automatically try
to achieve the most precise results given the amount of data available. By
unchecking Auto Optimize, you have a choice about how much data to use
in the study calculation. Max Display will use data only from the number of
periods you specify. Max Precision will use data from the specified number of
periods multiplied by 4.
5. Make the changes and click OK.
To Delete a Study:
Click on the study, then click the << button.
TREND LINES
Trend Lines are a technical indicator where a straight line is drawn
connecting a series of prices with either a clear downward or upward
trend.
Traders incorporating trend lines into their strategy may look for prices
breaking through a trend line to potentially identify changing trends.
Set up Trend Lines from the Insert > Trend Line menu or click on one of the
trend line icons from the Chart Tool Bar.
Up trends are defined by a trend line that is drawn between two or more troughs
(low points) to identify price support within the trend. Down trends are defined by
trend lines that are drawn between two or more peaks (high points) to identify
price resistance within the trend.
Copyright © Charles Schwab & Co., Inc. 2006. All rights reserved. (0106-5667)
175
StreetSmart Pro User Manual
Regular
A regular trend line will allow you to draw a line
anywhere on the chart.
Snap To
Using a Snap to trend line, will place the trend line on
the open, high, low, or close of the trend being studied.
Fibonacci Studies
There are four popular Fibonacci studies: arcs, fans,
retracements, and time zones. The interpretation of
these studies involves anticipating changes in trends as
prices near the lines created by the Fibonacci studies.
StreetSmart Pro includes fan, arc, and retracement
studies.
Fibonacci Fan
Lines are displayed by drawing a trend line between two
extreme points, for example, a trough and opposing
peak. Then an "invisible" vertical line is drawn through
the second extreme point. Three trend lines are then
drawn from the first extreme point so they pass through
the invisible vertical line at the Fibonacci levels of 38.2%,
50.0%, and 61.8%
Fibonacci
Retracement
Lines are displayed by first drawing a trend line between
two extreme points, for example, a trough and opposing
peak. A series of nine horizontal lines are drawn
intersecting the trend line at the Fibonacci levels of
0.0%, 23.6%, 38.2%, 50%, 61.8%, 100%, 161.8%,
261.8%, and 423.6%. (Some of the lines may not be
visible because they will be off the scale.)
Fibonacci Arcs
This trend line separates the Fibonacci Arcs into a
separate view. The three arcs, which center on the last
point of the trend line you draw, help you identify where
support and resistance may affect the price as a stock
trends up or down. You can choose to show the
percentage labels by clicking Show Levels.
Best Fit
Regression
A Linear Regression trend line uses the least squares
method to plot a straight line through prices so as to
minimize the distances between the prices and the
resulting trend line.
Delete Selected
1. Click on the Trend line you wish to delete
2. Choose Delete Selected
Clear All Trend
Lines
Click to erase all trend lines.
Draw the Trend Line:
176
•
Once you have selected which Trend line to draw, left click at the spot on
the chart where the line should start.
•
Hold the mouse button down and move it across the chart to the end
Copyright © Charles Schwab & Co., Inc. 2006. All rights reserved. (0106-5667)
Charts
point for the line.
•
Release the mouse button.
Label the Trend Line:
•
From the New trend line box, go to the Label field.
•
Type the name or description as you want it to appear on the chart.
•
Click OK.
Color of the Trend Line:
•
From the New trend line box, click on the Color palette.
•
Select the color you would like to have displayed.
•
Click OK once to get back to the New trend line box, then click OK
again to apply the color.
! NOTE:
Once a Trend line has been drawn, it can be moved. Moving the trend
line is done by clicking on the line to modify and then either end of the line can be
adjusted to fit the slope of the line to the chart.
Copyright © Charles Schwab & Co., Inc. 2006. All rights reserved. (0106-5667)
177