1
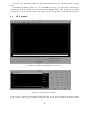
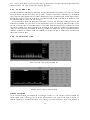
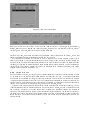
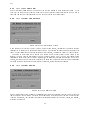
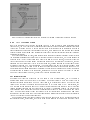
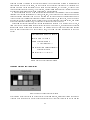
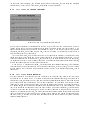
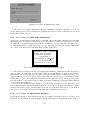
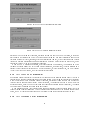
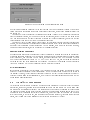
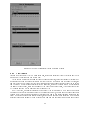
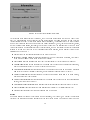
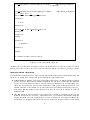
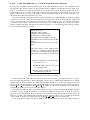
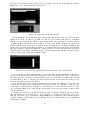
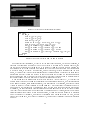
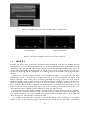
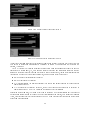
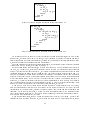
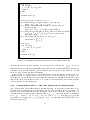
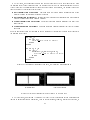
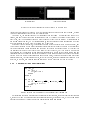
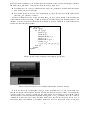
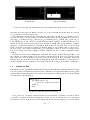
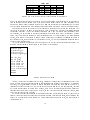
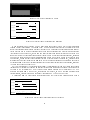
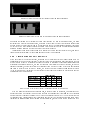
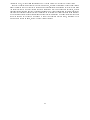
Figure 3.6: Input array specication
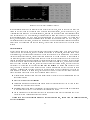
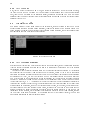
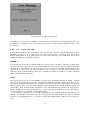
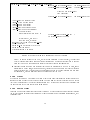
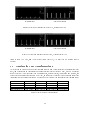
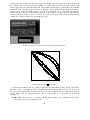
Top-16 Statistics The sixteen array entries with the most number of misses (in 'Amount mode) or the
highest miss ratio (in 'Percentage mode) are shown.
.
Please note that the percentage modes for array statistics are not yet implemented
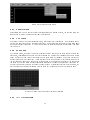
Trace statistics
These statistics can only be used with traces. The statistics show the number of misses/references/reuses
per program counter. Since the CVT is designed to cope with 512 dierent program counters, there are only
tow modes possible (and needed) : the global and zoomed mode. The statistics are designed in the same
manner as the array reference statistics, i.e. the amount of information and mode are dynamically adjusted.
Note that the color of the zoomed mode now corresponds to the color the program counter has been assigned
during execution. The manner of changing modes is the same, and there are also the same ve dierent
statistics :
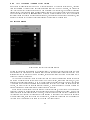
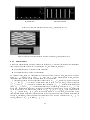
Miss Statistics The number of misses (in 'Amount' mode) or the miss ratio (in 'Percentage' mode) per
Program Counter are shown.
Reuse Statistics The number of reuses since last miss (in 'Amount' mode) or the hit ratio since last
miss (in 'Percentage' mode) per Program Counter are shown.
Cum Reuse Statistics The number of cumulative reuses (in 'Amount' mode) or the hit ratio (in 'Percentage' mode) per Program Counter are shown.
Reference Statistics The number of references (in 'Amount' mode) or the ratio of number of references
to this Program Counter divided by the total number of references are shown.
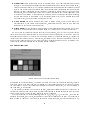
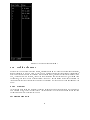
Top-16 Statistics The sixteen Program Counters with the most number of misses (in 'Amount mode)
or the highest miss ratio (in 'Percentage mode) are shown.
3.3 Controlling the CVT
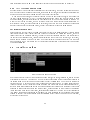
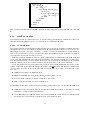
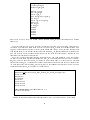
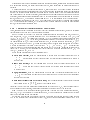
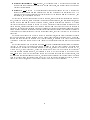
There are two rows of buttons to control the CVT. The top row is to control the CVT in terms letting the
CVT simulate a certain kind of cache in the way the user wants, like listening to a CD the way a user wants
16