1
Finally, the CVT can be used to gather information on the locality properties of C-codes, to which little
research has been devoted. The frequent use of pointers induces weird reference patterns that cannot or are
dicult to analyze from the source code.
4.2 Cache Interferences
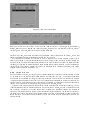
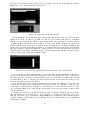
This section will provide the user with some insight on cache interferences by rst discussing two models that
were developed for cache interference phenomena in numerical codes. Next, a small example is provided that
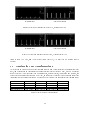
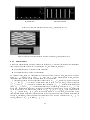
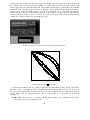
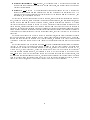
shows how cache phenomena are visualized with the CVT. Then more complex numerical code is analyzed
with the CVT.
Cache interferences fall into two categories, namely self-interferences and cross-interferences. Self-interference
is the case where elements of an array bump out data elements that could be reused in next references to
the same array statement. Cross-interference is the case where interferences occur between dierent statements. Especially within numerical codes (which usually deal with large arrays and loop nests), the regular
interleaved array accesses induce cache interference phenomena that are hard to understand.
One model that tries to analyze a loop nest cache usage, is described in [10]. This model provides a way
to approximate the number of distinct accesses (called DA in the paper) and the number of distinct cache
lines used (called DL) for a single array reference in a given loop nest. With these numbers, the number of
cache misses within a loop nest can be estimated. Then it is shown how these results can be used to guide
program transformations such as loop interchange
Another model developed especially for numerical codes, is called NUMODE and is described in [1]. This
model aims at understanding and quantifying cache interference phenomena. The principle is to dene the
sets of data to be reused (reuse sets) and the sets of interfering data (interference sets) and to compute
their intersections. Though important results have come out of this paper, the feeling exists that while
reading the paper, the available pictures, derived from the computations, provide more insight than the
actual computations in itself. This intuitive and graphical view of the workings in cache, coming from this
modeling technique, inspired the CVT. The paper also stresses the role of two kinds of parameters : array
dimensions and array base addresses.
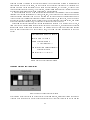
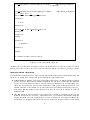
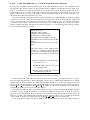
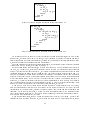
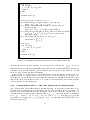
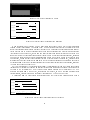
Fortran program
DO I=1,100,1
DO J=1,100,1
ArrayA[J] = ArrayB[J]
ENDDO
ENDDO
CVT code
ArrayA 2000 1,100
DummyArray 2100 1,100;1,3
ArrayB 2450 1,100
DO I=1,100,1
DO J=1,100,1
R ArrayB 1*J
W ArrayA 1*J
ENDDO
ENDDO
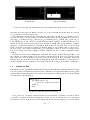
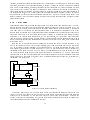
Figure 4.1: Example loop nest and corresponding CVT code to show overlap between arrays
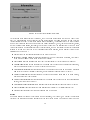
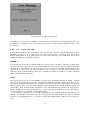
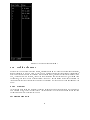
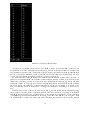
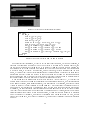
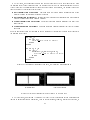
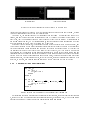
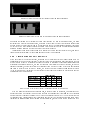
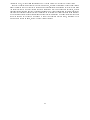
Let us now show how to visualize these phenomena with the CVT. Consider gure 4.1, both the fortran
54