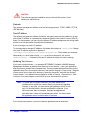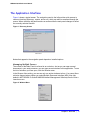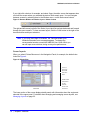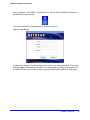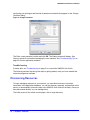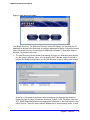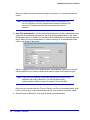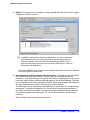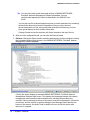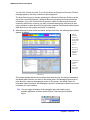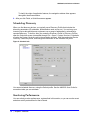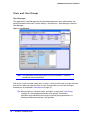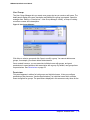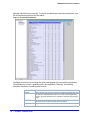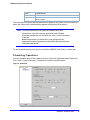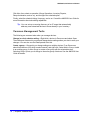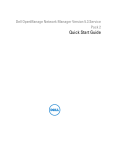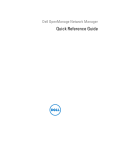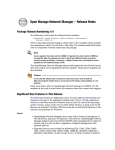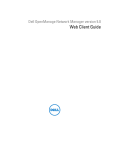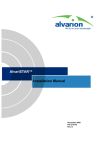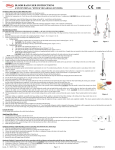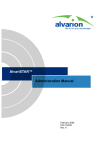
1
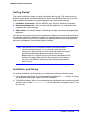
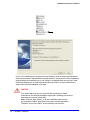
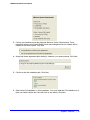
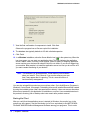
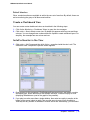
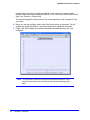
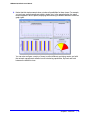
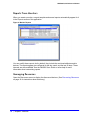
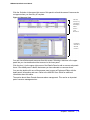
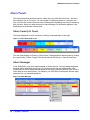
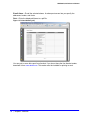
NETGEAR® ProSafe®
NMS200 Network
Management Software
Quick Reference Manual
350 East Plumeria Drive
San Jose, CA 95134
USA
September 2010
202-10727-01
v1.1
NMS200 Quick Reference Manual
©2010 NETGEAR, Inc. All rights reserved.
No part of this publication may be reproduced, transmitted, transcribed, stored in a retrieval system, or translated
into any language in any form or by any means without the written permission of NETGEAR, Inc.
Technical Support
Thank you for choosing NETGEAR. To register your product, get the latest product updates, or get support online,
visit us at http://support.netgear.com.
Phone (US & Canada only): 1-888-NETGEAR
Phone (Other Countries): http://kb.netgear.com/app/answers/detail/a_id/984/related/1
Web: www.netgear.com/Products/Software/NetworkManagementSoftware/NMS200.aspx
Trademarks
NETGEAR, the NETGEAR logo are trademarks or registered trademarks of NETGEAR, Inc. Microsoft, Windows,
Windows NT, and Vista are registered trademarks of Microsoft Corporation. Other brand and product names are
registered trademarks or trademarks of their respective holders.
Statement of Conditions
To improve internal design, operational function, and/or reliability, NETGEAR reserves the right to make changes
to the products described in this document without notice. NETGEAR does not assume any liability that may occur
due to the use, or application of, the product(s) or circuit layout(s) described herein.
Revision History
Publication Part Number
Version
Publish Date
Comments
202-10727-01
v1.1
September 2010
First publication
2 |
Chapter 1 Overview
Introducing NMS200 NETGEAR® ProSafe® Network Management Software
5
System Basics 5
Supported Operating System Versions 5
Hardware Recommendations 6
Basic Network Considerations 6
Authentication 7
Name Resolution 7
Protocols 8
Fixed IP Address 8
Updating Your License 8
The Application Interface 9
Managing Multiple Screens 9
Screen Layouts 10
Getting Started 11
Installation and Startup 11
Starting the Client 15
Troubleshooting 16
Discovering Resources 16
Scheduling Discovery 22
Monitoring Performance 23
Default Monitors 23
Create a Dashboard View 23
Install a Monitor in the View 23
Reports From Monitors 26
Managing Resources 26
Alarm Panels 28
Alarm Severity & Count 28
Alarm Manager 28
Chapter 2 Common Tasks
Administering the Application 31
Users and User Groups 32
User Manager 32
User Groups 33
Permissions 33
Scheduling Operations 35
Common Management Tasks 36
Mapping Equipment 37
Reports 37
Branding Reports 41
|
3
NMS200 Quick Reference Manual
Chapter 3 Troubleshooting
Troubleshooting Tips 43
Name Resolution 43
Common Issues 44
Index
4 |
NMS200 Quick Reference Manual
1.
Overview
1
Introduction
This Quick Reference Guide will help you start using your Product Name & Model as quickly
and productively as possible. After a review of the hardware and software requirements
needed for your installation in System Basics, you can move on to Installation and Startup on
page 11. To start using the software, see Discovering Resources on page 16.
This software includes reporting capabilities. These are described in online help. Key
features available in this software are the following:
•
Deep Discovery — Detailed device information retrieved automatically.
•
Real time monitoring of Alarms that impact your network. (See Alarm Panels on
page 28.)
•
A Resource inventory available at a glance. (See Managing Resources on page 26)
•
Configurable Detail Panels below the display of listed devices. These tell you about
devices you select.
For more detailed descriptions of features, see the User Manual or online help.
Tip: If you want to find something but are unsure about which manual
contains it, you can search all the Acrobat files in a single directory. For
example, in Acrobat v.8, Shift+Ctrl+F opens a directory-wide,
multi-document search.
System Basics
System requirements vary depending how you use the application and the operational
environment. Because we do not know your specific network and devices, the
recommendations are based on typical, not definitive configurations.
Base the minimum configuration of any system on its expected peak load. Your installation
should spend 95% of its time idle and 5% of its time trying to keep pace with the resource
demands.
Supported Operating System Versions
The following are supported operating system versions:
•
Microsoft® Windows Server® 2003 (Standard, Enterprise, and Web), Server 2008
Enterprise.
Chapter 1: Overview
|
5
NMS200 Quick Reference Manual
Note: Windows Terminal Server is not supported. The installer becomes
non-responsive with Data Execution Prevention enabled. This option
is disabled by default on Windows Server 2008, but is enabled on a
Windows Server 2008 machine running Terminal Server.
•
Microsoft Windows XP (Professional) with current patches applied, including SP3.
•
Microsoft Windows Vista (Business and above)
•
Windows 7
CAUTION:
You must disable User Access Control if you are installing on Vista,
Windows Server 2008, or Windows 7. Also: Installer may halt when
pre-existing bash sessions or cmd sessions are open. Close all such
sessions. Also: This application cannot co-exist with other installations of
Cygwin on the same Windows computer. Do not install it where Cygwin is
already installed, either separately or as part of another application. If
Cygwin is already installed, remove it before installing this application. If
you do not see any obvious indication Cygwin is installed (like an icon on
the desktop or program list, or a directory named c:\Cygwin), but suspect it
is, you can open the registry (Start > Run, then type regedit), and look for
HKEY_CURRENT_USER > Software > Cygnus Solutions > Cygwin.
Hardware Recommendations
NETGEAR® ProSafe® NMS200 Network Management Software contains an Application
Server that runs continuously in the background, and a Client (the user interface you actually
see). You can start and stop the client portion of the software without impacting the
application server. Device monitoring stops when you stop the application server or turn off its
host machine. The client can also be on a different machine than the application server.
Hardware recommendations are based on the different types of installation available:
Full Installation (Application server + Client) — Pentium 4, 3.2 GHz CPU, 2G RAM, and
20G available disk space.
Client only — Pentium 4, 2.8 GHz, 2G RAM, and 1G available disk space.
Basic Network Considerations
The Network Management software communicates over the network. The machine it is on
must be connected to a network for the application to start successfully. Normally the client
and server portions of the management system will be installed on the same system. The
system where the management server is installed must be configured with a static IP
6 | Chapter 1: Overview
NMS200 Quick Reference Manual
address.The fixed IP address is required for the managment server to communicate with the
managed devices.
Firewalls, or even SNMP management programs using the same port on the same machine
where this software is installed can interfere with communication with your equipment. Your
network may have barriers to communication with this software. Dealing with such barriers,
initial device configuration to accept management, security measures or firewalls is outside
the scope of these instructions. Consult with your network administrator to ensure this
software has access to the devices you want to manage with the Protocols described below.
Tip: One simple way to check connectivity from a Windows machine to a
device is to open a command shell with Start > Run cmd. Then, type ping
[device IP address] at the command line. If the device responds, it is
connected to the network. If not, consult your network administrator to
correct this. No useful information comes from disconnected or
powered-down devices.
See Chapter 4, Troubleshooting in this guide or see the User Manual, or online help, for
additional information about how to troubleshoot this software.
Authentication
For successful discovery of the resources on your network, this software requires
authenticated management access to the device. To get this access, you must provide the
correct SNMP community strings, WMI login credentials, and any other command-line
(Telnet / SSH) or browser (HTTP/HTTPS) authentication, and SNMP must be turned on, if
that is not the device’s default. Some devices require pre-configuration to recognize this
management software. Consult your network administrator for this information.
Name Resolution
The network management server and client require resolution of equipment names to work
completely, whether by host files or domain name system (DNS). The application server
cannot respond to hosts with IP addresses alone. The application server might not even be in
the same network and therefore the host would be unable to connect.
If your network does not have DNS, you can also assign hostnames in
%windir%\system32\drivers\etc\hosts on Windows. You must assign a hostname in
addition to an IP address somewhere in the system. Here are some example hosts file
contents (including two commented lines where you would have to remove the # sign to
make them effective):
#
102.54.94.97
rhino.acme.com
#
38.25.63.10
x.acme.com
127.0.0.1
# source server
# x client host
localhost
Chapter 1: Overview
|
7
NMS200 Quick Reference Manual
CAUTION:
This software supports installation only on the local file system. Avoid
installing to shared drives.
Protocols
The network managament software uses the following protocols: TCP/IP, SNMP, HTTP/S,
UDP Multicast.
Fixed IP Address
The network managament software includes a web server and must be installed on a host
with a fixed IP address or a permanently assigned Dynamic Host Control Protocol (DHCP)
lease. For trial purposes, you can rely on a dynamic IP address assignment with a long lease,
but this is not recommended for production installations.
If you do change your host’s IP address:
To accommodate a changed IP address, first delete the contents of \oware\temp. Change
your local IP address anywhere it appears in
\owareapps\installprops\lib\installed.properties. Then restart your machine.
Alternatively, in a shell, after running oware to set the environment, you can run
ipaddresschange -n followed by the new IP address to which you want to change.
Updating Your License
If you have a limited license — for example NETGEAR® ProSafe® NMS200 Network
Management Software by default limits discovery to five devices — then your application
does not function outside those licensed limits. If you purchase additional licenses, put the
updated license file in a convenient directory, then use the Settings > Permissions > Register
License menu item to open a file browser. Locate the license file, and click the Register
License button. Your updated license should be visible in Settings > Permissions > View
Licenses. Go to www.netgear.com/nms200 for more information on licenses.
Note: You must also re-register licenses if you have updated your
installation from a previous version where you previously upgraded
licenses. In any case, you must restart the application server or wait
up to 15 minutes before a license modification is effective. If you
import a license that, for example, changes the application’s
expiration date, it does not immediately take effect. You must restart
the application server or wait at least 15 minutes.
If you license new features, you must restart the application server and client.
8 | Chapter 1: Overview
NMS200 Quick Reference Manual
The Application Interface
Figure 1 shows a typical screen. The navigation panel to the left provides quick access to
common functions (discovery, reports, and so on), which can also be accessed through the
menus. When visible the left panel remains on screen while the main panel changes to reflect
the currently selected function.
Figure 1. Discovery Screen
Main Panel
Nodes that appear in the navigation panel depend on installed options.
Managing Multiple Screens
The content of the Main Panel is referred to as a window. Just as you can open several
documents in your word processor, you can open several windows in this application. To see
the list of windows you have open, click the Window menu.
In the Browser View setting, you can see only one active window at a time. You cannot tile or
minimize these windows unless you select Multiple Document Interface (MDI) View (the
default in NETGEAR® ProSafe® NMS200 Network Management Software) from the View >
Launcher menu.
Figure 2. Window Menu
Chapter 1: Overview
|
9
NMS200 Quick Reference Manual
If you right-click a device, for example, and select Open, the editor screen that appears does
not close the screen where you selected the device. Both remain open. You can navigate
between screens by selecting them in the Window menu, or with the browser buttons.
Figure 3. Browser Buttons and Select Layout / Select Content
The right and left arrows just left of the Select Layout pick list navigate backward and forward
through the open screens. To close a screen layout, click the Close button to the right of the
browser buttons and layout selectors.
Note: If you open more than 20 windows, the “Recommended Open
Windows Exceeded” error message appears. To change the
recommended number, consult the NMS200 User Guide. While you
can still open more windows, doing so may slow performance.
Screen Layouts
When you select PrintersResources in the Navigation Panel, for example, the default view
looks like Figure 4.
Figure 4. Default View
A list of
all Equipment and
their attributes
Main Panel
Detail Panels
Information
for the
selected
device and
associated
The lower portion of the screen displays detail panels with information about the equipment
selected in the upper panel. For details about changing and managing screen layouts, see
Managing Layouts on page 32.
10 | Chapter 1: Overview
NMS200 Quick Reference Manual
Getting Started
This section outlines the steps in a typical installation and first use. This section does not
describe all the details of possible installations. Refer to the NMS200 User Guide or online
help for additional information. A typical installation will consist of the following:
1. Installation and Startup— See the NMS200 User Guide for additional information.
2. Discovering Reasources — After you first install the application, you must discover the
equipment you want to manage.
3. Alarm Panels — See Alarm Panels for a discussion of alarms and events managed by the
application.
You can also set up users, device access passwords, and groups for both users and devices.
For example, use Group Operations to perform or schedule operations on multiple devices.
Consult the NMS200 User Guide for details about administration and the many additional
discovery, management, and reporting options available.
Note: Best practice is to use the default Admin user unless security
concerns dictate otherwise. If you must add a new user, best
practice is to add that user to a User Group and modify that group’s
permissions rather than adding permissions user-by-user
Also: bash.exe or md5sum.exe (two files that are installed with this
product) may trigger false positives with some anti-virus software. If
you get a virus detection warning for these files during installation,
take no action.
Installation and Startup
For a basic installation, install and start your management software with these steps:
1. Unzip (decompress) the file if you downloaded the application in .zip format, and close
any applications that might interfere with this installation.
2. To install this software, log in to your computer as an administrator-type user that can install
software, and run either win_install.exe. Do not install as a user named “admin” or as
the root user.
Chapter 1: Overview
|
11
NMS200 Quick Reference Manual
In Linux, the installing user must have a home directory, and must have permissions to
write both there and in the installation’s target directory. At one point the Linux installation
stops and asks the installing user to run a script in a separate shell as root user. Other
than these differences, to install on both Windows and Linux, you must follow these
steps. After initiating installation, click Next.
CAUTION:
You must install as a non-root user with the permission to create
directories in the selected installation target path. Installing to a directory
that requires root level access fails.
Also: Using the login “admin” to do the installation wipes out any
pre-configured “admin” permissions that come with the application.
Therefore, do not use “admin” as the installing user account.
12 | Chapter 1: Overview
NMS200 Quick Reference Manual
3. Confirm your hardware meets the displayed Minimum System Requirements. These
instructions assume a full install. Both the client and management server software will be
installed on the same system. Click Next.
4. Accept the license agreement after reading it, otherwise, you cannot proceed. Click Next.
5. Confirm or alter the installation path. Click Next.
6. Select either Full installation or Client installation. (You must install the Full installation on at
least one machine before the Client will work on any others.) Click Next.
Chapter 1: Overview
|
13
NMS200 Quick Reference Manual
7. View the final confirmation of components to install. Click Next.
Observe the progress bar as files are copied for installation.
8. The database size typically defaults to 2G with unlimited expansion.
9. Click Finish.
10. In a Windows installation, notice the Server Monitor icon ( ) in the system tray. When the
icon turns green, you can start your application client. This icon indicates the application
server’s status. Green is running, red is stopped, yellow is starting or stopping. Application
server monitors your devices even when the client is not visible, or you are not logged into
your machine. Best practice is to install the application server to a host you do not turn off if
you want constant monitoring of your devices.
Note: This software is a Java application. Virtual memory use increases
when you install it. This is normal. If you monitor memory use over
time it may appear that it is growing. This is a normal function of
Java's memory management.
You can also uninstall this product as you would any other. Go to Add/Remove Programs in
Windows’ Control Panel, for example. Uninstalling removes all installed files and files created
by using the installed system (that it has permission to delete). It does not remove directories
that were not created by this application’s installation or runtime. User-created directories in
the product’s directory path or desktop short cuts remain after product removal.
Starting the Client
After you verify that the application server is started (in Windows, the monitor icon in the
system tray turns green), use the Start button (or its Linux equivalent) to find NETGEAR®
ProSafe® NMS200 Network Management Software among your programs. This is under
14 | Chapter 1: Overview
NMS200 Quick Reference Manual
Start > Programs > NETGEAR >. Click that icon to start the client. Installation will place an
NMS200 icon on the Desktop.
You can also launch the client program by clicking on this icon.
Figure 5. Login Screen
A login screen appears. The default login user is admin, with a blank password. Enter admin
and click Logon. After logging in as admin, you are prompted to change the password. See
the NMS200 User Guide or online help for more information about options for adding and
Chapter 1: Overview
|
15
NMS200 Quick Reference Manual
configuring user privileges and the kind of password constraints that appear on the Change
Password dialog.
Figure 6. Change Password
The Enter a new password, confirm and click OK. The Startup screen will display. See
Screen Layouts for more about managing the user interface. See Troubleshooting Tips on
page 52 to solve application problems.
Troubleshooting
If startup fails, see Troubleshooting on page 51 or consult the NMS200 User Guide.
The following sections discuss typical steps in getting started, once you have installed the
network management software.
Discovering Resources
To begin managing resources in your network, you must discover them to store their
information in the application database. You can do discovery manually, as described in this
section, or automatically (see online help or the NMS200 User Guide for the latter). Once you
have discovered devices, you can manage them.
The initial screen for the admin user displays a link to begin discovery.
16 | Chapter 1: Overview
NMS200 Quick Reference Manual
Figure 7. Initial Screen for Admin.
Click Begin Discovery. The Resource Discovery screen will display. You can enter the IP
addresses of devices to be discovered or a range of addresses to search. Consult the section
about Advanced Discovery in online help for additional information. Follow these steps to
discover your network resources:
1. The next Discovery Wizard screen that appears is where you determine what devices
you are going to discover. Here, you can specify the IP address ranges to include or
exclude, the SNMP authentication to use, and the ports to query, among other things.
At the top of this screen’s work area, select an address type from the drop-down list
(options include IP Range, IP address, Hostname, Subnet, CIDR, File Name, Multicast
SLP, SNMP Broadcast) and enter the appropriate information in the fields directly to the
right of that list. Then click Add to add the address(es) to the processing queue, or click
Chapter 1: Overview
|
17
NMS200 Quick Reference Manual
Remove to delete a previously created range you selected. You can add several such
criteria.
Note: Select Manage via Hostname in a DNS / DHCP environment. For
this to be effective, however, the association between hostname and
the correct IP address for the discovered equipment must be
accurate.
2. New / Edit Authentication. You can select authentication(s) to go with a selected discovery
target with the checkboxes that appear in the list of existing authentications in the Select
Authentication panel. In addition, you can Add or Edit authentications to associate with that
target. When you Add an authentication, or Edit an existing one, an authentication editor
opens in the bottom of the screen.
Select or create the Name for the authentication, and select the Type from the pick list.
See the NMS200 User Guide for details about what to expect for the different types.
Note: Ensure the type selected matches the management interface on the
equipment you want to discovery. You can use some single
authentications in different types, for example: Telnet and SSH.
Notice that you can also alter the Timeout, Retries, and Port for the authentication at the
bottom of this screen, so the authentication fits with your network’s connection speed.
3. Select Devices for Discovery. Click Apply to accept your authentication.
18 | Chapter 1: Overview
NMS200 Quick Reference Manual
4. Options. This screen lets you configure a variety of global discovery options for the targets
configured in the Discovery tab.
Tip: In addition to discovering devices by themselves, you can now discover
links between them as an activity that follows discovering the devices.
Click the checkbox next to the link discovery task appropriate to your
network in the lower part of this screen to do link discovery too. (See Link
Discovery for an alternative)
Consult the NMS200 User Guide or online help for details about the options available
in the upper portion of this screen.
5. Select Discovery Activities (Listed in Execution Order)—The lower portion of the screen
lists activities to perform after discovery. Use the Select Activity field along with the
command (...) and search buttons to its right to find activities. Selecting here lets you select
from those listed by default, and from those that appear in the Activities Manager. Click Add
to list a selected activity below, checked as Selected. Some activities appear automatically
(from the default discovery profile). Check those you want to activate.
The Edit button lets you configure the selected Activity’s parameters, if it is available and
appropriate. The editor also appears if you Add a task with configurable parameters. If
you select an activity that requires user input, the standard attribute selection screen(s)
for that activity appear during Discovery. Fill in the required attributes, and Discovery
continues.
Remove deletes the selected activity from the list.
Chapter 1: Overview
|
19
NMS200 Quick Reference Manual
Tip: You can add a task to add discovered devices to NMS200 NETGEAR®
ProSafe® Network Management Software’s heartbeat. You can
configure what appears by default as described in the NMS200 User
Guide.
You can also use the up/down/top/bottom arrows to reorder selected rows, reordering
what activities discovery executes. Regardless of the row order, however,
device-based tasks run first, and group-based tasks (like link discovery) run last,
since groups depend on their member information.
Clicking Reorder moves the activities with Select checked to the top of the list.
6. After you have configured this tab, you can click the Discover button.
7. Discover. Clicking the Discover button executes the discovery you have configured, storing
the information retrieved from devices in the NMS200 NETGEAR® ProSafe® Network
Management Software database.
Clicking this button displays a standard NMS200 NETGEAR® ProSafe® Network
Management Software audit screen. This displays the messages between the network
management software and the discovered devices, including the post-discovery
activities. Select a message in the top of the screen to see the time and date it occurred in
mid-screen, and the contents of some messages in the Message Details panel at the
bottom of this screen. See Audit Trails for details of how to revisit this screen after
discovery is complete.
20 | Chapter 1: Overview
NMS200 Quick Reference Manual
You can click Close at any time. If you click it before the Equipment Discovery Finished
message appears, discovery continues in the background.
The final discovery panel, whether appearing for a Resource Discovery Profile or at the
end of the a conventional basic / advanced discovery process presents asynchronous
information. If you click Finish before the process is done, the discovery process still
continues. While that is occurring you may not see elements being discovered in their
resync schedule until the discovery job is actually complete. Executing scheduled resync
while discovery is still ongoing may result in exceptions.
8. When discovery is done for the user admin, and you click Close, the following Layout screen
appears by default.
Alarms:
Totals followed by a
list of alarms
from the discovered
devices.
Resources:
A list of all
Equipment
and their
attributes
Detail Panels:
Information
for the
selected
device and
associated
Main Panel
This screen displays alarms received from discovered devices, the devices themselves,
and details about devices you select in the lowest panel. See Managing Resources for
more about the resource management portion of this screen. See Alarm Panels for
information about the alarms, and Managing Layouts for a description about how you can
customize your user interface.
Tip: You can toggle the display of the navigation pane that leads to most
available application functions with the Show / Hide Navigation Window
button.
Chapter 1: Overview
|
21
NMS200 Quick Reference Manual
To clarify the origin of application features, the navigation window often appears
throughout the documentation.
9. After you click Finish, a QuickView screen appears.
Scheduling Discovery
When you first discover devices, you typically use a Discovery Profile that includes the
discovery parameters (IP addresses, authentication used, and so on). You can keep your
inventory up-to-date and discover equipment over a range of addresses by scheduling a
repeated discovery. To do this, after you create the Discovery Profile in Discovery Profiles,
open the Schedules screen (accessible through File > Open > System Services > Schedules
or under the System Services node in the navigation window), click New and select Device
Discovery. Select the profile, and configure the schedule in the Schedule Info panel.
Figure 8. Schedule Info
You cannot schedule discovery using the Default profile. See the NMS200 User Guide for
more about what you can automate.
Monitoring Performance
You can actively monitor performance, as described in this section, or you can monitor event
and alarm activity as described in Alarm Panels.
22 | Chapter 1: Overview
NMS200 Quick Reference Manual
Default Monitors
Other, seeded monitors are available to add to the core set of monitors. By default, these are
active monitoring the group of all discovered entities.
Create a Dashboard View
You can create custom dashboard views as described in the following steps:
1. Click Active Monitoring > Dashboard Views to open the view manager.
2. Click action > New to create a new view. By default this appears with two rows and three
columns. You can change those numbers and click Update to create a different layout. For
simplicity, ther example has one column and row.
Install a Monitor in the View
3. Click action > Add Component then click Action > properties inside the view’s cell. The
Dashboard View Component Properties screen appears.
4. Enter a name for this component (TestDashboardComponent, here), and select a monitor
and display type. Notice also that for this example we leave Threshold Display as none
(displaying thresholds as a part of the graph is also possible).
5. If you plan to monitor more than a single attribute, then select one entity to monitor at the
bottom of the screen (select an entity, then use the arrow to move it from Available to
Selected) and any number of attributes to monitor above that. Alternatively, you can select
Chapter 1: Overview
|
23
NMS200 Quick Reference Manual
several entities to monitor, but only one attribute. In our example, we select a single
interface, and monitor several attributes (BW Util, Error Count, Errors and Discards Count,
High, Low, Packets In, Packets Out).
The exact configuration of this portion of the screen depends on the Component Type
you select.
6. Notice you can also configure items in the Data Source portion of the screen. For this
example we accept the defaults. Consult the online help for additional information.
7. Finally, click OK to display the monitored data within the dashboard view you have
configured.
Note: You may have to wait until monitoring intervals are relevant. If you
monitor every minute, you will have to wait at least that long to get
data.
24 | Chapter 1: Overview
NMS200 Quick Reference Manual
8. Notice that this simple example does not show all possibilities for these views. For example,
you can have several components within a single view. In the example below, the same
monitor appears in all four panels, displaying the monitoring for different attributes in different
graph types.
You can also configure a variety of views to reflect different monitoring needs, and with
the network management software’s multi-windowing capabilities, flip back and forth
between the different views.
Chapter 1: Overview
|
25
NMS200 Quick Reference Manual
Reports From Monitors
When you create a monitor, a report template and several reports automatically appear for it
in the Reports section of the application.
Figure 9. Monitor Reports
You can modify these reports, but by default, they include the monitored attributes and/or
devices. The reports appear pre-configured for the day, week, and the last 30 days. These
intervals are also modifiable. See the NMS200 User Guide or online help for more
information about customizing reports.
Managing Resources
Open the Resources screen to display the discovered devices. (See Discovering Resources
on page 16 for instructions about discovery.)
26 | Chapter 1: Overview
NMS200 Quick Reference Manual
Click the Go button in the upper right corner of this panel to refresh the screen if resources do
not appear when you discovery is complete.
Figure 10. Resource View
Title bar,
Action, Lay
out buttons
and display
Filters
Discovered
Resources
Detail Pan
describes a
selected
resource
You can view all discovered resources from this screen. Selecting a resource in the upper
panel lets you view details about that resource in the lower panel.
Click the plus (+) in the upper right corner of the Details Panel to add or remove sub-panels
there. If the details panel is blank, that means you have selected no resource above.
You can also double-click one of those same rows to open an Equipment Editor with the
detail panels’ information and more. Refer to the NMS200 User Guide for additional
information about this editor.
The section about Alarm Panels discusses alarm management. This can be an important
part of resource management too.
Chapter 1: Overview
|
27
NMS200 Quick Reference Manual
Alarm Panels
This section describes the alarm panels, visible when you click Event Services > Alarms in
the navigation tree or File menu. You can reorder or hide these panels to customize your
view. You can also further customize some of these panels by adding, removing or reordering
their columns. When you select an alarm in Alarm Manager, its information appears in the
detail panels at the bottom of this screen.
Alarm Severity & Count
This panel displays the count of events by severity, and totals them on the right.
Figure 11. Event Severity & Count
This can either display All Events or Open Events. Change between these counts by clicking
the Layout button. Select Change Filter and choose the All Events or Open Events items.
Alarm Manager
In the Default filter, only Open alarms appear on these screens. You can change displayed
columns (Alarm attributes) with the plus (+) button near the top right of the screen, and
modify filters to restrict the alarms that appear in the display (see the NMS200 User Guide or
online help for more about filters). For example, you could filter to see alarms that are major
and above for only selected equipment.
Figure 12. Alarm Manager
28 | Chapter 1: Overview
NMS200 Quick Reference Manual
Tip: As in most such screens, you can sort the listed Alarms by clicking a
column header. Toggle the sort order by clicking the header again.
The Action Button or right-click menu displays the following items (some installations hide
some of these):
Open > Entity — This opens an editor where you can configure the device from which this
alarm came. See the NMS200 User Guide, or online help.
Open > Alarm — Opens a screen describing all the details of the selected alarm. See Alarm
Panels on page 28.
Open > Equipment — This opens an editor where you can configure the device from which
this alarm came (an Entity, if different, is a subcomponent of the equipment). See the
NMS200 User Guide, or online help for more about this.
Open > Event Definition — This opens an editor where you can reconfigure this alarm and
what it means. See the NMS200 User Guide or online help for more information.
Open > Processing Rules — This opens an editor where you can configure the processing
rules for this alarm. See the NMS200 User Guide or online help for more about these.
Acknowledge Alarm — Acknowledges the selected Alarm(s). The current date and time
appear in the Ack Time field, and the name of the currently logged-on user appears in the
Ack By field.
Unacknowledge Alarm — Unacknowledges previously acknowledged alarm(s), and clears
the entries in the Ack By and Ack Time fields.
Assign User — Assign this alarm to one of the users displayed in the sub-menu by selecting
that user.
Clear Alarm — Select this option to clear the alarm.
Show Performance — When you select this command the network management software
finds all of the performance attributes being monitored for the selected equipment and
creates a dashboard with one dashboard component for each attribute. (See Active
Performance Monitor in the NMS200 User Guide for details.)
If you multi-select more than one device, each component shows the top five metrics for each
attribute. If you select only one top-level device, The device's interface and port children are
searched for performance attributes and these attributes appear with the top five children for
each attribute.
The data that appears is based on the monitors for thatthat device and where Retain Data is
checked. If you have several monitors and you are retaining data on those monitors, the
screen reflects those data points.
If you select two devices in Resources manager and click action > Show performance, Both
of the devices’ common attributes are displayed in the form. (You cannot display interface
data because the devices do not have interfaces in common.)
Map — Opens a topology view displaying the equipment from which the selected alarm(s)
came. See Mapping Equipment in the NMS200 User Guide or online help.
Chapter 1: Overview
|
29
NMS200 Quick Reference Manual
E-mail Alarm — E-mail the selected alarms. A subsequent screen lets you specify the
addressee, header, and footer.
Print — Prints the displayed Alarms to a pdf file.
Figure 13. Printed Alarms (pdf)
You can print or save this report from Acrobat. If you do not have the free Acrobat reader,
download it from www.adobe.com. This reader must be installed for printing to work.
30 | Chapter 1: Overview
2.
Common Tasks
2
Administering the Application
This software controls access to your network resources and device data, and offers many
forms of automation:
•
You can configure multiple security levels (read-only access, read/write-access,
administrative access, and so on) and multiple types of users (user groups). This is
described briefly in the next section. .
•
You can automate and schedule a variety of operations.
The following sections describe these examples. For additional information, see the NMS200
User Guide, or online help.
Chapter 2: Common Tasks
|
31
NMS200 Quick Reference Manual
Users and User Groups
User Manager
The application’s User Manager lets you associate passwords, group membership, and
contact information with users. Select Settings > Permissions > User Manager to see the
User Manager.
Figure 1. User Manager
Note: This application comes with system users like OWAdmin. These are
normal and cannot be deleted.
Click action > New to create a new user, or action > Open to edit a user you have selected
from the list. When you open the User (or User Group) editor, you can also configure
permissions, as described in Permissions on page 33.
Tip: Best practice is to configure users, put them in a group (see User Groups
on page 33), then assign permissions to the groups. Permissions
accessible from individual users’ screens override group permissions, so
tailoring individual permissions is still possible.
32 | Chapter 2: Common Tasks
NMS200 Quick Reference Manual
User Groups
The User Group Manager lets you create user groups just as you create or edit users. The
detail panels display the name, description and whether the group is protected. Open this
manager from Settings > Permissions > User Group Manager. Initially, a Group is nothing
more than a name and a description.
Figure 2. User Group Manager
Click New or select a group and click Open to modify a group. You cannot delete some
groups; for example, you cannot delete Administrators.
Once created, however, you can associate individual users with groups, and grant
permissions to users based on their association with a group. By default, new groups have
no permissions. See Permissions on page 33.
Permissions
This panel appears in editors for both groups and individual users. It lets you configure
permissions (also known as “functional permissions”) for individual users which override
those configured for groups. The permissions displayed in this screen are only those for the
Chapter 2: Common Tasks
|
33
NMS200 Quick Reference Manual
selected, individual user (or group). To see the combined group and user permissions, see
the All Permissions panel in the User editor.
Figure 3. Functional Permissions
Configure permissions by checking the actions that appear in the row with the permission.
These determine a user’s capabilities within the application. Generally, the following
describes the effects of enabling these actions:.
Action
Default Behavior
execute
When checked, this action lets you launch a particular manager and query
for elements. Alternatively this action can control a specific application
function, (typically described by the permission name) like provisioning a
policy
add
This enables the New menu item on the action menu. If you do not check
this action, then the New menu item does not appear.
read
When checked, this enables the Edit menu item on the action menu.
34 | Chapter 2: Common Tasks
NMS200 Quick Reference Manual
Action
Default Behavior
write
When checked, this enables the Save button within editors.
delete
When checked, this enables the Delete menu item on the action menu
within managers.
The functional permissions that use these actions appear in this screen. Select a permission,
and in the Group editor, the description appears at the bottom of the screen.
Note: Functional permissions are global and additive with other
permissions. If you have a group permission and individual
functional permissions set, the result is a union, not an intersection
of the two.
Also: Best practice is to add users to user groups with the
appropriate functional permissions rather than alter individual user
functional permissions.
To see the details about how to do this, consult the NMS200 User Guide, or online help.
Scheduling Operations
You can schedule many of this software’s actions. Open the Schedules screen either from
File > Open > System Services > Schedules or from the navigation pane.
Figure 4. Schedules
Chapter 2: Common Tasks
|
35
NMS200 Quick Reference Manual
Click New, then select an operation (Group Operations, Inventory Reports,
Resynchronization, and so on), and configure the selected option.
Finally, select the schedule timing, frequency, and so on. Consult the NMS200 User Guide for
more information about scheduling capabilities.
Tip: You can set up a recurring discovery of an IP range that automatically
adds any new networked devices to those already in your inventory.
Common Management Tasks
The following are common tasks when you manage devices:
Change (or view) a device setting — Right-click a device in Resources and select Open.
The subsequent screens let you see and change device settings when you elect to save your
changes. You can also use the Detail panels to do this.
Create a group — Groups let you change settings on multiple devices. From Resources,
select listed devices (Ctrl+click to select several), and right click. Select Add to Group, to add
to an existing group, or New Group to create a new group with the selected devices.
Selecting Group Op lets you do things to the entire group of devices. See the NMS200 User
Guide for details.
36 | Chapter 2: Common Tasks
NMS200 Quick Reference Manual
Mapping Equipment
In addition to their listing in the Inventory screen, discovered resources can appear in a
topology mapping.
Chapter 2: Common Tasks
|
37
NMS200 Quick Reference Manual
Figure 5. Topology
To see discovered equipment in a map, do the following:
38 | Chapter 2: Common Tasks
NMS200 Quick Reference Manual
1. Open Topology View from the navigation panel, or with File > Open > Inventory >
Topology Views.
2. Click action > New to begin configuring a view.
3. Click action > Add content.
4. In the subsequent screen, click Equipment (you can also add contacts, for example).
5. In the next screen, select the inventory that you want to map. You can Ctrl+Click to select
multiple items.
6. Click Select.
7. The equipment appears, represented as icons on a blank (white) screen. You can
re-arrange these icons by clicking and dragging them. The icons display the color of the
highest value alarm (critical / red is the highest) that most recently came from that device.
8. Select a background by clicking Properties, then selecting a background from the pick list.
To add graphics to those listed, click the command button (...) to the right of the pick list, and
select the graphic file. As long as the graphic is a .jpg, .gif or .png file, it can appear
behind the icons.
Tip: Notice that, within the view, you can make a larger display than appears
in this screen and click and drag the gray square in the Overview
(bottom, right) panel to select the area in the larger view screen.
You can also right-click an item to see a menu of additional options (see the NMS200
User Guide for details). For example, you can alter the magnification of the view with the
Zoom options, or open a web session with the selected device with the Direct Access
option.
Not all selections work with all devices. Consult the NMS200 User Guide for more
information about the functions available on this screen.
9. Click File > Save to preserve this view.
Chapter 2: Common Tasks
|
39
NMS200 Quick Reference Manual
Reports
Reporting includes a defined report combined with a report template. The report definition
itself selects the devices to query and the (reusable) template selects which of the available
attributes of those printers appear in the report.
The first reports you create about discovered equipment are typically done with the included
report templates that come with your software. To create a report with an existing template,
open File > Open > Reports > Reports, or click the icon in the navigation window.
Figure 6. Report Manager
Although you can limit what appears by using the filter at top of this screen, by default, all
reports appear in this list. The devices they report about, and their associated templates
appear as nodes in a tree in the lower panel.
Note: To create some reports about devices, you must initiate monitoring
or polling on the selected device before generating the report. For
Trend Reports, you must set thresholds polled. See Branding
Reports on page 42, or the online help for additional information.
See the online help for instructions about creating or altering Report templates themselves,
and assigning them to reports.
40 | Chapter 2: Common Tasks
NMS200 Quick Reference Manual
To see a report after selecting it, click Go.
Figure 7. Executed Report
Click the disk icon on this screen to save the report in any of several file formats, including
pdf (Acrobat), HTML, CSV (comma-separated value), RTF, single or multi-sheet Excel
spreadsheets (.xls), or XML. Click the printer icon to send this report to a printer.
Note: For pdf printing to work correctly, you must have the Acrobat reader
installed. This is available, free, from www.adobe.com. If you are
using a Web Client, this may look different, too.
Also: You can save a report from the web client, but cannot export
its contents.
See online help for more about saving historical reports.
Chapter 2: Common Tasks
|
41
NMS200 Quick Reference Manual
Branding Reports
Reports come with a default logo, but you can change that, as is illustrated in the above
screen. Put the .png, .jpg or .gif graphic file with your desired logo in
owareapps\redcell\images. In the
owareapps\installprops\lib\installed.properties file, alter this property:
redcell.report.branding.image=<filename_here>
No need to include the path, just use the file name.
Note: You must include the file on clients as well as the application server.
CAUTION:
You must create images that are no taller than 50 pixels, and no wider
than 50 pixels.
42 | Chapter 2: Common Tasks
3.
Troubleshooting
3
Troubleshooting Tips
The following answer common questions that arise when managing your equipment. For
more details, refer to the <Italic>User Guide. The applicability of the following will depend on
what drivers and other add-ons you have installed with MS200 NETGEAR® ProSafe®
Network Management Software.
The following sections discuss some troubleshooting techniques. See the NMS200 User
Guide for additional techniques.
Name Resolution
If your network does not have DNS, you can also assign hostnames on a Windows platform
n the file %windir%\system32\drivers\etc\hosts. Here, you must assign a hostname in
addition to an IP address in the system. Here are some example hosts file contents
(including two commented lines where you would have to remove the # sign to make them
effective):
#
102.54.94.97
#
38.25.63.10
127.0.0.1
rhino.acme.com
# source server
x.acme.com
# x client host
localhost
This software supports installation to only the local file system. Avoid installing to shared
drives.
Chapter 3: Troubleshooting
|
43
NMS200 Quick Reference Manual
Common Issues
The following list contains possible issues and some suggested sources and resolutions for
these issues:
Application does not start:
•
Check whether the IP address of server has changed.
•
Ensure the database is large enough. See the application’s other manuals for instructions
about changing the database size.
Device data does not appear:
•
Ensure the login credentials are correct (consult your network administrator)
•
Check whether the login protocol is enabled on device
Network configuration issues:
•
Ensure that your firewall is not preventing access to the devices you want to manage.
Equipment values are not configurable:
•
Ensure the login credentials are correct (consult your network administrator)
Deploying firmware fails. Symptoms are:
•
Pressing the Deploy Now button does nothing.
•
The FTP/TFTP File Server status is Stopped.
A possible work-around is to perform a backup of the device first.
44 | Chapter 3: Troubleshooting
Index
A
H
Active Performance Monitor 23
Administering the Application 31
Alarm Manager 28
Authentication 7
Hardware 6
System Requirements 5
Hardware recommendations 6
I
B
Basic Network Considerations 6
Branding Reports 41
Installation and Startup 118
IP address changes 7
L
C
License 8
Customizing Report Logos 41
M
D
Managing Multiple Screens 9
Minimum hardware 6
Monitor performance 23
Default Monitors 23
Discover Network Devices 16
DNS 7
Domain Name Servers 7
F
Figures
Alarm Manager 28
Executed Report 41
Functional Permissions 34
Initial Screen for Admin 15
Monitor Reports 26
Resource View 27
Schedules 35
Fixed IP Address 7
Functional Permissions 33
N
Name Resolution 7
Network Considerations 6
Network Requirements 6
P
Protocols 7
Q
Quick Start 11
R
Recommended Operating System Versions 6
Reports 40
Customizing Logos 41
Resources screen 27
Index | 45
NMS200 Quick Reference Manual
S
Scheduling Operations 357
Screen Layouts 7
Shared drive unsupported 4
Starting the Client 10
System Basics 5
System requirements 5
T
Topology 37
U
Updating Your License 8
Upgrade licenses from previous version 8
User Group Manager 33
User Groups
Manager 33
User Groups 33
Index
|
46