1
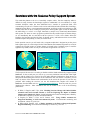
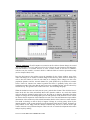
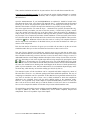
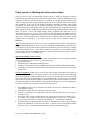
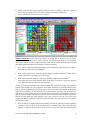
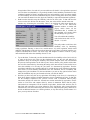
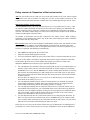
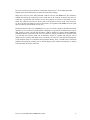
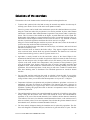
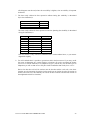
EXERCISES WITH THE SIMLUCIA
POLICY SUPPORT SYSTEM
Exercises with the SIMLUCIA
Policy Support System
Guy Engelen, Roger White and Hedwig van Delden
January 2004
Table of Contents
EXERCISES WITH THE SIMLUCIA POLICY SUPPORT SYSTEM ..................................................... 1
PART 1: SAINT LUCIA AND THE PSS SIMLUCIA................................................................................... 3
PART 2: POLICY EXERCISES WITH SIMLUCIA .................................................................................... 7
SOLUTIONS OF THE EXERCISES............................................................................................................. 19
RIKS
P.O. Box 463
6200 AL Maastricht
Phone: +31 (43) 3883322
Fax: +31 (43) 3253155
[email protected] | www.riks.nl
Exercises with the SIMLUCIA Policy Support System
The world that planners work in is a beautifully complex whole. But the complexity makes it
difficult to study, because the knowledge required to understand it is not available in a single
academic discipline, rather has been subdivided into a number of specialized fields, each
concentrating on a part of it. Workers in the various sub-fields and sub-sub-fields like climatology,
industrial location theory, or environmental management, each focus on their own problems, so that
it often seems that no one is working to put the pieces back together again in order to understand
the whole thing as a whole-- as a single, functional (or maybe not so functional) natural-human
earth system. Yet when we come up against a problem like the possible impact of climate change,
we see immediately that we must deal with the system as a whole, since climate affects the
biosphere, the biosphere provides the basis for human society, and human activities in turn affect
both the biosphere and perhaps, it seems, the climate itself.
In this practical exercise you will work with a computer model that is designed to put the pieces
back together again. It was developed for the United Nations Environment Programme as a tool for
exploring the possible impacts of climate change on islands in the Caribbean region. It could be
applied to any island, but the version you will use has an application to St. Lucia.
The first part of the exercises is to make you familiar with the island and the Policy Support System
SIMLUCIA. In the second part you will set up your own simulations and calculate what might
happen with the island over a period of 40 years under different circumstances. Short answers to
the questions asked during the exercises can be found at the end. If an answer is available, you can
find it by means of the footnote mark (and number) at the end of the question. If you have any
problems while making the exercises you can also download the complete user manual of
SIMLUCIA from the RIKS web site: www.riks.nl/projects/SimLucia. From the same site you can
download the software. More information can also be found in one or all of the following
publications:
R. White, G. Engelen, and I. Uljee, 2000. Modeling Land use Change with Linked Cellular
Automata and Socio-economic Models: A Tool for Exploring the Impact of Climate
Change on the Island of St. Lucia. Spatial Information for Land Use Management, edited by:
M. Hill and R. Aspinall, p.189-204, Gordon and Breach
G. Engelen, R. White, I. Uljee, and P. Drazan, 1995. Using Cellular Automata for
Integrated Modelling of Socio-environmental Systems. Environmental monitoring and
Assessment, volume 30, p.203-214
R. White and G. Engelen, 1997. Cellular Automata as the Basis of Integrated Dynamic
Regional Modelling. Environment and Planning B, volume 24, p.235-246
Exercises with the MOLAND and MURBANDY models
1
Exercises with the MOLAND and MURBANDY models
2
Part 1: Saint Lucia and the PSS SIMLUCIA
The island
St. Lucia is a small island located midway down the Eastern Caribbean chain, between the Atlantic
Ocean on the eastern shore and the calm Caribbean Sea on the western shore. The island is only 42
km long and 21 km wide and dominated by a single mountain, 950 m high Mount Gimmie, covered
with a rain forest full of natural beauty. The climate is tropical, but moderated by northeast trade
winds. There is a dry season from January to April, and a rainy season from May to August.
Tropical storms that may gain hurricane force and to a lesser extent volcanic activity are the main
causes of natural hazards. Current environmental issues are deforestation and soil erosion,
particularly in the south-western region.
During the development of the SIMLUCIA PSS the population was about 135.000 inhabitants of
which 35.000 persons were living in the capital Castries. The birth rate was relatively high and the
population growing, though more moderately than the birth rate would indicate because of outmigration.
Tourism is still the fastest growing sector in the economy and depends on a healthy and attractive
environment, including beaches, landscapes, and heritages attractions. There is also an important
agriculture sector, consisting of large commercial plantations of bananas for the European market.
However, most of the agricultural sector consists of very small farms producing for subsistence and
the local market. Except for some locally produced food, most goods are imported.
SIMLUCIA
Instructions for using the computer in this exercise are indented with a bullet. The programs you
will be using run under Windows. In Windows you perform most operations using the mouse; for
example, to open a file, a window or a box, move the cursor (with the mouse) to the relevant spot
and click twice in quick succession, using the button on the left of the mouse. To close a window,
locate the small square button at the left end of the title bar (the one with the cross), click on it, and
then click on Close in the menu list that appears. Some windows can also be closed by clicking on
a Close, Cancel or OK button in the window.
To run the SIMLUCIA program, double click on the SIMLUCIA icon, and then when the credits
appear, click on OK to get rid of them. A window will then appear that includes a list of files.
Double click on LucRise.sim. You will see a map flash up, only to be covered immediately by
a system diagram. However, you will still see parts of the map visible behind the system
diagram. Click once on the map legend and the map will come to the foreground. You can
always switch from map to system diagram (or any other window which is open) and back
again just by clicking on the one you want.
You are now ready to begin.
First familiarise yourself with the current situation on the Island, and with the model which
represents the island as an integrated geographical system.
Exercises with the MOLAND and MURBANDY models
3
Look down at the land use map in the Micro-scale dynamics window and notice where the various
activities are found. Then click on View in the menu bar at the top of the screen and use the
different possibilities to get a feeling of what the island looks like.
Briefly describe how the location of the following land uses seem to depend on physical or
topographical features1:
a. Natural vegetation
b. Mangrove
c. Tourism
d. Rural residential
Some areas are inherently more suitable for an activity than others. You can view the suitabilities
as follows:
Click on the Maps in the menu bar and subsequently on Suitability. A drop down list opens
from which you can chose a function you want to see the suitability of. Choose from this list
the function tourism. The suitability map for tourism will now open.
Arrange your screen in such a way that you can see the Land use map as well as the
Suitability map for tourism.
The scale on the suitability maps turns from red (most suitable) to blue (completely unsuitable).
Note that the most suitable areas for tourism are near the beaches and the coral reefs, which, as you
can see on the land use map, is where the tourist developments are located.
Close the Suitability map for tourism and open the Suitability map for agriculture. Compare
this suitability map to the land use map.
Is agriculture generally located on the most suitable land2a?
As you move higher on the mountain, what happens to the suitability for agriculture? Why
might this be the case2b?
Now close the Suitability map and click on the macro-scale dynamics screen to activate it.
The macro-scale dynamics window shows an overview of the structure of the system ‘St. Lucia’
modelled at the macro-level, being a scale covering the entire island. It also serves as a graphical
explorer of the macro-level model and permits access to the processes modelled at the macro-level.
The macro-level model essentially models 3 coupled sub-systems each represented by sets of
linked variables: the natural sub-system, the social sub-system and the economic sub-system, and
calculates the effects of changes in the natural, social, and economic sub-system on land use.
Look for a moment at the diagram to get an idea of the relationships connecting climate, the
economy, the population, and land use, as shown by the arrows and boxes. Now we will look at
some of these relationships more closely.
In the natural sub-system portion of the diagram click on the Climate box. The diagram that
appears shows that Temperature affects Storm frequency and Precipitation, and that both
Temperature and Precipitation have an effect on Agriculture, as you would expect.
Click on the part of the temperature box with the number in it and you will see a graph
showing the assumed change in temperature over the next 40 years.
How much higher will the temperature be by year 30? 3
Close this graph by clicking on the OK bar at the bottom of the graph box.
Now follow the arrow from the Temperature box to the Precipitation box and click on that
number to see the relationship between the change in average temperature and the change in
average precipitation. The horizontal red line across the centre shows the current mean
precipitation. If temperatures rise (moving to the right of the graph), precipitation will
Exercises with the MOLAND and MURBANDY models
4
increase also; if temperatures fall (moving to the left) precipitation will decrease. Click on the
OK bar to close this graph.
Follow the arrow from the Precipitation box to the Agriculture box, and click on the number
in that box. Now you see the relationship between precipitation and agricultural productivity.
The current level of agricultural productivity is shown by the horizontal red line.
Note that because the current agricultural activities are adjusted to the present mean
precipitation, any change in precipitation, whether an increase or a decrease, would lower
agricultural productivity, though decreases (to the left) would have a greater effect.
In light of these graphs, would an increase in mean temperature increase or decrease
productivity in the agricultural sector of the island’s economy? Explain, very briefly4.
This is one link between climate change and what happens in the economy of the island. Now
close this graph (click on OK), and then close the natural subsystem diagram (again, click on
the OK bar at the bottom).
In the economic sub-system part of the diagram, click on the Intersectoral demand box. The table
that appears shows purchases (columns) and sales (rows) of every sector of the economy. It is part
of an Input-Output model of the island’s economy. This model shows how every sector of the
economy affects and is in turn affected by every other sector. Thus a change in output for the
agricultural sector will have an impact on every other part of the economy, and in turn each of
those changes will cause further impacts, and so on... Looking at the External demand column,
which shows exports by each sector, you can see that two sectors, tourism and agriculture, bring in
most of the money earned by the island from the rest of the world: $ 415.4 million and $ 194.5
million respectively. Looking at the total demand (external plus domestic), answer these questions:
Which of these two sectors is most important?
How do the other sectors compare in importance with these two sectors?
Exercises with the MOLAND and MURBANDY models
5
Exercises with the MOLAND and MURBANDY models
6
Part 2: Policy exercises with SIMLUCIA
Now that the general functionality of SIMLUCIA has been covered, this part will briefly describe
how to run simulations with SIMLUCIA and how to use it for Decision and Policy support. We will
treat three rather theoretical exercises that get progressively more complex and require a better
understanding of SIMLUCIA.
Introduction
Policy-making and more generally decision-making is a stepwise process. In order to come to a
decision, the steps are run through sequentially in one or more iterations. Depending on the author
or the literature that is consulted, this process is subdivided in a larger or smaller number of phases
(or steps) and different names are given to each phase. Some agreement seems to exist about the
following three major phases, and their contents:
• the identification phase, the purpose of this phase is to better discern the real problem which
requires a decision to be taken. This is an analytical phase in which the real origin of a
problem is the topic of research, before suggestions to solve the problem are made;
• the development phase, this is the phase in which a more or less large number of alternative
solutions for the problems are developed;
• the selection phase, is finally the phase in which the ‘least unfavourable’ solution among all
alternative solutions is searched for and selected for implementation.
Although the three phases have been described in a sequential order, it should be stated clearly that
decision-making is very often a cyclical process, during which some if not all of the phases are run
through a number of times. The purpose of these cycles is clearly: (1) to get an in depth
understanding of the real problems; (2) to generate more and better solutions, and (3) to decide
upon an intervention or a combination of interventions that will solve the problem, at least in part.
Full fetched Decision Support Systems (DSS) will support the decision maker in each of the three
phases mentioned. However many so-called Decision Support Systems will focus on one or two of
the phases only. For example quantitative models are used to generate alternative solutions during
the development phase, or multi-criteria analysis is used to select among alternative solutions in the
selection phase.
This version of SIMLUCIA provides support for both the first and the second phase. SIMLUCIA will
help the user to get a better understanding of the origin of problems as they exist in St. Lucia or as
they might pop-up in a more or less distant future and it will support the user in the design and
evaluation of alternative solutions to cope with these problems. The selection phase is less well
supported in SIMLUCIA, since there is no functionality built-in to compare and rank alternative
solutions, other than what is available in ANALYSE, Microsoft Excel or IDRISI.
In the three exercises we will study the effects of external factors and policy interventions. The
exercises have been kept rather simple. Their purpose is mainly to make you acquainted with
SIMLUCIA to the point that you will be able to run your own exercises. First we will show how to
study the effects of external factors. Next we will see how interventions of the type ‘policy
interventions’ can be tested with the system.
Exercises with the MOLAND and MURBANDY models
7
If you intend to use SIMLUCIA for planning or policy-making, you should remember that you are
working with a model and that like any other model, this model is a strong simplification of reality.
More, SIMLUCIA is an instrument intended for scientific analysis, hence, you have full access to
nearly all its parameter and variables. Whenever you change parameters or variables beyond their
validity range, the model might generate results that are merely nonsense. In conclusion, use the
model in a responsible manner and with particular care!
All the exercises in this chapter will be done with the simulation files named LucNoCh.sim and
LucRise.sim. Begin each of the exercises described underneath by starting SIMLUCIA.
Policy exercise a: Working with scenarios
The effectiveness of planning can be strongly influenced by physical, economic and social factors
external to the system. They are usually beyond the control of the planner or policy maker. His
intervention is limited to the early detection of possible dangers caused by these factors and the
design and implementation of counter measures. In order to select appropriate and robust measures,
he will introduce external factors as scenarios in the system and study the behaviour of the system
and its response to these new conditions.
In SIMLUCIA change in temperature and change of the sea level are external factors, because it is
very unlikely that local decision makers can directly influence these.
Aim: In this exercise we want to examine the effects of temperature rise and sea level rise on the
loss of land and its further consequences on the tourism sector.
Screen arrangement: We will arrange the screen layout in such a manner that the input and output
windows of the model which are most relevant to this exercise are on the display. This does not
mean that the other windows are irrelevant. Because SIMLUCIA is a highly integrated model, most
state variables will undergo some changes as a result of the exercise. Hence, feel free to dig deeper
into the model to discover other effects of the scenarios that we will simulate.
First open the simulation file called LucNoCh.sim;
Minimize the Micro-scale dynamics window;
In the Macro-scale dynamics window, click the MBB called ‘Climate’. The Climate window
will open. Move it to the left (top) side of the display;
In the Macro-scale dynamics window, click the MBB called ‘Land use’. Move the Land use
Dialog window to the right (top) side of the screen;
In the Macro-scale dynamics window, click the MBB called ‘Labour’. In the Economic Subsystem dialog window, click the edit field in the column ‘Tourism’ and the row ‘Labour’. As a
result a new dialog window will open named Jobs: Tourism. Move this window to the right
side of the screen, position it below the Land use dialog window, and click the check box left
of the text Jobs. As a result an empty graph will open named ‘Jobs: Tourism’;
Close the Economic Sub-system window;
Now minimize the Macro-scale dynamics window;
It is good practice to manage your windows very carefully. This will keep you from being
distracted. Keep only the windows opened that are of direct interest to you. All windows
and dialogs that are open, even if they are hidden by other windows, are updated by the
program. This takes execution time and memory space, and thus will slow down the
program.
As a result of the above actions, your application window should look more or less like this:
Exercises with the MOLAND and MURBANDY models
8
What-if? simulation: We will compare two scenarios: the first with no climate change, the second
with a temperature rise of 2°C and sea level rise of 0.8 foot in 40 years (between 1990 and 2030).
The first scenario is a so-called ‘business as usual’ scenario, which we will use to establish a
reference state, the second is a scenario which is within the limits of scenarios presented recently
(see for example: Maul, 1993).
Press the Run button in the toolbar to start the simulation. In the Climate window, none of the
values will change (as we assume no climate change in this first run). In the Land use window you
will see how the number of cells for each land use is changing. These changes are due to the
population dynamics and the external demand for goods produced by the different economic
sectors. Notice for instance how natural vegetation and forest is gradually losing cells as the
simulation proceeds. Notice also that the tourism sector is expanding and new cells are taken in by
tourism activity. This growth is also visible in the Jobs: Tourism dialog and graph.
When the simulation comes to a halt (after 40 years), push the Reset button. Then click the Restore
button in the title bar of the (minimized) Micro-scale dynamics window. As a result the window
will open. Run the simulation again and see how the land use is changing. Remember that these
changes are simply due to the demographic pressure and expansion of the economic sectors. Notice
for instance the fast expansion of the industrial area near Vieux Fort and Hewanorra airport and the
urbanization of the southern tip of the island. Remember that this is the business as usual situation.
The model is showing us what is likely to happen if things are evolving purely driven by the
internal dynamics of the system (and based on the hypotheses built into the model). If planners or
policy-makers are not happy with this inherent evolution they will have to decide on the right
counter measures to stop unwanted impacts. That is the role of scenario development and scenario
analysis in policy-making.
Exercises with the MOLAND and MURBANDY models
9
Now we will run our
second
scenario.
First
minimize the Micro-scale
dynamics window again.
Then select the Climate
window and click in the
edit
field
named
‘Temperature’
a
temperature that gradually
changes to a maximum of
2°C in 40 years. When
finished the Temperature
Change window should
more or less look like this.
Now select the edit field
Sea Level and click-in a sea
level rise which gradually
changes to a maximum of 0.8 foot in 40 years.
Then run this new scenario for the full 40 years. In the Climate window, you can see in the
different edit fields how the changes in temperature and sea level rise will result in a rising storm
frequency and precipitation and how this will affect (percent increase or decrease) in the demand
for Tourism, and goods in the Agriculture and Industry sectors. Notice the difference (in
comparison with the previous scenario) in the evolution of the Jobs in the Tourism sector. Notice
also in the Land use window the differences in the number of cells that are taken in by Tourism as
well as the amount of land that is lost to the sea. If your scenario settings are similar to ours, the
island will have lost 10 cells to the sea (read the line sea with the value 0 in the column Initial land
use and 10 in the column Current land use).
If you run the simulation again with the Micro-scale dynamics window opened, you will notice
which coastal cells are lost to the sea (for example part of the causeway linking Pigeon Island,
located in the Northwest, to the mainland will be lost to the sea). In the next exercise we will show
how maps can be compared more easily.
From this exercise we can conclude that climate change would have a considerable effect on the
Tourism sector. The effects in terms of land loss are rather limited. We would like to repeat
however that the results are influenced to a degree by the assumptions built into the model.
Certainly the time series entered for the external demand of each sector (among which the Tourism
sector) will have considerable effects on the employment in the sectors.
The following remark relative to the representation of the relief of the island in this model is
important. Due to the grid representation of the relief, the typical narrow beaches of St. Lucia are
not very well represented. They tend to get disregarded because they hardly ever cover more than
half of the surface of a cell (250 by 250 meter) and their elevation above sea level is usually
overestimated (because a cell has an average elevation value). Since the calculation of sea level rise
and loss of land is directly related to the elevation of coastal cells, one should be careful in
interpreting the amount of land that is really at risk.
Also, and even more important, is the remark that SIMLUCIA does not have models that take into
consideration the effects of waves, currents and wind on the erosion of beaches. On field trips to St.
Lucia, we have witnessed the effects on the beaches of storms in combination with seasonal current
regimes: during the winter season, beaches erode strongly, while in the summer season, beaches are
naturally replenished. In order to study these effects, SIMLUCIA would have to be further
developed and appropriate models of the kind should be included.
Exercises with the MOLAND and MURBANDY models
10
Policy exercise b: Working with ANALYSE and MS Excel
Results produced with SIMLUCIA can be further analysed by means of the programs ANALYSE and
Microsoft Excel. The purpose of this exercise is to practice this procedure.
Aim: the aim of this exercise is to re-run the simulations of exercise a, but to store the results of the
simulations on file, in order to allow for the further analysis of the map results by means of
ANALYSE and the other data by means of Microsoft Excel. In order to be able to produce and store
Excel files, it is required that you have Excel installed on your PC.
Screen arrangement: Open the file NoCh.sim and arrange your screen as explained in exercise a.
Do not make any adaptations to this simulation yet.
What-if? simulation: Again we will compare two simulation runs: the No-change scenario and the
Rise scenario. Once your screen arrangement is ready to start the No-(climate) change run, select
from the Options menu the command Log… As a result the log settings dialog will open. The
dialog allows you to define a so-called log-file in which the Micro-scale dynamics maps produced
by a simulation can be stored. This file is always and immediately saved on your hard disk. Hence,
there is no need for you to save it manually.
First click the On radio-button,
next define the name of the log
file in the Log file edit field (for
instance NoCh.log) and finally fill
in the (simulation) interval for
which you want a map to be
added to the log file (for instance
every 10 years). Press OK to close
the dialogue window.
Next, we will link SIMLUCIA to Microsoft Excel and enable the transfer of simulation data to
Excel. To that end, select the Link to Excel… command from the Options menu. As a result the
default Excel file Lucia.xls will open. This workbook file is now ready to receive data from the
simulation. Click in the SIMLUCIA application window to bring it back to the foreground of your
screen.
Now start the simulation. The dialogs will be updated and, hidden from the user, maps are written
to the log file NoCh.Log (at every 10th simulation step) and to the workbook Lucia.xls (at every
simulation step). When your simulation comes to a halt (at simulation step 40) select the workbook
and save it as NoCh.xls.
At this point we will not further discuss the results of the simulation as they are not different
(except for some effects due to the probabilistic variables) from what has been said in exercise a.
We will immediately continue the exercise with the second simulation. However, do not change the
Temperature rise and Sea level rise by hand, rather select from the File menu the command Open
Simulation to open the simulation file named Rise.sim. This file is identical to the NoCh.sim except
for the fact that a climate change scenario (2°C Temperature rise and 0.8 foot Sea level rise in 40
years) is pre-defined.
When Rise.sim is opened, the old simulation will close automatically. None of its output is saved,
except for the NoCh.log. A dialog will open asking you whether you want to save the simulation
results. If you answer yes, the Save as dialog will open. Answer No.
Once Rise.sim is opened, make certain that the maps produced by the rise scenario are written to
the log file named Rise.log for every 10th iteration. Also, select Link to Excel again in order to open
a new (empty) workbook Lucia.xls to receive the results of the rise scenario.
Exercises with the MOLAND and MURBANDY models
11
Then, start the simulation and run it for 40 years and save Lucia.xls with the new name Rise.xls.
Comparison of simulation results: We will compare the results of both simulations: to compare
maps, we will use the application ANALYSE, and to compare numerical results, we will use
Microsoft Excel.
Open the ANALYSE-TOOL. If you installed SIMLUCIA as explained, it should be located in the
same Program Group. Next, select from its File menu the Open… command to open the file named
NoCh.log. As soon as the program has opened the file, it will display the first map of the file.
Maximize the window to increase the map to the maximum size possible (on your monitor).
Next select again from the File menu the Open… command. Now open the file named Rise.log.
ANALYSE will ask you whether you want to close the current (= NoCh.LOG) log file(s). Answer
No to this question and select Rise.log in the Open dialog. From this moment on, ANALYSE is
ready to show you any of the maps stored in both log files and to perform a comparison between
any two maps. Let us compare the end states of both simulations. To that end select in the first list
box (from the left) the map NOCH40 and in the second list box the map RISE40. Then press the
comparison
button. ANALYSE will now show the results of a cell-by-cell comparison between
the two maps and for each land use. In the third list box you can select the land use for which you
want to see the comparison.
Pick Sea from the list of land uses. In green you see which cells are taken in by the sea in both
simulations and in blue you see the 10 cells that are lost to the sea due to sea level rise.
Now pick Tourism from the list of land uses. Again in green you see cells that are taken in by
tourism in both simulations, in red the cells which land use has changed due to sea level rise and in
blue cells that are taken in by tourism in the Rise scenario, but not in the No change scenario. To
understand better the overall changes that have taken place in the vicinity of some of the red or blue
cells, it is interesting to look at the original maps that are being compared by pressing the buttons
or . There is an interesting case of coastal retreat to be seen in the Rodney Bay area. Some
cells are lost to the sea, the beach has moved inland, and some tourism cells have been abandoned.
Of course, the simulations are showing what would happen in the absence of beach protection by
public or private authorities. Also, land loss and beach loss in our simulation depend largely on the
elevation map, which has only one elevation reading per cell (250 by 250 m).
The numerical results of both simulations can be compared and further analysed by means of
Microsoft Excel. Excel is a very elaborate package with almost unlimited capabilities. One way of
comparing two simulation runs is to open both .xls files that have been generated and stored (in our
case NoCh.xls and Rise.xls) and to create a new (a third) workbook in which the comparisons
(differences) are calculated. Excel will also allow making graphs of the simulation results.
However, it is beyond the scope of this chapter to explain the functionality of Excel. For now just
take a look at the Excel sheets and try to find the number of cells lost to the sea in simulation
Rise.sim. Also compare the number of cells taken in by tourism in both simulation runs.
We would like to conclude this exercise with the remark that SIMLUCIA also supports the export of
its maps to IDRISI (as .IMG files). In IDRISI they can be further compared, analysed and
manipulated. This too is beyond the scope of this chapter.
Exercises with the MOLAND and MURBANDY models
12
Policy exercise c: Working with policy interventions
In the previous exercises we worked with scenarios, which we defined as hypotheses related to
external factors not under the control of the decision-maker. Other parameters in SIMLUCIA can be
controlled by planners and decision-makers. To mention are the demographic parameters that
define the long-term trends in birth, death and the migration rates. Decision-makers can influence
these parameters at the least in part through information campaigns, education, and/or health
programmes. The same is true for the economic parameters. For example, a directed promotion
campaign abroad for a product produced in St. Lucia (say tropical flowers) could boost the exports
of the agriculture sector. Finally decision-makers can restrict the spatial expansion of particular
sectors in specific parts of the island through zoning regulations. We define this type of
interventions as policy interventions. The next exercise will demonstrate how SIMLUCIA can be
used as an instrument for land use planning, natural resources and watershed management. We will
show how a zoning regulation can be introduced in the simulation and how the effects of such
regulation can be analysed. It is an exercise that will reveal the real dynamic capacity of
SIMLUCIA.
Aim: The particular aim of the exercise is to protect a remnant of forest, which is located South of
Forestière and North of Floissac on the lower slopes of Piton Flore and drained by a tributary of the
Cul de Sac River. On the land use and vegetation map in the atlas of St. Lucia the forest is marked
as Secondary Natural Forest (= Land that was cleared for agriculture or forest products and has
since reverted to forest). On the SIMLUCIA land use map, the forest consists of 10 cells (= 62.5 ha)
located around cell [row = 67, column = 66].
Important knowledge for this exercise:
In the PSS SIMLUCIA the allocation of cells on the land use map in based on a transition potential
which is calculated for every cell for every function by using:
The current land use;
Neighbouring cells (through the interaction rules);
Suitability for the specific function (in SIMLUCIA physical suitability combined with zoning);
Accessibility based on the road network and the importance of the function to be close to the
road network.
Screen Arrangement: In this exercise we will work with the maps of the Micro-scale models. If
your PC is equipped with a low-resolution monitor, you will have to keep the maps sufficiently
small (or zoom out) to see them simultaneously on your screen. As part of the exercise, we will edit
maps. Please keep in mind that SIMLUCIA is not equipped with a so-called Undo edit function.
This means that corrections made to maps are definite. You can press the Reset button to reverse all
the corrections made since the simulation was opened. Be careful when you save the simulation not
to overwrite original maps with copies that have been edited by you.
Start SIMLUCIA and Open the simulation file named ‘LucNoCh.sim’. Minimize the Macroscale dynamics window.
Select from the Maps menu the Suitability map for agriculture.
Zoom in on both maps to the point that the cells are sufficiently big to allow you to click-in
new values easily.
Position the maps in such a manner that the area around the cell with the co-ordinates [row =
67, column = 66] is handy. To make the mouse-pointer jump to the cell [row = 67, column =
66] you can select from the View menu the command Go to… and fill in the co-ordinates.
In order to focus your attention on the area where we will intervene, it helps to show the Major
Grid on top of both maps. To that end, select Grid… from the Options menu and draw a Major
Grid every 4 cells. You can unselect this option by clicking in the check box again.
Exercises with the MOLAND and MURBANDY models
13
Finally, make the Micro-scale dynamics window active (by clicking it) and select from the
View menu the command Network in order to draw the road system on the map.
Your screen should now look more or less like this:
Forest location
Forest location
What-if? simulation: For the sake of the exercise we assume that we have the power to impose
zoning plans. With SIMLUCIA, we want to find out why the particular forest area is threatened,
what type of land use is likely to replace the forest, when will this happen and how rigorous should
the zoning regulation be that is to prevent the forest from vanishing.
First, run the simulation and watch carefully what is happening to the forested area. Make a
note of the time when forest cells disappear.
What is replacing the forest? And when do the changes in land use take place?6a Reset and rerun the simulation if everything goes to fast for you.
Where do the first cells disappear? And why would they disappear at that location?6b
Hint: Select the Network map from the Maps menu and Accessibility for agriculture from the
View menu and zoom-in on the same forest location.
Clearly, the increasing demand for agricultural products, due to both the growing local population
and the export markets put a lot of pressure on the land. Agriculture is gradually taking in more
land all over the island and also in our forest area. This you can check by running the simulation
again while you zoom in on other locations. If you want to know how many cells are taken in by
agriculture, you can double-click the left mouse button in the Micro-scale dynamics window to
open an overview window showing the number of cells of each kind at each simulation step. Notice
also the fact that while the forest disappears, the rural residential area just west of the forest
expands, and that the expansion of Castries to the South adds to the general pressure on the land in
this part of the island.
Next, we will try to stop the farmers from invading our forest by imposing a zoning regulation.
This can be done by means of the suitability map. A suitability map is the expression of the
capacity to support a particular land use. On your screen you have opened the suitability map
Exercises with the MOLAND and MURBANDY models
14
for agriculture. Hence, for each cell you can read how well suited it is for agriculture expressed
in a scale from 0.0 (unsuitable) to 1.0 (perfectly suitable). In the Suitability calculation we have
considered a number of factors, including actual use, land capability, slopes, elevation, rainfall,
etc. But suitability also involves institutional aspects, such as zoning plans. Hence, the planner
can in an artificial manner lower the (physical) suitability to represent institutional regulations.
Read from the Suitability map the suitability value for the forest cells. To that end move the
cursor over the cells. Do not click the mouse, if not, new values will be entered in the cells.
Another way of knowing the accessibility values is by clicking the right mouse button on a
forest cell in the Micro-scale
dynamics window. A window will
pop-up which shows all the
information that is available for
this particular cell, among which
the Suit(ability) for agriculture.
You will read that the suitability
value for the forest cells is 0.7 on
the (0.0 - 1.0)-scale.
The policy-maker could lower this
suitability value by introducing
zoning regulations. Entering a value of 0.0 would mean a very strict regulation, which would
definitely and absolutely protect the forest from intrusion by agriculture, but which would be very
expensive and difficult to enforce. The least costly and simplest to enforce would be a policy
intervention that will reduce the suitability from 0.7 to 0.6.
Try out the latter. To that end, reset the simulation and click a suitability value of 0.6 in all (10)
or some of the forest cells. Then run the simulation again. Are the cells still taken in by
agriculture? Keep on lowering the suitability value till the complete forest area can withstand
the pressure from agriculture for the full 40 years. Notice, that the policy maker could reduce
the cost of his intervention by fine-tuning the timing of his interventions. To that end he has to
lower the suitability of a cell only the year before it is threatened by agriculture. Thus the
surveillance and other costs could be reduced. Try to find the least costly solution to protect the
forest with a) a fixed suitability determined before the simulation, and b) a suitability that
changes during the simulation. For this last alternative you can use Step instead of Run which
takes the simulation only one year forward each time you click the button7.
Now that you have been able to stop agriculture from taking in our forest, it is interesting to
know where farmers will have found an alternative area to expand their activities. To that end,
use the technique explained in the previous exercise. Run a simulation without policy
intervention and the one where the forested area remains untouched by agriculture. Put the
results on .LOG files and compare them by means of ANALYSE. Notice that the policy
intervention has consequences for the location of agriculture, but that other activities, due to
their links with agriculture, have been affected as well. Possibly the policy intervention has
effects that are even worse than losing the 10 forest cells, and possibly the policy maker has to
decide on additional measures to control agriculture, or any other activity for that matter. It is
up to you to try this out from here.
Exercises with the MOLAND and MURBANDY models
15
Policy exercise d: Expansion of the tourism sector
Aim: The goal of this exercise is that you, as one of the policy-makers of St. Lucia, want to expand
the tourism sector with eco-tourism. In doing this you have to find suitable locations for this
expansion based on the other functions available on St. Lucia and the physical aspects of St. Lucia
Important knowledge for this exercise:
In the PSS SIMLUCIA the cells on the land use map are in 1 of 15 possible Land use states. Land
use states are further subdivided in: Land use functions (there are 8 and they are underlined in the
legend) or Land use features (there are 7 and they are not underlined). The functions can change
over time. The features cannot change over time, however they do have an impact on the allocation
of functions (through the interaction rules).
An example is the function tourism that is attracted to the feature beaches. When running a
simulation you will find that the beaches stay in the same location during the whole simulation,
while tourism cells may change state.
How to start: In this exercise the assumption is made that the tourism sector will expand. So in the
PSS you first have to adapt the external demand graph for tourism in the economics part of the
macro-model to $ 495 million in year 40. It might be most realistic to do this in a gradual way, but
feel free to experiment with different growth functions.
Open SIMLUCIA and open the file LucNoCh.sim;
Adapt the external demand graph for tourism;
First run a simulation without any policy intervention. Where is tourism located after 40 years?
If you, as a policy-maker, would like to expand the tourism sector with eco-tourism (tourists that
are attracted to the forest reserve in the middle of the island), you will have to make some
adaptations. SIMLUCIA provides four types of possible adaptations:
You can adapt the current land use when you open the land use map. You can think of this as a
measure a policy-maker can carry out on the actual land use. In this example you can change
the feature forest reserve into the function forest (and so enabling other functions to come into
this location). In actual planning you could compare this to an area that at first is only open to
forest reserves and restricted for other functions (like tourism) and now will be made available
for other functions;
PS: The choice for changing forest reserve into forest is made because forest is the function
most similar to the feature forest reserve.
You can adapt the suitability map for tourism. In actual practice you can think for example
about zoning regulations to stimulate tourism on certain locations or to construct facilities
tourist would be attracted by (hotels, flat camping grounds, eco-villages, …);
You can adapt the transition rules for tourism on forest reserves. If you look at these rules in
the simulation file LucNoCh.sim, you will find that forest reserves do not have any influence
on tourism. You can adapt this graph by clicking in it. In actual practise you could think about
this as for example a public relations actions from the policy-makers of St. Lucia to attract
tourists to the island that are interested in forest reserves;
You can adapt the road network. At this moment there are no roads going into the forests. So
there is no way for tourists to reach the forest reserve. In SIMLUCIA you can construct roads
just as a policy-maker can decide on the construction of roads. In this exercise it is your task to
make the forest accessible without harming the nature too much.
In this exercise you can try out the impact of these four types of adaptations. See what happens if
you change one or more of the four types. Is one type of adaptation crucial? Or do all adaptations
Exercises with the MOLAND and MURBANDY models
16
have to be carried out to get tourism in or around the forest reserve?8 Try to understand what
happens in the model and how this is related to actual policy-making.
Many more exercises of the kind explained could be tried out with SIMLUCIA. We could have
studied what effects the construction of new roads has on the location of specific land uses, we
could have experimented with measures to stop the expansion of Castries to the North, or to the
South. We could have tried how to divert some of the growth of Castries to the Vieux Fort area,
etc. We hope however that these exercises have made you acquainted with SIMLUCIA to the point
that you can start experimenting on your own.
Remember that the prime role of SIMLUCIA is to give you a better insight in the linked non-linear
dynamics of socio-economic systems and the consequences of growth on a limited resource such as
land. Further to show you how these dynamics could be affected by climate change. SIMLUCIA
will not predict the exact future of St. Lucia. It is much too simple a model to do so. The best it can
is to calculate and visualise what sort of alternative futures are possible and what the role of
different social, economic and spatial actors is in all this. As such it is a formal discussion platform:
it will calculate effects in a consistent and consequent manner. Thus, it should assist in awareness
building and education generally and it should support policy makers and analysts in making
better-informed decisions in particular.
Exercises with the MOLAND and MURBANDY models
17
Exercises with the MOLAND and MURBANDY models
18
Solutions of the exercises
The numbers refer to the footnote marks located in the questions throughout the text.
1. To answer this question look at the land use map, the network map and the elevation map. It
will help you to invoke 3D view of the micro-scale dynamics window.
Natural vegetation can be found in the north-eastern part of the island and almost everywhere
along the coastal area where the precipitation is low and in particular in places where human
interference is minimal. More inland the natural vegetation is not present, rather is replaced by
forests. This is because of the rainfall on the higher, exposed inland area of the island. The
highest peaks of the island are covered with the forest reserve, a protected rain forest. These are
the locations with the highest rainfall, but also where the relief is very unsuited for human
activities, in particular agriculture and where the risk for erosion is very high.
Mangroves can be found along the coastline very near to the salt water, but also in the mouth of
rivers because they need a brackish environment to grow.
Tourism can be found in areas where there are beaches, bays, sea, harbours, and coral reefs and
which are accessible by road.
Rural residential areas are found in the fertile valleys. They appear at higher locations than
urban residential areas, but not all the way up in the mountains. The function rural residential
is often clustered with agriculture, natural vegetation and services.
2. Agriculture is mostly located in the flat and fertile valleys of the island. Higher in the
mountains the land becomes less suitable for agriculture. Physical reasons for this are the steep
slopes, the thin and poor soils, the high volumes of rain, the intensity of the rain storms, the
exposure to the wind, and the lower temperatures. Policy measures will stop farmers to grow
crops in the higher areas, because of the high risks for erosion, land slides and other land
degradation. Also, small islands have limited surfaces for collecting drinking water for their
populations, life-stock and agriculture. On the map you will notice a number of smaller dams
from where drinking water is distributed. The watersheds upstream are closed for human
activities.
3. You can either read the result from the graph, or calculate it from the table. In year 28 the
temperature has increased 1.4 degrees, in year 32 the increase is 1.6 degrees. By taking the
average of these values you can derive that the temperature rise in year 30 is 1.5 degrees.
4. Temperature influences precipitation and precipitation influences agriculture: an increase in
temperature will cause an increase in precipitation. This increase will cause a decrease in
agricultural productivity (for a typical crop). There is also a direct influence of temperature on
agriculture. Opening this graph shows that an increase in temperature causes a decrease in
agricultural production.
5. The total demand for tourism is the external demand for tourism ($ 415.4 million), since all the
money coming into the tourism sector comes from outside St. Lucia. The total demand for
agriculture is the sum of the external demand ($ 194.5 million) and the domestic demand ($
72,96 million). This sum is less than the external demand for tourism, so the tourism sector is
from an economic point of view more important. Note also that the greatest demand is that of
the industrial sector, which has an internal demand of $ 649,49.
6. The forest entirely disappears during the simulation and is replaced by agriculture. The first
forest cell disappears around the third year, and the last is gone after about 35 years. The first
Exercises with the MOLAND and MURBANDY models
19
cells disappear near the road, where the accessibility is highest, since accessibility is important
for farmers.
7. The least costly solution for forest protection without timing (the suitability is determined
before the simulation) is:
Cell
(66,64)
(66,65), (68,65), (69,66)
Rest of forest cells
Suitability
0.3
0.5
0.6
The least costly solution for forest protection with time planning (the suitability is determined
during the simulation) is:
Time step
0
17
20
30
32
34
35
39
Cell
(66,64)
(66,64)
(69,66)
(66,66)
(69,66)
(67,67), (68,65)
(66,64)
(66,65)
Suitability
0.5
0.4
0.6
0.6
0.5
0.6
0.3
0.6
Note: this answer is only valid for a simulation with a certain random factor, so your answer
might differ slightly.
8. You will conclude that it is possible to get tourism cells in the forest reserve if you carry out all
four types of adaptations in a certain location (or locations). If you do not change the feature
forest reserve into the function forest (adaptation of type 1) but do carry out the other types of
adaptations you will see that tourism will place itself around rather than in the forest reserve.
Notice also that there will still be tourism near the beaches and the coral reefs, since these
locations are also interesting for tourists (in the model you can look at the rules for tourism on
beaches and coral reefs, the suitability for tourism at these locations and the road network in
the neighbourhood of these locations).
Exercises with the MOLAND and MURBANDY models
20