1
LOAD REDUCTION
PLANNING TOOL (LRPT) V2
NOV
2010
FINAL GUIDANCE
DOCUMENTATION
A TOOL TO ESTIMATE THE WATER QUALITY BENEFITS OF
PARCEL SCALE RETROFIT PROJECTS IN THE TAHOE BASIN
Load Reduction Planning Tool (LRPT) v 2 Technical and User Guidance Document CONTENTS List of Figures.............................................................................................................................................................. i List of Tables .............................................................................................................................................................. ii Executive Summary ....................................................................................................................................................... 1 1. Introduction ............................................................................................................................................................... 1 2. Key Terms .................................................................................................................................................................. 2 3. General Approach ...................................................................................................................................................... 4 4. Theory and Methodology .......................................................................................................................................... 4 5. LRPT User Guidance ................................................................................................................................................. 17 STEP 1. Specify Parcel Boundaries ........................................................................................................................... 18 STEP 2. Define Scenario and Site Condition ............................................................................................................ 18 STEP 3. Delineate Patch Boundaries and Hydrologic Linkages ................................................................................ 19 STEP 4. Assign Hydrologic Routing Contributions ................................................................................................... 24 STEP 5. Populate LRPT Input Tables and Run Simulation ........................................................................................ 26 STEP 6. Repeat STEPS 2‐5 for All Desired Scenarios ................................................................................................ 30 STEP 7. Compare Runoff and Pollutant Loads ......................................................................................................... 30 STEP 8. Generate LRPT Summary Report ................................................................................................................ 31 6. Programatic Integration........................................................................................................................................... 31 7. LRPT v2 Limitations and Next Steps ......................................................................................................................... 33 8. Acronyms and Glossary ........................................................................................................................................... 35 9. References ............................................................................................................................................................... 38 Appendix A. LRPT v2 Tutorial ....................................................................................................................................... 39 LIST OF FIGURES Figure 1 Simple schematic showing hydrologic routing between two patches .................................................5 Figure 2 Hydrologic routing between three patches ..........................................................................................7 Figure 3 Meteorological grids in Tahoe Basin ....................................................................................................8 Figure 4 Treatment BMP annual runoff coefficients ....................................................................................... 11 Figure 5 LRPT modeling of maintenance influence on BMP C values ............................................................. 13 Figure 6 Site delineation examples .................................................................................................................. 21 Figure 7 Site delineation examples ................................................................................................................. 23 Figure 8 Flow percentage examples ................................................................................................................ 25 Figure 9 Pre‐retrofit site schematic and map .................................................................................................. 49 Figure 10 Pre‐retrofit site patch delineation ..................................................................................................... 50 Figure 11 Pre‐retrofit site flow routing ............................................................................................................. 51 Final: November 2010 p. i Load Reduction Planning Tool (LRPT) v 2 Figure 12 Technical and User Guidance Document Post‐retrofit site patch delineation and flow routing ........................................................................ 52 LIST OF TABLES Table ES.1 Steps implemented by user to complete LRPT .....................................................................................1 Table 1 Surface types and annual runoff coefficients for urban surfaces .........................................................6 Table 2 Adjustments to initial C values for pervious patch types based on qn .................................................8 Table 3 Definitions of maintenance commitment categories ........................................................................ 15 Table 4 Maintenance commitment level adjustment factors (Yx) applied initial C values ............................... 15 Table 5 CRCs for baseline condition and Tier 1 improvements for urban land use types.............................. 16 Table 6 Steps implemented by user to complete LRPT .................................................................................. 17 Final: November 2010 p. ii Load Reduction Planning Tool (LRPT) v 2 Technical and User Guidance Document EXECUTIVE SUMMARY The Load Reduction Planning Tool (LRPT)1 estimates the potential water quality pollutant load reductions associated with the proposed parcel‐scale implementation of Best Management Practices (BMPs), including redevelopment projects, private parcel retrofits and single family BMP implementation in the Tahoe Basin. We present a new version of the tool (LRPTv2) as a visual basic application for Microsoft Excel (2007 version) that uses site specific data created by the user to reflect the spatial heterogeneity of surfaces in combination with a simple mathematical model that routes runoff across a parcel to estimate the average annual runoff from the site. LRPTv2 includes a function to estimate performance decay of Treatment BMPs over time as a function of maintenance commitment. The LRPT has been designed to be consistent and compatible with the Pollutant Load Reduction Model (PLRM) the Best Management Practices Maintenance Rapid Assessment Methodology (BMP RAM) and other Tahoe Basin stormwater tools to the extent practical. This document provides a description of the technical approach and methodology for LRPT calculations (Section 4), detailed user guidance (Section 5), and recommendations for future programmatic integration (Section 6). An LRPT user follows a series of 8 STEPS to estimate the water quality benefits of parcel scale retrofit and improvement actions in the Tahoe Basin (Table ES1). The LRPT requires the user to spatially delineate the parcel(s) of interest based on runoff characteristics and define the associated hydrologic routing on the parcel for each site scenario of interest. The user populates the user‐friendly LRPT spreadsheet with information created during STEPs 1‐4 to generate runoff volume and load reduction estimates for 6 pollutants of concern expected to be generated and transported offsite for each pre‐retrofit; post‐retrofit scenario pair. LRPT outputs can inform site retrofit design alternatives and Treatment BMP maintenance commitment levels to maximize the expected water quality benefits of parcel scale improvements. LRPT STEP STEP 1 STEP 2 STEP 3 STEP 4 STEP 5 STEP 6 STEP 7 STEP 8 Description
Specify parcel boundaries
Define scenario and site conditions
Delineate patch boundaries and hydrologic linkages
Assign hydrologic routing contributions
Populate LRPT spreadsheet and run simulation
Repeat steps 2 –5 for all desired scenarios
Compare runoff and pollutant loads
Generate LRPT summary report
Table ES1. Steps implemented by user to complete LRPT. 1. INTRODUCTION The Load Reduction Planning Tool (LRPT) provides a way to estimate reductions in potential water quality pollutant loading associated with the proposed parcel‐scale implementation of Best Management Practices (BMPs), including redevelopment projects, private parcel retrofits and single family BMP implementation in the Lake Tahoe Basin. The LRPT could be used early in the planning process by planners, developers and/or regulators to identify alternatives and design modifications to reduce pollutant loads generated from a site. The LRPT methodology is applicable to a much smaller spatial scale than the Pollutant Load Reduction Model (PLRM) and it is not intended to replace PLRM or other water quality planning tools approved by Lahontan Regional Water Quality Control Board (RWQCB), the TRPA, or the Nevada Division of Environmental Protection (NDEP). Rather, LRPT provides a 1
First use of glossary (Section 8) terms are bolded.
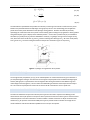
Final November 2010 p. 1 of 52 Load Reduction Planning Tool (LRPT) v 2 Technical and User Guidance Document complementary approach to estimate the benefits of water quality improvements implemented on the parcel scale that can be used in situations where other tools are less appropriate. A key component of any parcel‐scale improvement is the strategic placement of Treatment Best Management Practices (BMPs) to optimize hydrologic routing from impervious to pervious surfaces onsite. As outlined in the TRPA Best Management Practices (http://www.tahoebmp.org), a primary strategy to minimize runoff from residential private parcels includes placement and maintenance of highly permeable surface types (infiltration features, biofilters, porous pavement, etc.) to capture and infiltrate runoff volumes generated from impervious surfaces within the parcel. Onsite infiltration of runoff reduces water volumes and pollutant loads to the local stormwater infrastructure. The TRPA requires all developed properties to install BMPs that help improve water quality by reducing volumes generated from the site, reduce soil erosion and capturing polluted water before it enters Lake Tahoe. The LRPT requires the user to spatially delineate the parcel(s) of interest based on surface characteristics and define the associated hydrologic routing on the parcel in a format that can be directly entered into the LRPT spreadsheet tool. LRPT estimates the average annual runoff generated from the site using a simple disaggregation of the surface and stepwise routing across the parcel that includes performance decay of Treatment BMPs over time as a function of the maintenance commitment specified by the user. Average annual runoff estimates are combined with characteristic runoff concentrations (CRCs) for predominant land use types and expected condition to estimate the pollutant loads generated from the site for pre‐ and post‐redevelopment conditions. The pollutants of concern include (in order of priority) fine sediment particles (FSP) (<16 µm), dissolved phosphorous (DP), total phosphorous (TP), total suspended sediment (TSS), dissolved inorganic nitrogen (DN), and total nitrogen (TN). All pollutants are tracked and reported on an average annual mass basis. LRPT outputs include four critical elements for each set of pre‐ and post‐redevelopment scenarios: (1) average annual runoff volume reduction (ft3/yr), (2) average annual pollutant load reductions (kg/yr), and (3) user generated site diagrams illustrating the hydrologic routing through the site for both pre‐ and post‐redevelopment scenarios. The initial version of the LRPT was completed by 2NDNATURE, LLC with Army Corps of Engineers funding in March 2009 and outlined the detailed step by step methodology for a user to follow to make load reduction calculations. Using joint funding from the Army Corps of Engineers and the Tahoe Regional Planning Agency (TRPA), a number of technical improvements to the methodology and implementation approach were made and incorporated into a visual basic application, operated from a user‐friendly MS Excel spreadsheet to automate load reduction calculations. This is the technical and user guidance document for the LRPTv2. 2. KEY TERMS The following key terms are used throughout this document. A complete glossary and acronym list are included as Section 8. Load Reduction Planning Tool (LRPT) version 2: A Microsoft Excel spreadsheet tool written in Microsoft Visual Basic for Applications (VBA) to estimate the potential pollutant load reductions from BMP retrofit projects in Lake Tahoe Basin on a parcel or multiple parcel scale. The LRPT terminology and methodology is consistent with the Pollutant Load Reduction Model (PLRM; nhc et al. 2009), the BMP Maintenance Rapid Assessment Methodology (BMP RAM; 2NDNATURE et al. 2009) and other Lake Tahoe stormwater management tools. Hydrologic routing: Anticipated movement of stormwater runoff through the site. Volumes are routed across the parcel by sequential patches along topographic and hydrologic gradients from high to low. Final November 2010 p. 2 of 52 Load Reduction Planning Tool (LRPT) v 2 Technical and User Guidance Document Patch: Patches are used to spatially delineate the site for hydrologic routing. A patch can contain multiple adjacent surface types that possess similar runoff characteristics to simplify site geometry. Patches constitute the physical area within the site where runoff calculations are made. The sum of the individual patch areas equates to the total site acreage. Patches are characterized by the relative infiltration capability of the surface, as represented by an average annual runoff coefficient (C). Source/Receiving patch: Terminology used with respect to hydrologic routing. Patches contributing runoff to the site are termed source patches, whereas those accepting runoff from source patches are termed receiving patches. By definition, all patches are source patches (they all receive rainfall and discharge some fraction as runoff). Not all patches are receiving patches. Annual runoff coefficient (C): A value between zero and one that accounts for the fraction of precipitation and contributed runoff that is unable to infiltrate or evaporate from a given surface type on an average annual basis and therefore produces stormwater runoff. Impervious surface types have high annual runoff coefficients, whereas pervious surface types have relatively lower annual runoff coefficients. Treatment BMPs in LRPT are assigned annual runoff coefficients calculated based on their storage capacity, where they are located in the Basin and the maintenance commitment for all Treatment BMPs at the site as defined by the user. Offsite: The user must define a common outfall where the runoff generated from the site will accumulate and LRPT calculations are summed. Typically parcel outfalls are not specific locations but rather the downslope boundary (e.g., the north border of the parcel) and termed in LRPT as “offsite”. Offsite in LRPT is analogous to an outfall as defined by PLRM and the point at which average annual pollutant loads are estimated. Treatment BMPs: Constructed BMPs that accept, attenuate, and treat urban stormwater. Treatment BMPs are implemented to reduce pollutant loads in stormwater by either removing pollutants and/or by reducing surface water volumes. LRPT focuses on three different types of Treatment BMPs that are typically installed on commercial or residential parcels to capture and retain stormwater to reduce runoff transported off site; infiltration features, porous pavement, and biofilters (see Table 1 and glossary for more details). Treatment BMP condition: Treatment BMPs are intended to provide a sink for urban pollutant loads, and a Treatment BMP condition is defined as a continuum of the pollutant load removal capability of a Treatment BMP. Treatment BMP condition is considered to be at its initial or benchmark condition following installation and/or after adequate maintenance. As pollutant loading and treatment occurs during subsequent storm events, the condition of a Treatment BMP gradually declines (2NDNATURE et al. 2009). LRPT quantitatively incorporates the expected decay in water quality performance of the Treatment BMPs as a function of maintenance frequency identified by the user. Pollutants of concern: These are fine sediment particles (FSP) (<16 µm), dissolved phosphorous (DP), total phosphorous (TP), total suspended sediment (TSS), dissolved inorganic nitrogen (DN), and total nitrogen (TN). Land use condition: Land use condition is defined by the LRPT as the average annual state of a land use relative to downslope water quality. A wide range of pollutant source controls are implemented on urban land uses with the intention of improving land use condition and reducing the pollutant generation risk. Examples of pollutant source control actions on private parcels include fertilizer application reductions and erosion control actions such as vegetation planting and maintenance, bank stabilization, or terracing. LRPT includes two potential land use conditions, baseline and Tier 1. Characteristic runoff concentration (CRC): Lake Tahoe stormwater pollutant loading models (PLRM and LRPT) express the condition of an urban land use quantitatively as a characteristic runoff concentration (CRC) for pollutants of concern for lake clarity. A CRC is a representative average annual concentration for a pollutant of Final November 2010 p. 3 of 52 Load Reduction Planning Tool (LRPT) v 2 Technical and User Guidance Document concern in stormwater runoff from a specific urban land use and its associated condition. In the LRPT, the parcel CRC is combined with the average annual runoff generated from the site to provide an estimate of average annual pollutant load for each pollutant of concern. The land use types included in LRPT are single family residential (SFR), multi‐family residential (MFR) and commercial (CICU). 3. GENERAL APPROACH The user calculates average annual loads for the site for both baseline conditions (pre‐redevelopment) and planned improved (post‐redevelopment) conditions for the six Lake Tahoe pollutants of concern. Characteristic runoff concentrations (CRCs) are assigned based on the user’s selection of land use type and land use condition. The average annual pollutant load is calculated (with appropriate unit conversion factors not shown) as: Average Annual Pollutant Load (kg/yr) = Characteristic Runoff Concentration [CRC] (mg/L) × Average Annual Runoff (ft3/yr) (Eq. 1) The estimated load reduction as a result of improvements is calculated as: Estimated Load Reduction (kg/yr) = Baseline Average Annual Pollutant Load (kg/yr) ‐ Improved Average Annual Pollutant Load (kg/yr) (Eq. 2) 4. THEORY AND METHODOLOGY The LRPT calculates average annual pollutant loads for 6 pollutants of concern by iteratively accounting the hydrologic routing of runoff across one or more parcels based on average annual precipitation, site characteristics and site mapping details input by the user. Annual runoff coefficients are assigned to estimate the fraction of runoff retained on patches of different permeability and treatment capacity on an average annual basis. LRPT assigns the initial runoff coefficient for each Treatment BMP as a function of storage capacity and the hydrologic routing characteristics of the site for the benchmark condition. The annual runoff coefficient for each Treatment BMP is determined based on the relative maintenance commitment as defined by the user for the site. The annual runoff volumes for an 18 year time interval are integrated with the appropriate CRCs to estimate average annual pollutant loads for pre and post‐retrofit scenarios. The difference in pollutant loads generated from the site between pre and a post‐retrofit scenario is the estimated load reduction resulting from implementation of BMPs on the site. 4.1 HYDROLOGIC ROUTING The LRPT user delineates the parcel into discrete patches, each with a unique runoff coefficient (Table 1). The annual runoff coefficient defines the fraction of water introduced to each patch that is unable to infiltrate or evaporate, expressed as a value between 0 – 1 (see Table 1). Table 1 provides initial runoff coefficients that may adjusted for specific patches within LRPT based on sizing or site maintenance commitment to better represent average annual runoff coefficients. Stormwater runoff from a patch is controlled by three distinct components: the rate at which water accumulates on the patch from direct rainfall and contributing patches, the area of the patch, and the annual runoff coefficient of the patch. All patches accumulate water from direct precipitation. Receiving patches also accumulate water that runs off adjacent patches as defined through hydrologic routing in the LRPT. Note: LRPT assumes no runoff is generated from adjacent parcels (i.e., offsite upgradient) and routed to the site. Water (i.e., mass) is conserved as runoff is routed through the parcel and across patches. By defining the hydrologic routing of a parcel, Treatment BMPs can be strategically placed to retain runoff generated from patches with relatively high annual runoff coefficients (see Table 1). Final November 2010 p. 4 of 52 Load Reduction Planning Tool (LRPT) v 2 Technical and User Guidance Document The annual runoff generated from patch n (Qn; e.g., ft3/year) is calculated as: Qn = Cn (P + qn ) An (Eq. 3a) (Eq. 3b) ∑fQ
i
qn =
i
i
An
Where: Cn is the annual runoff coefficient for patch n (unitless); P is the precipitation rate (e.g., ft/year); qn is incoming runoff from contributing source patches (e.g., ft/year); An is the area of patch n (e.g., ft2); fi is the fraction of runoff that flows from source patch i to the receiving patch n (unitless); Qi is the annual runoff from each contributing source patch i (e.g., ft3/year). Equation 3a is used to calculate the total volume of water generated from patch n by summing the amount of direct precipitation (P) and the amount of runoff contributed from each adjacent source patch (qn). The contributed volume is distributed evenly over the patch area (An) and adjusted by the annual runoff coefficient (Cn) to estimate the volume generated and routed downslope by patch n. The LRPT iteratively accounts for water flow from source patches to receiving patches per the hydrologic routing defined by the user, and ultimately calculates the amount of runoff discharged from the parcel. An example of hydrologic routing between patches is shown schematically in Figure 1. Patch A2 corresponds to an impervious surface (roof of a house) surrounded by pervious patch A1 (turf). Both patches A1 and A2 receive precipitation at the same rate (P). Runoff generated from patch A2 is converted to a contributing rate (q2‐1), 100% of which is routed to patch A1. Runoff (Q1) from patch A1 is determined by summing the precipitation (P) and contributing rate (q2‐1) and multiplying by the area and annual runoff coefficient for patch A1: Figure 1. Simple schematic showing hydrologic routing between two patches. Final November 2010 p. 5 of 52 Load Reduction Planning Tool (LRPT) v 2 Technical and User Guidance Document Patch Type Impervious (IM) Severely compacted pervious (SP) Compacted pervious (CP) Maintained pervious (MP) Undeveloped (UN) Description/Examples Surface with very little infiltration capacity. Impervious surfaces include concrete or asphalt such as paved driveway, walkway, parking area, courtyard, sidewalk, etc. Walkway, sidewalk, courtyard, driveway, etc., made of brick, cobblestone or other hard surface. Typical roof or deck surface. A pervious surface with very poor infiltration ability. Examples include unpaved parking area, driveway, road shoulder, etc. Areas with high automobile and/or human disturbance. Drainage is moderate to poor, high human disturbance and poor infiltration ability. Poorly maintained pervious areas with high human or animal foot traffic and associated soil compaction, e.g. foot paths surrounding buildings. Intensely used areas of ballfield such as a baseball diamond infield or other compacted park or playground surfaces. 0.82 0.50 0.25 Landscaped and/or other maintained vegetated areas that have moderate to low human foot disturbance or traffic. Maintained lawn surface where human foot traffic may be high but surface is well maintained, e.g., golf course, park, lawn, ballfield. Maintained pervious topography is at grade with surrounding areas and not constructed to provide storage of runoff routed from surrounding surfaces. 0.15 Undeveloped areas with natural vegetation pervious surface subjected to minimal maintenance and little to no localized foot traffic. 0.04 Treatment BMP Type Other Names Description Initial Runoff Coefficient (C) Dry Well, Infiltration Trench, Roof Drip‐Line, Rock‐Lined Channel, etc. Land surface modified to sustain maximum infiltration rates, typically consisting of vertical excavation of native soils and filling with coarse drain rock, prefabricated infiltration units or other highly permeable material. Infiltration features are implemented to reduce volumes generated from adjacent impervious surfaces. Porous pavement (PP) Porous asphalt, Pervious concrete, Grass pavers, Modular blocks, etc. A durable, pervious surface overlaying a crushed stone base that stores rainwater and allows it to infiltrate into the underlying soil. Porous pavement includes an underlying reservoir to increase infiltration rates. Local stormwater is typically not routed to a porous pavement surface, but rather constructed to minimize the volume of stormwater generated and routed downgradient from a previously impervious surface. Footprint can vary but is typically used to replace parking lots or other impervious surfaces. Varies based on underlying reservoir depth and void space and MET grid. Biofilter (BF) Grass swale, Grass filter strips, Rain gardens, Vegetated buffer strips, Bioslopes, etc. A pervious substrate with dense native and/or maintained vegetation coverage (>80%). Biofilter designs, such as rain gardens, can augment depression storage to capture, detain, evapo‐transpire and infiltrate urban runoff. Nutrient concentration reductions occur by fixing nutrients via biological processes. The footprint of these surface types are larger than typical infiltration BMPs. Biofilters constructed with depressional storage must include a relatively shallow slope. Without depression storage = 0.15 With depression storage; varies based on storage and MET grid. Infiltration feature (IF) Treatment BMPs Initial Runoff Coefficient (C) Varies based on storage and MET grid. Table 1. Surface types and initial runoff coefficients for urban surfaces, adapted from Caltrans 2003; Dunne and Leopold 1978; Davis and McCuen 2005 and verified using PLRM simulations on a 1 acre pervious surface with a range of hydraulic conductivity values. Treatment BMP types and descriptions are adapted from BMP RAM definitions (2NDNATURE et al. 2009). Initial annual runoff coefficients for Treatment BMP types are calculated by LRPT based on sizing and MET grid information provided by user. The annual runoff coefficients used by LRPT calculations for pervious surfaces are adjusted for relatively small patches and Treatment BMP C values are adjusted based on user maintenance commitment. Final November 2010 p. 6 of 52 Load Reduction Planning Tool (LRPT) v 2 Q2 = C2 (P )A2
q2−1 =
Technical and User Guidance Document (Eq. 4a) f × Q2
A1
(Eq. 4b) Q1 = C1 (P + q2−1 )A1
(Eq. 4c)
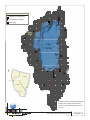
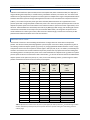
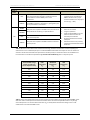
The LRPT MS Excel spreadsheet tool provides the necessary accounting of stormwater runoff across the parcel based on the patch delineation and hydrologic routing input by the user. The methodology can be applied to parcels with various patch distributions and hydrologic routing patterns. Runoff is calculated by iteratively quantifying the runoff from each source patch to each receiving patch working from up‐gradient to down‐gradient along the flow path. Figure 2 displays three individual patches – a house with a pitched roof (A3) surrounded on two sides by a roof drip line (A2), which is embedded in a lawn (A1). Hydrologic routing at this site begins on the roof, where 50% of the runoff from A3 enters A2 and the remaining 50% discharges to A1. All of the runoff (100%) from A2 flows to A1. The total runoff generated from the parcel as outlined in Figure 2 is equal to Q1. Figure 2. Hydrologic routing between three patches. 4.2 PRECIPITATION (P) The average annual precipitation (P; in/yr) at the redevelopment site is determined from long‐term datasets or pre‐compiled regional averages. The LRPT uses the average annual precipitation for the PLRM metrological grid stations (MET grid) for 7 representative zones throughout Lake Tahoe generated from the SNOTEL long‐term meteorological stations (Figure 3). The user selects the PLRM MET grid station that best represents the subject site. The same annual precipitation value must be used for all LRPT simulations run for a specific site. 4.3 ANNUAL RUNOFF COEFFICIENTS (C) The LRPT user delineates the parcel into discrete patch types that are used to represent the differing runoff characteristics that may be present on the parcel. Table 1 presents the common surface types on commercial and residential parcels in the Lake Tahoe Basin. The LRPT includes a number of functions to adjust the initial runoff coefficients (Ci) for pervious and Treatment BMP patch types to provide realistic estimates of average annual runoff coefficients and volume reduction capabilities over an 18 year time period. Final November 2010 p. 7 of 52 !
(
Legend
PLRM Meteorological Grid
SnoTel Weather Stations
Urban Areas
#532
#817
!
(
!
(
!
(
#238
Lake
Tahoe
#903
!
(
#672
!
(
#847
!
(
NEVADA
Lake Tahoe
San Francisco
CALIFORNIA
!
(
!
(
Los Angeles
LRPT user selects the PLRM meterological
grid that best represents the climatic
conditions of the redevelopment site of
interest.
Lake tahoe PLRM Meteorological grid
FIGURE 3
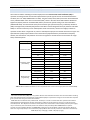
Load Reduction Planning Tool (LRPT) v 2 Technical and User Guidance Document RUNOFF COEFFICIENTS Published runoff coefficients (Caltrans 2003; Dunne and Leopold 1978; Davis and McCuen 2005) are displayed as ranges indicating their subjectivity to rainfall intensity, antecedent conditions, and surface area. The initial runoff coefficients for typical impervious and pervious surface types were adapted from ranges in the published literature and were selected to represent average hydrological characteristics on an annual basis for sub‐parcel sized areas (Table 1). The C values for pervious patch types were verified by PLRM simulations of a hypothetical one acre pervious parcel with a range of hydraulic conductivity values. The C values for specific pervious patches in LRPT are adjusted if a specific patch is too small relative to the volumes routed to it (see Pervious Patch Types below). The C values for Treatment BMPs are calculated by LRPT and vary by BMP type, BMP storage, and the MET grid and user maintenance commitment for the subject site (see Treatment BMPs below). The assignment of specific annual runoff coefficients for surface types in LRPT, rather than user‐selected ranges, increases the consistency of LRPT pollutant load reduction estimates across users and scenarios. PERVIOUS PATCH TYPES LRPT includes a function to avoid modeling the infiltration of a large volume of water within small pervious patches. The volume of water potentially applied to a pervious patch is the sum of direct precipitation (P) plus all contributing runoff from adjacent patches (qn) (see Eq. 3a). Using hypothetical PLRM simulations to route a range of impervious areas to the various pervious surfaces types in LRPT (UN, MP, CP, SP; see Table 1) a relationship was created to increase the annual runoff coefficient of pervious patches that may experience excessive loading from contributing patches. The LRPT pervious patch annual runoff coefficients are adjusted as the qn loaded to a specific pervious patch increases as summarized in Table 2. Remember, qn is the ratio of the total volume contributed from adjacent patches to the patch area (see Eq. 3a). Thus, for the same inflowing volume, qn will be larger for smaller patches and therefore accounts for the size of the pervious patch. qn Undeveloped Maintained pervious Compacted Pervious Severely compacted pervious (ft/yr) (UN) C= 0.04 (MP) C=0.15 (CP) C=0.25 (SP) C=0.50 0.00 0.04 0.15 0.25 0.50 0.25 0.12 0.24 0.34 0.59 0.50 0.21 0.32 0.42 0.67 0.75 0.30 0.41 0.51 0.76 1.00 0.38 0.50 0.59 0.84 1.25 0.47 0.58 0.68 0.93 1.50 0.55 0.67 0.77 1.00 1.75 0.64 0.75 0.85 1.00 2.00 0.73 0.84 0.94 1.00 2.25 0.81 0.93 1.00 1.00 2.50 0.90 1.00 1.00 1.00 2.75 0.98 1.00 1.00 1.00 3.00 1.00 1.00 1.00 1.00 Table 2. Adjustments to initial C values for pervious patch types (see Table 1) based on qn to eliminate large volumes of water infiltrated by relatively small pervious patches where the hydraulic loading from contributing patches is relatively large. Final November 2010 p. 9 of 52 Load Reduction Planning Tool (LRPT) v 2 Technical and User Guidance Document TREATMENT BMPS The Treatment BMP types, definitions and descriptions relevant to the LRPT are provided in Table 1. Based on multiple PLRM simulations of the same‐sized Treatment BMP located in different locations within the Tahoe Basin (i.e., using different meteorological grids), it was determined that climatic conditions play a role in the runoff capture and treatment capability of an infiltrating BMP. The initial runoff coefficient values assigned by LRPT use an empirical relationship between the Treatment BMP storage capacity and meteorological and soil conditions as unique by each MET grid (Figure 4). These relationships were generated from multiple PLRM simulations for Treatment BMPs sized for a range of storage capacities (0.01 – 2 inches of runoff) for 7 representative metrological grids within the Lake Tahoe urban areas. The average annual amount of runoff generated from a Treatment BMP in LRPT is a function of storage (inches), MET grid of the site, and the user’s commitment to maintenance. Infiltration Features and Biofilters The capacity sizing or storage for infiltration features (IF) and biofilters (BF) that are designed with detention storage is determined by Eq. 5 by the user (www.trpabmp.org). Infiltration Feature and Biofilter Storage (inches rainfall) = (Eq. 5) {(Design Volume of Infiltration Facility [ft3]) / (Source Impervious Area [ft2])} *(12 [inches/feet]) Infiltration features are typically sized using Eq. 5 with the recommended design standard in Lake Tahoe to retain 1 inch of rainfall generated from the source impervious area. Similarly, annual runoff coefficients for biofilters constructed to provide depressional storage and infiltrate volumes are determined based on the storage of each biofilter (Eq. 5). Onsite biofilters that are not constructed to provide surface water storage to detain stormwater are assigned an initial C value of 0.15, the same as maintained pervious patch types (see Table 1). The LRPT assumes that the treatment capacity of each Treatment BMP included has been adequately designed to meet or exceed the storage (inches of rainfall) claimed by the user. The users should download the Calculation Spreadsheet available at www.trpabmp.org to calculate storage properly and ensure the treatment capacity (ft3) of each Treatment BMP is properly sized and exceeds the contributing runoff (ft3) from the source impervious area. Porous Pavement The ability of porous pavement to store and infiltrate runoff is controlled by the vertical reservoir depth and void space of material beneath the surface. Rather than the user determining the storage in inches of runoff for porous pavement, the LRPT calculates the storage for each porous pavement patch independently as a function of porous pavement vertical reservoir depth and void space as provided by the user (Eq. 6). PP Sn (in) = Zn (in) * VSn (%) (Eq. 6) Where PP Sn is the porous pavement storage (in), Zn is the vertical reservoir depth (in) and VSn is the void space of the reservoir beneath the surface (%) as input by the user. Final November 2010 p. 10 of 52 1.00
Met Grid 672 (CSLT South Y)
0.90
Met Grid 238 (West Shore)
Annual runoff coefficient (C)
0.80
Met Grid 204 (Tahoe City)
0.70
Met Grid 532 (Kings Beach)
0.60
Met Grid 817 (Incline Village)
0.50
Met Grid 847 (CSLT Stateline)
Met Grid 903 (East Shore)
0.40
0.30
0.20
0.10
0.00
0.00
0.20
0.40
0.60
0.80
1.00
1.20
1.40
1.60
1.80
2.00
Treatment BMP storage (inches of runoff from contributing impervious area)
Treatment BMP annual runoff coefficients (C) determined by PLRM simulations of hypothetical
Treatment BMPs based on TRPA BMP sizing criteria (www.trpabmp.org) for seven meteorological grids
representative of Lake Tahoe urban areas.
Treatment bmp annual runoff coefficient as
function of storage And meteorological grid
FIGURE 4
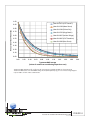
Load Reduction Planning Tool (LRPT) v 2 Technical and User Guidance Document 4.4 BMP MAINTENANCE COMMITMENT (Y) Treatment BMPs are intended to provide a sink for urban pollutant loads, and Treatment BMP condition is defined as a continuum of the pollutant load removal capability of a Treatment BMP. A Treatment BMP is considered to be at benchmark condition following installation and/or after adequate maintenance (2NDNATURE et al. 2009). It is known that some level of maintenance is required to maintain Treatment BMP performance over time, and devoid of maintenance Treatment BMPs will approach non‐functional conditions. Therefore, the initial annual C value for each Treatment BMP is adjusted in LRPT to represent an average annual C value based on the users defined level of maintenance commitment for the site. MAINTENANCE IMPACTS ON TREATMENT BMP PERFORMANCE It is assumed that adequate maintenance requires frequent observations and simple improvements to ensure BMP conveyance is operating (i.e. the BMP is actually getting water during runoff events) and the BMP inlets/outlets and surface are free of pine needles and other debris. Overtime Treatment BMPs that rely upon infiltration are gradually clogged as pollutants, sediment, and other small grained material are introduced and accumulate in the vertical pore spaces that control infiltration rates and treatment capacity. The rate of performance decline of a specific Treatment BMP is assumed to depend upon the runoff volume contributed to its footprint (qn) and the relative sediment loading rate of infiltrated volumes to the Treatment BMPs. These two factors are presumed to dictate the rate of infiltration decline caused from clogging and occlusion of the Treatment BMP. While the concept of decreased infiltration capability of a Treatment BMP is well accepted, the actual quantification of the rate of decay or algorithms that relate the contributing volumes and sediment loading rates are very poorly understood. It is also assumed that frequent inspections and regular maintenance will reduce the rate of performance decline, and the implementation of extensive maintenance actions will restore infiltration, capacity and overall Treatment BMP performance to initial (i.e. benchmark) condition. Thus, over time, Treatment BMP runoff coefficients are expected to approximate the curves illustrated by solid lines in Figure 5a. However, there is a limited amount of existing knowledge and data available to quantify the cyclic decline and restoration of performance represented by the solid lines in Figure 5a or the identify the most sensitive factors driving the rate of increase of runoff coefficients. In addition, it is known that the appropriate maintenance actions and frequency for each Treatment BMP on a site will vary based on the factors contributing to performance decline inherent to a specific BMP. While acknowledging the limitations stated above, incorporation of Treatment BMP maintenance into the LRPT estimation is a priority to highlight the importance of these actions to sustain water quality improvements over time. Therefore, the LRPTv2 utilizes a simplified site based approach and applies a number of reasonable assumptions to estimate average annual runoff coefficients over a long time period based on the relative maintenance commitment specified by the user, represented by the dotted lines in Figure 5a. It is suspected that future research will improve our ability to quantify performance decay and recommend reasonable maintenance schedules for Treatment BMPs. LRPT MODELING OF TREATMENT BMP MAINTENANCE In order to estimate the influence maintenance actions and associated frequency has on Treatment BMPs in LRPT, the PLRM simulations of hypothetical Treatment BMPs of varying storage were used to translate a decline in the average annual infiltration rate into an increasing annual runoff coefficient. Sequential reductions in the benchmark infiltration rate of 0.5 in/hr were modeled using PLRM and SWMM to determine the corresponding increase in the annual runoff coefficient for the range of Treatment BMP storage values located within MET grid 847 (Figure 5b). Based on the results presented in Figure 5b, the development team created 3 maintenance Final November 2010 p. 12 of 52 Average annual runoff coefficient
maximum runoff coefficient
1.0
extensive
maintenance
action
Clow
Cmoderate
range of
C for HIGH
maintenance
effort
Chigh
initial runoff coefficient (i.e. benchmark)
Time since BMP construction (years)
HIGH maintenance effort
BMP C value over time
Average annual C value
MODERATE maintenance effort
BMP C value over time
Average annual C value
LOW maintenance effort
BMP C value over time
Average annual C value
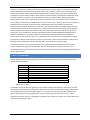
Figure 5a. Expected evolution of runoff coefficient as a BMP ages (solid lines). The runoff coefficient (C) can be reset
by performing extensive maintenance actions on the BMP to return its performance back to benchmark conditions and
more intensive maintenance results in a lower range of C values over time. The LRPT categories of maintenance (high,
moderate and low) are used to represent the expected relative average annual runoff coefficient, with the knowledge
that the actual runoff coefficient varies, but the pattern is predictable, over time.
1.00
initial infiltration rate (0.5 in/hr)
Annual runoff coefficient (C)
0.90
25% reduction of infiltration rate (0.38in/hr)
0.80
50% reduction of infiltration rate (0.25 in/hr) 0.70
75% reduction of infiltration rate (0.13 in/hr)
0.60
0.50
0.40
0.30
0.20
0.10
0.00
0.00
0.25
0.50
0.75
1.00
1.25
1.50
1.75
2.00
Treatment BMP storage
(inches of runoff from contributing impervious area)
Figure 5b. PLRM and SWMM estimates of the annual runoff coefficient increase as a result of 25%, 50% and 75%
decline in infiltration rates of a hypothetical Treatment BMP given a range of storage located in MET grid 847 (East South
Lake Tahoe). The relative C reductions obtained from this analysis of MET grid 847 are used to extrapolate expected
average annual C values for Treatment BMPs in other MET Grids based on maintenance commitment (See Table 4).
LRPT Modeling of Maintenance
influence on BMP C values
FIGURE 5
Load Reduction Planning Tool (LRPT) v 2 Technical and User Guidance Document effort commitment levels (high, moderate and low) for the overall site in question. Table 3 provides the definitions and actions assumed to be performed to meet the stated maintenance level of effort for each category. Based on best professional judgment, high, moderate and low maintenance commitments have been linked to a 25%, 50% and 75% decline in the initial infiltration rates, respectively, on average over an 18 year time period. The results from Figure 5b were extrapolated to other MET grids by applying the adjustment factors to the initial C values of a Treatment BMP as presented in Table 4. LRPT integrates the maintenance commitment and the associated factor adjustment (Y; Table X) and the initial runoff coefficient for each Treatment BMP using Equation 7. Cn = Ci *Yx (Eq. 7) Where: Cn is the annual runoff coefficient for Treatment BMPn (unitless); Ci is the initial runoff coefficient for Treatment BMPn based on storage and MET grid (unitless); Yx is the factor adjustment to Ci based on user’s maintenance commitment (unitless) The LRPT user is required to select one of three maintenance commitment levels of effort to perform Treatment BMP inspections and conduct extensive maintenance actions as required based on observational and/or BMP RAM results (Table 3). Based on the user input, the average annual C values for all of the Treatment BMPs at the site are adjusted to reflect the maintenance commitment using equation 7, with higher C values corresponding to a lower overall maintenance commitment. The maintenance frequency linkage to the absolute decline in infiltration rates are based on hypotheses and best professional judgment in LRPT, and these estimates should be quantitatively improved over time. Infiltration BMP Maintenance Commitment Level of Effort Seasonal commitments Extensive Maintenance Frequency SPRING Frequent inspections to ensure BMP conveyance is operating (i.e. BMP is getting water) and free of pine needles or other debris. SUMMER Complete BMP RAM evaluations annually. If BMP infiltration rate or other treatment process appears to have declined beyond acceptable levels, perform extensive maintenance to restore function prior to Oct 1. FALL Prior to October 1 and first significant winter rain, rake and remove all leaves, pine needles or other debris. Continue as necessary to ensure minimal debris at surface of BMP prior to snow accumulation. WINTER As snow accumulation recedes, frequent inspections to ensure BMP conveyance is operating (i.e. getting water) and free of pine needles or other debris. SPRING At least one inspection per spring to ensure BMP conveyance is operating (i.e. BMP is getting water) and free of pine needles or other debris. HIGH MODERATE SUMMER Final November 2010 Complete BMP RAM evaluations every 2‐3 years. If BMP infiltration rate or other treatment process appears to have declined beyond acceptable levels extensive maintenance actions are performed to restore function. HIGH maintenance commitment requires: •
Adequate explicit allocation of resources. •
Documentation of maintenance plan that details extensive maintenance actions and schedules for individual treatment BMPs. •
Extensive maintenance is performed when BMP condition is fair and before failure. •
Roles of responsible parties are outlined. MODERATE maintenance commitment requires: •
Some explicit resource allocations. •
Intermittent evaluations of treatment BMPs. •
Treatment BMPs may underperform or fail for short periods. p. 14 of 52 Load Reduction Planning Tool (LRPT) v 2 Technical and User Guidance Document Infiltration BMP Maintenance Commitment Level of Effort Seasonal commitments FALL WINTER SPRING SUMMER Low FALL WINTER Extensive Maintenance Frequency Rake and remove all leaves, pine needles or other debris when resources permit. Continue as necessary to ensure minimal debris at surface of BMP prior to snow accumulation. As snow accumulation recedes, at least one inspection to ensure BMP conveyance is operating (i.e. getting water) and free of pine needles or other debris. Infrequent visual inspections of BMPs and no planned use of BMP performance monitoring or rapid evaluations. Rake and remove all leaves, pine needles or other debris when resources permit. Infrequent visual inspections of BMPs and debris removal as resources permit •
The maintenance commitment and schedule aims for the treatment BMPs at the site to be in proper functional condition the majority of the time (e.g. > 50%). LOW maintenance commitment requires: •
Resources are limited. •
Irregular inspections. •
Likely Treatment BMPs on the site will be in a failed condition for extended periods of time. •
No formal maintenance schedule developed. •
Maintenance actions are primarily triggered by anecdotal observations at the site. Table 3. Definitions of site maintenance commitment levels high, moderate and low which includes completing the stated actions on the indicated frequency for all Treatment BMPs located within the subject site. The user selects one of these 3 maintenance levels that best represents the intended priority for maintenance at the site and LRPTv2 uses this information to calculate the expected average annual runoff coefficient (C) over an 18‐yr time period. Treatment BMP storage (inches of runoff from source impervious area) HIGH maintenance (YH) MODERATE maintenance (YM) LOW maintenance (YL) 0.01 1.00 1.01 1.02 0.05 1.03 1.08 1.12 0.10 1.07 1.16 1.27 0.20 1.13 1.34 1.58 0.25 1.17 1.43 1.77 0.50 1.34 1.94 2.98 0.75 1.44 2.47 4.63 1.00 1.42 2.61 6.02 1.25 1.42 2.64 6.85 1.50 1.45 2.35 6.92 1.75 1.99 5.80 15.22 2.00 1.91 5.14 15.02 Table 4. Initial C value adjustment factors (Yx) each maintenance level of effort and storage of Treatment BMPs. These data were used to create equations to allow the calculation of the maintenance adjustment factor for any storage value. See Equation 7 for how the maintenance factor (Yx) is used by LRPT to calculate the average annual runoff coefficient for each Treatment BMP at a site. Final November 2010 p. 15 of 52 Load Reduction Planning Tool (LRPT) v 2 Technical and User Guidance Document 4.5 LAND USE TYPE AND CONDITION (CRC) Lake Tahoe stormwater modeling tools have employed the term characteristic runoff coefficient (CRC) to represent the average annual concentration expected from a specific type of land use and associated land use condition (nhc et al. 2009; 2NDNATURE et al. 2009). The CRCs used by LRPT (Table 5) have been estimated based on the published TMDL event mean concentration (EMC2) values in the Lake Tahoe TMDL Pollutant Reductions Opportunity Report (Lahontan and NDEP 2008; Table 2) and land use specific testing in the Lake Tahoe Basin (2NDNATURE 2010). The LRPT includes three private land use types (commercial (CICU), multifamily residential (MFR) and single family residential (SFR)) based on the TRPA Land Use designation GIS layer (Lahontan and NDEP 2008). To maintain consistency across redevelopment areas and scenarios, the land use category selected to represent the site will be a single land use, even for redevelopment projects that include mixed land use types. The expected water quality impacts decline as the relative human population density and disturbance frequency declines, thus the CRCs for each pollutant of concern are highest for commercial land use and lowest for single family residential parcels. Land Use Type Pollutant of Concern Baseline CRC (mg/L) Tier 1 CRC (mg/L) FSP (<16 µm ) 176 121 TSS 296.4 204 DP 0.078 0.050 TP 0.702 0.536 DN 0.293 0.195 2.472 2.136 92.3 34.7 3
Commercial_CICU TN 3
FSP (<16 µm ) Residential_MFR (multi‐family) TSS 150 56.4 DP 0.144 0.130 TP 0.588 0.529 DN 0.42 0.378 2.844 2.560 FSP (<16 µm ) 30.0 20.2 TSS 56.4 38 DP 0.144 0.130 TP 0.468 0.421 DN 0.144 0.130 TN 1.752 1.577 TN 3
Residential_SFR (single family) Table 5. CRCs for baseline condition and Tier 1 improvements for urban land use types (Lahontan and NDEP 2008). 2
Event mean concentration (EMC) has a very specific definition and associated calculation. Lake Tahoe stormwater modeling tools have employed the term characteristic runoff coefficient (CRC) to represent the average annual concentration expected from a specific land use type and associated condition. 3
TMDL EMCs for fine sediment were published as % TSS <63µm. To remain consistent with other pollutant load reduction methodologies being developed for the Lake Tahoe Basin and with the primary pollutant of concern in Lake Tahoe urban stormwater, the % TSS < 63µm was converted to a likely event mean concentration of fine sediment particles by mass (mg/L) <16 µm. Preliminary urban stormwater particle size distribution data provided by DRI to 2NDNATURE and “particle converter.xls” file provided by UC Davis to 2NDNATURE indicate that on average 30.1% of the mass of particles <63µm are within the range of 22µm‐63µm. The fine sediment (<16µm) EMC for each land use presented in Table 2 were calculated by: TMDL FSP (% TSS) × TSS (mg/L) × 0.699 = FSP (<16µm; mg/L). Final November 2010 p. 16 of 52 Load Reduction Planning Tool (LRPT) v 2 Technical and User Guidance Document Condition is a simple way to quantitatively express the relative water quality impact of a set of general practices and the expected pollutant generation from urban lands. In LRPT, condition is expressed as an estimate of the average annual CRC for each respective pollutant generated from a specific land use type that is expected to be maintained at a certain relative condition. There are two potential conditions for each land use (baseline and Tier 1). Baseline conditions are typical Lake Tahoe 2004 private land use conditions where parking and paths on pervious surfaces result in soil compaction and erosion, roof drip lines are bare soil, fertilizer use is excessive and other conditions of a parcel prior to BMP retrofits and source control actions. Whereas Tier 1 assumes a number of pollutant source control (PSC) practices have been implemented on the parcel to reduce the application, generation and/or transport of pollutants at their source. PSC include the reduction of fertilizer applications and the implementation of erosion control BMPs such as retaining walls, path or driveway paving, natural vegetative cover, parking lot sweeping and other BMPs to reduce the annual source of sediment and nutrients generated from the site. Tier 2 improvements were also estimated by Lahontan and NDEP (2008) and included extensive pollutant control actions, banning of phosphorous‐based fertilizers and other advanced land management improvements. For the purposes of LRPT v2, it is assumed that Tier 2 CRC values are not representative of likely private parcel conditions in the near future. However, future versions of the tool may include Tier 2 CRC values if field measurement validate that the associated CRC values are achievable on a long‐term basis. The LRPT user follows a set of rules to define the land use type and associated condition of the site for each scenario. Based on user inputs the associated CRC values for the 6 pollutants of concern (see Table 5) are integrated with the average annual runoff volumes (EQ1) to provide the annual pollutant loads generated from the site for a given scenario. 5. LRPT USER GUIDANCE The user applies the LRPT methodology to pre and post‐retrofit conditions by performing a sequence of steps summarized in Table 6 below: LRPT STEP STEP 1 STEP 2 STEP 3 STEP 4 STEP 5 STEP 6 STEP 7 STEP 8 Description
Specify parcel boundaries
Define scenario and site conditions
Delineate patch boundaries and hydrologic linkages
Assign hydrologic routing contributions
Populate LRPT spreadsheet and run simulation
Repeat steps 2 –5 for all desired scenarios
Compare runoff and pollutant loads
Generate LRPT summary report
Table 6. LRPT user STEPs.
The following sections provide user guidance for successfully completing each LRPT step. The accuracy of runoff values and associated pollutant load calculations by the LRPT increases as the hydrologic routing representation of the site approximates the actual drainage conditions. It is critical that the user obtain the best available aerial photos, engineering plans and topographic data, as well as perform visual inspections of the site in order to delineate surface types, patches, and hydrologic routing paths as accurately as possible. The user will need the site map before initiating STEP 1 below. Final November 2010 p. 17 of 52 Load Reduction Planning Tool (LRPT) v 2 Technical and User Guidance Document STEP 1. SPECIFY PARCEL BOUNDARIES The location of the parcel(s) to be improved must be determined. The entire site boundaries where BMP retrofit improvements are planned should be determined using GIS, AutoCAD or other mapping program, site visits/site surveys, and/or engineering plans. The user needs to obtain the site address, create a site ID, determine total site area in ft2, and utilize Figure 3 to select the most representative MET grid for the site. The MET grid is used by LRPT to determine average annual precipitation (in/yr) and the annual precipitation is held constant for all LRPT scenarios conducted for the subject site. STEP 2. DEFINE SCENARIO AND SITE CONDITION The LRPT estimates the average annual pollutant load reductions for pre and post‐retrofit scenario pairs based on differences in hydrologic routing, general land use condition and the implementation and continued maintenance of Treatment BMPs on the site. STEP 2 requires the user to define the scenarios that will be modeled in LRPT, identify the parcel land use type, determine the land use condition for each scenario as well as determine the future maintenance commitment level that will be implemented to ensure long‐term Treatment BMP performance as designed. STEPs 2‐5 must be completed for each scenario to be modeled in LRPT. If improvements are planned and LRPT is being used to quantify the water quality benefits of one or more potential design alternatives, the user should first complete LRPT for the existing, unimproved site conditions and field verification of site delineation (STEP 3) and hydrologic routing (STEP 4) should be completed. Post‐retrofit scenarios are then future design concepts for improved conditions to be implemented on the site in question. If improvement have already been implemented at a site, and LRPT is being used to retroactively quantify the water quality benefit of the post‐retrofit actions, the user should first complete the post‐retrofit scenario mapping and site delineation, and then use best available site information to represent the pre‐retrofit site conditions that no longer exist. Regardless of the order of scenario completion, pollutant load reduction calculations require at least one pre and post‐retrofit pair to be entered into LRPT. However, the user can input multiple post‐retrofit scenarios in order to compare alternatives based on the estimated water quality benefits. Land use type The user is required to identify the land use type of the parcel in question using the TMDL land use type categories (LRWQCB and NDEP 2010). The user must consider the area of each land use type and its relative contribution to the overall parcel(s). In many instances, parcels analyzed using LRPT may consist of mixed land use types. Since condition of a private urban land use is assumed to be influenced by the relative density and frequency of human traffic, if greater than 15% of the parcel area is used for the higher traffic land use (either commercial or multi‐
family residential) the parcel is designated as the higher impact land use type. The rules for land use type determination are below: A. If parcel area is > 15% Commercial_CICU then: Land use type = Commercial_CICU B. If parcel area is <15% Commercial_CICU and > 15 % Residential_MFR; Land use type = Residential_MFR C. If parcel area is <15% Commercial_CICU and < 15 % Residential_MFR; Land use type = Residential_SFR The same land use type should used for both pre‐ and post‐retrofit scenarios unless there is a significant land use designation change and a strong justification for a shift in the land use type as a result of redevelopment can be made. Final November 2010 p. 18 of 52 Load Reduction Planning Tool (LRPT) v 2 Technical and User Guidance Document Land use condition The user must determine if the scenario land use condition is either baseline or Tier 1 (see Section 4.5). The site is expected to be modeled as baseline conditions that include minimal spatial application of TRPA parcel‐based BMPs to reduce sources and generation of the pollutants of concern (sediment and nutrient species). Baseline conditions are typical of 2004 private land use conditions prior to BMP retrofits and source control actions. In most instances, pre‐retrofit scenarios will be at baseline conditions. Tier 1 improvements assume complete private BMP implementation per the certification requirements of the TRPA BMP program with respect to pollutant source controls as outlined at http://www.tahoebmp.org/Default.aspx. The Tier 1 improvements include stabilization of all exposed soils using native vegetation, retaining walls, driveway and human path paving, etc. to reduce the chronic source of potential sediment and particulate pollutants generated from the site. Other pollutant source control measures that are required to assume the scenario condition represents Tier 1 conditions include frequent sweeping of commercial parking lots, fertilizer application restrictions, and other actions that require long‐term commitment to the reduction in the sources of sediment and nutrients on the parcel. If the redevelopment scenario is designed and managed to meet the TRPA BMP certification guidelines, the scenario condition is expected to be Tier 1. BMP Maintenance Effort If the scenario is post‐retrofit the user must specify the maintenance commitment level (high, moderate or low) for all Treatment BMPs located on the site. See Table 3 for guidance on selecting the appropriate maintenance commitment level for each post‐retrofit scenario based on available resources and the relative priority of on‐going maintenance of all of the Treatment BMPs at the site. Section 4.4 details the LRPT approach to modeling the effects of maintenance on Treatment BMP performance over time. If the scenario is pre‐retrofit conditions, maintenance is not incorporated into the LRPT calculations and the maintenance commitment selection is not applicable to the scenario. STEP 3. DELINEATE PATCH BOUNDARIES AND HYDROLOGIC LINKAGES The purpose of STEP 3 is to obtain a spatial understanding of the redevelopment site, delineate the site into discrete patches of similar hydrologic characteristics and determine hydrologic routing linkages. The final product of STEP 3 is a plan view map of the site with a series of spatially distinct patches and the flow direction between patches and ultimately to offsite areas. The completion of STEP 3 will be an iterative process by the user. The STEP 3 mapping should be initiated in the office using GIS, Google Earth, AutoCAD or other mapping program, with preliminary patch delineation conducted to the extent possible. Engineering plans may also be useful in determining the location and sizing of Treatment BMPs for relevant scenarios. The draft map should definitely be field verified at the site to confirm the existing conditions parcel delineation, patch sizes and identify flow directions from patch to patch. One or more surface types can be lumped into distinct patches based on similar expected annual runoff coefficients (i.e., permeability; see Table 1). The user should focus the detail of parcel delineation on the location, sizing and hydrologic routing of constructed Treatment BMPs, as these are the features installed and maintained at the site to provide a water quality benefit downslope. Impervious and many pervious surface types can be lumped into a single patch if: 1. The surface types are identified to possess the same relative permeability (see Table 1); 2. They are adjacent or in very close proximity; and 3. Consolidation of surface types simplifies site geometry while preserving the general hydrologic routing processes of the subject parcel. Final November 2010 p. 19 of 52 Load Reduction Planning Tool (LRPT) v 2 Technical and User Guidance Document Impervious surface types such as pavement, roofs and brick surfaces are lumped during delineation, and all are assigned an average annual runoff coefficient (C) of 0.82 (see Table 1). Attempts should be made to reduce complex geometries to simple polygons while preserving the site surface area. In the majority of cases, the visual distinction between various surface types and their relative permeability will be readily apparent, but in some instances best professional judgment, infiltration measurements or other means to gain additional information on the surface type and most appropriate annual runoff coefficient may be necessary. Although advanced computer software allows the locations of boundaries to be determined very precisely, the user should employ best professional judgment in simplifying complex geometries. While on site, the user should conceptualize the entire redevelopment site in a holistic manner, by first identifying which portions of the site are (1) up‐gradient versus down‐gradient (site slope), and (2) which portions are raised or elevated above adjacent areas (buildings, structures, etc.). Runoff will always flow from higher to lower elevations. The user should consider hydrologic connections between the site and offsite areas: are there storm drains or other conveyance features onsite that route directly offsite? If there is an offsite BMP, what is the hydrologic connection between onsite areas and the offsite BMP? Only after the user has identified the overall hydrologic routing of the redevelopment site should they begin the iterative task of delineating patches and hydrologic routing linkages. Rules for delineating patches: 1.
2.
3.
4.
5.
6.
7.
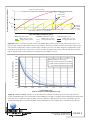
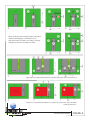
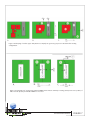
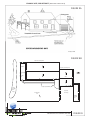
Pervious and impervious surface types of similar permeability adjacent to one another can be lumped to simplify site delineation and hydrologic routing (see Table 1 for similar surface types). Each patch is a Source Patch – every patch receives precipitation and is a source for runoff. Runoff is routed to either an adjacent Receiving Patch or Offsite. Each patch has slope, elevation, or other characteristic that will determine routing of runoff generated from it to another patch or offsite. Begin patch flow assignments by starting at the highest elevation within the redevelopment site and work down‐gradient. This means that the first patches defined will be those that do not receive runoff contributions from other patches (i.e., are source patches only). Flow cannot be circular between patches – Runoff is always one‐way and down‐gradient. If runoff from Patch 1 flows to Patch 2, runoff cannot flow from Patch 2 (or any patches connected hydrologically to Patch 2) back to Patch 1. If the site appears to be completely flat, identify offsite as the adjacent public right away or road surface and assume that direction is down‐gradient. The goal is to create the minimum number patches required to represent the overall hydrology of the site. Do not subdivide patches unless not doing so results in circular flow. See Figures 6 and 7 and guidance below. LRPT allows up to 30 patches to be defined for a scenario. If the site requires more than 30 patches the user will have to divide the site and model the scenario as two. A number of example scenarios demonstrating the rules for determining patch geometries and assigning hydrologic routing linkages are included below to guide the user through STEP 2. The individual examples are deliberately designed to be simple and representative of features that will likely be encountered within any LRPT application, with the goal that a complex site can be represented by a combination of simple examples. AVOIDING CIRCULAR HYDROLOGIC ROUTING The following example illustrates the governing rules for assigning patches and hydrologic routing (Figure 6a). The example site has two surface types: asphalt and turf (Panel A). If the site is sloped to the North (Panel B), only two patches are required to represent the flow characteristics: Patches 1 and 2 both receive rainfall, with runoff from Patch 2 routed to Patch 1, which in turn routes offsite. Final November 2010 p. 20 of 52 Figure 6a. Simple flow routing and patch delineation
examples illustrating the consideration of site
slope and number of patches necessary to properly
delineate site and not circularly route water.
Figure 6b. Proper patch delineation for 3 surface types given site slope differences
Figure 6c. Proper patch delineation for 3 surface types given site slope and patch
elevation differences.
site delineation examples
FIGURE 6
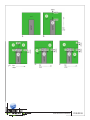
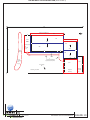
Load Reduction Planning Tool (LRPT) v 2 Technical and User Guidance Document If the site is sloped to the East (Panel C) and only 2 patches are incorporated, the result is circular hydrologic routing which is not allowed (red X): a portion of the runoff from Patch 1 is routed across Patch 2, which in turn discharges back to Patch 1. A third patch is required to represent site hydrologic routing. Incorporating a third patch as shown in Panels D – F resolves circular routing issues (green checkmarks). The user has broad discretion when choosing the boundaries of Patch 3: it can be equal in size to Patch 1 (Panel D), much larger (Panel E), or much smaller (Panel F). All choices are valid. In a more complex redevelopment scenario incorporating additional patches occupying what is now labeled as Offsite, the user would consider which scenario (Panels D – F) best fits with the additional patches. Figure 6b provides an example with three patches as shown in Panel A: turf, asphalt, and maintained pervious (swale). If the site is sloped to the North as shown in Panel B, only three patches are required to represent the flow characteristics. If the site is sloped to the East as shown in Panel C, two additional patches are required to avoid circular routing issues. Figure 6c shows a typical peaked roof surrounded on three sides by turf and on one side by asphalt. Note that the runoff from the roof is directed perpendicular to the roof apex, independent of site slope (assuming that the building is level). If the site is sloped to the North as shown in Panel B, only three patches are required to represent the flow characteristics. If the site is sloped to the East as shown in Panel C, an additional patch is required to avoid circular routing issues. GROUP SURFACE TYPES INTO ONE PATCH Whenever possible, it is advantageous to group multiple similar surface types into a single patch. Grouping can be done when the patches to be grouped are (1) spatially close together, (2) separated by other regions also having similar permeability, and (3) the surfaces have the same drainage pattern/direction. Panel A in Figure 7a consists of five roofs surrounded by turf, along with an area of asphalt. The roofs can be grouped into a single patch having acreage equal to the sum of the acreages of the individual roofs. Three patches (as opposed to seven) are required to represent flow characteristics if the site is sloped to the North as shown in Panel B. An additional patch (4) is required to avoid circular routing issues if the site is sloped to the East as shown in Panel C. OFFSITE REQUIRED FOR ALL PATCHES Figure 7b shows an infiltration feature BMP surrounded by turf. Recall that each patch is a source patch that must route runoff to an adjacent patch or offsite. If the site is sloped to the east as shown in Panel B, three patches are required to represent the flow characteristics and avoid circular routing issues. If the site is sloped to direct all Patch 1 runoff to the infiltration BMP, then runoff from the Treatment BMP (Patch 2) must be routed either to another patch (Patch 3) that is hydrologically down gradient from Patch 1 or offsite, should the capacity of the infiltration BMP be exceeded (Panel C). PATCH ID The user must assign each patch a unique identification code and label each patch directly on the site map for easy transfer into the LRPT worksheet. The recommended nomenclature is the two letter ID indicating the patch type such as IM for impervious or BF for biofilter (see Table 1) followed by sequential numbers for each patch type (IM1, IM2, etc). However, the users are free to assign any short identification codes to each patch within the area of interest if it provides added clarity to the user and future reviewers. Final November 2010 p. 22 of 52 Figure 7a. Grouping of surface types and patches to simplify site geometry yet preserve area and flow routing
configuration.
Figure 7b. Delineation of constructed Treatment BMPs must include downslope routing (subsequent source patch) of
water should capacity of infiltration BMP be exceeded.
site delineation examples
FIGURE 7
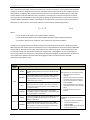
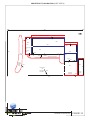
Load Reduction Planning Tool (LRPT) v 2 Technical and User Guidance Document STEP 4. ASSIGN HYDROLOGIC ROUTING CONTRIBUTIONS The user estimates the percentage of flow across boundaries from source patches to receiving patches (or offsite). By definition, each patch is a source patch and must therefore have a minimum of one flow connection to either an adjacent patch or offsite. If there is only one flow connection, then by definition the fraction of routing is 100%. If there are multiple connections, the user must estimate the routing percentages between connected patches based on a combination of (1) topographic and structural data and (2) length of the shared boundaries between the patches. The routing percentages are determined for each source patch and must sum to 100%. Figure 9 illustrates the estimate of the percentage of flow across patch boundaries. The user always begins with the upslope (upgradient) patch on the site and indicates the flow percentages directly on the patch‐delineated site map. With the site sloped to the north as shown in Panel B, 100% of the runoff from Patch 2 is routed to Patch 1. In turn, 100% of the runoff from Patch 1 is routed offsite. Figure 8 examples increase in complexity to illustrate the assignment of percentage of flow across adjacent patch boundaries. Panel C. Patch 1 shares flow boundaries with (i.e., is a source patch to) both Patch 2 and Patch 3. Based on the length of the shared boundaries, it is estimated 70% of the runoff from Patch 1 is discharged to Patch 2 and the remaining 30% is discharged to Patch 3. Patch 2 discharges 100% to Patch 3, which in turn discharges 100% offsite. Panel D. Patch 1 discharges 100% to Patch 2, which discharges 100% to Patch 3. Patch 3 discharges 100% offsite. Panel E. Patch 1 shares flow boundaries with Patch 2 and the offsite region. Based on the relative length of the shared boundaries, the user estimates 70% of the runoff is routed to Patch 2 and the remaining 30% is routed offsite. Patch 2 discharges 100% to Patch 3, which in turn discharges 100% offsite to the east. The final product of STEPs 3 and 4 is a plan view map of the site scenario with a series of spatially distinct patches, flow direction between patches and ultimately to offsite areas, and percent contribution of flow from each source patch to each receiving patch. The user will need to extract specific information from the site delineation map including patch surface type, patch area (ft2), the source to receiving patch flow links, and relative flow percentages for input into the LRPT spreadsheet tool. For Treatment BMPs additional sizing information is required. Refer to Appendix A for a simple site example for both pre and post improvements to better illustrate STEPS 1‐4. Final November 2010 p. 24 of 52 C.
D.
E.
flow percentage examples
FIGURE 8
Load Reduction Planning Tool (LRPT) v 2 Technical and User Guidance Document STEP 5. POPULATE LRPT INPUT TABLES AND RUN SIMULATION User guidance on how to populate the LRPT Input Tables is provided below. Screenshots are provided as reference for each Input Table, and in some instances the complete Input Tables may not be displayed below due to space limitations (indicated by dashed arrow). A detailed tutorial is provided as Appendix A using an example site to demonstrate the functionality of LRPT to the new user. OPEN LRPT MS EXCEL FILE LRPT is a visual basic application implemented in a Microsoft Excel spreadsheet with the name ‘LRPTV2.xlsm’. The program has been tested in the 2007 version of MS Excel and may not function properly in other versions of MS Excel due to changes in VBA from one version of Excel to another. Users are permitted to change data in the Input Tables, but the rest of the sheet is locked for editing and users cannot view the macro code that runs the application. Both of these measures are intended to reduce the potential for users to unintentionally cause errors in the program. LRPT is locked for editing, so users should save it as a new file for each new site evaluation. For LRPT to run, users must ensure that macros are enabled in Excel. 1.
2.
3.
4.
5.
6.
Open Excel 2007 and click the Office button in the upper left corner of the screen. At the bottom of this menu, click the Excel Options button. Click the Trust Center button on the left. Then, at the bottom right, select Trust Center Settings. In the new window that appears, choose Macro Settings from the sidebar and select Disable all macros with notification from the list of options that appear. This option keeps macros disabled but notifies users when macros attempt to run, allowing users to decide on a case‐by‐case basis which macros to enable. Click OK to exit this window. For the new settings to take effect, it will be necessary to close Excel and reopen it. A security dialog box should appear beneath the Office ribbon the next time you attempt to run a spreadsheet that contains macros. When the notification appears, click the Options button. Choose Enable this content from the options that appear to allow macros to run within the current spreadsheet. Click OK to close the window. Save as a macro enabled MS Excel file (.xlsm) and give the file a unique name reflecting the site evaluated. The LRPT spreadsheet consists of four Input Tables and two Output Tables. All user input for the LRPT is done on the worksheet labeled ‘controlForm’ and new worksheets are dynamically created as the user saves data from the Input Tables. Cells are annotated within the worksheet to help guide the user through the data input process. POPULATE SITE INPUT TABLE The spreadsheet is designed to be used for a number of scenarios for a single site, so a new workbook should be used for each new site evaluated. Enter a unique Site ID for your site and select the appropriate MET grid from the drop down menu. The average annual precipitation in inches per year is automatically populated in the field below the MET grid field. Below this, enter the total site area in square feet. Final November 2010 p. 26 of 52 Load Reduction Planning Tool (LRPT) v 2 Technical and User Guidance Document POPULATE SCENARIO INPUT TABLE At the SCENARIO Input Table, enter the information for a single scenario, beginning with a unique ‘Scenario ID’ and ‘Scenario Type’. The ‘Scenario Type’ field is selected from a pull‐down menu and specifies whether the scenario is ‘pre‐retrofit’ or ‘post‐retrofit’. The user then selects the appropriate land‐use type and land use condition for the specific scenario (See STEP 2 for guidance). If the scenario is post‐retrofit, suggesting the installation of Treatment BMPs , the user must designate the BMP Maintenance Effort commitment (high, moderate or low) for all of the Treatment BMPs at the site (See STEP 2 for guidance on selection). The default BMP Maintenance Effort is LOW. If the scenario is pre‐retrofit the BMP Maintenance Effort is not applicable to the user. When all of the fields have been populated in the SITE and SCENARIO Input Tables, click the button labeled ‘Save Scenario’. A change in any of the SCENARIO Input Table fields will constitute a new scenario, since they affect runoff and loading calculations in LRPT. To enter another scenario, change the appropriate field values, and click the ‘Save Scenario’ button. Remember to create a new, unique ‘Scenario ID’ for each new scenario. The user may create up to 6 scenarios for a single worksheet. POPULATE PATCH DATA INPUT TABLE At the PATCH DATA Input Table, the user specifies characteristics of the site patches that are used to calculate the annual runoff coefficient for each patch. The user should refer to the completed site delineation and hydrologic Final November 2010 p. 27 of 52 Load Reduction Planning Tool (LRPT) v 2 Technical and User Guidance Document routing map for the respective scenario to easily transfer the data into the PATCH DATA Input Table. The user should begin patch entry with those at the uppermost elevation that are only source patches (i.e. only receive rainfall and no runoff inputs from other patches, such as roofs). The user populates the PATCH DATA Input Table from left to right continuing from patch to patch as they progress downward in site elevation, with no blank spaces. The user must ensure that if a patch receives runoff from anther patch, the patch that it receives runoff from (e.g. its source patch) is listed earlier (on the left side) in the table. This is an important rule to follow, since LRPT can’t calculate a contribution from a patch without first calculating the contribution to that patch from others. The user inputs each unique Patch ID, selects the surface type from the pull down menu and enters the surface area of each patch in square feet from the scenario site diagram completed in STEPs 3 and 4. For Treatment BMPs patch types (biofilters (BF) or infiltration features (IF)), the user must enter the storage (Sn) of each Treatment BMP by dividing the design volume of the infiltration facility by the source impervious area (see Equation 5). For porous pavement (PP) patches, the user specifies the reservoir void space (VSn), and the depth of pervious pavement subsurface reservoir (Zn) and the storage is calculated by LRPT when the ‘Calculate C values’ button is clicked. Troubleshooting: If data in PATCH DATA Input Table is changed after ‘Save Patches’ button has been pressed, the user should delete the worksheet that was created when the patches were incorrectly saved, make the appropriate changes in the PATCH DATA Input Table, and the press ‘Save Patches’ button again. When all of the fields are populated for all of the patches at the site, click the ‘Calculate C values’ button, and LRPT will populate the runoff coefficients (C) for each patch. If an error is discovered in the PATCH DATA Input Table, simply make the appropriate change and click the ‘Calculate C values’ button again. The runoff coefficient values Final November 2010 p. 28 of 52 Load Reduction Planning Tool (LRPT) v 2 Technical and User Guidance Document for Treatment BMPs that have been adjusted for the site maintenance effort are shown below the ‘Initial runoff coefficients’. The user should ensure the runoff coefficient (C) values are calculated and all of the other patch information is complete and then save the patch data by clicking the ‘Save Patches’ button. A separate worksheet tab is created that stores the patch data each time the ‘Save Patches’ button is clicked (e.g. ‘Patches1’). POPULATE HYDROLOGIC ROUTING INPUT TABLE The HYDROLOGIC ROUTING Input Table requires the user to specify the percent contribution from each source patch to each receiving patch. The matrix of patches is automatically created in the HYDROLOGIC ROUTING Input Table when the user clicks the ‘Save Patches’ button in the PATCH DATA Input Table with source patches listed along the top row and receiving patches listed along the left hand column. The user should systematically enter the hydrologic routing as represented on the site delineation map created for the respective scenario. Once all hydrologic routing data entry is complete, scroll down to the bottom of the table to verify the flow routing check totals are 100 for each column. Use this calculation to identify and remedy any data entry errors. Troubleshooting: If information is changed after the routing is saved, delete both the worksheet tabs with the current patch data (Patches) and the routing configuration (Qcalcs). Re‐save the Patch Data Table, make the appropriate changes, and re‐save the Hydrologic Routing Input Table Once complete, click the ‘Save Routing’ button to save the hydrologic routing network currently displayed in the HYROLOGIC ROUTING table. If the user has not saved the patches currently displayed in the PATCH DATA table, an error message will appear when the user clicks the ‘Save Routing’ button. If this occurs, return to the PATCH DATA Final November 2010 p. 29 of 52 Load Reduction Planning Tool (LRPT) v 2 Technical and User Guidance Document Input Table and save the current patch configuration before clicking the ‘Save Routing’ button in the HYDROLOGIC ROUTING table. LRPT creates a new worksheet tab with the routing data every time the ‘Save Routing’ button is clicked (e.g. “Qcalcs1”). Double check the site diagrams to ensure that routing directions and contributions have been correctly assigned for each patch. Incorrect routing can lead to incorrect runoff and loading calculations. Incorrect routing can lead to incorrect runoff and loading calculations. Users should ensure that only one set of patch and routing worksheets are present for each desired scenario and delete unneeded sheets. RUN SCENARIOS At the RESULTS SUMMARY Output Table, the user obtains the LRPT runoff and annual pollutant load estimates for the 18 year simulation period for each scenario that has been entered into LRPT by pressing the corresponding ‘Run Scenario’ button. LRPT simulations will take up to a minute to run a simulation for a scenario and return results to the table, so please be patient. If needed, the simulation can be terminated by hitting the Esc key. STEP 6. REPEAT STEPS 2‐5 FOR ALL DESIRED SCENARIOS In order to calculate the load reductions from a site improvement effort, the pre‐retrofit scenario and at least one post‐retrofit scenario is required. A user can input multiple post‐retrofit scenarios in order to compare parcel improvements. The user can compare various patch configurations, various Treatment BMP types and sizing and different maintenance commitments as different scenarios at a site to optimize design for the maximum water quality benefits. The user obtains the runoff and pollutant loads generated for each scenario with the LRPT from the RESULTS SUMMARY Output Table. In order to obtain the runoff and pollutant load reductions from a pre‐retrofit scenario and one or more post‐retrofit scenarios, the user will view the RESULTS COMPARISON table. STEP 7. COMPARE RUNOFF AND POLLUTANT LOADS For each site, a pre‐retrofit scenario and at least one post‐retrofit scenario are required. A user can input multiple post‐retrofit scenarios for one site in order to compare parcel improvement alternatives. The user can explore the differences between various patch configurations, BMP types, and maintenance commitment levels as different Final November 2010 p. 30 of 52 Load Reduction Planning Tool (LRPT) v 2 Technical and User Guidance Document scenarios at a site to optimize design for the maximum water quality benefits. Make sure that results are displayed for your pre‐retrofit and post‐retrofit scenarios in the LRPT spreadsheet RESULTS SUMMARY Output Table. Use the pull down menus in the RESULTS COMPARISON Output Table to select the pre‐retrofit and post‐retrofit scenarios and click the ‘Compare Results’ button to display the runoff and pollutant load reductions. Negative runoff and annual pollutant load change values indicate reductions from the Initial Scenario to the Final Scenario. Use a pre‐
retrofit scenario as the initial and a post‐retrofit scenario as the final to examine runoff and pollutant loading changes due to retrofit design changes. STEP 8. GENERATE LRPT SUMMARY REPORT The LRPT summary report detailing the water quality benefits resulting from redevelopment should include the Results Summary Table and Compare Results Table populated with the scenarios of interest. The Compare Results Table should be accompanied by the site diagrams for each redevelopment scenario as produced by the user during STEPS 2‐4 that include site delineation and flow routing as shown in the training exercise in Appendix A. 6. PROGRAMATIC INTEGRATION DESIGN ALTERNATIVES, COST‐BENEFIT ANALYSES & PROJECT REVIEW Using LRPT, site retrofit designers can quickly develop several different layout and treatment design alternatives that will improve their ability to communicate trade‐offs with municipal and regional project reviewers. Currently, different municipal engineering staff and design consultants use different modeling approaches, assumptions and file formats to evaluate stormwater treatment designs and runoff quantities. This lack of standardization increases the cost of developing analyses and decreases the ability for reviewers to compare analyses from different parcels. Further, current methods to provide analyses of potential site retrofit alternatives generally only calculate volume for design storms, which does not provide the more important water quality context of understanding of pollutant loading impacts over long‐term periods. The standardization resulting from the consistent use of LRPT to evaluate stormwater pollutant loading for different parcel scale design alternatives will increase the consistency of analyses and improve the ability for reviewers to understand the analyses in the context of the Lake Tahoe TMDL and load‐based stormwater permits and Memoranda of Agreement. LRPT will provide quantitative, consistent and clear results that provide simple comparisons of how preferred design options address onsite runoff and loading issues. This will provide robust information to substantiate redevelopment projects that significantly reduce runoff and pollutant loading from current (pre‐retrofit) conditions. Further, comparing the loading resulting from different alternatives in light of the relative costs for each alternative will enable project designers to identify when on‐site treatment is sufficiently difficult that off‐site improvements produce significantly greater load reduction benefits more cost effectively. Final November 2010 p. 31 of 52 Load Reduction Planning Tool (LRPT) v 2 Technical and User Guidance Document By using a long‐term hydrologic simulation and calculating loads, LRPT provides results consistent with the PLRM which is used to calculated catchment‐scale load reduction and Lake Clarity Credits (credits). This consistency will allow municipal stormwater planners, project reviewers and regulators to communicate using consistent terms, and inform long‐term catchment‐ and municipal‐scale planning to achieve credit targets. TRPA and county project review staff will greatly benefit from the standard use of LRPT through faster and higher quality review and input to project plans and permits. Requiring the analysis of loading from a parcel will provide a strong incentive for project designers to use LRPT as the most cost‐effective tool available for use in the Tahoe Basin. To provide an additional incentive, reviewers may give priority to projects with supporting analyses using LRPT and require a longer review period for projects that use non‐standard approaches. More aggressively, project permit requirements may be adjusted to require analyses using LRPT for all projects, or for all projects that require any sort of trade‐off or alternatives analysis. PRIVATE PROPERTY BMP RETROFIT DESIGN & APPROVAL Private property BMP site design recommendations and certification can be improved through the standard use of LRPT. By equipping field staff with LRPT templates of typical site layouts, they can quickly modify the standard templates to reflect actual site conditions. This will increase the consistency of recommendations and provide a stronger basis for treatment BMP placement and design at a specific site than is possible from the multiple interpretations provided by different staff of how to apply recommendations in the TRPA BMP Handbook. A frequent complaint of the private property BMP requirement is that property owners feel their property does not contribute to pollutant loading. By providing loading information over multiple years, LRPT will educate property owners of their overall contribution to lake clarity loss. It will also link local residents to the achievement of basin‐wide load reduction goals called for in the TMDL and necessary to restore lake clarity. STAFF TRAINING It is a challenge to train new staff to understand how specific BMPs and design alternatives relate to large scale threshold and TMDL goals. This lack of understanding can result in inconsistent review comments and a lack of ability to articulate the importance of installing and maintaining BMPs. This lack of detailed understanding and quantitative evidence can result in BMP program staff being unable to provide well‐reasoned rationale for the importance of BMPs when faced with disgruntled residents who are unhappy with the requirement to invest in BMPs. Training and use of LRPT will provide project review and private property BMP certification staff with the tangible understanding of the importance of well‐designed and maintained BMPs, and will provide them with quantitative examples to reference. With the ability to test different design options or levels of maintenance commitment, LRPT will enable staff to experiment with more flexible BMP design alternatives which can allow them to accommodate the desires of residents related to particular areas on their property. POLICY ALTERNATIVE & CLIMATE CHANGE ANALYSIS LRPT provides a consistent platform to analyze how basin‐ or municipality‐wide policies may play out at a site scale. Planners and regulators are shifting the approach to address water quality issues through a focus on average annual load rather than strictly focusing on runoff frequency and concentrations. This approach holds the potential to provide more flexibility for development and redevelopment activities that can result in economic benefits to the Tahoe Basin. LRPT provides a conceptually simple means to analyze how different policies would result in requirements for typical retrofit projects. Using this information planners and regulators can test their Final November 2010 p. 32 of 52 Load Reduction Planning Tool (LRPT) v 2 Technical and User Guidance Document assumptions of the results of new policies at a site to inform how the policies can both practical and effective. The LRPT outputs can also be used to communicate the expected results of new policies to constituents, which will provide a tangible framework that can make policy debates more productive. The ease of use of LRPT may also provide a cost‐effective means for project designers to evaluate the potential influence of climate change on loading from different design alternatives. LRPT currently uses an accepted historic precipitation record. The precipitation data file can be changed to a projected precipitation record that reflects a climate change scenario. Designers and reviewers can use LRPT to determine the potential magnitude of change for a site design by comparing loading results using these two different precipitation records. This information can inform design options to favor designs that perform well under both historic and projected future precipitation regimes. LAKE CLARITY CREDITING PROGRAM RELATIONSHIP The Lake Clarity Crediting Program requires the use of PLRM or an equivalent continuous simulation, to estimate catchment‐scale annual average load reductions based on planned water quality improvement actions, which are the basis for defining the number of credits awarded. Annual credit targets will be included in stormwater permits and memoranda of understanding, and jurisdictions will be expected to meet these credit targets through any combination of pollutant controls. LRPT is a practical means for project proponents to address the concerns of municipal engineers and regional regulators related to the need to reduce pollutant loading and meet Lake Tahoe TMDL implementation milestones. By reducing loading coming from specific parcels within a catchment, the overall loading at the bottom of a catchment should be reduced. However, LRPT does not account for additional pollutant controls in‐place in a catchment downstream of the analyzed parcel, thus the LRPT results cannot be directly used to determine load reductions on a catchment scale. The consistency of the assumptions between LRPT and PLRM provides directly applicable information that can be used generally understand relative magnitude of runoff volume and pollutant load reductions expected from one or more parcels relative to the volumes and loads exiting the bottom of the respective catchment. 7. LRPT V2 LIMITATIONS AND NEXT STEPS The LRPTv2 has been developed to meet the goals, objectives and functions of the tool defined by the scope at the onset of this effort. Tool development was conducted with limited resources and this initial version of the tool is ready for user testing and feedback (Fall 2010). All of the components of the LRPTv2 have been implemented, tested and refined given available resources and tool functional and improvement priorities. A single residential parcel in South Lake Tahoe and is the example parcel in the “How to install best management practices (BMPs) in Lake Tahoe; A guide for building and landscape professionals” and presented as the example in the tutorial to assist new users in applying the tool to an actual parcel. Should LRPTv2 be used for parcel retrofit planning or potentially be integrated into parcel retrofit permitting requirements, future versions of LRPT could be developed to incorporate user feedback and address some of the known limitations and potential improvements listed below. 1.
The LRPT is a reasonable and simple methodology to estimate the relative water quality benefit of parcel retrofit projects in the Tahoe Basin. The accuracy of the LRPT annual loading estimates from any specific redevelopment site is likely limited. Rather, the methodology applies fundamental hydrologic routing principals and focuses on preserving the relative accuracy of the water quality benefits of different urban land use improvements that are commonly implemented in the Tahoe Basin. While the pollutant load estimates generated are unlikely to accurately represent actual loads for a specific year, the LRPT method is expected to reliably differentiate the relative water quality benefit across parcels and different redevelopment scenarios. Final November 2010 p. 33 of 52 Load Reduction Planning Tool (LRPT) v 2 2.
3.
4.
5.
Technical and User Guidance Document To the extent possible, LRPT algorithms are based on and consistent with PLRM, thus increasing confidence that outputs from LRPT on the parcel scale align with PLRM estimates on the urban catchment scale. The accuracy of LRPT results are, in part, dependent upon the judgment and experience of the user. The user must use the best available information and data when dividing the redevelopment area into patches, assigning patch types and determining flow routing percentages (STEPs 3 and 4). The delineation of site patches may be subjective in some instances, but the user should determine the number of patches and flow routing linkages based on the rules provided in the user guidance such that the overall hydrology of the site is reasonably represented. Because the rules allow for subjective determination of patch boundaries and flow routing, there will be variability in runoff and load calculations made by different users. However, the difference between LRPT estimates by two independent users on the same site is expected to be <10% if the rules are rigorously followed. The incorporation of maintenance commitment for the site into LRPT addresses the critical need for regular maintenance of BMPs to maintain performance within an acceptable range and is considered a valuable first step to incorporate the role of maintenance in a water quality benefit estimation tool. However, LRPTv2 uses an overly simplistic quantitative approach to estimating the decline in the infiltration capacity of specific Treatment BMPs over time. The LRPTv2 approach ignores the inherent variability in the performance decay rates for different BMP types at different locations on the same site. Different BMPs on a site are likely to respond differently to the influence of contributing surface area and the pollutant loading rate. LRPTv2 lumps the maintenance effort for the overall site, when it is likely that Treatment BMPs chronically accepting dirty water (such as an unpaved driveway) will clog faster than those accepting relatively clean water (such as roof runoff). While there is strong agreement that regular maintenance is necessary to maintain the infiltration capability of Treatment BMPs, empirical data to support the rate of performance loss as a result of lack of maintenance is extremely limited. Future research is necessary to improve our capability to quantify the water quality benefit and necessary frequency of maintenance to sustain pollutant load reduction expectations from Treatment BMPs. In addition, the stormwater quality improvement community needs to identify and implement practices that ensure adequate maintenance actions are performed on reasonable intervals to ensure long‐term sustained pollutant load reductions. The land use CRCs for the pollutants of concern are based on the TMDL EMCs and limited land use specific water quality data. The land use CRC changes from baseline to Tier 1 improvements are purposely modest as to not over estimate the water quality benefit of source control actions that require long term and continued implementation to provide the actual average annual water quality benefit over 18 years as estimated from the LRPT. Tahoe Basin research continues to build evidence that both land use type and condition should be used to constrain the potential downslope water quality risk (nhc et al 2009; 2NDNATURE 2010). Current and future research will continue to improve the CRC dataset from residential, commercial and other land use types over the typical range of conditions. Future updates to the CRC values should be conducted in the LRPT calculations as new data becomes available. The development of LRPTv2 required the transfer of a pollutant load reduction estimation methodology into a user‐friendly tool and user guidance to expand the audience and potential application of LRPT. However, there remain a number of technical concepts and critical decision points that must be evaluated and solved by the user to accurately represent the parcel loading, particularly during the patch delineation and hydrologic routing determination of the site. Use of LRPT by a new user will take time and effort and users should continue to critically evaluate both input and outputs from the tool to minimize user errors and misrepresentations of site conditions and perceived water quality benefits. Final November 2010 p. 34 of 52 Load Reduction Planning Tool (LRPT) v 2 6.
Technical and User Guidance Document Preliminary validation of LRPT was completed by simple area weighted comparisons of average annual runoff and pollutant loading estimates with PLRM outputs that are completed on larger catchment scale. Given the use of PLRM to inform a number of the algorithms in LRPT close agreement of runoff and loading estimates is likely. However, a detailed catchment scale validation of LRPT to improve our confidence in reasonable alignment of loading estimates with PLRM would be useful and require the application of LRPT on a large number of parcels within a specific urban catchment for comparison to PLRM outputs for the same catchment. 8. ACRONYMS AND GLOSSARY LIST OF ACRONYMS BMP RAM Best Management Practice Maintenance Rapid Assessment Methodology C Average annual runoff coefficient CRC Characteristic Runoff Concentration Crediting Program Tahoe Basin Clarity Crediting Program EMC Event Mean Concentration FSP Fine Sediment Particles (<16µm) LRPT Load Reduction Planning Tool LRWQCB Lahontan Regional Water Quality Control Board NDEP Nevada Division of Environmental Protection PLRM Pollutant Load Reduction Model TMDL Total Maximum Daily Load GLOSSARY Annual runoff coefficient (C) Final November 2010 A value between zero and one that accounts for the fraction of precipitation and contributed runoff that is unable to infiltrate or evaporate from a given surface type on an average annual basis and therefore produces stormwater runoff. Impervious surface types have high annual runoff coefficients, whereas pervious surface types have relatively lower annual runoff coefficients. Treatment BMPs in LRPT are assigned annual runoff coefficients calculated based on their storage capacity relative to the contributing impervious area to the Treatment BMP defined by hydrologic routing, where they are located in the Basin and the maintenance commitment of all BMPs at the site as defined by the user. Initial runoff coefficient as presented in Table 1, is calculated for all patches. The initial runoff coefficient will be used for LRPT calculations unless; 1) it is a pervious patch that is relatively small compared to area and amount of water routed to it. In these instances the pervious patch initial C value is adjusted to eliminate large volumes of water being infiltrated by relatively small patches (Table 2); or 2) it is a Treatment BMP. The initial runoff coefficients determined based on storage and MET grid for all Treatment BMPs at a site are adjusted based on the relative maintenance commitment as defined by the user to better represent the average annual runoff coefficient expected over an 18 year time period. p. 35 of 52 Load Reduction Planning Tool (LRPT) v 2 Technical and User Guidance Document Baseline land use condition There are two potential conditions for each land use; baseline and Tier 1. The LRPT user determines the land use type and associated condition that results in the assignment of appropriate average annual CRCs for the pollutants of concern. Baseline conditions are typical Lake Tahoe 2004 private land use conditions where parking and paths on pervious surfaces result in soil compaction and erosion, roof drip lines are bare soil, fertilizer use is excessive and other conditions of a parcel prior to BMP retrofits and source control actions. Benchmark condition Benchmark condition is a term defined in the BMP RAM (2NDNATURE et al 2009) and used to define a Treatment BMP immediately after installation or adequate maintenance. Benchmark condition indicates that the specific processes relied upon for water quality improvement for a Treatment BMP are functioning at their best achievable condition. Biofilter (BF) A pervious substrate with dense native and/or maintained vegetation coverage (>80%). Biofilter designs, such as rain gardens, can augment depression storage to capture, detain, evapo‐transpire and infiltrate urban runoff. Nutrient concentration reductions occur by fixing nutrients via biological processes. The footprint of these surface types are larger than typical infiltration BMPs. Biofilters constructed with depressional storage must include a relatively shallow slope. Characteristic runoff concentration (CRC) Lake Tahoe stormwater pollutant loading models (PLRM and LRPT) express the condition of an urban land use quantitatively as a characteristic runoff concentration (CRC) for pollutants of concern for lake clarity. A CRC is a representative average annual concentration for a pollutant of concern in stormwater runoff from a specific urban land use and its associated condition. In the LRPT, the parcel CRC is combined with the average annual runoff generated from the site to provide an estimate of average annual pollutant load for each pollutant of concern. The land use types included in LRPT are single family residential (SFR), multi‐family residential (MFR) and commercial (CICU). Hydrologic routing Anticipated movement of stormwater runoff through the site. Volumes are routed across the parcel by sequential patches along topographic and hydrologic gradients from high to low. Infiltration feature (IF) Land surface modified to sustain maximum infiltration rates, typically consisting of vertical excavation of native soils and filling with coarse drain rock, prefabricated infiltration units or other highly permeable material. Infiltration features are implemented to reduce volumes generated from adjacent impervious surfaces. Initial Runoff Coefficient Land use condition Final November 2010 See annual runoff coefficient. Land use condition is defined by the LRPT as the average annual state of a land use relative to downslope water quality. A wide range of pollutant source controls are implemented on urban land uses with the intention of improving land use condition and reducing the pollutant generation risk. Examples of pollutant source control actions on private parcels include fertilizer application reductions and erosion control actions such as vegetation planting and maintenance, bank stabilization, or terracing. LRPT includes two potential land use conditions, baseline and Tier 1. p. 36 of 52 Load Reduction Planning Tool (LRPT) v 2 Technical and User Guidance Document Load Reduction Planning Tool (LRPT) version 2 A Microsoft Excel spreadsheet tool written in Microsoft Visual Basic for Applications (VBA) to estimate the potential pollutant load reductions from BMP retrofit projects in Lake Tahoe Basin on a parcel or multiple parcel scale. The LRPT terminology and methodology is consistent with the Pollutant Load Reduction Model (PLRM; nhc et al. 2009), the BMP Maintenance Rapid Assessment Methodology (BMP RAM; 2NDNATURE et al. 2009) and other Lake Tahoe stormwater management tools. Offsite The user must define a common outfall where the runoff generated from the site will accumulate and LRPT calculations are summed. Typically, parcel outfalls are not specific locations but rather the downslope boundary (e.g., the north border of the parcel) and termed in LRPT as “offsite”. Offsite in LRPT is analogous to an outfall as defined by PLRM and the point at which average annual pollutant loads are estimated. Patch Patches are used to spatially delineate the site for hydrologic routing. A patch can contain multiple adjacent surface types that possess similar runoff characteristics to simplify site geometry. Patches constitute the physical area within the site where runoff calculations are made. The sum of the individual patch areas equates to the total site acreage. Patches are characterized by the relative infiltration capability of the surface, as represented by an annual runoff coefficient (C). Pollutants of concern These are fine sediment particles (FSP) (<16 µm), dissolved phosphorous (DP), total phosphorous (TP), total suspended sediment (TSS), dissolved inorganic nitrogen (DN), and total nitrogen (TN). Porous pavement (PP) A durable, pervious surface overlaying a crushed stone base that stores rainwater and allows it to infiltrate into the underlying soil. Porous pavement includes an underlying reservoir to increase infiltration rates. Local stormwater is typically not routed to a porous pavement surface, but rather constructed to minimize the volume of stormwater generated and routed down gradient from a previously impervious surface. Footprint of porous pavement can vary but typically is used to replace parking lots or other impervious surfaces. Post‐retrofit condition The parcel(s) of interest in their post‐improvement condition that includes retrofit actions such as source control improvements, erosion‐control improvement, Treatment BMP installation, etc. At least one post‐retrofit LRPT scenario is required in order to compare improved to unimproved site conditions and estimate the associated load reductions as a result of actions. Pre‐retrofit condition The parcel(s) of interest in their pre‐improvement condition prior to implementation of site retrofit actions including source control improvements, erosion‐control improvement, Treatment BMP installation, etc. Pre‐retrofit LRPT scenarios are required in order to compare improved to unimproved site conditions and estimate the associated load reductions for each post‐retrofit scenario. Receiving patch Runoff Scenario Final November 2010 Terminology used with respect to hydrologic routing. A patch that accepts runoff from a source patch(es) is termed a receiving patch. Not all patches are receiving patches. The rate (volume/time) at which stormwater is generated. LRPT estimates the average annual pollutant loads generated from a site; termed a scenario. The scenario types are either pre‐retrofit which is prior to site improvements or post‐retrofit. The user is able to enter a number of post‐retrofit scenarios for comparison of the estimated load reductions for different retrofit alternatives on the same site. p. 37 of 52 Load Reduction Planning Tool (LRPT) v 2 Source patch Technical and User Guidance Document Terminology used with respect to hydrologic routing. Patches contributing runoff another patch or off site are termed source patches. By definition, all patches are source patches (they all receive rainfall and discharge some fraction as runoff). Tier 1 There are two potential conditions for each land use; baseline and Tier 1. The LRPT user determines the land use type and associated condition that results in the assignment of appropriate average annual CRCs for the pollutants of concern. Tier 1 assumes a number of pollutant source control (PSC) practices have been implemented on the parcel to reduce the application, generation and/or transport of pollutants at their source. PSC include the reduction of fertilizer applications and the implementation of erosion control BMPs such as retaining walls, path or driveway paving, natural vegetative cover, parking lot sweeping and other BMPs to reduce the annual source of sediment and nutrients generated from the site. Treatment BMP A constructed BMP that accepts, attenuates, and treats urban stormwater. Treatment BMPs are implemented to reduce pollutant loads in stormwater by either removing pollutants and/or by reducing surface water volumes. LRPT focuses on 3 different types of Treatment BMPs that are typically installed on commercial or residential parcels to capture and retain stormwater to reduce runoff transported off site. Infiltration features, porous pavement, and biofilters. Treatment BMP condition Treatment BMPs are intended to provide a sink for urban pollutant loads, and a Treatment BMP condition is defined as a continuum of the pollutant load removal capability of a Treatment BMP. Treatment BMP condition is considered to be at benchmark following installation and/or after adequate maintenance. As pollutant loading and treatment occurs during subsequent storm events, the condition of a Treatment BMP gradually declines (2NDNATURE et al. 2009). LRPT quantitatively incorporates the expected decay in water quality performance of the Treatment BMPs as a function of maintenance frequency identified by the user. 9. REFERENCES 2NDNATURE, Environmental Incentives, and Northwest Hydraulic Consultants. 2009. BMP RAM Technical Document, Lake Tahoe Basin. Prepared for the U.S. Army Corps of Engineers. September 2009. http://ndep.nv.gov/bwqp/file/bmp_ram_tech09.pdf 2NDNATURE. 2010. Focused Stormwater Monitoring to Validate Water Quality Source Control and Treatment Assumptions. Final Report. Prepared for U.S. Army Corps of Engineers. March 2010. ftp://2ndnaturellc.com/2ndnature/2NDNATURE_Reports/Lake%20Tahoe/PLRM%20Refinement_FinalPhaseI_Tech
nicalReport.pdf Caltrans. 2003. Storm Water Quality Handbooks: Storm Water Pollution Prevention Plan (SWPPP) and Water Pollution Control Program (WPCP) Preparation Manual. March 2003. http://www.dot.ca.gov/hq/construc/stormwater/SWPPP_Prep_Manual_3_03.pdf Cobourn, J., Capp, C.A., Cecchi,S., Ferry, B., Harrison, E., Jespersen, J, Hogan, M., Larson, E, Pulsifer, M. , Widegren, B and Daryl Witmore, D. no date, How to install best management practices (BMPs) in the Lake Tahoe Basin; Manual for Building and Landscape Professionals. http://www.unce.unr.edu/publications/files/nr/2004/EB0403.pdf Davis, A.P. and R.H. McCuen. 2005. Stormwater Management for Smart Growth. New York: Springer Books. Dunne, T. and L.B. Leopold. 1978. Water in Environmental Planning. New York: W.H. Freeman and Company. Final November 2010 p. 38 of 52 Load Reduction Planning Tool (LRPT) v 2 Technical and User Guidance Document Lahontan Regional Water Quality Control Board (LRWQCB) and Nevada Department of Environmental Protection (NDEP). Lake Tahoe TMDL Pollutant Load Reductions Opportunity Report. March 2008 v.2.0. http://www.waterboards.ca.gov/rwqcb6/water_issues/programs/tmdl/lake_tahoe/docs/presentations/pro_repor
t_v2.pdf Northwest Hydraulic Consultants (nhc), Geosyntec Consultants, and 2NDNATURE. 2009. PLRM Model Development Document. Prepared for Lake Tahoe Basin Storm Water Quality Improvement Committee. South Lake Tahoe. CA. Available for download, as well as full source code and other supporting documents, from www.tiims.org. APPENDIX A. LRPT V2 TUTORIAL PURPOSE Familiarize participants with the usability, functions and outputs of LRPT. The user should have the complete LRPTv2 Technical and User Guidance Document readily available for reference. HYPOTHETICAL SITUATION A single family residential parcel in South Lake Tahoe4 is scheduled for retrofit improvements. The site currently includes minimal TRPA parcel‐based BMPs to reduce sources and generation of the pollutants of concern (sediment and nutrient species). Based on recommended BMP practices and private parcel improvements, one post‐retrofit alternative has been developed that includes a series of Treatment BMPs and source control improvements. The site retrofit alternative will include a number erosion control actions to reduce the sediment generation from the site, the removal of all non‐native vegetation and reduction of fertilizer use. Post‐retrofit, a detailed maintenance plan will be developed and resources allocated to ensure that Treatment BMPs continue to function at their full performance level. You are tasked with using LRPTv2 to estimate the water quality benefits of the retrofit alternative for this site. EXAMPLE RETROFIT SITE Figures 9‐11 present the final maps and data the user will generate for each scenario during LRPT STEPs 1‐4. •
•
•
•
Figure 9A is a schematic of the site pre‐retrofit and figure 9B is a plan view of the site. The parcel is located in MET Grid 847. Figure 10 is the pre‐retrofit site map delineated into patches per LRPT STEP 3 and each patch has been assigned a unique ID. Figure 11 is the pre‐retrofit site map delineated and hydrologic routing contributions (STEP 4) noted for all connected patches. Figure 12 is a post‐retrofit scenario map that includes both patch delineation and hydrologic routing contributions. It is possible to develop and run a number of post‐retrofit scenarios to optimize retrofit design based on the water quality benefit as estimated by LRPT. 4
This parcel is the example parcel in the “How to install best management practices (BMPs) in Lake Tahoe; A guide for building and landscape professionals” (Cobourn et al.) Final November 2010 p. 39 of 52 Load Reduction Planning Tool (LRPT) v 2 Technical and User Guidance Document This exercise will allow you to implement components of each of the LRPT STEPs to demonstrate the functionality of the tool. LRPT STEPs 1‐4 are inherently the most time consuming. In the interest of time, the exercise is structured so that you will complete components of STEPs 1‐4, but the majority of the exercise focuses on interaction with the spreadsheet program. This section contains references to Section 5 of the User Guidance, so users should have the document on hand when beginning the exercise. LRPT STEP STEP 1 STEP 2 STEP 3 STEP 4 STEP 5 STEP 6 STEP 7 STEP 8 Description
Specify parcel boundaries
Define scenario and site conditions
Delineate patch boundaries and hydrologic linkages
Assign hydrologic routing contributions
Populate LRPT spreadsheet and run simulation
Repeat steps 2 –5 for all desired scenarios
Compare runoff and pollutant loads
Generate LRPT summary report
PROTOCOLS: What you need: •
1 computer with LRPT tutorial files. The tutorial files along with a blank version of LRPTv2 called ‘LRPTv2’are posted on the LRPT file sharing site http://2ndnature.centraldesktop.com/2nfilesharing/doc/10276628/w‐LrptV2 along with the final LRPTv2 MS Excel File and the Technical and Guidance Document. If this link is not active, contact the TRPA Erosion Control Team to obtain documentation, tool and tutorial. •
•
•
•
•
Microsoft Excel (2007 version) Hard copy of LRPTv2 Technical and User Guidance Document (Final November 2010) TAC training packet Pen/Pencil Calculator EXERCISE INSTRUCTIONS You will use the diagrams provided to answer the questions and populate the LRPT spreadsheet. The LRPT spreadsheet consists of 4 Input Tables and 2 output tables that will be populated as you progress through the 7 steps for the exercise. You have two LRPT MS Excel files with the Input Tables partially populated. You will use one file for the pre‐retrofit scenario and the other for the post‐retrofit scenario. Open the file named LRPTv2_trainingPre. For LRPT to run, users must ensure that macros are enabled in Excel. 1.
2.
3.
Open Excel 2007 and click the Office button in the upper left corner of the screen. At the bottom of this menu, click the Excel Options button. Click the Trust Center button on the left. Then, at the bottom right, select Trust Center Settings. In the new window that appears, choose Macro Settings from the sidebar and select Disable all macros with notification from the list of options that appear. This option keeps macros disabled but notifies users Final November 2010 p. 40 of 52 Load Reduction Planning Tool (LRPT) v 2 4.
5.
Technical and User Guidance Document when macros attempt to run, allowing users to decide on a case‐by‐case basis which macros to enable. Click OK to exit this window. For the new settings to take effect, it will be necessary to close Excel and reopen it. A security dialog box should appear beneath the Office ribbon the next time you attempt to run a spreadsheet that contains macros. When the notification appears, click the Options button. Choose Enable this content from the options that appear to allow macros to run within the current spreadsheet. Click OK to close the window. STEP 1. SPECIFY PARCEL BOUNDARIES The entire site boundaries where BMP retrofit improvements are planned should be determined using GIS, AutoCAD or other mapping program, site visits/site surveys, and/or engineering plans. The user needs to obtain the site address, create a site ID, determine total site area in ft2, and utilize Figure 3 in the User Guidance Document to select the most representative MET GRID for the site. The MET grid is used by LRPT to determine average annual precipitation (in/yr) and the annual precipitation is held constant for all LRPT scenarios conducted for the subject site. Examine the site diagrams provided in Figures 9 and 10 to complete the SITE Input Table Which direction will water drain from the site? ______________ What is the total site area (ft2?) __________________ STEP 2. DEFINE SCENARIO AND SITE CONDITIONS The LRPT estimates the average annual pollutant load reductions for pre and post‐retrofit scenario pairs. For each site of interest, the pre‐retrofit scenario and at least one post‐retrofit scenario are required. The user can input multiple post‐retrofit scenarios in order to compare alternatives based on the estimated water quality benefits. Final November 2010 p. 41 of 52 Load Reduction Planning Tool (LRPT) v 2 Technical and User Guidance Document The user specifies a unique ID for each scenario, whether a scenario is pre or post‐ retrofit, the land‐use type, and the land‐use condition. Users can refer to the hypothetical situation description and the appropriate User Guidance sections for information on specifying land‐use type and condition. A scenario also includes specification of a maintenance commitment level for Treatment BMPs which provide a sink for urban pollutants. As pollutants, debris and other material are introduced during storms, the condition of a Treatment BMP designed to infiltrate water gradually declines over time. The LRPT simulations incorporate estimated Treatment BMP infiltration decay corresponding to declining condition over time, but take into account adjustments in the decay rate by allowing the user to specify the Treatment BMP maintenance effort in the Scenario Table. At the SCENARIO Input Table, enter the missing information in the appropriate fields based the hypothetical situation described above and the sectiond of the User Guidance Document on land use and land use condition. When all of the fields have been populated, click the ‘Save Scenario’ button. A change in any of the SCENARIO Input Table fields will constitute a new scenario. Users must enter a unique ‘Scenario ID’ for each new scenario and click the ‘Save Scenario’ button for each one. Users may add up to 6 scenarios for evaluation with a single worksheet and should save additional worksheets to run more scenarios. Complete the Scenario Input Table in the LRPT worksheet What information indicates the BMP maintenance effort level for this scenario? _____________________________________ STEP 3. DELINEATE PATCH BOUNDARIES AND HYDROLOGIC LINKAGES For step 3, examine the diagrams in Figure 9. You will use the information from this step to populate the LRPT Input Tables in step 5. LRPT relies on user delineation of ‘patches’ of similar surface types and specification of hydrologic routing. Patches constitute the physical area within the site where runoff calculations are made. The sum of the individual patch areas equates to the total site acreage. Mapping should be initiated in the office using GIS, Google Earth, AutoCAD or another mapping program, with preliminary patch delineation conducted to the extent possible. Engineering plans may also be useful in determining the location and sizing of Treatment BMPs for relevant scenarios. The draft map should then be field verified at the site to confirm the existing conditions, parcel delineation and identify flow Final November 2010 p. 42 of 52 Load Reduction Planning Tool (LRPT) v 2 Technical and User Guidance Document directions from patch to patch. Patch types should be labeled with the appropriate prefix listed in Table 1 of the User Guidance. Attempts should be made to reduce complex geometries to simple polygons while preserving the site surface area. In the majority of cases, the visual distinction between various surface types and their relative permeability will be readily apparent, but in some instances, based on best professional judgment, infiltration measurements or other means to gain additional information on the surface type and most appropriate annual runoff coefficient may be necessary. One or more surface types can be lumped into distinct patches based on similar expected annual runoff coefficients (i.e., permeability; see Table 1 in the User Guidance). The user should focus the detail of parcel delineation on the location, sizing and hydrologic routing of constructed Treatment BMPs, as these are the features installed and maintained at the site to provide a water quality benefit downslope. Impervious and many pervious surface types can be lumped into a single patch if: 1. The surface types are identified to possess the same relative permeability; 2. They are adjacent or in very close proximity; and 3. Consolidation of surface types simplifies site geometry while preserving the general hydrologic routing processes of the subject parcel. While on site, the user should conceptualize the entire redevelopment site in a holistic manner, by first identifying which portions of the site are (1) up‐gradient versus down‐gradient (site slope), and (2) which portions are raised or elevated above adjacent areas (buildings, structures, etc.). Runoff will always flow from higher to lower elevations. The user should consider hydrologic connections between the site and offsite areas: are there storm drains or other conveyance features onsite that route directly offsite? If there is an offsite BMP, what is the hydrologic connection between onsite areas and the offsite BMP? Only after the user has identified the overall hydrologic routing of the redevelopment site should they begin the iterative task of delineating patches and hydrologic routing linkages. Rules for delineating patches: 1.
2.
3.
4.
5.
6.
7.
Pervious or impervious surface types that have permeability adjacent to one another can be lumped to simplify site delineation and hydrologic routing (see Table 1 of the User Guidance for similar surface types). Each patch is a Source Patch – every patch receives precipitation and is a source for runoff. Runoff is routed to either an adjacent Receiving Patch or Offsite. Each patch has slope, elevation, or other characteristic that will determine routing of runoff generated from it to another patch or offsite. Begin patch flow assignments by starting at the highest elevation within the redevelopment site and work down‐gradient. This means that the first patches defined will be those that do not receive runoff contributions from other patches (i.e., are source patches only). Flow cannot be circular between patches – Runoff is always one‐way and down‐gradient. If runoff from Patch 1 flows to Patch 2, runoff cannot flow from Patch 2 (or any patches connected hydrologically to Patch 2) back to Patch 1. If the site appears to be completely flat, identify offsite as the adjacent public right away (e.g. city road) or road surface and assume that direction is down‐gradient. The goal is to create the minimum number patches required to represent the overall hydrology of the site. Do not subdivide patches unless not doing so results in circular flow. See Figures 6 and 7 in the User Guidance Document for more information. LRPT allows up to 30 patches to be defined for a scenario. If the site requires more than 30 patches the user will have to divide the site and model the scenario as two. Examine the site map in Figure 9. What are the patch types of surfaces accepting roof runoff? ________ Final November 2010 p. 43 of 52 Load Reduction Planning Tool (LRPT) v 2 Technical and User Guidance Document On Figure 9B, label the impervious patches with ‘IM’ STEP 4. ASSIGN HYDROLOGIC ROUTING CONTRIBUTIONS Runoff from patches is controlled by three distinct components: the rate at which water accumulates on the patch from direct rainfall and contributing patches, the area of the patch, and the annual runoff coefficient of the patch. All patches accumulate water from direct precipitation. Receiving patches also accumulate water that runs off adjacent patches as defined through hydrologic routing in the LRPT. The LRPT user specifies the contribution of each upslope source patch to each down slope receiving patch. Note: LRPT assumes no runoff is generated from adjacent parcels (i.e., offsite up‐gradient) and routed to the site. Water (i.e., mass) is conserved as runoff is routed through the parcel and across patches. By defining the hydrologic routing of a parcel, Treatment BMPs can be strategically placed to retain runoff generated from patches with relatively high annual runoff coefficients (see Table 1 in User Guidance). In Figure 11, all of the patches have been delineated and routing contributions determined. Review this figure and notice areas where patches are lumped and/or defined and the specified flow routing directions/contributions to adjacent patches. Compare Figure 10 to Figure 11 and note the differences. Which patches does patch CP2 contribute runoff to? ______________________________ Which patch does runoff from most other patches flow to before exiting the site? ___________________ STEP 5. POPULATE THE LRPT INPUT TABLES AND RUN SIMULATION At this point you should have already populated the Site and Scenario LRPT Input Tables and saved the scenario. You are now ready to populate the remaining input tables in the LRPT spreadsheet. At the PATCH DATA Input Table, the user specifies characteristics of patches that are used to calculate the annual runoff coefficient for each patch. Each patch should have a unique ID that follows the naming conventions shown in Table 1 in the User Guidance (e.g. IM1 for the first impervious patch). The user should enter patches beginning from those at the uppermost elevation that only receive rainfall and no runoff inputs from other patches, such as roofs. The user fills in Input Table 3 from left to right, with no blank spaces. Patches to the right are down slope of patches to the left. The user should ensure that if a patch receives runoff from another patch, the patch that it receives runoff from (e.g. its source patch) is listed earlier (on the left side) in the table. This is an important rule to follow, since LRPT can’t calculate a contribution from a patch without first calculating the contribution to that patch from others. Final November 2010 p. 44 of 52 Load Reduction Planning Tool (LRPT) v 2 Technical and User Guidance Document The user selects the surface type from the pull down menu and enters the surface area of each patch in units of square feet by referring to the site diagram. For porous pavement surfaces, the user specifies depth and voids pace. For biofilters and infiltration features, the user specifies the storage as the quotient of the design volume and the source impervious area : Infiltration Feature and Biofilter Storage (inches rainfall) = {(Design Volume of Infiltration Facility [ft3]) / (Source Impervious Area [ft2])} *(12 [inches/feet]) The level of Treatment BMP maintenance effort accounts for decline of their performance over the 18 year simulation period. See table 3 for guidance in selecting a maintenance effort level for a scenario. Troubleshooting: If information is changed after patches have been saved, the user should delete the worksheet that was created when the patches were incorrectly saved, make the appropriate changes in the Patch Data Input Table, and save the patches again. When all of the fields are populated, click the ‘Calculate C’ button to return the runoff coefficients (C) for each patch. The runoff coefficient values for treatment BMPs that have been adjusted for performance decline over time are shown below the ‘Initial runoff coefficients’ (Ci). After the C values are calculated the user can save the patch data by clicking the ‘Save Patches’ button. A separate worksheet tab is created that stores the patch data each time the ‘Save Patches’ button is clicked (e.g. ‘Patches1’). The runoff coefficient values and all of the other patch information must be filled in when the user saves the patches. Complete the PATCH DATA Input table in the LRPT spreadsheet by filling in the highlighted cells. Final November 2010 p. 45 of 52 Load Reduction Planning Tool (LRPT) v 2 Technical and User Guidance Document The HYDROLOGIC ROUTING Input Table requires the user to specify the percent contribution from each source patch to each receiving patch. The routing Input Table matrix is automatically populated when the user clicks the ‘Save Patches’ button for the previous input table. The source patches are listed along the top row and receiving patches are listed along the left hand column. Scroll down to the bottom of the table to see the offsite routing and the routing totals, which should total 100 for each column. Troubleshooting: If information is changed after the routing is saved, Click the ‘Save Routing’ button to save the hydrologic routing network delete both the worksheet tabs currently displayed in the table. If the user has not saved the patches with the current patch data currently displayed in the patches table, an error message will appear (Patches) and the routing when the user clicks the ‘Save Routing’ button. If this occurs, return to configuration (Qcalcs). Re‐save the the patch data input table and save the current patch configuration Patch Data Table, make the before clicking the ‘Save Routing’ button. LRPT creates a new appropriate changes, and re‐save worksheet tab with the routing data every time the ‘Save Routing’ the Hydrologic Routing Input Table button is clicked (e.g. ‘Qcalcs1’). Double check the site diagrams to ensure that routing directions and contributions have been correctly assigned for each patch, as incorrect routing can lead to incorrect runoff and loading calculations. Final November 2010 p. 46 of 52 Load Reduction Planning Tool (LRPT) v 2 Technical and User Guidance Document Complete the HYDROLOGIC ROUTING Input Table by filling in the highlighted cells. Explain why each column in the routing matrix should sum to 100% ________________________________________________________________________________ Simulation results for each scenario are stored in the RESULTS SUMMARY Output Table. The program will take up to 1 minute to run, and when complete will display annual runoff and pollutant loading estimates for an 18 year simulation period. Click the ‘Run Scenario’ button in the Results Summary Table. What is your calculated pre‐retrofit runoff Q (ft3/yr)? __________ STEP 6. REPEAT FOR POST‐RETROFIT SCENARIO You are now ready to populate the LRPT with post‐retrofit scenario data. The post‐retrofit design alternative has been completed and all necessary site information is provided in Figure 12. Review Figure 12 and notice where Treatment BMPs have been placed and how routing at the site has changed. To save time, an LRPT spreadsheet has been partially populated for you to reflect changes in the patches and hydrologic routing shown in Figure 12. Additional information to complete the post‐retrofit scenario: •
•
The source patch to infiltration feature (IF2) is the roof IM2 and generates 31 cf of runoff. The treatment capacity of IF2 is 23 cf. The pervious pavement surface (PP1) has a reservoir depth of 5 inches and the media is fine gravel with a void space of 20%. Open the spreadsheet file LRPTv2_trainingPost.xlsm. Complete the Patch Data Input Table and the Hydrologic Routing Input Table by filling in the highlighted cells the same way that you completed these tables for the pre‐
retrofit scenario. STEP 7. COMPARE RUNOFF AND POLLUTANT LOADS For each site, a pre‐retrofit scenario and at least one post‐retrofit scenario are required. A user can input multiple post‐retrofit scenarios in order to compare parcel improvements. The user can compare various patch configurations and BMP types as different scenarios at a site to optimize design for the maximum water quality benefits. Make sure that results are displayed for your pre‐retrofit and post‐retrofit scenarios in the LRPT spreadsheet Results Summary Table. Move to the RESULTS COMPARISON Output Table in the LRPT spreadsheet. To examine runoff and pollutant loading changes due to retrofit improvements, select the user should select the Final November 2010 p. 47 of 52 Load Reduction Planning Tool (LRPT) v 2 Technical and User Guidance Document pre‐retrofit scenario as the initial scenario and the post‐retrofit scenario as the final scenario. With this configuration, negative runoff and pollutant load change values indicate decreases from the initial to the final scenarios. Use the pull down menus to select your initial and final scenarios for comparison and click the ‘Compare Results’ button. What is the post‐retrofit runoff Q (ft3/yr)? __________ What is the annual runoff volume change from the pre‐retrofit to the post‐retrofit scenario Q (ft3/yr)? _________________ What is change in FSP loading from the pre‐retrofit to the post‐retrofit scenario? __________ Final November 2010 p. 48 of 52 Example site; pre-retrofit (taken from Cobourn et al)
FIGURE 9A
FIGURE 9B
unprotected drip lines
10’
deck
unprotected drip lines
30’
roof
unprotected
soil
beneath
deck
roof
50’
10’
30’
unprotected drip lines
10’
25’
compacted walkway
steep,
eroding
bare
slope
15’
Parcel Slope
4%
unpaved
driveway
10’
Pre retrofit site Schematic and map
30’
parking
on bare
soil
FIGURE 9
pre-retrofit Patch Delineation (LRPT STEP 3)
150’
unprotected drip lines
5’
CP3
10’
IM1
deck
CP2
CP4
unprotected
soil
beneath
deck
100’
unprotected drip lines CP3
roof
30’
IM1
IM3
roof
CP5
560 ft2
50’
10’
30’
IM2
10’
CP4
CP2
580 ft2
compacted walkway
unprotected drip lines
steep,
eroding
bare
slope
25’
15’
CP1
CP1
30’
Parcel Slope
4%
remaining area: MP1
10’
unpaved
driveway
Pre-Retrofit Site PATCH Delineation
parking
on bare
soil
FIGURE 10
pre-retrofit Flow routing (LRPT STEP 4)
150’
unprotected drip lines
10’
5’
CP3
100%
80%
IM1
deck
CP2
unprotected
soil
beneath
deck
100’
CP5
560 ft2
20%
unprotected drip lines CP3
roof
30’
100%
IM1
IM3
roof
100%
100%
50’
CP4
compacted walkway
580 ft2 unprotected drip lines
10’
30’
IM2
100%
10’
25’
steep,
eroding
100%
bare
slope
15’
CP1
CP1
30’
Parcel Slope
4%
remaining
area: MP1
100%
10’
unpaved
driveway
parking
on bare
100% soil
offsite
East
Pre-retofit flow routing
FIGURE 11
post-retrofit Patch delineation and Flow routing (LRPT STEPs 3 & 4)
150’
100%
infiltration feature
10’
5’
IF4
100%
IM1
deck
IF5
infiltration
feature
beneath
deck
100%
100’
BF1
560 ft2
roof
30’
5’
100%
IM1
IM3
roof
100%
50’
100%
infiltration feature
IF3
5’
IM2
100%
25’
PP1
305 ft2
100%
100%
Parcel Slope
4%
remaining
area: MP1
30’
10’
100%
terraced
slope, native
vegetation
IF4
infiltration feature
5’
3’
100%
IF1
5’
IF2
4’
100%
15’
IM4
100%
100%
slotted channel drain
100%
10’ paved
driveway
IM5
100%
offsite
East
Post-retofit site patch delineation and flow routing
FIGURE 12