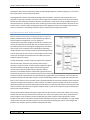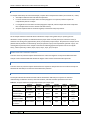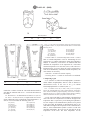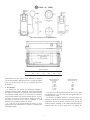
1
Lake Tahoe Pollutant Loading Reduction Model (PLRM) Database Refinement
Final Phase II Monitoring Plan
Prepared for: USDA Forest Service Pacific Southwest Research Station
July 2010
This research was supported through a grant with the USDA Forest
Service Pacific Southwest Research Station and using funds provided
by the Bureau of Land Management through the sale of public lands
as authorized by the Southern Nevada Public Land Management Act.
http://www.fs.fed.us/psw/partnerships/tahoescience/
The views in this report are those of the authors and do not necessary reflect those of the USDA Forest Service Pacific Southwest
Research Station or the USDI Bureau of Land Management.
ECOSYSTEM
SCIENCE + DESIGN
321 Frederick Street
Santa Cruz, California 95062
p 831.426.9119 f 831.421.9023
w 2ndnatureinc.com
PLRM v1 Database Refinement: FINAL Phase II Monitoring Plan p. i TABLE OF CONTENTS Chapter One. Introduction ............................................................................................................................................ 1 SNPLMA Data Collection Purpose .............................................................................................................................. 1 BACKGROUND ........................................................................................................................................................... 2 Goals of SNPLMA Data Collection .............................................................................................................................. 5 Chapter Two. Data Collection Strategy .......................................................................................................................... 6 Land Use Monitoring ................................................................................................................................................. 6 SWT Monitoring ....................................................................................................................................................... 19 PLRM Model Development ...................................................................................................................................... 38 Chapter Three. Sample Delivery and Analyses ............................................................................................................ 40 Water Quality Samples ............................................................................................................................................ 40 Soil Samples ............................................................................................................................................................. 41 Chapter Four. Data Management ................................................................................................................................ 42 Chapter Five. Field Protocols ....................................................................................................................................... 44 Attached Protocols .................................................................................................................................................. 45 Attached Datasheets ............................................................................................................................................... 45 Chapter Six. References ............................................................................................................................................... 46 PROTOCOLS ..................................................................................................................................................................... FIELD DATASHEETS .......................................................................................................................................................... APPENDIX A. WETLab Quality Assurance Plan ................................................................................................................. APPENDIX B. Cooper Laboratory Documentation ........................................................................................................... 2NDNATURE, LLC
500 Seabright Avenue Suite 205 Santa Cruz CA 95062 p 831.426.9119 w 2ndnaturellc.com
PLRM v1 Database Refinement: FINAL Phase II Monitoring Plan p. ii LIST OF TABLES 1.1 2.1 2.2 3.1 3.2 SNPLMA Monitoring Project Schedule..........................................................................................................
Urban Road Monitoring Road Segments.......................................................................................................
SWT Monitoring Site Instrumentation ..........................................................................................................
Analytical Laboratory Sample Requirements per Analysis Type ...................................................................
Type and Frequency of QA/QC Samples .......................................................................................................
1
8
31
41
42
LIST OF FIGURES 2.1 2.2 2.3 2.4 2.5 2.6 2.7 2.8 2.9 2.10 2.11 2.12 2.13 2.14 4.1 Urban Road Monitoring Data Collection Schematic.....................................................................................
Urban Road Monitoring Road Segments ‐ Overview....................................................................................
Urban Road Segments: South Shore (A), East & North Shore (B), West Shore (C).......................................
Portable Simulator Used in Controlled Urban Road Experiments................................................................
SWT Monitoring Site Location Map ..............................................................................................................
Osgood Basin Monitoring Locations.............................................................................................................
Park Avenue Basins Monitoring Locations ...................................................................................................
Rocky Point South Basin Monitoring Locations ............................................................................................
Blue Lakes Basin Monitoring Locations ........................................................................................................
Eloise Basin Monitoring Locations ................................................................................................................
Wildwood Basin Monitoring Locations.........................................................................................................
Coon Street Basin Monitoring Locations ......................................................................................................
SWT Sampling Schematic ..............................................................................................................................
Cross Section Schematics of SWT Sample Collection – Winter 2010 ...........................................................
Study Database Structure .............................................................................................................................
2NDNATURE, LLC
500 Seabright Avenue Suite 205 Santa Cruz CA 95062 p 831.426.9119 w 2ndnaturellc.com
7
9
10
15
21
22
24
25
27
28
29
30
34
35
43
PLRM v1 Database Refinement: FINAL Phase II Monitoring Plan p. 1 CHAPTER ONE. INTRODUCTION PHASE II DATA COLLECTION PURPOSE AND SCHEDULE The USDA Forest Service Pacific Southwest Research Station awarded 2NDNATURE a grant using SNPLMA Round 9 funding to build upon the data collection strategy and initial data collection efforts funded by the US Army Corps of Engineers (ACOE) during 2009. The ACOE research is Phase I and the SNPLMA research Phase II of the PLRM Database Refinement Study. The 2NDNATURE Team designed the data collection strategy to test and inform a number of assumptions within the current suite of Lake Tahoe urban stormwater management tools, particularly PLRM, but also the BMP RAM and Road RAM. The Monitoring Plan for the ACOE Lake Tahoe PLRM Database Refinement Study (2NDNATURE 2009a) was submitted to the ACOE in July 2009 following the completion of the Phase I data collection efforts to ensure an accurate summary of the complete data collection strategy. The Phase I Monitoring Plan (2NDNATURE 2009a) includes monitoring goals and objectives, site selection justification, detailed instrumentation and field monitoring protocols, sample QA/QC requirements, and data management specifications. The Phase I data collection effort was limited, extending from December 2008 through July 2009, and the PLRM Technical Advisory Committee (PLRM TAC) is currently reviewing the draft Phase I Technical Report (2NDNATURE 2009c). The greatest value of the ACOE effort was the initiation of a focused and cost‐effective data collection, data management and data analysis strategy to begin to directly inform PLRM and the supporting stormwater rapid assessment tools (BMP RAM and Road RAM). This SNPLMA‐funded Phase II Lake Tahoe PLRM Database Refinement Monitoring Plan builds directly upon the Phase I research effort and the monitoring project schedule is provided in Table 1.1. Urban road and SWT monitoring methods and protocols will be implemented through the Spring of 2011 to expand the dataset and continue to improve the science underlying the current versions of the Lake Tahoe urban stormwater management tools. This document provides the rationale and details the data collection protocols that will be implemented by the 2NDNATURE team to achieve the goals of Phase II of the PLRM Database Refinement Study. The final product will be a technical report that synthesizes the data collection, provides analysis of key findings, and presents potential recommendations for refinements to the PLRM algorithms and assumptions, as appropriate. Table 1.1. Phase II Monitoring Project Schedule. 1 2 3 4 Task Revise and update Phase I Monitoring Plan. Conduct and summarize PAC meeting. Revise and finalize Phase II Monitoring Plan. Instrument stations. Maintain stations over course of project. Collect controlled experiment data. Collect event‐based sampling data. Manage data. Test, validate and refine PLRM. Analyze data. Draft Technical Report. Present Technical Report to PAC. Produce Final Technical Report. Begin End Complete Complete Jan 10 July 10 Complete Sept 09 Jan 10 Jan 10 Jan 10 Jan 10 Jan 10 Jul 11 Nov 11 Dec 11 Jun 11 Jun 11 Jun 11 Jun 11 Jun 11 Jun 11 Nov 11 Dec 11 Feb 12 2NDNATURE, LLC
500 Seabright Avenue Suite 205 Santa Cruz CA 95062 p 831.426.9119 w 2ndnaturellc.com
PLRM v1 Database Refinement: FINAL Phase II Monitoring Plan p. 2 The 2NDNATURE Team conducted some of the monitoring and site instrumentation for this SNPLMA research in the Fall 2009 and Winter 2010 prior to the release of this Final Monitoring Plan. The research team decided this action was warranted due to the urgency to ensure collection of Winter 2010 data and the identified cost‐
effectiveness to complete and release the draft of ACOE‐funded Phase I data analysis (2NDNATURE 2009c) and technical report prior to finalizing the continued SNPLMA research approach and associated protocols. BACKGROUND Northwest Hydraulic Consultants (nhc), 2NDNATURE, and Geosyntec Consultants (nhc et al. 2009a, 2009b) released the initial version of the Pollutant Load Reduction Model (PLRM v1) in October 2009 through grants provided by the US Army Corps of Engineers (ACOE) and the Nevada Division of Environmental Protection (NDEP). The latest versions of the PLRM software and supporting documentation area available for download at: http://www.tiims.org/TIIMS‐Sub‐Sites/PLRM/docs‐downloads.aspx The PLRM provides Lake Tahoe resource managers with a tool to compare urban stormwater quality improvement alternatives in an urban catchment based on the predicted load reductions of the pollutants of concern. The PLRM estimates pollutant concentrations in urban catchments using two primary water quality algorithms: Characteristic Runoff Concentrations (CRCs) and Characteristic Effluent Concentrations (CECs). These concentrations are multiplied by the predicted runoff volumes at either the catchment outlet using CRCs or the outlet of a stormwater treatment BMP (SWT) using CECs to estimate average annual pollutant loads for each modeled alternative water quality improvement project. The priority limitation with respect to water quality algorithms in the initial version of the PLRM is minimal fine sediment particle (FSP < 16um) stormwater data available to inform the PLRM CRCs and CECs. The primary data sources used to inform PLRM v1 included previous Lake Tahoe stormwater quality monitoring datasets compiled and integrated from a variety of sources. The available stormwater data was collected to meet a myriad of data collection goals and objectives, and therefore does not perfectly align with the goals and objectives of the PLRM. This research is intended to directly inform the PLRM v1 assumptions and algorithms, particularly with respect to FSP, to continue to improve the predictive power of this model. LAND USE CRC (CHARACTERISTIC RUNOFF CONCENTRATION) The PLRM quantifies pollutant generation from an urban land use and associated land use condition. Urban land use types include single family residential, multi‐family residential, commercial, primary roads, and secondary roads, etc. Condition is defined as the existing state of a land use relative to the pollutant generation risk during a subsequent storm and is the integration of physiographic characteristics, pollutant source controls, and the effectiveness of pollutant recovery efforts. A wide range of pollutant source controls are implemented on urban land uses with the intention of improving condition and reducing the pollutant generation risk. In the PLRM, the condition of an urban land use is correlated to a characteristic runoff concentration (CRC) for pollutants of concern for lake clarity. A CRC is a representative concentration for a pollutant of concern in stormwater runoff from a specific urban land use and its associated condition. CRCs are combined with continuous runoff hydrology from the PLRM to provide a representative estimate of average annual pollutant loading for specific land use conditions. PLRM v1 assumes that significant pollutant load reduction opportunities exist as a result of improving urban road management to protect water quality. The PLRM Road Methodology (nhc et al. 2009a) predicts likely road condition and associated CRCs from urban roadways. The SNPLMA monitoring efforts will continue to expand the urban road data collection initiated by the ACOE funded efforts. In addition, the researchers may apply cost‐
2NDNATURE, LLC
500 Seabright Avenue Suite 205 Santa Cruz CA 95062 p 831.426.9119 w 2ndnaturellc.com
PLRM v1 Database Refinement: FINAL Phase II Monitoring Plan p. 3 effective sampling techniques to other key urban land use types to improve our understanding of FSP generation and transport on urban lands. ROAD RAM The Road Rapid Assessment Methodology (Road RAM) is a tool that is under development for the Lake Tahoe stormwater community to rapidly evaluate the relative condition of an urban roadway using simple, repeatable and cost‐effective techniques1. The Road RAM will be complementary and consistent with PLRM terminology, road characteristics, pollutant source and sink factors and final road condition evaluation scores. While PLRM provides likely average annual road condition scores, the Road RAM allows discrete temporal and spatial condition evaluations of urban road segments. The urban road monitoring efforts conducted during Phase I data collection (2NDNATURE 2009c) and to be continued under Phase II have been designed to directly inform many aspects of the Road RAM tool as well, including road risk development, RAM observation protocols and RAM scoring calculations. CEC (CHARACTERISTIC EFFLUENT CONCENTRATIONS) The PLRM provides a function to estimate the performance of a stormwater treatment BMP (SWT) by assigning a characteristic effluent concentration (CEC) depending on the type of SWT and fundamental design parameters. An SWT is defined as a Treatment BMP that reduces pollutants of concern from a concentrated stormwater flow path. PLRM estimates the CEC from 6 specific SWT types: dry basin, wet basin, infiltration basin, treatment vault, cartridge filter, and bed filter. Based on SWT type, there are specific key design parameters the user inputs into the model and which affect the CEC estimates. These key SWT design parameters include water quality volume (ft3), footprint (ft2), infiltration rate (in/hr), draw down time (hr), and minimum hydraulic residence time (hr), among others, and vary with the SWT type (see PLRM User Manual (nhc et al. 2009b) for details). PLRM provides some guidance and suggested ranges for each input parameter; however, the modeler chooses the specific inputs based on the average expected condition over the lifespan of the SWT, based on anticipated maintenance practices. PLRM assumes reasonable maintenance is performed to ensure acceptable water quality treatment function of each SWT. There exists a significant lack of understanding of how SWT condition influences expected water quality treatment performance, but Lake Tahoe resource managers and research personnel agree upon the need for continued and strategic maintenance of the SWT to maintain the expected pollutant load reductions. When combined with continuous runoff hydrology from the PLRM, CECs provide a representative estimate of average annual pollutant loading at the outlet of a SWT. The ACOE research developed specific data collection and data analysis techniques to test, validate and continue to improve PLRM CEC values based on SWT type and key design parameters. The SNPLMA resources will be used to continue the implementation of these sampling techniques, while expanding the number of SWTs monitored. 1
The Road RAM tool is being developed by the 2NDNATURE team, funded by the California Tahoe Conservancy and Nevada Department of Environmental Protection, with the initial version public release expected in the Fall of 2010. 2NDNATURE, LLC
500 Seabright Avenue Suite 205 Santa Cruz CA 95062 p 831.426.9119 w 2ndnaturellc.com
PLRM v1 Database Refinement: FINAL Phase II Monitoring Plan p. 4 BMP RAM The 2NDNATURE Team developed the Best Management Practice Maintenance Rapid Assessment Methodology (BMP RAM) to assist Lake Tahoe natural resource managers in determining the relative condition of urban stormwater Treatment BMPs (2NDNATURE 2009b). The primary purpose of the BMP RAM is to inform the user of the relative urgency of water quality maintenance for Treatment BMPs. The BMP RAM provides a practical, consistent and reliable field observation and data management tool to track the condition of a particular Treatment BMP, relative to its observed condition at time of installation or immediately following complete maintenance. Treatment BMP condition is based on the results of rapid field observations that serve as reliable proxies for the treatment processes relied upon by a distinct BMP Type. The treatment processes include infiltration, particle capture, nutrient cycling and/or media filtration. The BMP RAM consists of six distinct STEPs implemented by the user, each of which required data collection, database population and decision making. Field personnel will perform the BMP RAM tool regularly on each SWT to document the relative condition. The BMP RAM results will begin to inform our understanding of how maintenance urgency may impact CECs and treatment volumes, as well as how condition and the associated treatment performance change over time. SWT INFILTRATION RATES PLRMv1 requires the user to input the average annual infiltration rate for the specific SWT types that rely upon infiltration to reduce stormwater loads (i.e., dry basin, infiltration basin and bed filters). The calculation of an average annual infiltration rate for a SWT requires a long‐term continuous water budget and is difficult to measure instantaneously in the field. Per the BMP RAM (2NDNATURE 2009b), saturated hydraulic conductivity can be measured during dry conditions using a constant head permeameter (CHP). However, the CHP values are over‐
estimates of average annual infiltration rates, which include completely saturated conditions of all surrounding soils. Building upon the existing Lake Tahoe SWT data collection strategies employed to improve PLRM CECs, the researchers will expand the monitoring of continuous water budgets of specific SWTs to develop an empirical correlation between average annual infiltration rates and the instantaneous manual CHP measurements obtained within the SWT during dry conditions. The results will provide direction to PLRM users on how to translate measurable CHP values into the PLRM input requirement of an average annual infiltration rate. Infiltration rates are a key design parameter input into PLRM for dry basins, infiltration basins and bed filters. Infiltration rates will be calculated as part of the continuous surface water hydrology budget throughout the monitoring study and therefore can be directly linked to event‐specific treatment performance and existing SWT condition as determined by BMP RAM. The variability in measured infiltration rates will be used to link observed SWT treatment performance with respect to FSP and SRP to the differences in both SWT design and maintenance. This data will be used to improve PLRM CEC loading estimates. 2NDNATURE, LLC
500 Seabright Avenue Suite 205 Santa Cruz CA 95062 p 831.426.9119 w 2ndnaturellc.com
PLRM v1 Database Refinement: FINAL Phase II Monitoring Plan p. 5 GOALS OF SNPLMA DATA COLLECTION The urban stormwater data collection effort funded by SNPLMA Round 9 will build upon the initial datasets for urban roadways and SWTs (2NDNATURE 2009c) in order to address the priority data gaps and test key assumptions within the current suite of Lake Tahoe urban stormwater tools. Specifically, SNPLMA data collection will: 1. Expand and apply the urban road monitoring dataset to: a. Test and refine the PLRM Road Methodology assumptions regarding the role urban road factors may have on urban roadway water quality condition, b. Inform PLRM estimates of the total (TSS) and fine sediment particles (FSP; TSS< 16μm) CRCs from roads varying in condition, with inclusion of soluble reactive phosphorous (SRP) analyses as resources allow, c. Improve the breadth and quality of urban stormwater data on the generation, fate and transport of TSS and FSP, as well as SRP where resources allow, and d. Collect focused and controlled data from urban roads to inform and improve the Road RAM tool. 2. Apply cost‐effective and comparable sampling techniques to increase our understanding of FSP generation from other urban land use types, including commercial and residential surfaces, and their variability of condition. 3. Expand and apply the SWT monitoring dataset to: a. Improve the understanding of water quality treatment performance, specifically with respect to primarily FSP, and SRP as resources allow, based on SWT type and key design parameters, b. Inform and improve the PLRMv1 CEC estimates based on SWT type and key design parameters, and c. Link average annual infiltration rates with measured CHP saturated hydraulic connectivity values to inform PLRM infiltration input requirements. 4. Apply the PLRM to estimate and compare hydraulic capture among SWTs monitored. Hydraulic capture can be estimated in the PLRM using basic design information for each SWT facility and the drainage conditions of the catchment(s) tributary to each SWT. Information on hydraulic capture will allow the research team to estimate the frequency and magnitude of storm events that cause bypass to occur at each SWT, which is a key consideration when developing improved CECs based on the monitoring data collected from this study. 5. Collaborate with academic researchers in data and sample sharing for their development of appropriate numeric conversions from FSP concentrations and loads to # of particles. 2NDNATURE, LLC
500 Seabright Avenue Suite 205 Santa Cruz CA 95062 p 831.426.9119 w 2ndnaturellc.com
PLRM v1 Database Refinement: FINAL Phase II Monitoring Plan p. 6 CHAPTER TWO. DATA COLLECTION STRATEGY LAND USE MONITORING PLRM estimates CRCs for urban land uses defined by the Lake Tahoe TMDL. The Lake Tahoe TMDL and supporting tools have identified urban land uses, and particularly roads, as the main sources of pollutant loads to the Lake (LRWQCB and NDEP 2008, nhc et al. 2009a). 2NDNATURE (2009c) focused only on the collection of water quality data for primary and secondary roads; however, this SNPLMA‐funded monitoring effort will expand data collection to include some limited sampling of additional urban land use types included in PLRMv1. This monitoring plan will remain consistent with the urban road monitoring protocols and data collection strategies developed by the Phase I study (2NDNATURE 2009c). The sampling locations, sample collection protocols, and data analysis will continue as established by 2NDNATURE (2009a). Monitoring on other urban land uses will be phased based on preliminary findings and will use cost‐effective techniques conducted in a manner consistent with the established urban road monitoring procedures. URBAN ROAD MONITORING The urban road monitoring will continue to evaluate the influence various factors may have urban road condition, improve and validate PLRM CRCs for urban roads and improve the empirical linkage between CRCs and likely road condition. The effort will continue to focus upon FSP and TSS, with a select number of samples (based on available resources) analyzed for SRP as well. The 2NDNATURE research team will combine documentation of key road segment factors as defined in the PLRM and Road RAM, observations of relative roadway condition and cost‐
effective roadway sampling efforts over a range of urban road conditions that exist in Lake Tahoe Basin. Urban road sampling will consist of controlled experiments and the contributing roadway condition will be evaluated and documented prior to each controlled experiment. The field verification of urban road condition (Road RAM) and subsequent standardized sampling of the associated road water quality will provide valuable qualitative and quantitative data to inform the PLRM Road Methodology and associated CRCs. Figure 2.1 provides a visual orientation to summarize the suite of data collected from urban road segments during monitoring as developed by 2NDNATURE (2009a). The field observations and sampling conducted under the SNPLMA Phase II study will improve the correlation between on‐the‐ground observations (Road RAM) and PLRMv1 predictions of likely average annual condition. Road Segments and Characterization Consistent with the sites monitored by 2NDNATURE (2009c), thirty‐four (34) road segments, including thirty‐two (32) roads and two (2) commercial parking lots (Table 2.1, Figures 2.2‐2.3), were selected to represent a range of: road type (primary, secondary), road risk (high, moderate, and low), and jurisdictions in charge of maintenance. The combination of roads selected, based on the above characteristics represent a range of road conditions, is consistent with the PLRM Road Methodology assumptions. Each road segment is standardized to a sampling area of 1,000ft2 and characterized based on the PLRM Road Methodology (nhc et al. 2009a). The top half of Figure 2.1 presents the spatial distribution of data collected during the road segment characterization. 2NDNATURE, LLC
500 Seabright Avenue Suite 205 Santa Cruz CA 95062 p 831.426.9119 w 2ndnaturellc.com
ONCE EVERY 3-5 YEARS
Road Segment (10,000ft2)
road length
Lake Tahoe Basin
road
shoulder1
road
shoulder1
road width
GIS analysis of:
Road Risk Category
[PHR, PMR, SHR, PLR, SMR, SLR]
Jurisdiction
Characterized by:
Right and Left Road Shoulder1 Condition
[1, 3, 4, 5]
Road Surface Integrity
[H, M, L]
EVENT-BASED
Road Segment (10,000ft2)
1’x1’ squares within
Material Accumulation Category
Low
Moderate
High
Dry Material Sampling from
all 3 categories:
Volume/Mass [ml, mg]
Particle Size Distribution
[% of mass <16µm]
(limited)
Degree of Fines [H, M, L]
Road Surface Integrity
[H, M, L]
Visual observations of:
Material Accumulation Category
% distribution of:
High
Moderate
Low
Controlled Experiments obtain wet sample
from 1 material accumulation category:
TSS and FSP Concentrations [mg/L]
Turbidity [ntu]
Particle Size Distribution [% of TSS]
Degree of Fines [H, M, L]
Road Surface Integrity [H, M, L]
1
PLRM defines the road shoulder to include the pervious area of the right-of-way. For the
purposes of this monitoring, only the impervious portion of the road shoulder is considered
part of the road segment.
URBAN ROAD MONITORING DATA COLLECTION SCHEMATIC
FIGURE 2.1
PLRM v1 Database Refinement: FINAL Phase II Monitoring Plan p. 8 Table 2.1. Urban Road Monitoring Road Segments. Road Type Primary Secondary Commercial Road Segment Code EI H281 H28TC H89S EB1 SPP1 HM2 KG1 KG2 H28C H28A H28B SR1 BO1 KC3 EW1 KG3 KG4 KG5 HM3 MA1 TR1 CO1 JP KB1 PINE BURL VIL1 VIL2 DD KMAC JEN RSLT RIV Street Name Jurisdiction Responsible for Road Maintenance Highway 50 Highway 28 Highway 28 Highway 89 Highway 89 Highway 89 Pioneer Trail Kingsbury Grade Kingsbury Grade Highway 28 (Tahoe Blvd) Highway 28 Highway 28 Ski Run Boulevard Bonanza Avenue Keller Road Elwood Drive North Benjamin Drive Andria Drive Juniper Drive High Meadow Trail Martin Avenue Trout Avenue Coon Street Red Cedar Street Cut Throat Avenue Pine Avenue Olympic Drive Village Boulevard Village Boulevard Dale Drive McDonald Drive Jensen Circle Raleys‐ SLT Raley’s Incline Village CalTrans CalTrans CalTrans CalTrans CalTrans CalTrans El Dorado County NDOT (Douglas County) NDOT (Douglas County) NDOT (Washoe County) NDOT NDOT CSLT CSLT CSLT CSLT Douglas County Douglas County
Douglas County
El Dorado County El Dorado County Placer County Placer County Placer County Placer County Placer County Placer County Washoe County Washoe County Washoe County Washoe County Washoe County Private Private Road Risk (estimate September 2009) High High High High Moderate Moderate Low High High High Low Low High Moderate High Low Moderate Moderate Low Low High Moderate High Moderate Moderate High Moderate High High Moderate Moderate Low High High Road Data Collection Road sampling consists of a collection of visual observations, as well as dry material and wet sediment sampling at each site. The field crew (consisting of 2‐3 trained personnel) evaluates the road segment condition during urban road sampling to document road condition. Road condition will be determined by both visual observations and dry material collection and validated by the wet sample results. At road segments characterized with erodible road shoulders, field personnel will collect additional dry material samples from the pervious portion of the road shoulder to evaluate any sampling bias introduced by conducting controlled experiments only on the impervious areas of the road segment. Field personnel safety is the priority at any road segment site. Hazard cones are placed to surround the sampling location and field personnel. Field personnel must wear hazard vests and be acutely aware of traffic conditions at all times. Sampling locations and visual observations will be dictated by both field personnel safety and minimization of disturbance or distractions to motorists. 2NDNATURE, LLC
500 Seabright Avenue Suite 205 Santa Cruz CA 95062 p 831.426.9119 w 2ndnaturellc.com
1:300,000
Road Segment Sampling Sites by Jurisdiction
and Primary and Secondary Road Risk (as
calculated September 2009).1
Jurisdiction
# High
Risk
# Mod
Risk
# Low
Risk
Road Type2
P
P
P
CalTrans
4
City of South
Lake Tahoe
S
2
Douglas County
El Dorado
County
NDOT
S
S
2
1
1
2
1
1
1
3
1
2
Placer County
2
4
Washoe County
2
2
1
1
Table does not include the 2 commercial parking
lot sites under private jurisdiction.
2
P= Primary Road; S = Secondary Road
LEGEND
Road Risk of Road Segment
High
Moderate
Low
URBAN ROAD MONITORING ROAD SEGMENTS - OVERVIEW
FIGURE 2.2
Kingsbury
Grade
SOUTH SHORE
LEGEND
Road Risk of Road Segment
High
Moderate
Low
Keller
Canyon
KINGSBURY GRADE
Martin Dr
The “Y”
KG4
High
Meadow
KG3
MARTIN DR
KG5
KG1
KG2
KELLER CANYON
EW1
MA1
SR1
KC3
THE “Y”
HIGH MEADOW
HM2
EI
RSLT
HM3
BO1
URBAN ROAD SEGMENTS - SOUTH SHORE
FIGURE 2.3A
Kingsbury
Grade
SOUTH SHORE
LEGEND
Road Risk of Road Segment
High
Moderate
Low
Keller
Canyon
KINGSBURY GRADE
Martin Dr
The “Y”
KG4
High
Meadow
KG3
MARTIN DR
KG5
KG1
KG2
KELLER CANYON
EW1
MA1
SR1
KC3
THE “Y”
HIGH MEADOW
HM2
EI
RSLT
HM3
BO1
URBAN ROAD SEGMENTS - SOUTH SHORE
FIGURE 2.3B
WEST SHORE
Tahoe City
Granlibakken
Sunnyside
TAHOE CITY
JP
H28TC
SPP1
GRANLIBAKKEN
EB1
BURL
SUNNYSIDE
H89S
PINE
LEGEND
Road Risk of Road Segment
High
Moderate
Low
URBAN ROAD SEGMENTS - WEST SHORE
FIGURE 2.3C
PLRM v1 Database Refinement: FINAL Phase II Monitoring Plan p. 13 Visual Observations (See Protocol A) •
Visual observations will be made of the entire 10,000ft2 road segment: o percent distribution of each material accumulation category (heavy, moderate, and light), o degree of fine material within each accumulation category, as determined by fines and dust test, o evidence of recent road abrasive application (Y/N), and o evidence of recent sweeping activity (Y/N). •
Material accumulation categories will be characterized relative to the specific road segment evaluated and not relative to all road segments during the sampling period. The heavy and light accumulation categories of the specific road segment at the time of observation will set the bookend scales of the existing condition for these factors, and then % distribution of each category will be estimated and confirmed by all field personnel. •
To properly QA/QC the data the field observations will be conducted across the entire width of the road segment, including the drive lane, both road shoulders and both flow paths that consist of impervious coverage. Pervious surfaces that extend beyond the concrete will not be included in the observations, but the left and right road shoulder conditions for the complete road segment are documented. To account for the potentially mobile unconsolidated material accumulated beyond the impervious edge of the road segment and/or beyond the reach of a road sweeper, visual observations are conducted to determine if a substantial amount of material is present and therefore represents a downslope water quality risk during a subsequent runoff event. •
Dry Material Collection – Impervious Surface (See Protocol A) •
Dry material samples will be collected from the heavy, moderate and light material accumulation areas to represent the entire road segment. o Dry material samples will be collected using a hand broom and wire brush from a 1ft by 1ft road surface area to measure the volume of material potentially available for subsequent transport. o Volume will be measured by immediate transfer into a graduated cylinder and field personnel entered the measurements on field datasheets. o Dry material samples will be converted to mass, using an assumed density of 1.7 g/mL for all samples. o Most samples will be immediately discarded after measurements are recorded; however a subset will be saved and submitted to Cooper Testing Laboratory following proper handling protocols. Dry Material Collection – Pervious Surface •
Dry material samples will be collected from the pervious portion of the road shoulder at road segments characterized by an erodible or unstable road shoulder (road shoulder condition score = 1 or 3). o Visual observations of the relative degree of disturbance (e.g., soil compaction and human traffic) will be estimated for the length of the road shoulder. o Field personnel will scrape the top 1‐2” of material from the surface to remove any road generated material blown onto the road to ensure native material is collected. o 100mL of dry material samples will be collected for submission to Cooper Testing Laboratory for grain size distribution following proper handling protocols. 2NDNATURE, LLC
500 Seabright Avenue Suite 205 Santa Cruz CA 95062 p 831.426.9119 w 2ndnaturellc.com
PLRM v1 Database Refinement: FINAL Phase II Monitoring Plan p. 14 Pervious road surface samples will initially be collected one time to ground‐truth our current assumptions on the potential FSP generation risk associated with erodible road shoulders. Depending upon results from the initial data collection, additional samples may be collected and/or the technique may be modified. Controlled Urban Road Experiments (See Protocol B) 2NDNATURE (2009) designed and fabricated a portable simulator that applies a standardized volume of water at a constant intensity over a controlled area of an urban road surface (Figure 2.4). The runoff experiment design meets the following needs: • Ability to sample over 30 Lake Tahoe urban roads using 2 field personnel in 3 days. • In order to remain cost‐effective, the road evaluations, which include the controlled experiments, should take no more than 30 minutes to complete per road segment. • A minimum of 600 mL of volume must be recovered from the simulation for proper analysis and QA/QC by the analytical laboratory. • Consistently sample a number of urban roads while keeping water application rate, intensity, contributing area, and water sample collection methods constant. The constraint of these primary hydrologic parameters increase our confidence that computed differences in water quality constituents (TSS, FSP, SRP) are due to differences in roadway condition and not due to natural hydrologic or sampling variability. The above needs require that the portable simulator be run at an estimated intensity of 5 in/hr. While this intensity is higher than most rain events in Lake Tahoe, this increased rate is necessary to minimize the sampling duration and remain cost‐effective. The relatively high intensity of simulated rainfall, to some degree, compensates for the lack of material transport downslope by flowing stormwater over the road surface that occurs during actual stormwater runoff events on impervious surfaces. A summary of the portable simulator protocols include: • Due to field personnel safety and resource limitations, only one wet sample is obtained from each road segment during each sampling period, unless field triplicates are performed for QA/QC procedures. Wet samples are typically collected on the shoulder margin of the drive lane and sites are selected to be visually representative of the condition of that location over the entire road segment. Typically an area of moderate material accumulation is selected to reduce sampling variability across sites and sampling periods. Personal safety and actual road condition occasionally require field personnel to select a location in a different accumulation category. • To improve the sediment capture efficiency of both the dry material sampling and the controlled experiments, field personnel will conduct dry material collection and controlled experiments on the same 1ft by 1ft square, noting the material accumulation category of the location. The square will first be swept to collect the dry material mass on the road surface following the protocols describe above. Then the controlled experiment will be conducted to collect the smaller‐size particles not collected by the hand broom. The double sampling of the road segment will more accurately measure the total sediment and associated pollutant concentration accumulated on the road surface. • A water volume of 750mL is be applied by the simulator and field personnel will monitor both water pressure and application time to maintain consistency across sampling. 2NDNATURE, LLC
500 Seabright Avenue Suite 205 Santa Cruz CA 95062 p 831.426.9119 w 2ndnaturellc.com
SIMULATOR IN ACTION IN THE FIELD
site set-up
PORTABLE SIMULATOR - FRONT VIEW
12V batteries
simulation
collection pan
peristaltic pump
sample collection
2L graduated cylinder
collection bottle
PORTABLE SIMULATOR - TOP VIEW
pressure gauge
transfer to collection bottle
sprinkler nozzle
1x1 square
collection
bottle
collection pan
collection pan rinse
PORTABLE SIMULATOR USED IN CONTROLLED URBAN ROAD
EXPERIMENTS
FIGURE 2.4
PLRM v1 Database Refinement: FINAL Phase II Monitoring Plan •
•
•
•
p. 16 Following completion of the simulation, which takes approximately 2.5 minutes, an additional 250mL of water is applied using a squirt bottle to rinse the collection pan and capture all material transported from the road to the collection pan into the sample. For each sample, turbidity is measured in the field using a Hach 2100P or LaMotte 2020 portable turbidimeter. Collected water samples are then submitted to WETLAB for analysis following proper handling protocols. Field triplicates and a field blank are collected and submitted to WETLAB at least once during a sampling period to QA/QC field techniques. Road Shoulder Infiltration Infiltration and compaction measurements will be collected across a range of Lake Tahoe Basin road shoulder conditions to evaluate how well current PLRM algorithms predict average saturated hydraulic conductivity (Ksat) on road shoulders and whether Ksat is a reliable indicator of surface infiltration capacity. The following protocols will be implemented: • Select 15 road shoulders to perform infiltration and compaction tests. For the same soil map unit or structural fill, road shoulders will be selected to measure a range of compaction levels that will be categorized based on visual inspection as: (None, Moderate, and Severe). o A total of 6 measurements will be made for primary roads (3 compaction levels times 2 soil map units or structural fill) o A total of 9 measurements will be made for secondary roads (3 compaction levels times 3 soil map units or structural fill) •
•
Surface infiltration will be measured using a double‐ring infiltrometer and compared to Ksat measurements using the Constant Head Permeameter (CHP) designed by NRCS. Compaction and soil resistance will be measured using a cone penetrometer. Ksat will be predicted for each road shoulder using PLRM and compared to field measured Ksat and surface infiltration rates. Assuming the research confirms that current PLRM road shoulder algorithms are in need of improvement, a second stage of research will be conducted to determine the key factors contributing to variability in road shoulder infiltration. The results of the second stage of research will be used to develop guidelines for others to use when estimating road shoulder infiltration for input into PLRM. Additionally, the technical framework for incorporating improved road shoulder infiltration algorithms into the PLRM will be developed. The second stage protocols include: • The probable factors contributing to variable Ksat will be identified based on insight gained from Task 1.2 (e.g. sandy vs. clayey soils, volcanic vs. granitic soils, presence or absence of road structural fill, primary vs. secondary roads, vegetation, degree of compaction, plugging of surface soils by fine sediments, etc.). • Up to 35 additional road shoulders will be selected and tested to constrain the probable factors contributing to Ksat variability. • The total data set (50 total samples) will be used to identify the primary factors causing variability in measured Ksat. 2NDNATURE, LLC
500 Seabright Avenue Suite 205 Santa Cruz CA 95062 p 831.426.9119 w 2ndnaturellc.com
PLRM v1 Database Refinement: FINAL Phase II Monitoring Plan p. 17 Road Maintenance Practice Documentation Accurate documentation by jurisdictions of road maintenance practices was identified as a significant data gap by 2NDNATURE (2009c). The research team has identified road maintenance personnel contacts for 6 of the 7 jurisdictions and provided each with a simple data log to track their road maintenance practices at each of the urban road sampling locations. The log includes both road abrasive application data (frequency and amount applied per unit area) and sweeping data (frequency and sweeper type). 2NDNATURE personnel plan to communicate biweekly to monthly with the identified personnel at each jurisdiction throughout the winter months to encourage accurate and standardized data collection and management. Improved record‐keeping of road maintenance actions will greatly improve our understanding of the water quality benefits of pollutant recovery actions. However, identifying the appropriate personnel within each jurisdiction that has (1) the knowledge of existing road maintenance practices and (2) the inclination and time to discuss those practices and complete the weekly log has been challenging. Requests to complete the log have been met with some resistance and will require persistent communication from 2NDNATURE staff. ADDITIONAL LAND USE MONITORING Objectives The Parcel Methodology is used to estimate the CRCs generated from urban parcels such as single family and multi‐family residential, and commercial land uses. The Parcel Methodology defines land use condition based on the presence/absence of private party pollutant source control and/or hydrologic source control implementation. The research team will conduct initial dry material collection and controlled experiments on a collection of land uses (commercial, multi‐family residential, single‐family residential, etc.) throughout the Lake Tahoe Basin to ground truth the current PLRMv1 assumptions on particle grain size distribution and potential pollutant generation risk of the associated land uses. Draft Protocols Similar to the development strategy for the Phase I protocols (2NDNATURE 2009a), the 2NDNATURE team anticipates the full development of the Land Use Monitoring protocols to be an iterative process. The draft protocols are presented below; however, we expect to modify and refine these protocols as new information is gained. Final protocols will be produced with the Draft Technical Report. 2NDNATURE will select monitoring sites based on the following criteria: • Typify the range of urban land uses (commercial, multi‐family residential, single‐family residential) to address the land uses represented in PLRMv1; • Include both pervious and impervious surfaces to allow dry material sampling and controlled experiments consistent with the urban road monitoring, and • Represent typical Lake Tahoe Basin native soils of both granitic and volcanic origin to evaluate the potential fine sediment particle distribution differences generated from land uses. The total number of sites selected will depend upon a balance between cost‐effectiveness and the likely value of the data collection results. The research team will characterize each site, including sampling area, native soil type based on existing USGS soil mapping, and presence/absence of private party pollutant source control and/or 2NDNATURE, LLC
500 Seabright Avenue Suite 205 Santa Cruz CA 95062 p 831.426.9119 w 2ndnaturellc.com
PLRM v1 Database Refinement: FINAL Phase II Monitoring Plan p. 18 hydrologic source control implementation. Field personnel will conduct monitoring on both the impervious and pervious surfaces at each site. For the impervious surfaces, visual observations, dry sampling, and controlled experiment protocols at each monitoring site will remain consistent with those performed on the urban roads. Phase I data collection efforts (2NDNATURE 2009c) included 2 impervious commercial sites (RSLT and RIV in Table 2.1) and provided comparable results across urban land use types. Impervious land use monitoring will include: • Visual observations consistent with urban road protocols will include degree of sediment accumulation, percent distribution of sediment accumulation categories, and degree of fines, of the sites. • Dry material samples will be collected from a 1ft x 1ft square using a hand broom and a comparison of total and fine sediment will be made relative to land use type, native soil type, and sediment accumulation category. • Controlled experiments (wet sediment sampling) using the portable simulator will be conducted on impervious surface to generate standardized TSS and FSP water quality concentrations (with SRP as resources allow) to compare relative risk to downslope water quality from the range of land uses. For pervious surfaces, visual observations and dry material sampling will be consistent with the draft protocols developed for the pervious road shoulder monitoring. Pervious land use monitoring will include: • Visual comparisons of the degree of disturbance (e.g., soil compaction and human traffic) will be estimated for the entire sampling segment, similar to the percentages of high, moderate and low sediment accumulation on urban road segments. • Dry sediment sampling of 100 mL of material will be collected within each disturbance category, similar to the urban road protocols on the pervious road shoulder. The sampling will standardize sample collection techniques from site to site. Samples will be submitted for grain size distribution analysis during preliminary evaluations to determine if analyses yield any valuable information concerning FSP generation based on land use and native soil types. 2NDNATURE, LLC
500 Seabright Avenue Suite 205 Santa Cruz CA 95062 p 831.426.9119 w 2ndnaturellc.com
PLRM v1 Database Refinement: FINAL Phase II Monitoring Plan p. 19 SWT MONITORING SWT monitoring protocols and data collection strategy will build upon sites and protocols developed by 2NDNATURE (2009a) and expand monitoring spatially, temporally, and in terms of data collected for analysis. Spatially, SWT monitoring will include the four SWTs evaluated under 2NDNATURE (2009c), as well as an additional 5 SWTs. The research team will conduct monitoring from Fall 2009 through Summer 2011 to add 2 complete years to the Winter 2009 (Phase I) dataset. Expanded data collection will include: SRP analysis of selected samples as resources allow; the implementation of the BMP RAMv1 tool (2NDNATURE 2009b) repeatedly on each of the selected SWTs to track condition; and frequent CHP measurements and soil samples for comparison to the average annual infiltration rates observed from the continuous water budgets at each SWT as appropriate. Collectively these data will directly inform the PLRM v1 CEC values, improve our ability to link CHP measured values with PLRM infiltration rate inputs, and increase our understanding of design parameters as well as SWT condition on SWT treatment performance for the pollutants of concern. The approach to SWT monitoring includes: 1. Continuously monitor surface water hydrology to develop a detailed surface water budget for at least 9SWTs. The surface water budget will allow us to: a. Calculate event inlet, treated, and bypass volumes, which when combined with sample concentrations to calculate event inflow, treated and bypass outflow pollutant loads and SWT treatment performance (i.e., load reduction). b. Inform our understanding of the SWT hydrologic function with respect to key fundamental design parameters for each SWT, including infiltration rates, water quality volume, bypass volume, draw down time, and hydraulic residence times and how these parameters relate to catchment size , land use distribution, and land use condition. c. Where applicable, calculate average annual infiltration rates and correlate to manual BMP RAM CHP measurements and inform PLRM v1 user infiltration rate input requirements. 2. Collect event‐based surface water samples at the inlet and outlet of at least 8 SWTs to evaluate treatment performance based on SWT type. a. Samples are collected from passive samplers installed at fixed basin water surface elevations to characterize both treated and bypass volumes, as defined by PLRM (nhc et al. 2009b). Concentrations will be multiplied by event volumes to calculate treated and bypass pollutant loads and evaluate SWT treatment performance, particularly with respect to FSP (and SRP as resources allow). b. Field personnel will collect grab samples from the treatment outlet if outflow is occurring to compare water quality results to passive sample collection and address any bias introduced from the passive sample data collection approach. Date and time of sample collection will be compared to the basin stage time series to determine the position on the hydrograph when the sample was collected and the associated outflow volume. c. Inform our understanding of the SWT water quality performance with respect to key fundamental design parameters for each SWT, including infiltration rates, water quality volume, bypass volume, draw down time, and hydraulic residence times and how these parameters relate to catchment size, land use distribution, and land use condition. d. Outlet water quality data that represents the treated volume fraction of the SWT will be evaluated to directly inform PLRMv1 CEC estimates by SWT type and design parameters. 2NDNATURE, LLC
500 Seabright Avenue Suite 205 Santa Cruz CA 95062 p 831.426.9119 w 2ndnaturellc.com
PLRM v1 Database Refinement: FINAL Phase II Monitoring Plan 3.
p. 20 Evaluate SWT condition using BMP RAM to: a. Inform our understanding of how maintenance urgency may impact CECs and treatment volumes, as well as how condition, and the associated treatment performance, changes over time. SELECTED SWT SITES Four Lake Tahoe SWTs were monitored during the Winter 2009 (2NDNATURE 2009b): Osgood Basin, Park Avenue Upper and Lower Basins, and the Stormfilter Vault®. The 2 wet basins, 1 dry basin, and 1 cartridge filter had been previously instrumented and monitored by the 2NDNATURE team, which limited the need for extensive site reconnaissance prior to instrumentation, improved data collection and analysis efficiency by building upon previous knowledge, and provided cost sharing opportunities with other monitoring agencies. The SNPLMA funding will allow for the continuation of monitoring at the existing 4 SWTs, plus the expansion of monitoring efforts to include an additional 5 SWTs. Detailed surface water hydrology monitoring and water quality sample collection will be conducted at 4 additional SWTs. To date, 2 dry basins, Blue Lakes Basin and Rocky Point South Basin, have been selected and are currently instrumented. Surface water hydrology monitoring only will be conducted at 3 SWTs: Eloise Basin, Wildwood North Basin, and Coon Basin. The concentration of sites in South Lake Tahoe will drastically reduce field personnel travel time during stormwater runoff events (Figure 2.5). Osgood Basin (Wet Basin) [Figure 2.6] Monitoring at Osgood Basin will build upon the 2NDNATURE (2009b) monitoring and include event‐based surface water sample collection, surface water hydrology monitoring and SWT condition evaluations. Osgood Basin was selected by the research team for SWT monitoring because it is currently being monitored by the City of South Lake Tahoe (CSLT) and significant cost‐sharing opportunities exist to improve data collection and analysis efficiency. CSLT agreed to share instrumentation and monitoring resources with the 2NDNATURE research team. Osgood Basin currently accepts runoff from the Keller Canyon (a natural drainage with sparse residential neighborhoods and densely wooded areas) and Bijou Park Creek (highly urbanized catchment) Watersheds. In November 2007, CSLT instrumented 3 locations (Keller Canyon drainage outlet [KC1], Osgood Basin inlet [KC2 or OSGIN], Osgood Basin outlet [KC3 or OSGOUT]) with Sigma flow meters and automated samplers. Continuous flow (cfs) measurements are recorded by Sigma 950 data loggers on 10‐minute intervals to create annual hydrographs. Sigma 900 series automated samplers are equipped with 24 1‐liter bottles and are programmed to collect flow‐
weighted samples throughout a storm event. CSLT continues to monitor in accordance with the approved monitoring plan (CSLT 2007). However, in those cases when CSLT would not collect samples from the inlet (KC2 or OSGIN) and outlet (KC3 or OSGOUT) of Osgood Basin due to insufficient flow in the Keller Canyon watershed (monitoring site KC1), the 2NDNATURE research team bears the costs to monitor and sample the storm event. Results from all submitted samples will be shared between the parties. 2NDNATURE, LLC
500 Seabright Avenue Suite 205 Santa Cruz CA 95062 p 831.426.9119 w 2ndnaturellc.com
NEVADA
Lake Tahoe
LEGEND
LAKE TAHOE
San Francisco
Major Roads
Minor Roads
CALIFORNIA
SWT
Area
of
detail
Los Angeles
50
Park
Avenue
Basins
LAKE
TAHOE
StormFilter
Vault®
Rocky Point
Basin
Wildwood
Basin
Sk
Osgood
Basin
iR
un
Blv
d
Blue Lakes
Basin
Tra
i
l
50
89
Pio
ne
er
Eloise
Basin
1:12,000
SWT MONITORING SITE LOCATION MAP
FIGURE 2.5
d
oo
Ave
g
103
104
105
105.5
6
10 104. 5
10
1
10
2.
5
99
.5
10
4. 5
10
4
10
0
10
1
101.5
102
OSG_B
99.5
5
10
103 101. 5
104
100.5
0
10
103
102
5
4.
10
5
4.
10
5
3.
10
OSG_IN
102.5
103. 5
10
2. 5
10
1
101
2
10
7. 5
10
103
.5
.5
102
107
OSG_OUT
5
3.
10
.5
106
100.
5
Os
ay
102
un
iR
104
Sk
b
3. 5 ore
10
3
F
10
n
i
104
as
2. 5
10
.5
103
2. 5
10
d
5
4.
10
Blv
B
ing
ttl
Se
e
dis
Ave
ra
Pa
LEGEND
Height
OSG_IN
OSG_B
OSG_OUT
Top
#2 103.30
#3 102.02
#2 102.05
Middle
#1 103
#2 101.30
#1 101.33
Grade
None
#1 100.9
#3 100.93
Depth Gage and Staff Plate
Vertical Passive Samplers
Automated Samplers and Flow Meters
100
Contour
Flow Path
feet
0
25
50
100
Shaded topographic contours of Osgood Basin plotted over a 2001 IKONOS
image. Elevations values are in feet, with a contour interval of 0.5 feet.
Elevation is relative to 0ft on staff plate where: 0ft staff = 100ft elevation
OSGOOD BASIN MONITORING LOCATIONS
FIGURE 2.6
PLRM v1 Database Refinement: FINAL Phase II Monitoring Plan p. 23 Park Avenue Basins [Upper (Wet Basin) and Lower (Dry Basin) Basins] [Figure 2.7] Monitoring at both Park Avenue Basins will extend 2NDNATURE (2009b) data collection and include event‐based surface water sample collection, surface water hydrology monitoring and SWT condition evaluations. The Park Avenue Basins were selected for sampling due to the research team’s familiarity with the site, existing infrastructure to house instrumentation, and the close proximity to Osgood Basin (see Figure 2.5). Park Avenue Basins were the site for event‐based and seasonal hydrologic and water quality monitoring from November 2005 to December 2007 by 2NDNATURE under contract with CSLT. Flow meters and automated samplers were installed at both inlets to the Upper Basin to monitor inflow hydrology and water quality and pressure transducers were installed within both the Upper and Lower Basins to develop basin volume time series and determine outflow frequency, duration and volumes. Although all instrumentation was removed in January 2008, the housing remains. Given the research team’s knowledge of the site and the existing infrastructure, instrumenting the Park Avenue Basins for monitoring has been relatively efficient. Stormfilter Vault® (Cartridge Filter) The 2NDNATURE (2009b) monitoring efforts will be continued at the Stormfilter® Vault and include event‐based surface water sample collection, surface water hydrology monitoring and SWT condition evaluations. The Stormfilter Vault® was selected for sampling due to the team’s familiarity with the site, existing infrastructure to house instrumentation, and the close proximity to Osgood and Park Avenue Basins (see Figure 2.5). The Stormfilter Vault® was installed in the Ski Run Marina parking lot in 2001 as a passive, flow‐through stormwater filtration system containing rechargeable cartridges designed to reduce effluent particulate and dissolved pollutant loads. CSLT instrumented the inlet and outlet of the treatment vault with flow meters and automated samplers to quantify the nutrient, fine sediment and iron retention capability of the proprietary SWT from November 2001 to January 2004. The research team has determined the original cartridges in the Stormfilter were replaced in Summer 2008 (CSLT pers. comm. 2009). Rocky Point South Basin (Dry Basin) [Figure 2.8] Rocky Point South Basin monitoring will include event‐based surface water sample collection, surface water hydrology monitoring and SWT condition evaluations. The Rocky Point South Basin was selected because it has a classic design that allows for easy instrumentation and monitoring, is unlikely to have significant groundwater impacts on infiltration, and is in close proximity to the basins already instrumented for 2NDNATURE (2009b) monitoring (see Figure 2.5). The Rocky Point Basin watershed is a relatively small area, dominated by urban land use. As part of the Monitoring Study, the contributing catchment will be characterized in GIS and include area, land use characterization, and % impervious. Additionally, 2NDNATURE will research the design, construction, and monitoring history of the site, and determine the key design parameters of the basin. 2NDNATURE, LLC
500 Seabright Avenue Suite 205 Santa Cruz CA 95062 p 831.426.9119 w 2ndnaturellc.com
PA2_IN
NO
RT
H
DI
TC
H
Lower
Basin
(PA2)
Pa
rk
Ave
n
ue
eB
ou
lev
ard
PA2_OUT
PA2_IN
PA2_OUT
Top
None
#3 6234.95
Intermediate #2 6233.80
Low
#2 6233.78
#1 6232.85 #1 6232.86
Pin
LEGEND
Height
Depth Gage and Staff Plate
Staff Plate Only
Vertical Passive Samplers
Flow Meter
Flow Path
Bypass Channel
Ma
nza
nit
aA
ven
u
e
1:1200
PA1_OUT
PA1_OUTB
PA1_IN
(Park Ave Inlet)
Upper
Basin
(PA1)
by
p
Height
as
sc
ha
nn
el
PA1_IN
_OUT
High
#2 6236.06 #2 6235.79
Low
#1 6235.53 #1 6235.37
Source: 2NDNATURE (2008)
PA1_INB
(Rocky Point Inlet)
PARK AVENUE BASINS MONITORING LOCATIONS
FIGURE 2.7
ROCKY POINT
NORTH BASIN
CONNECTION PIPE
RPS_OUT
RPS_C
ROCKY POINT
SOUTH BASIN
Fe
Pio
ne
er
Tr a
il
RPS_IN
rn
Ro
ad
Height
RPS_IN
RPS_C
RPS_OUT
Top
#3 102.87
#3 102.67
#3 102.69
Intermediate
#4 102.02
None
#4 101.97
Low
#2 101.15
#2 101.30
#2 101.31
Grade
None
None
#1 100.06
Ec
LEGEND
ho
Ro
ad
Photo Source: Google Earth
Note: Photos are provided for orientation purposes only.
Following in-depth site surveys, improved graphics will be
provided in the technical report.
Depth Gage and Staff Plate
Vertical Passive Samplers
Flow Meter
Flow Path
Estimated SWT Boundary
ROCKY POINT SOUTH BASIN MONITORING LOCATIONS
FIGURE 2.8
PLRM v1 Database Refinement: FINAL Phase II Monitoring Plan p. 26 Blue Lakes Basin (Dry Basin) [Figure 2.9] Blue Lakes Basin monitoring will include event‐based surface water sample collection, surface water hydrology monitoring and SWT condition evaluations. The Blue Lakes Basin was selected because it has a classic design that allows for easy instrumentation and monitoring, is unlikely to have significant groundwater impacts on infiltration, and is in close proximity to the basins already instrumented for 2NDNATURE (2009b) monitoring (see Figure 2.5). The Blue Lakes Basin watershed will be characterized as part of this Monitoring Study and include area, land use characterization, and % impervious. The Blue Lakes Basin was constructed in 2005 as part of the Sierra Tract Phase 2 Erosion Control Project. The key design parameters of the dry basin will be derived using Sierra Tract Phase 2 construction documents and a reconnaissance survey of the dry basin. Eloise Basin (Dry Basin) [Figure 2.10] Eloise Basin monitoring will include surface water hydrology monitoring and SWT condition evaluations. Eloise Basin was selected for sampling due to the research team’s familiarity with the site, existing infrastructure to house instrumentation, and the close proximity to 2NDNATURE (2009b) monitoring locations (see Figure 2.5). Eloise Basin was the monitored from November 2001 to December 2005 as part of two sequential event‐based and seasonal hydrologic and water quality monitoring studies conducted by 2NDNATURE personnel for Tahoe Regional Planning Agency (TRPA) and South Tahoe Public Utility District (STPUD). Flow meters and automated samplers were installed at the inlet and outlet from 2001 to 2003; however, backwatering conditions at the inlet made the instrument of limited benefit. Pressure transducers were installed intermittently from 2001 through 2005 to develop basin volume time series and determine outflow frequency, duration and volumes. All instrumentation was removed in December 2005. Given the research team’s knowledge of the site and the existing infrastructure, instrumenting and monitoring Eloise Basin will be relatively efficient. Wildwood North Basin (Dry Basin) [Figure 2.11] Wildwood North Basin monitoring will include surface water hydrology monitoring and SWT condition evaluations. The Wildwood North Basin was selected for monitoring due to the significant volume of runoff routed to it, the relative unlikelihood that local groundwater will significantly impact the basin’s infiltration capability, and its proximity to the previously instrumented 2NDNATURE (2009b) SWTs (see Figure 2.5). Wildwood Basin has been previously monitored by CSLT and receives runoff from at least 3 separate catchments, including one inlet that receives runoff directly from Highway 50, a primary high risk road (PHR) maintained by Caltrans. Coon Basin (Dry Basin) [Figure 2.12] Coon Basin monitoring will include surface water hydrology monitoring and SWT condition evaluations. Coon Basin has been previously surveyed by DRI and the research team will use this existing data to develop the stage to storage volume rating curve for the dry basin SWT. Additionally, Coon Basin can provide information concerning treatment performance factors outside of the south shore of Lake Tahoe. 2NDNATURE, LLC
500 Seabright Avenue Suite 205 Santa Cruz CA 95062 p 831.426.9119 w 2ndnaturellc.com
emergency overflow
BL_IN
BL_OUT
LEGEND
Depth Gage and Staff Plate
Vertical Passive Samplers
Height
BL_IN
BL_OUT
Top
#3 102.08
#3 102.11
Intermediate
#2 100.89
#2 100.90
Low
#4 99.87
#4 100.20
Grade
#1 99.17
#1 99.83
Photo Source: Google Earth
Note: Photos are provided for orientation purposes only.
Following in-depth site surveys, improved graphics will be
provided in the technical report.
Flow Meter
Flow Path
Estimated SWT Boundary
BLUE LAKES BASIN MONITORING LOCATIONS
FIGURE 2.9
MW-9A is located approximately
125' downgradient (N) of Basin
outlet. (TOC El.: 6256.84)
PROJECT BENCHMARK
EXISTING MONUMENT
EL.: 6256.53
BASED ON ELEVATION AT MW-4C
BASIN OUTLET
RISER AND TRASH RACK
INLET EL.: 6254.6
4“ DRAIN
MONITORING WELLS
TOP: MW-YB EL.: 6259.0
BOTTOM: MW-YA EL.: 6258.7
SWMS
DEPTH GAUGE
EL.: 6251.4
EMERGENCY SPILLWAY
CREST EL.: 6255.6
MONITORING WELLS
TOP: MW-XB EL.: 6258.8
BOTTOM: MW-XA EL.: 6259.0
W
LO
OW
FL
TH
PA
EXISTING
MW-4C EL.: 6256.32
(ELEVATION PROVIDED
BY OTHERS)
SWMS
INVERT EL.: 6251.6
SWMS
INVERT EL.: 6252.1
GROUND EL.: 6255.8
EL
O
IS
E
LEGEND
AV
Existing Surface Water Drainage
E.
Existing Drainage Pipe, approx.
Existing Drop Inlet, approx.
Existing Fence, approx.
Existing Vegetation, approx.
Existing Building, approx.
Monitoring Well
Surface Water Monitoring Station, swms.
Regional
Groundwater
Gradient
Depth Gauge
Detention Basin Boundary
SCALE 1:480
FIGURE 2B
SCALE 1” = 40’
MONITORING WELL
MW-Z EL.: 6260.8
ELOISE BASIN MONITORING LOCATIONS
FIGURE 2.10
LEGEND
Depth Gage and Staff Plate
Photo Source: Google Earth
Note: Photos are provided for orientation purposes only.
Following in-depth site surveys, improved graphics will be
provided in the technical report.
Flow Path
Estimated SWT Boundary
WILDWOOD BASIN MONITORING LOCATIONS
FIGURE 2.11
LEGEND
Depth Gage and Staff Plate
Photo Source: Google Earth
Note: Photos are provided for orientation purposes only.
Following in-depth site surveys, improved graphics will be
provided in the technical report.
Flow Path
Estimated SWT Boundary
COON STREET BASIN MONITORING LOCATIONS
FIGURE 2.12
PLRM v1 Database Refinement: FINAL Phase II Monitoring Plan p. 31 Additional SWTs The 2NDNATURE team is investigating the inclusion of two additional SWTs into the Phase II monitoring and analysis. Caltrans has been monitoring the stormwater treatment capability of the bed filters installed on Highway 50 between Meyers and South Lake Tahoe for several years. The 2NDNATURE Team will coordinate with Caltrans and the contracted monitoring consultants to determine the applicability of the current monitoring dataset to the analysis of the Phase II monitoring data. Additionally, 2NDNATURE field personnel are coordinating with Vail Resorts to obtain permission to monitor the treatment vault located in the Heavenly Ski Resort parking lot. Once permission is obtained, 2NDNATURE monitoring will include event‐based surface water sample collection, surface water hydrology monitoring and SWT condition evaluations. SWT INSTRUMENTATION AND SAMPLE COLLECTION APPROACH The instrumentation and sample collection approaches vary by SWT type (dry basin, wet basin, cartridge filter). Table 2.2 summarizes the instrumentation for each site. Eight SWTs (Osgood Basin, Park Avenue Upper and Lower Basins, Stormfilter® Vault, Rocky Point South Basin, Blue Lakes Basin, and 2 as‐of‐yet unselected SWTs) have been/will be instrumented for both detailed hydrologic monitoring and influent/effluent sampling (Figure 2.5). An additional 3 SWTs (Eloise Basin, Wildwood North Basin, and Coon Basin) have been instrumented for surface water hydrology monitoring only. The specific instrumentation and sampling approach is discussed below by SWT type. In addition to instrumentation at each site, a topographic survey is necessary for all sites to obtain critical instrumentation and SWT elevations as well as to create a stage‐storage rating curve for each SWT where continuous water budgets will be created. Table 2.2. SWT Monitoring Site Instrumentation. See Figures 2.6 through 2.12 for site‐specific instrumentation locations. Instrumentation in grey was previously installed under a separate monitoring contract. Descriptions indicate the following instrumentation: Flow = Sigma 950 Flow Meter; Stage = InSitu LevelTroll 500; Auto: Sigma 900 Series Automated Sampler; PS = Passive Sampler. SWT Osgood Basin Park Avenue Upper Basin (PA1) Park Avenue Lower Basin (PA2) SWT Type Wet Basin Wet Basin Dry Basin Rocky Point South Basin Dry Basin Blue Lakes Basin Dry Basin Eloise Basin Wildwood North Basin Coon Basin Dry Basin Dry Basin Dry Basin Stormfilter Vault® Cartridge Filter 2NDNATURE, LLC
Instrumentation Event‐Based Surface Surface Hydrology Water Sample Collection (Site ID) (Site ID) Inlet Auto (OGIN_ASC) Outlet Auto (OGOUT_ASC) Inlet Flow (OGIN) Inlet PS1‐2 (OGIN_PS) Outlet Flow (OGOUT) Basin PS1‐3 (OGB_PS) Basin Stage (OG_LT) Outlet PS1‐3 (OGOUT_PS) Inlet PS1‐2 (PA1IN_PS) Inlet Flow (PA1INB) Outlet PS1‐2 (PA1OUT_PS) Basin Stage (PA1_LT) Inlet PS1‐2 (PA2IN_PS) Basin Stage (PA2_LT) Outlet PS1‐3 (PA2OUT_PS) Inlet PS2‐4 (RPSIN_PS) Inlet Flow (RPSIN) Outlet PS1‐4 (RPSOUT_PS) Basin Stage (RPS_LT) Connection PS2‐3 (RPSC_PS) Inlet PS1‐4 (BLIN_PS) Inlet Flow (BLIN) Outlet PS1‐4 (BLOUT_PS) Basin Stage (BL_LT) n/a Basin Stage (EL_LT) n/a Basin Stage (WWN_LT) n/a Basin Stage (Coon_LT) Inlet Flow (SFIN) In Auto (SFIN_ASC) Outlet Flow (SFOUT) Outlet Auto (SFOUT_ASC) SWT Stage (SF_LT) SWT Topographic Survey Completion Date Summer 2009 Summer 2007 Summer 2007 Summer 2010 Fall 2009 Summer 2003 Summer 2010 Summer 2010 Summer 2010 500 Seabright Avenue Suite 205 Santa Cruz CA 95062 p 831.426.9119 w 2ndnaturellc.com
PLRM v1 Database Refinement: FINAL Phase II Monitoring Plan p. 32 Significant cost‐sharing for this monitoring study has been achieved through collaboration with both CSLT and TRPA. To date, CSLT has provided 8 In‐Situ LevelTrolls, 1 In‐Situ BaroTroll, 2 Sigma 950 Flow Meters, and 2 Sigma Automated Samplers, and may be providing an additional 1‐3 Sigma Flow Meters and Automated Samplers. TRPA has contributed 5 Sigma Flow Meters and 2 Sigma Automated Samplers to the monitoring efforts. Site instrumentation will continue through January 2010 as instrumentation becomes available from our partners. Wet Basin/Dry Basin Monitoring (Protocols C‐E) PLRM modeling of Wet and Dry Basins PLRM v1 is designed to assign a static characteristic effluent concentration (CEC) for each pollutant of concern to the volume of the effluent water from a specific SWT has been “treated”. When the SWT treated flow capacity is exceeded, PLRM assumes the excess volume is bypass and the bypass CEC = the inflow CEC. PLRM v1 requirements for wet and dry basins are different, yet share similar concepts for calculating treated and bypass flows. The wet PLRM Dry Basin schematic illustrating water quality volume, bypass flow through the bypass outlet structure, and treated flow through the pool volume (wet basin) and water quality volume (dry basin) is defined by the storage capacity of the treatment outlet. Wet Basin requirements include wet pool volume (not water quality volume) and hydraulic residence time (not brim full draw SWT below the bypass outlet structure designed down time). See PLRM (nhc et al 2009b) for complete discussion and for water quality treatment. The treated water definition of terms. quality volume is assigned a static CEC that assumes proper treatment within the SWT and improved water quality. The CEC assigned in PLRM varies by SWT type and pollutant of concern. One of the primary challenges of this SWT research is to identify appropriate field sampling protocols, as well as data analysis techniques of SWT‐specific and temporally‐specific data, to inform PLRM CEC values for water quality volumes by SWT type. Surface Water Hydrology A continuous water budget is created at each dry and wet basin using a stage recorder (In‐Situ LevelTroll 500) and detailed topographic elevation data. The stage recorders are installed within the SWT to record water depth on 15‐
minute intervals (see Protocol C). In conjunction with the recorder, staff plates are installed and used to manually verify and QA/QC stage recorder data. Topographic surveys will be completed by Summer 2010 for all SWTs, including specific elevation of all critical basin features (inlet(s), outlet(s), stage recorder, staff plate, etc.). Basin topographic data will be tied to continuous stage data to create a depth to volume rating curve and continuous basin storage volume time series. The basin volume(s) at outflow will be determined using the depth to volume rating curve and surveyed outlet elevations. The basin volume time series will be compared to outflow volume(s) and change in basin water storage will be used to create a detailed surface water budget and determine event, seasonal and annual inflow and outflow volumes using the following equation: Change in Storage (volume) = Water Inputs (volume) – Water Losses (volume) [EQ1], where change in basin water storage at any one time is the net balance of inputs minus losses over the same duration. Water inputs include all surface water runoff entering the SWT through constructed inlets and direct 2NDNATURE, LLC
500 Seabright Avenue Suite 205 Santa Cruz CA 95062 p 831.426.9119 w 2ndnaturellc.com
PLRM v1 Database Refinement: FINAL Phase II Monitoring Plan p. 33 precipitation. Water losses include water exiting the SWT through infiltration, outflow through one or more of the SWT outlet features, and/or evapotranspiration. Only Osgood Basin has been instrumented with Sigma 950 Flow Meters at both the inlet and outlet due to on‐
going CSLT monitoring at the SWT. Flow meters were installed in the Fall 2009 at the inlets of Park Avenue Upper Basin, Rocky Point South Basin and Blue Lakes Basin. An additional 1‐3 flow meters may be available from CSLT. If these flow meters are provided, selection of the monitoring locations will be determined with input from the TAC. The flow meter continuous inflow hydrographs will be used to QA/QC the surface water budget calculations and inform our estimates of contributing catchment volumes and treated versus bypassed volumes. Event‐Based Surface Water Sample Collection Passive samplers are the primary sampling technique to sample the influent and effluent water quality of selected SWTs (see Table 2.2). Passive samplers are designed as a low‐cost method to simultaneously collect water samples associated with a specific basin water surface elevation at both the SWT inlet and outlet. Bottles can be installed weeks prior to the targeted sampling events and collect a water sample on the rising limb of the hydrograph (standardizing sample collection across all sites) without the need for field personnel to be on‐site during the storm event. Passive samplers are self‐sealing to preserve the sample until field personnel can safely retrieve the sample for laboratory analysis. At each selected SWT, a number of passive samplers are installed at the inlet and outlet, placed vertically at distinct water surface elevations to collect a number of water samples at different stages of the SWT inundation hydrograph. Figure 2.13 provides a general schematic illustrating the sample collection approach. Sample collection is standardized based on relative SWT stage and the event volume during collection can be estimated using the surface water budgets for each SWT. Prior to installation, the elevations of all SWT outlet features were determined using topographic survey techniques. Passive samplers are installed at both the inlet and outlet to capture each of the following elevations: (1) at grade with the base of the SWT, (2) at the elevation of the treatment outlet, (3) halfway between the treatment and bypass outlet elevations, and (4) at the bypass outlet elevation. In some instances, the number of passive samplers may be less if elevation differences between the treatment and bypass outlet elevations are relatively small. Figures 2.14A‐E illustrates the relative elevations and locations of the passive samplers specific to each of the 5 SWTs currently instrumented for passive water sample collection. Field personnel will periodically collect grab samples from the SWT treatment outlet when outflow occurs, noting the date and time of sample collection (see Field Protocol I). These water quality results will be compared to the passive sampler results to address any bias introduced by the passive sampler monitoring technique. Passive samplers collect water at a fixed water surface elevation during the rising limb of the hydrograph. The grab sample timing will be compared to the SWT stage time series to determine the hydrograph position. These samples will provide a more complete picture of the SWT treated pollutant loads. 2NDNATURE, LLC
500 Seabright Avenue Suite 205 Santa Cruz CA 95062 p 831.426.9119 w 2ndnaturellc.com
BASIN SWT PASSIVE SAMPLER DESIGN
Hanging
Passive Sampler
Ground Surface
At Grade
•Passive samplers can be custom fabricated to meet site-specific needs, but typically are Nalgene Stormwater Samplers®.
•Passive samplers can be (1) buried in the flow path to collect sample at grade or (2) secured to vertical sign post to
collect a sample at a targeted stage elevation (i.e., hanging).
•Sample is collected when water surface exceeds elevation of top of sampler. Sample flows over grate, through funnel
and into bottle. As bottle fills with water during the event, the ping pong ball floats to the top and plugs the hole in the lid
and seals the sample until it is collected by field personnel.
BASIN SWT
Depth Gage and Staff Plate
Basin Inlet
Vertical Passive Samplers
PLANVIEW
Basin Outlet
PROFILE
Bypass Outlet
Water Quality Volume
Basin Inlet
Treatment Outlet
Depth Gage and Staff Plate
SITE INSTRUMENTATION
Basin Outlet
Vertical Passive Samplers
•Depth Gage installed in basin to record water depth continuously on 15-minute intervals and create surface water
hydrology time series.
•Staff Plate is installed to QA/QC depth data.
•4 - 8 Basin Passive Samplers are installed within basin (2-4 at inlet and 2-4 at outlet, depending on basin
depth at invert of bypass outlet ).
◦ Samplers are installed to collect samples at various water surface elevations to standardize sampling based on
relative basin stage.
◦ Inlet and outlet sampler elevations are matched as closely as possible to create inlet/outlet sample pairs. This
technique assumes that at the same basin stage, the inlet/outlet sampler pairs are collecting samples at a similar
location on the storm hydrograph and observed water quality differences between the samples is the result of flow
through and interaction with the SWT.
SWT SAMPLING SCHEMATIC
FIGURE 2.13
A.
OSGOOD BASIN
OSGIN_PS2
OSGIN_PS1
4.5’
OSGB_PS3
Water Quality Volume
OSGB_PS2
notch weir inlet
OSGOUT_PS2
OSGOUT_PS1
bypass outlet
OSGOUT_PS3
OSGB_PS1
treatment outlet
B.
PARK AVENUE UPPER BASIN (PA1)
bypass outlets
PA1IN_PS2
Water Quality Volume
PA1OUT_PS2
PA1IN_PS1
PA1OUT_PS1
1.75’
treatment outlet
park avenue inlet
C.
PARK AVENUE LOWER BASIN (PA2)
Water Quality Volume
PA2OUT_PS3
PA2IN_PS2
3.0’
PA2IN_PS1
PA2OUT_PS2
bypass outlet
treatment outlet
PA2OUT_PS1
inlet
LEGEND
Conveyance Structure
Passive Sampler
Note: Schematics drawn to show relative elevation within
each SWT. Horizontal dimension is not drawn to scale.
CROSS SECTION SCHEMATICS OF SWT SAMPLE COLLECTION
WINTER 2010
FIGURE 2.14
D.
ROCKY POINT SOUTH BASIN
CONNECTION TO ROCKY
BASIN
POINT NORTH BASIN
Water Quality Volume
RPSIN_PS3
RPSOUT_PS3
RPSIN_PS4
3.5’
bypass outlet
RPSC_PS3
RPSOUT_PS4
inlet
RPSOUT_PS2
RPSIN_PS2
RPSC_PS2
treatment outlet
inlet
connecting pipe
RPSOUT_PS1
E.
BLUE LAKES BASIN
Water Quality Volume
BLOUT_PS3
bypass outlet
BLIN_PS3
BLOUT_PS2
3.5’
BLIN_PS2
BLOUT_PS4
BLIN_PS4
inlet
BLIN_PS1
treatment outlet
BLOUT_PS1
LEGEND
Conveyance Structure
Passive Sampler
Note: Schematics drawn to show relative elevation within
each SWT. Horizontal dimension is not drawn to scale.
CROSS SECTION SCHEMATICS OF SWT SAMPLE COLLECTION
WINTER 2010
FIGURE 2.14
PLRM v1 Database Refinement: FINAL Phase II Monitoring Plan p. 37 Due to resource limitations, not all SWTs can be simultaneously instrumented with Sigma Automated Samplers at the inlet and outlet. Currently, Osgood Basin is the only SWT with automated samplers at both the inlet and outlet. This equipment has been installed by CSLT and will be used to compare and correlate the data collected by the passive samplers. Due to cost restrictions, automated samplers are currently not installed at any of the other SWTs; however, 1‐3 samplers may be available from CSLT. If these instruments are provided, selection of the appropriate monitoring locations will be determined with input from the TAC. Cartridge Filter PLRM Modeling of Cartridge Filter PLRM v1 requires the user to input the maximum treated flow for a cartridge filter SWT. Maximum treatment flow is defined as “the maximum flow rate through the cartridge filter that provides effective treatment” (nhc et al. 2009b). In proprietary filters, this is typically estimated as unit rate per cartridge * number of cartridges. Stormwater runoff that flows through the cartridges is considered treated flow, while all flows which exceed the maximum treatment flow are considered bypass flow. The treated flow is assigned a static CEC that assumes proper treatment within the SWT and improved water quality. PLRM Cartridge Filter schematic illustrating bypass flow when the maximum treatment flow is exceeded, and treated flow through the SWT See PLRM (nhc et al 2009b) for complete discussion and definition of terms. Surface Water Hydrology A Sigma 950 flow meter was installed at the inlet and outlet of the Stormfilter Vault® in March 2009 to monitor the hydrology associated with this SWT (see Protocol D). To supplement this data, a LevelTroll 500 pressure transducer was installed within the outlet in July 2009 to continuously monitoring outflow water depths. Pipe dimensions have been measured, and outflow volumes will be calculated on event, seasonal, and annual time scales. Water Quality Sample Collection Automated samplers (Sigma 900 series) were installed by March 2009 within the inlet and outlet of the Stormfilter® Vault to collect flow‐weighted samples throughout targeted sampling events (see Protocol D). SWT Condition Assessments (BMP RAM) Field personnel will conduct condition evaluations for each SWT in accordance with the protocols developed for BMP RAM (2NDNATURE 2009b). SWT condition will be evaluated for each relevant treatment process (conveyance, infiltration, particle capture, nutrient cycling, media filtration) associated with the SWT type. In order to calculate BMP RAM scores (BMP RAM STEP 5), SWT type must be properly identified (BMP RAM STEP 2) and benchmark and threshold values (BMP RAM STEP 3) must be set for each SWT. 2NDNATURE personnel will work with the responsible jurisdictions to properly conduct these steps at each SWT. 2NDNATURE will conduct discussions with jurisdictions to perform maintenance at SWT where potentially required. This information would greatly improve our ability to evaluate the effects of maintenance on SWT water quality treatment performance. 2NDNATURE, LLC
500 Seabright Avenue Suite 205 Santa Cruz CA 95062 p 831.426.9119 w 2ndnaturellc.com
PLRM v1 Database Refinement: FINAL Phase II Monitoring Plan p. 38 INFILTRATION RATES PLRM v1 requires the user to input an average annual infiltration rate for each SWT; however, infiltration rates vary both temporally based on soil saturation conditions and spatially based on frequency of soil inundation within the SWT. Data collection to inform the PLRM user input requirements will include: • Hydraulic conductivity analyses of discrete sediment samples collected from the base and sides of dry and wet basins, • CHP measurements conducted according to the BMP RAM protocols described above, and • Solving EQ1 for event, seasonal and annual infiltration volumes based on the detailed SWT hydrology monitoring. To improve our spatial understanding, at least once per year during dry conditions, discrete soil samples collection and simultaneous CHP measurements will be conducted from various locations within each basin that represent assumed differences in annual inundation characteristics. The soil samples will be submitted to the Cooper Laboratory for particle grain size distribution analysis to improve the technical basis of PLRM and BMP RAM with respect to annual basin infiltration volumes, basin soil properties, and discrete spatial CHP measurements. To improve our temporal understanding of infiltration rate variability between dry and saturated soil conditions, the SWT surface water elevation and volume time series and the water budget mass balance equation (EQ1) will be used to determine event, seasonal and annual infiltration volumes and derive a continuous infiltration volume time series. This continuous infiltration volume time series will improve estimates of average annual infiltration rates in SWTs by including times of both saturated and unsaturated soil conditions. Additionally, if resources permit, discrete soil samples and CHP measurements will be conducted during more frequently than annually to develop and improve the relationship between what can be measured rapidly and cost‐effectively (CHP measurements) and the PLRM user input requirements. PLRM MODEL DEVELOPMENT PLRM models will be developed to estimate performance among the SWTs being monitored for water quality by 2NDNATURE. Modeled performance estimates will be compared and evaluated against monitored performance estimates to allow for better interpretation of monitoring data to validate and/or modify PLRM CECs. Modeled estimates of key performance metrics, such as hydraulic capture, will allow the 2NDNATURE team to estimate the frequency and magnitude of storm events that cause bypass to occur at each SWT, which is a key consideration when developing improved CECs based on the monitoring data collected from this study. This task involves developing 5 PLRM models, one for each SWT facility monitored for water quality, which includes: 1) Osgood Basin; 2) Upper and Lower Park Avenue Basins; 3) Rocky Point South Basin; 4) Blue Lakes Basin; and 5) Ski Run StormFilter Vault. PLRM model development as part of this study will include the following tasks: 1.
2.
3.
Derive design parameters necessary to simulate each SWT facility in the PLRM from field surveys completed by 2NDNATURE and reconnaissance‐level field investigations. Develop input data on the drainage conditions for the catchment(s) draining to each SWT to simulate runoff in the PLRM. Input data will be derived from planning documents, construction plan sets, GIS resources, Google street view, and reconnaissance‐level field investigations. Using PLRM, generate and evaluate information on the performance of each SWT. In particular, interpret the hydraulic capture of each SWT facility to improve understanding regarding the function of the SWT. Assess the function of each SWT relative to the methods, locations, and timing of water quality monitoring data collection efforts. 2NDNATURE, LLC
500 Seabright Avenue Suite 205 Santa Cruz CA 95062 p 831.426.9119 w 2ndnaturellc.com
PLRM v1 Database Refinement: FINAL Phase II Monitoring Plan 4.
p. 39 Using PLRM models and collected monitoring data, complete a preliminary assessment of the potential effects that variable hydrology and SWT hydraulics have on CECs. Develop approaches that can be used in a subsequent effort (potential USACE funded effort) to directly predict water quality treatment performance of individual storm water runoff events at each SWT. Note that PLRM models will not be used in this study to directly predict water quality treatment performance of individual storm water runoff events at each SWT. This type of analysis would require significantly more work than proposed to estimate antecedent conditions in the drainage catchment(s) and SWT facilities. 2NDNATURE, LLC
500 Seabright Avenue Suite 205 Santa Cruz CA 95062 p 831.426.9119 w 2ndnaturellc.com
PLRM v1 Database Refinement: FINAL Phase II Monitoring Plan p. 40 CHAPTER THREE. SAMPLE DELIVERY AND ANALYSES WATER QUALITY SAMPLES All samples collected in the field will be submitted to WETLab for TSS (mg/L) and Particle Size Distribution [PSD] (% by mass for the following particle sizes: <1µm, <10 µm, <16 µm, <20 µm, <63 µm, <100 µm and <1000 µm) analysis. As resources allow, samples will be submitted for SRP (mg/L) as well. TSS and SRP analyses are performed by WETLab (see Appendix B for WETLab standard operating procedures); PSD analysis is subcontracted to Desert Research Institute (DRI) and conducted using the laser optical backscatter (Saturn Digisizer 5200). Thus DRI researchers will have access to all stormwater samples collected for this research effort. Coordination and data sharing of necessary sample information will be provided to the DRI researchers if they choose to conduct any additional particle count analysis of any of the stormwater samples provided. All samples will be properly labeled (see Protocol F) and submitted with the proper chain of custody forms (see Protocol G) to WETLab by field personnel within the proper holding times (Table 3.1). Field quality control samples will include field blanks and composite replicate samples (described above). Lab quality control samples will include method blanks, matrix spikes, laboratory duplicates and external standards (Table 3.2). URBAN ROAD CONTROLLED EXPERIMENT SAMPLES For samples collected during the controlled experiments, field personnel will submit the 1L samples (see Protocols B, F and G) directly to WETLab for analysis. Once per sampling period a field triplicate and a field blank will be submitted and analyzed by the laboratory. ADDITIONAL LAND USE CONTROLLED EXPERIMENT SAMPLES For samples collected during the controlled experiments on impervious surfaces, field personnel will submit the 1L samples (see Protocols B, F and G) directly to WETLab for analysis. Once per sampling period a field triplicate and a field blank will be submitted and analyzed by the laboratory. SWT PASSIVE SAMPLER SAMPLES For SWT samples collected from the passive samplers, field personnel will submit the 1L sample (see Protocols E, F and G) directly to WETLab for analysis. Once per event a field replicate will be analyzed by the laboratory by splitting a passive sampler sample into two equal sample volumes. SWT GRAB SAMPLES For SWT grab samples collected from outflow from the treatment outlet, field personnel will submit the 1L sample (see Protocols F G, and I) directly to WETLab for analysis. Once per sampling event a field replicate will be submitted and analyzed by the laboratory. 2NDNATURE, LLC
500 Seabright Avenue Suite 205 Santa Cruz CA 95062 p 831.426.9119 w 2ndnaturellc.com
PLRM v1 Database Refinement: FINAL Phase II Monitoring Plan p. 41 SWT AUTOMATED SAMPLER SAMPLES For samples collected by the automated sampler, samples will be composited as follows (see Protocols D, F and G): • All samples collected at the inlets will be composited. • For short‐duration storms and/or when the full hydrograph is not captured, outflow samples will composited by lab into 1 sample. • For long‐duration storms when the full hydrograph is captured, outflow samples will be lab‐composited into 3 samples based on storm duration and flow intensity. • Analytical replicates will be conducted regularly to document analytical precision. SOIL SAMPLES All soil samples collected in the field will be submitted to Cooper Testing Laboratory for particle grain size distribution analysis. Samples are submitted with the proper chain of custody forms (see Protocols F and G). A minimum mass of 50 grams (approximately 30 mL) is required for proper analysis. The particle‐size analysis of soils (ASTM D 422‐63) includes a combination of sieves (for particles >75µm) and a hydrometer (particles <75µm). The resulting data is presented as the sample % finer than the following approximate particle sizes: 9.5mm (3/8in sieve), 4.76mm (sieve #4), 1.00mm, 50µm, 35µm, 23µm, 13µm, 9µm, and 6µm. URBAN ROAD DRY SEDIMENT SAMPLES A fraction of the dry material samples collected from the urban road segments are kept and submitted for PSD analysis to refine the Road RAM and validate the degree of fine material visual observation protocols. ADDITIONAL LAND USE DRY SEDIMENT SAMPLES A fraction of the dry material samples collected from the impervious and pervious land use surfaces are kept and submitted for PSD analysis to refine the visual observation protocols. SWT SOIL SAMPLES Soil samples collected from within the SWTs will be submitted for PSD analysis to improve our technical understanding of infiltration volumes, CHP measurements, and SWT treatment performance over time. Table 3.1. Analytical Laboratory Sample Requirements per Analysis Yype. Analysis Total Suspended Sediment (TSS) Particle Size Distribution (PSD) – Water Samples Soluble Reactive Phosphorous (SRP) Particle Size Distribution (PSD) – Soil Samples Analysis Method Detection Limit Sample Volume (mL) Sample Bottle Type Holding Time Preservation Method On ice (4oC) EPA 160.2 1 mg/L 300mL HDPE 7 days Saturn Digisizer 5200 n/a <600mL HDPE 28 days On ice o
(4 C) SM 4500‐PE 1 µg/L 300mL HDPE 2 days On ice (4oC) ASTM D 422‐63 ~6.6 µm ~30mL (50g) Ziploc N/A N/A 2NDNATURE, LLC
500 Seabright Avenue Suite 205 Santa Cruz CA 95062 p 831.426.9119 w 2ndnaturellc.com
PLRM v1 Database Refinement: FINAL Phase II Monitoring Plan p. 42 Table 3.2. Type and Frequency of QA/QC Samples. Sample Type Field Blank Composite Replicate Method Blank Matrix Spike Analytic Duplicate Analytic Blank External Standard Sample Frequency One per event – hold for analysis pending analytical results One per event per 3 sites – rotate sampling site One per event – rotate sampling site One per run for each analyte One per run for each analyte One per run for each analyte One per run for each analyte CHAPTER FOUR. DATA MANAGEMENT All data collected under this Monitoring Plan will be managed in a digital Microsoft (MS) Access relational database (PLRMDatabaseRefinement.accdb; Figure 4.1). Field site observations will be recorded entered into Palm Pilots during all sampling and instrument maintenance activities. Upon return to the office, all data will be QA/QC’d for accuracy and completeness and then integrated into the MS Access database. Instrument downloads will be corrected for barometric pressure as necessary, checked for inaccuracies, and calibrated to the relevant spot measurements prior to database entry (see Protocol C). Results of lab analyses will be submitted electronically by the laboratory, checked for data quality and completeness, verified against the chain of custody record, and then entered into the database. 2NDNATURE, LLC
500 Seabright Avenue Suite 205 Santa Cruz CA 95062 p 831.426.9119 w 2ndnaturellc.com
STUDY DATABASE STRUCTURE
FIGURE 4.1
tblCRCSiteMetadata
txtSiteCode
txtStreetName
txtSegmentStart
txtSegmentEnd
cboRoadType
cboRoadRisk
cboJurisdiction
sngRoadLength
sngRoadWidth
txtView
cboRoadSlope
cboRoadTiltDir
cboRoadTilt
cboTrafficDensity
cboSurfaceCondition
sng%Distressed
cboDistressType
cboDistressType.Value
binLeftProtected
cboLeftProtType
cboLeftProtType.Value
binLeftStabilized
cboLeftStabType
cboLeftStabType.Value
cboLeftFlowErosion
sngLeftFlowDepth
binRightProtected
cboRightProtType
cboRightProtType.Value
binRightStabilized
cboRightStabType
cboRightStabType.Value
cboRightFlowErosion
sngRightFlowDepth
tblCRCSampleMetadata
cboSiteCode
dtmSamplingDate
txtFieldPersonnel
cboWeather
sngDaysPrecip
binAbrasive
binSweeping
sngHighSed
cboHighFines
sngModSed
cboModFines
sngLowSed
cobLowFines
sngEstRAMScore
cboDust
memNotes
tblCRCSamplesDry
DrySampleID
cboSiteCode
dtmSamplingDate
txtSamplingID
dtmSampleTime
cboLocation
cboSedAccum
cboDistress
sngVolume
cboSampleFines
binKeptSample
sngMass
sngPSD1um
sngPSD10um
sngPSD16um
sngPSD20um
sngPSD100um
sngPSD1000um
memNotes
tblCRCSamplesWet
WetSampleID
cboSiteCode
dtmSamplingDate
txtSampleID
dtmSampleTime
cboLocation
cboSedAccum
cboDistress
cboSampleFines
sngTime
sngAvgPressure
sngVolume
sngVolumeRecovery
cboMaterialMobilized
sngFieldTurbidity
sngLabTurbdity
sngTSS
sngPSD1um
sngPSD10um
sngPSD16um
sngPSD20um
sngPSD100um
sngPSD1000um
memNotes
LU_CECsites
txtCECSite
txtBasin
txtDataType
sngElev
memNotes
tblLevelTrolls
DataID
txtCECSite
dtmDateTime
sngTempC
sngDepthft
sngWSE
tblCECAnalytical
WetlabID
txtSiteCode
dtmDateTime
sngFieldTurbidity
sngLabTurbdity
sngTSS
sngPSD1um
sngPSD10um
sngPSD16um
sngPSD20um
sngPSD100um
sngPSD1000um
memNotes
PLRM v1 Database Refinement: FINAL Phase II Monitoring Plan p. 44 CHAPTER FIVE. FIELD PROTOCOLS Keys to good field work: • Be safe. Event sampling is by nature hazardous due to storm conditions. Field personnel should always wear proper protective clothing when outside during a storm. Personnel safety always comes first. Use best professional judgment. If conditions do not allow safe access to the sampler, personnel should wait until safe conditions exist. • Be safer. Road sampling is dangerous and some sites are in heavily trafficked areas. Use traffic cones to alert/divert traffic as necessary. All field personnel should wear orange safety vests when conducting CRC evaluations. • Follow the protocols closely and review prior to each field mobilization. Use the provided data sheets. • Take detailed field notes in a field notebook. At the end of the field day, spend several minutes reviewing notes and adding any additional information, observations, problems encountered, suggestions, etc. • Take photos detailing station condition, discharge events. Establish photo points (location, camera orientation) and repeat every field visit to document changes over time. Detail the locations of each photo on field datasheet or in field notebook. • All field work is referenced by view/context looking downstream/downslope (e.g., right road shoulder is defined as the road shoulder on right when looking downslope). • Take all precautions to avoid sample contamination. • Be aware of the pollutant of concern and take all precautions to avoid contamination. Sources of contamination vary with different pollutants. • Clean sample bottles, field equipment, etc. with distilled, de‐ionized (DI) water. • Properly label samples according to protocols and accurately complete chain of custody forms. Key Phone Numbers: • 2NDNATURE, Office: (831) 426‐9119, [email protected] • Maggie Mathias, Field Coordination: (831) 345‐5103, [email protected] • WETLAB, Office: (775)355‐0202 • Raph Townsend, Field Sampling: (530) 386‐2454, [email protected] • Cory Hunt, Field Sampling: (530) 541‐2980 or (775) 530‐7319, [email protected] 2NDNATURE, LLC
500 Seabright Avenue Suite 205 Santa Cruz CA 95062 p 831.426.9119 w 2ndnaturellc.com
PLRM v1 Database Refinement: FINAL Phase II Monitoring Plan ATTACHED PROTOCOLS Protocol A: Road Condition Evaluations (Visual Observations and Dry Material Sampling) Protocol B: Controlled Urban Road Experiments (Wet Sediment Sampling) Protocol C: InSitu Installation and Maintenance Protocol D: Sigma Installation, Maintenance and Sample Collection Protocol E: Passive Sampler Installation, Maintenance and Sample Collection Protocol F: Sample Labeling Protocol G: Chain of Custody ATTACHED DATASHEETS Road Condition Evaluation Datasheets Instrument Logs (Sigma, InSitu) Chain of Custody Labels 2NDNATURE, LLC
500 Seabright Avenue Suite 205 Santa Cruz CA 95062 p 831.426.9119 w 2ndnaturellc.com
p. 45 PLRM v1 Database Refinement: FINAL Phase II Monitoring Plan p. 46 CHAPTER SIX. REFERENCES 2NDNATURE. 2006. Lake Tahoe BMP Monitoring Evaluation Process: Synthesis of Existing Research. Final Report. Prepared for USFS Lake Tahoe Basin Management Unit. October 2006. 2NDNATURE. 2008. Water Quality Performance Evaluation of Park Avenue Detention Basins; South Lake Tahoe, CA. Prepared for City of South Lake Tahoe, Engineering Division. Final Technical Report. August 15, 2008. 2NDNATURE. 2009a. Lake Tahoe PLRM Database Refinement Phase I Monitoring Plan. July 2009. 2NDNATURE. 2009b. BMP Maintenance Rapid Assesment Methodology Technical Document and Users Manual. Lake Tahoe, CA. Prepared for the Army Corps of Engineers. September, 2009 ftp://www.2ndnaturellc.com/2ndnature/2NDNATURE_Reports/Lake%20Tahoe/BMP%20RAM/ 2NDNATURE. 2009c. Lake Tahoe PLRM Database Refinement Phase I Technical Report. Draft Product submitted to Pollutant Load Reduction Model Project Advisory Committee. December 2009. City of South Lake Tahoe. 2007. Monitoring Plan for Keller Canyon Drainage Erosion Control Project. October 31, 2007. nhc et al. 2009a. Northwest Hydraulic Consultants, Geosyntec Consultants, and 2NDNATURE. 2009. PLRM Model Development Document. Prepared for Lake Tahoe Basin Storm Water Quality Improvement Committee. South Lake Tahoe. CA. Available for download, as well as full source code and other supporting documents, from www.tiims.org. nhc et al. 2009b. Northwest Hydraulic Consultants, Geosyntec Consultants, and 2NDNATURE. 2009. PLRM Users Manual. Prepared for Lake Tahoe Basin Storm Water Quality Improvement Committee. South Lake Tahoe. CA. Available for download, as well as full source code and other supporting documents, from www.tiims.org. Rosgen, D. 1996. Applied River Morphology. Lakewood, Co: Wildland Hydrology. 2NDNATURE, LLC
500 Seabright Avenue Suite 205 Santa Cruz CA 95062 p 831.426.9119 w 2ndnaturellc.com
Lake Tahoe Pollutant Loading Reduction Model (PLRM) Database Refinement
Final Phase II Monitoring Plan: Protocols, Field Datasheets & Appendices
Prepared for: USDA Forest Service Pacific Southwest Research Station
July 2010
This research was supported through a grant with the USDA Forest Service Pacific Southwest Research Station and using funds
provided by the Bureau of Land Management through the sale of
public lands as authorized by the Southern Nevada Public Land
Management Act.
http://www.fs.fed.us/psw/partnerships/tahoescience/
The views in this report are those of the authors and do not necessary reflect those of the USDA Forest Service Pacific Southwest
ECOSYSTEM
SCIENCE + DESIGN
321 Frederick Street
Santa Cruz, California 95062
p 831.426.9119 f 831.421.9023
w 2ndnatureinc.com
PLRM v1 Database Refinement: FINAL Phase II Monitoring Plan PROTOCOLS Protocol A: Road Condition Evaluations (Visual Observations and Dry Material Sampling) Protocol B: Controlled Urban Road Experiments (Wet Sediment Sampling) Protocol C: InSitu Installation and Maintenance Protocol D: Sigma Installation, Maintenance and Sample Collection Protocol E: Passive Sampler Installation, Maintenance and Sample Collection Protocol F: Sample Labeling Protocol G: Chain of Custody 2NDNATURE, LLC
500 Seabright Avenue Suite 205 Santa Cruz CA 95062 p 831.426.9119 w 2ndnaturellc.com
Standard Operating Procedure
Road Condition Evaluations (Visual Observations and Dry Material Sampling)
p. 1 of 5
Urban Road Condition Evaluations
Overview
Road condition evaluations include visual assessment and dry material sampling methodologies. Below
the protocols are provided for all data collection techniques, as well as General Safety and Site Set-up
Protocols.
Personnel Needed: 2 field personnel 30 minutes per road segment for Road Condition Evaluation
General Equipment Needed:
• Large Traffic Cones (6-10)
• Orange Safety Vests
• Camera
• Sharpies
• Field Datasheets/Palm Pilots
• Field Notebooks
• Field Maps
• Tahoe Street Map
• Pens/Pencils
• Tool Box
General Road Segment Site Set-up/Safety/Field Protocols:
NOTE: Field personnel safety is of utmost importance. Use extreme caution when working on side
of road.
1. SAFETY
a. Field truck should be parked completely on road shoulder, out of drive lane. Park in area of
high visibility – avoid curves in road, etc. When parked put on 4-way flashers.
b. All field personnel should wear brightly colored safety vests.
c. Place traffic cones on side of road. Cones should provide adequate warning to traffic – up to
200 yards away in both directions for high speed roads. Cones should be placed every 50100 yards and extend a few feet into drive lane to create buffer for field personnel, while
minimizing motorist disturbance and without forcing cars into oncoming traffic lane.
d. The orange cones create the ‘safety zone’.
i. Never stand outside of safety zone.
ii. Set up all equipment several feet within safety zone.
iii. Unless absolutely necessary, do not stand between equipment and edge of safety zone.
iv. Unless absolutely necessary, do not stand/kneel with back to oncoming traffic.
e. Look out for one another. If someone has his/her head down sweeping the road, someone
else should be looking out for traffic and providing warnings. If someone yells “Move!”, don’t
think, just move.
f. Check weather and highway conditions prior to starting the day to ensure access to road
sites.
i. NDOT: http://www.nevadadot.com/traveler/roads/
ii. Caltrans: http://www.dot.ca.gov/cgi-bin/roads.cgi
iii. Weather: http://www.weather.gov/
2. FIELD NOTES
a. Field notes can never be too detailed.
b. Follow the protocols and complete field datasheets completely. Field personnel must ensure
all critical information is recorded during observations.
c. Each field personnel should carry a field notebook to document any additional, observations,
problems encountered, equipment needs, etc. Make it standard practice before leaving road
segment to take time to write down and detail any of these notes.
d. Take lots of photos.
3. CONTAMINATION
a. Always be aware of potential contamination and continually take actions to avoid
contamination. The pollutant of concern with this project is sediment, dirt and dust. Manage
321 Frederick Street Santa Cruz CA 95062 (p) 831.426.9119 (f) 831.426.9023 w.2ndnaturellc.com
Standard Operating Procedure
Road Condition Evaluations (Visual Observations and Dry Material Sampling)
p. 2 of 5
equipment, samples and sample containers to minimize contamination. The quality of the
research is dependent upon the quality of the observations and samples collected.
b. Take efforts to minimize contamination of inadvertent dirt in all sample bottles, equipment,
etc.
c. Wipe down all dry material sampling equipment between samples and especially between
road segments.
d. Rinse and dry all wet sampling equipment. Be sure the water supply, squirt bottle, and
graduated cylinder remain dirt-free.
e. Place all bottle caps with open side down whenever they are removed from the bottle.
Road Condition Visual Assessment
An initial characterization is required at the time of the very first visit to the road segment and includes a
general inventory of road segment characteristics and road factors. The quicker road condition
assessment is performed during every road segment visit.
Personnel Needed: Initially – 1 field personnel 15 minutes per road segment; Subsequent Observations
– 1 field personnel 5 minutes per road segment
Equipment Needed:
• Survey Tape
• Stadia Rod
• Pavement Distress Identification Guide
• Field Datasheet
• Pen
Initial Road Segment Characterization:
Note: Initial assessment is performed once, the first time the road segment is monitored, and includes
collection of metadata which will be field-verified during subsequent road segment visits.
1. Determine location and assign road segment site code.
a. Record name of road. Note cross-streets.
b. Identify and record start (upslope) and end (downslope) boundaries of road segment using
conspicuous, permanent landmarks (street signs, fire hydrants, fencing, drop inlets, etc.).
c. Mark location on a map (street map, field map, etc.).
d. Assign unique site code using name of road and letter, as necessary. Example: DD is on Dale
Drive; H89A is one of many road segments on Highway 89.
2. Record segment metadata, estimating as necessary. This information will be verified with phone calls
and GIS data.
• Jurisdiction in charge of road segment maintenance
• Road segment type (primary or secondary)
• Road segment risk (high, moderate, low)
• Road segment width
3. Record segment measurements and characteristics.
a. Depending on site safety concerns, use visual estimates to determine:
i. Road segment length (parallel to flow of traffic) in feet.
ii. Average road segment width (perpendicular to flow of traffic) in feet. Road segment width
extends from far (left-most) edge of left road shoulder across drive lane to far (right-most)
edge of right road shoulder. If road shoulder is not stabilized, edge of shoulder is determined
by flow path, edge of pavement, etc. Width is verified in the office using GIS tools.
b. Note direction of observations. The default is downslope; however if that is not readily
determined, note direction of observations (to determine rights and lefts) using obvious
landmarks (other streets, the lake, etc.).
c. Determine road segment slope (high, low). Slope is the longitudinal slope (axis parallel with the
flow of traffic, along the length of the segment). Slope is verified in the office using GIS tools.
i. High: Greater than 5%.
ii. Low: Less than 5%.
321 Frederick Street Santa Cruz CA 95062 (p) 831.426.9119 (f) 831.426.9023 w.2ndnaturellc.com
Standard Operating Procedure
Road Condition Evaluations (Visual Observations and Dry Material Sampling)
p. 3 of 5
d. Determine direction (right, left, center crown) and degree (high, moderate, low) of road segment
tilt. Tilt is the cross section slope (axis perpendicular to the flow of traffic, along the width of the
segment) and describes the routing of stormwater from the drive lane to the road shoulder.
i. Direction is the dominant side to which stormwater flows from the drive lane.
1. Left, Right: looking downslope, or the view described in step 3b above.
2. Center Crown: water is routed equally to both road shoulders.
3. Possible field indicators include:
• Relative size of flow paths (dominant side is larger)
• Presence/absence of stabilization features (e.g., curb and gutter) (dominant side more
likely stabilized)
• Evidence of flow (dominant side more likely to have flow)
ii. Degree describes the percentage of flow routed to the dominant side.
1. High: 95-100% of runoff is directed to one side.
2. Moderate: 75-95% of runoff is directed to one side.
3. Low: Runoff is evenly distributed (50%) or up to 75% of runoff is directed to one side.
e. Determine road surface integrity (high, moderate, low). Observe overall integrity of road segment
surface pavement, observing distribution and intensity of cracks, pocks, etc.
i. High: Less than 10% of surface shows signs of deterioration.
ii. Moderate: 10-25% of surface shows signs of deterioration.
iii. Low: Greater than 25% of surface shows signs of physical deterioration.
f. Visually assess the percent of the road segment area that is distressed and note dominant
distress type.
i. Block: Cracking pattern that divides asphalt into rectangular pieces
ii. Crack: Long, narrow deteriorations in asphalt, can be longitudinal or transverse
iii. Pock: Circular depressions in pavement surface (e.g., potholes)
g. Determine relative traffic density (high, moderate, low).
i. High: Very busy road; cars passed every 1-2 minutes.
ii. Moderate: Busy road; cars passed every 4-5 minutes.
iii. Low: Quiet road; cars passed every 5-10 minutes.
4. Record road shoulder observations for both left and right road shoulders.
a. Record presence/absence of road shoulder protection and type of protection. Road shoulder
protection includes any structural improvements made to minimize human and/or automobile
disturbance of native soils and subsequent erosion along the side of the road. Types include:
• Boulders
• Fencing
• Paving
• Slope (dropoff)
• Slope (hill)
b. Record presence/absence of road shoulder stabilization and type of stabilization. Road shoulder
stabilization includes any improvements made to minimize erosion on road shoulder within
dominant flow path along road shoulder. Types include:
• AC Dike
• Curb and Gutter
• Rock-lined Channel
c. Record degree (high, moderate, low) of erosion in road shoulder flow path and average depth
(ft) of channel.
i. Degree of erosion.
1. High: Deep channel (>6”) and/or active signs of erosion (gullying, bank cuts, etc.).
2. Moderate: Shallow channel (<6”) and few signs of active erosion.
3. Low: No channel development and no signs of erosion.
ii. Use stadia rod to determine average channel depth of road shoulder flow path.
Road Condition Visual Observations:
Note: Road condition observations and assessment is performed during every road segment visit.
1. Identify side code. Verify road segment metadata collected during initial road segment
characterization and note any changes on field datasheet.
321 Frederick Street Santa Cruz CA 95062 (p) 831.426.9119 (f) 831.426.9023 w.2ndnaturellc.com
Standard Operating Procedure
Road Condition Evaluations (Visual Observations and Dry Material Sampling)
p. 4 of 5
2. Record date, field personnel (initials), weather (cloudy, rainy, sunny) and estimate number of days
since last precipitation event.
3. Note any evidence of recent road abrasive application and/or road sweeping.
a. Potential signs of road abrasive application:
• Presence of rounded (non-native) particles and/or abrasives in road shoulder/flow path.
b. Potential signs of road sweeping:
• Sweeper (broom) marks on road surface.
• Observe active sweeping in neighborhood during sampling
4. Record degree (high, moderate, low) of dustiness at road segment.
a. High: Visible thick dust in air, especially obvious with passing traffic. Vision is obviously
impaired. Lots of sneezing and eye irritation.
b. Moderate: Visible dust in air with traffic. Vision slightly impaired. Some sneezing and eye
irritation.
c. Low: No visible dust in air with traffic.
5. Estimate % of road segment per material accumulation category and determine level of fines per
category.
a. Determine locations and percent of each material accumulation category. High, moderate and
low accumulation is determined specific to the road segment and is not relative to observations
made elsewhere. Every road segment will have some percentage of each of the 3 categories.
Relative percentage is based on the entire area of the road segment. Observe percentages
across both the entire length and width of the road segment to determine overall road segment
percentages.
b. Within each accumulation category, determine the degree (high, moderate, low) of fine sediment
using the finger test. Lick finger and wipe road surface.
i. High: Finger is black and sediment feels clayey/silty. There is little to no grit in teeth.
ii. Moderate: Finger is grey to light brown; feels slightly clayey, with some grit.
iii. Low: Little to no sediment on finger and any sediment adhered to finger is very gritty.
6. Follow additional draft Road RAM protocols and complete Road RAM datasheet as necessary.
PRIMARY FLOW PATH (Road RAM Datasheet Row #3)
a. Identify primary flow path (East or North/ West or South / Equal) based field indicators (relative
size, road tilt, etc.). Record answers (Yes/No) to following questions concerning primary flow
path on field datasheet.
b. Is the road shoulder flow path accessible by a passing road sweeper? If flow paths are equal
and the answer for either flow path is no, record “NO”.
c. If answer to above is YES, move to Datasheet Row #4. If answer to above is NO, is there nonnative material (i.e., road abrasives) accumulation in the flow path? If flow paths are equal and
the answer for either flow path is yes, record “YES”.
d. If answer to above is NO, move to Datasheet Row #4. If answer to above is YES, can a handful
or more of material be easily grabbed from a 1 sq-ft area? If flow paths are equal and the answer
for either flow path is yes, record “YES”.
BEYOND PRIMARY FLOW PATH (Road RAM Datasheet Row #4)
a. Examine area beyond primary flow path. Record answers (Yes/No) to following questions
concerning primary flow path on field datasheet.
b. Are there impervious surfaces (e.g., sidewalks, bike paths) beyond the primary flow paths? If
flow paths are equal and the answer for either side of road is yes, record “YES”.
c. If answer to above is NO, move to Datasheet Row #5. If answer to above is YES, are these
areas accessible by a road sweeper? If flow paths are equal and the answer for either side of
road is no, record “NO”.
d. If answer to above is YES, move to Datasheet Row #5. If answer to above is NO, is there nonnative material (i.e., road abrasives) accumulation in these areas? If flow paths are equal and
the answer for either side of road is yes, record “YES”.
e. If answer to above is NO, move to Datasheet Row #5. If answer to above is YES, can a handful
or more of material be collected in a 1 sq-ft area? If flow paths are equal and the answer for
either side of road is yes, record “YES”.
Dry Material Sampling
321 Frederick Street Santa Cruz CA 95062 (p) 831.426.9119 (f) 831.426.9023 w.2ndnaturellc.com
Standard Operating Procedure
Road Condition Evaluations (Visual Observations and Dry Material Sampling)
p. 5 of 5
Personnel Needed: 1 field personnel 10-15 minutes per road segment
Equipment Needed:
• 1’x’1 Square with Plastic Sheet
• Dust Pan
• Hand Broom
• Graduated Cylinders (10ml, 100ml, 1000ml)
• Wire Brush
• Hard Edge
• Spray Bottle
• Camera
• Funnel
• Bucket
• Ziplocs
• Paper Towels/Rags
• Chain of Custody
• Field Datasheet
• Pen
Data Collection:
1. Ensure all equipment is clean and ideally store equipment together in bucket to avoid confusion with
wet sampling equipment. Avoid use of water, but wipe down all equipment using paper towels/rags. If
equipment is rinsed, dry completely prior to collecting samples.
2. Dry material sampling is conducted in each of the three material accumulation categories (high,
moderate, low) as designated by road condition visual observations. Select locations that are at a
minimum 1’x1’.
a. Prepare location by sweeping dust and debris in a 1-2ft line.
b. Place 1’x1’ square on road surface with plastic sheet on the downslope/downtilt side.
c. Using tape, secure inside edge of square to road surface to hold square in place and allow for
easy removal of road sediment. Ensure that tape does not reduce sampling area below 1 ft2.
d. Using hand broom, sweep all material from inside square on to plastic sheet. Hold down edges
of square as necessary to prevent movement.
e. Gather all material into center of plastic and carefully transfer volume to graduated cylinder.
3. Record data on field datasheet.
a. Sample ID. Format is Site Code_AccumulationCategory&Replicate Number
i. For example DD_H1 is the first sample taken in the high material accumulation area from
Dale Drive
b. Time of sample collection in 24-hour format.
c. Location on road (flow path, road shoulder, drive lane).
d. Material accumulation category (high, moderate, low) as designated in road condition visual
observations.
e. Road surface integrity (high, moderate, low) at sampling location.
i. High: Less than 5% of square shows signs of road surface distress.
ii. Moderate: 5-25% of square shows signs of road surface distress.
iii. Low: More than 25% of square shows signs of road surface distress (pocks, cracks, etc).
f. Perform Fines Test.
i. Locate appropriate site within material accumulation area 1. It should not be the same area
where dry sample was collected.
ii. Scrape road surface with a hard edge sweep using moderate amount of pressure to remove
top layer of coarser material from surface.
iii. Wet finger using spray bottle. (Note: Ensure finger is clean prior to performing test.)
iv. Using two fingers and with a moderate amount of pressure, rub the pad of the fingers back
and forth along 6” (approximately the length of a hand) of the road surface twice (e.g., cover
24” of road surface.
321 Frederick Street Santa Cruz CA 95062 (p) 831.426.9119 (f) 831.426.9023 w.2ndnaturellc.com
Standard Operating Procedure
Road Condition Evaluations (Visual Observations and Dry Material Sampling)
p. 6 of 5
v. Look at finger surface. Are fingerprints visible through the material on finger? Record answer
(Yes/No) on field datasheet.
vi. Wet finger with spray bottle and rub fingers together. Do fingers feel slimy or gritty or both or
neither? Record answer on field datasheet.
g. Perform Dust Test.
i. Within unswept 1x1 foot square within material accumulation area 1, sweep road surface
vigorously (5 sweeps in 3 seconds)
ii. Within 2 seconds of sweeping, estimate the height of the resulting dust cloud. Height is
estimated based on the body parts of the sweeper. It is easiest if one person sweeps, and
the other field personnel records observations. Record height (ankles/knee/waist) on field
datasheet.
iii. Estimate duration of time (in seconds) the dust cloud is visible. Record # of seconds on field
datasheet.
h. Volume of material (ml) collected from 1’x1’ square to nearest ml.
i. If value was less than 3 ml, record as 3ml.
4. At least one dry material sample is kept per road segment for laboratory analysis. All other samples
are disposed on-site. Typically moderate accumulation sample is kept, or whichever accumulation
category represents where the wet sediment sample is collected. If sample is kept:
a. Transfer sample from graduated cylinder to Ziploc bag and securely close bag.
b. Label bag with Sample ID, Date, Time, and Volume.
c. Place in larger Ziploc with other dry samples.
d. Complete chain of custody. Samples are submitted for the following analyses.
i. Mass (mg)
ii. Particle Grain Size Distribution (as % of mass)
1. <1 µm
2. <10 µm
3. <16 µm
4. <20 µm
5. <63 µm
6. <100 µm
7. <1000 µm
321 Frederick Street Santa Cruz CA 95062 (p) 831.426.9119 (f) 831.426.9023 w.2ndnaturellc.com
Standard Operating Procedure
Controlled Urban Road Experiment (Wet Sediment Sampling)
p. 1 of 4
Controlled Urban Road Experiment (Wet Sediment Sampling)
Overview
Controlled urban road experiments are always conducted in conjunction with a Road Condition
Evaluation. Please review the Road Segment Site Set-up and Safety Protocols within the Road Condition
Evaluation protocols to ensure data collection is conducted safely, accurately and completely.
Personnel Needed: 2 field personnel 10-20 minutes per road segment
Equipment Needed:
• Rainfall Simulator Sampler (includes metal frame, tubing, sprinkler nozzle, 2L graduated cylinder)
• 2 Charged 12V Batteries
• GeoTech Geopump 2 peristaltic pump
• Extra Pump Tubing
• Hach 2100P Portable Turbidimeter (including clean vials, wipe cloth, cleaning drops, calibration
solutions, manual)
• Chem Wipes
• Rags/Paper Towels
• Duct Tape/Gorilla Tape/Concrete Tape
• Silica Gel and Caulking Gun
• Plumber’s Putty
• Leatherman/Straight Edge
• Wire Brush
• 1’x1’ inside square
• Stopwatch
• 5-gallon buckets of water
• Cooler with ice
• Chain of Custodies
• Sample Bottles (1L wide-mouth Nalgene HDPE)
• Pipettes and Pipette Bulbs
• Propane Torch and Extra Propane
• Squirt Bottle marked at 250ml volume
• Bungees/Carabiners
• Towel
• Allen Wrench
Data Collection:
1. Handle rainfall simulator sampler with care. (See Figure 2 in Sampling Plan as reference.)
a. Sampler can be rested on bottom or back edge (so bottle end is up in air).
b. Carry sampler by top bar or edge near bottle. Avoid grabbing by sprinkler nozzle or pressure
gage.
c. DO NOT grab sampler by the flexible metal edge of collection pan. It is important that this is kept
as smooth as possible, with no kinks, to ensure a good fit with the road surface.
d. Be very careful with the bottle lid fitting. DO NOT unscrew lid from sampler.
e. Before beginning sample operation for the day, check tubing, nozzle, etc. for leaks and adjust as
necessary.
2. Create a clean environment while sampling. We are analyzing samples for sediment and therefore
everything must be kept as dirt-free as possible.
a. Rinse and dry all equipment between sampling and especially between road segments. Ensure
sampler, water supply, squirt bottle, graduated cylinder, etc are kept dirt-free.
b. Always place bottle lids with the bottom down when not being used.
c. Always cap bottles when not being immediately used. Even if it is just going to be for a second,
screw the lid back on the bottle.
3. Set up sampler. (See Figure 2 as reference.)
321 Frederick Street Santa Cruz CA 95062 (p) 831.426.9119 (f) 831.426.9023 w.2ndnaturellc.com
Standard Operating Procedure
Controlled Urban Road Experiment (Wet Sediment Sampling)
p. 2 of 4
a. Select location on road surface in area of moderate material accumulation. Note that sampler
(with bottle attached) extends approximately 18” downslope. Be sure there is enough room for
sampler to rest evenly and completely on road surface.
b. In close proximity to selected sampling location (but not upslope), pour water on road surface to
determine direction of runoff.
c. Attach sample bottle to sampler. Screw bottle to lid tightly but avoid twisting lid fitting
independently of sampler.
d. Prepare sampling location.
i. Place the 1’x1’ inside square down in selected sampling location so orientation is
perpendicular to the runoff direction.
ii. Using hand broom and/or wire brush, sweep all four sides to create a 1” clean border around
the square. This will ensure a good seal for the sampler and prevent leaks.
iii. On downslope side, extend line 6” on each side. This will be the downslope edge of the 1’x1’
rainfall area square and where the edge of the collection pan will be taped to the road
surface. Clean road surface as completely as possible to ensure tape will stick to road.
iv. Tape is extended 18-20” along downslope edge of sampling area, as well as a 3-4” strip
along either side to ensure the downslope corners of the sample area are fully protected.
Depending on road conditions, there are 3 strategies to prepare sample location:
1. Silicone.
• Apply silicone 12-15” along center of the downslope swept line, as well as 3-4” along
sides to protect corners from leaking. Silicone is used to create waterproof seal under
tape and to fill in any road surface cracks.
• Place gorilla tape over silica. Wipe any excess silica that oozes out from tape edge.
2. Propane Torch
• In areas where road surface is mostly smooth, tape can be used without silicone. In
these cases, use propane torch to heat road surface and tape to mildly melt tape into
road. Do not use propane torch in combination with silicone, as silicone is
highly flammable.
3. Plumber’s Putty
• In areas where road surface is moderate in fines and dust, plumber’s putty can be
used in place of silicone (road sites high in fines and dust cannot form a solid seal
between the putty and the road). Apply a generous amount of putty along downslope
swept line, as well as 3-4” along sides to protect corners from leaking. No tape is used
in this step – sampler is placed directly on to plumber’s putty.
e. Place sampler over selected location with collection pan on the downslope end. Looking down
on sampler, line front edge of rainfall area square with upslope edge of tape/putty to standardize
the rainfall area to 1’x1’. When done correctly approximately ¼” of tape/putty will be exposed
along edge of collection pan.
f. Place batteries on each sampler wing. Using rope and carabiners, distribute weight of batteries
on sampler edges. Make sure rope goes over top of sampler bar and will not disturb water
application on rainfall square.
g. Tape collection pan to road surface.
i. If using plumber’s putty, push the excess putty over the collection pan edge, forming a
barrier and seal between the ground and sampler.
ii. Use gorilla tape to secure collection pan edge to tape on road surface. Use a straight edge
to smooth the tape at the corners of the sampler to prevent leaks out the side and corners of
the sampler. It may be helpful to angle the tape towards the inside of the rainfall square to
create seal. To prevent pooling in the collection pan near the tape, cut tape on downslope
corners and smooth to sides of collection pan.
4. Attach pump and prepare for sampling.
a. Fill graduated sampler to 750 ml. Ensure intake pipe inside cylinder is downslope.
b. Attach tubing to pump.
c. Attach pump to battery. Red is positive; black is negative.
d. Ensure pump direction is the same as from the pump to the sampler.
5. Run rainfall simulation.
a. One person stands on edges of collection pan to weight edges and improve sampler’s seal to
road surface.
321 Frederick Street Santa Cruz CA 95062 (p) 831.426.9119 (f) 831.426.9023 w.2ndnaturellc.com
Standard Operating Procedure
Controlled Urban Road Experiment (Wet Sediment Sampling)
b.
c.
d.
e.
p. 3 of 4
Turn on pump.
Begin timer when water starts coming out of sprinkler nozzle.
Monitor pressure to maintain 25 psi. Adjust pump speed as necessary.
Watch water flow. Using clean straight edge, encourage water to flow into collection pan instead
of pooling around tape. With clean fingers, press down on collection pan edge as necessary.
f. Stop timer when no more water comes out of sprinkler nozzle. (Duration should be around 2min
50sec.)
6. Collect sample.
a. Scrape any sediment on tape into collection pan using clean straight edge.
b. If water is pooling around tape or in rainfall square, use pipette to transfer water to bottle. Person
standing on sampler may have to stay in place to prevent seepage out the sides of sampler.
c. Two people are needed to lift sampler and transfer sample to bottle. Field personnel safety is
very important. As personnel lift sampler they should move away from drive lane, maintaining a
safe distance from traffic as sample is recovered.
i. Person 1 lifts sampler from back and holds vertically to transfer sample from collection pan
to bottle. Be careful not to tilt sampler too quickly and lose water from the collection pan. DO
NOT rest sampler on bottle as this may damage the bottle lid fitting.
ii. Person 2 grabs edges of road tape extending beyond sampler and helps lift sampler off
road, loosening tape where stuck to road. While Person 1 holds sampler, Person 2 uses
squirt bottle filled with 250ml to rinse sampler and transfer all sediment into bottle. This is all
the water you get, so use judiciously.
d. If necessary, transfer sample to a sample analysis bottle. Swirl sample to mobilize sediment.
Carefully transfer to other bottle, to avoid losing sample volume. It will be necessary to transfer
water back and forth a few times to get all sediment from collection bottle to analysis bottle.
7. Measure sample turbidity following instructions in turbidimeter user manual. A couple of notes:
a. Always run 2-3 validation tests with provided gels with known turbidity prior to testing any
sample. Record validation results.
b. Never touch the outside of the glass vial with fingers. Use the black cloth provided.
c. Have at least 2 vials for samples – one for cleaner samplers, one for dirtier samples. Rinse with
sample prior to analysis to condition the vial.
d. Pour sample back into analysis bottle following measurement.
e. Throw out vials at the end of the sampling period.
f. Record ‘out of range’ samples as >1000NTU and ensure lab completes turbidity analysis for
these select samples.
8. Record data on field datasheet.
a. Sample ID. Format is Site Code_AccumulationCategory&Replicate Number.
i. For example DD_H1 is the first sample taken in the high material accumulation area from
Dale Drive.
b. Time of sample collection in 24-hour format.
c. Location on road (flow path, road shoulder, drive lane).
d. Material accumulation category (high, moderate, low) as designated in road condition visual
observations. Wet samples are usually collected in areas of moderate accumulation.
e. Road surface integrity (high, moderate, low) at sampling location.
i. High: Less than 5% of square shows signs of road surface distress.
ii. Moderate: 5-25% of square shows signs of road surface distress.
iii. Low: More than 25% of square shows signs of road surface distress (pocks, cracks, etc).
f. Amount of fines within sample (high, moderate, low).
i. High: A significant amount of fines are present in sample. When sweeping, a lot of dust is
generated and may cause field personnel to cough, sneeze, or blink a lot.
ii. Moderate: Some fines are present in sample. When sweeping, a little bit of dust is generated
into air.
iii. Low: Very few fines are present in sample. Little to no dust is generated while sweeping the
sample.
g. Time (min) of rainfall simulation.
h. Average pressure (psi) during simulation.
i. Volume (ml) applied for sample collection. Default is 1000ml (750ml through pump + 250 ml in
squirt bottle).
321 Frederick Street Santa Cruz CA 95062 (p) 831.426.9119 (f) 831.426.9023 w.2ndnaturellc.com
Standard Operating Procedure
Controlled Urban Road Experiment (Wet Sediment Sampling)
p. 4 of 4
j.
k.
Approximate volume (ml) recovered in sample analysis bottle.
Degree of material on road surface mobilized during rainfall simulation (high, moderate, low).
Look at square where rainfall simulation occurred and compare to adjacent road surface.
i. High: Most to all sediment was removed during sample collection.
ii. Moderate: 75-90% of the sediment was mobilized during sample collection.
iii. Low: Less than 75% of sediment was mobilized during sample collection.
l. Results of field turbidity test (ntu).
9. All wet samples are submitted to laboratory for analysis.
a. Label bottles in sharpie with Sample ID, Date and Time.
b. Place upright in cooler on ice. Never store or freeze water samples on side.
c. Complete chain of custody. Samples are submitted for the following analyses.
i. TSS (mg/L)
ii. Particle Grain Size Distribution (as % of mass)
1. <1µm
2. <10 µm
3. <16 µm
4. <20 µm
5. <63 µm
6. <100 µm
7. <1000 µm
ii. Turbidity >1000ntu for those samples that were ‘out of range’ on field turbidity test.
d. QA/QC Requirements
i. Field triplicates should be collected and submitted to the laboratory at a minimum of one site
per sampling period. Ideally triplicates are performed at two sites: one relatively dirty and one
relatively clean road segment.
ii. One field blank should be submitted to laboratory per sampling period.
1. Use same water source used for controlled experiments.
2. Transfer water to sample collection bottle and then sample analysis bottle.
3. Label sample analysis bottle as BLK1 with date and time collected.
e. Deliver samples and completed chain of custody to appropriate laboratory within stated holding
times (7 days). Keep a copy of chain of custody for records.
Optional Spot Turbidity Measurements
Personnel Needed: 1 field personnel 5-10 minutes per road segment
Equipment Needed:
• Hach 2100P Portable Turbidimeter (including clean vials, wipe cloth, cleaning drops, calibration
solutions, manual)
• Chem Wipes
• Rags/Paper Towels
• Pipettes and Pipette Bulbs
Data Collection:
1. If there is runoff at the road segment, spot turbidity measurements should be collected from the
primary flow paths – and from both road shoulders if there is runoff in each.
2. Using pipette, collect at least 100ml of volume from primary flow path.
3. Measure sample turbidity following instructions in turbidimeter user manual. A couple of notes:
a. Always run 2-3 calibration tests prior to testing sample and record values.
b. Never touch the outside of the glass vial with fingers. Use the black cloth provided.
c. Have at least 2 vials for samples – one for cleaner samplers, one for dirtier samples. Rinse with
sample prior to analysis to condition the vial.
d. Discard sample.
e. Throw out vials at the end of the sampling trip.
f. Record ‘out of range’ samples as >1000NTU and submit those samples to lab for turbidity
analysis.
321 Frederick Street Santa Cruz CA 95062 (p) 831.426.9119 (f) 831.426.9023 w.2ndnaturellc.com
Standard Operating Procedure
Controlled Urban Road Experiment (Wet Sediment Sampling)
4. Record data on field datasheet.
a. Sample ID. Format is Site Code_Location.
i. For example DD_LRS is the left road shoulder from Dale Drive.
b. Time of sample collection in 24-hour format.
c. Location on road (flow path, road shoulder, drive lane). Default is the flow path.
d. Results of field turbidity test (ntu).
321 Frederick Street Santa Cruz CA 95062 (p) 831.426.9119 (f) 831.426.9023 w.2ndnaturellc.com
p. 5 of 4
Standard Operating Procedure
InSitu Installation and Download
p. 1 of 3
IN-SITU LEVELTROLL & BAROTROLL
Installation
Personnel Needed: 1-2 experienced field personnel 2-4 hours per station to install.
Equipment Needed:
• InSitu LevelTroll (BaroTroll as needed)
• digging bar
• vertical steel sign/fence post or rebar
• side braces
• BaroTroll housing (3ft long 8” PVC, top, lock)
• wire/cable
• perforated PVC
• PVC end cap
• lock
• post driver
• level
• radiator clamps
• tools
• drill
Installation:
Note: The most effective installation materials, housing and configuration for each station will depend
upon site conditions and limitations. Trained and experienced field personnel should be used to
ensure proper and safe installation of expensive equipment in stream.
1. Calibrate and setup instruments (In-Situ LevelTroll 500, In-Situ BaroTroll if necessary) in office.
a. Follow software instructions provided in user manuals.
b. Check that date and time are accurate.
c. Set to record data on 15 minute intervals.
• Water depth as feet. Calibrated and corrected for elevation (barometric pressure
differences).
• Pressure in psi. Calibrated and corrected for elevation.
• If an un-vented instrument is to be installed, access to vented barometric pressure
data is required. A vented instrument can be set to record on same 15 minute interval
and installed on-site, in the office, or at another nearby station. One BaroTroll
instrument can be used to correct multiple unvented gages. The In-Situ software can
link unvented instrument data and vented data to correct the water depth time series
automatically. The barometric corrections can also be conducted manually.
2A. Install un-vented pressure transducers.
a. Secure vertical sign post/rebar in streambed, buried 1-2ft in channel substrate. If
possible, use a sign post already installed for passive samplers. Place side braces into
the stream bank to further secure housing, if necessary.
b. Attach PVC (with perforations along bottom 1-2ft) to post/rebar using radiator clamps.
Radiator clamps should be spaced evenly along the length of PVC to properly secure it to
the post/rebar.
c. Install pressure transducer within PVC. Attach sufficient length of stainless cable to
instrument to ensure placement at the bottom of PVC.
d. Loop cable through PVC cap and lock cap to PVC to prevent theft or vandalism.
e. One vented pressure transducer (In-Situ BaroTroll) will need to be installed somewhere
in the project area to record and allow correction for barometric pressure differences. It is
not necessary to install one at every station. One vented transducer can be used for the
entire project area, as long as data is recorded on 15-minute intervals and widely
321 Frederick Street Santa Cruz CA 95062 (p) 831.426.9119 (f) 831.426.9023 w.2ndnaturellc.com
Standard Operating Procedure
InSitu Installation and Download
p. 2 of 3
available to all agencies operating instruments. To install a programmed In-Situ BaroTroll
on-site:
• Choose location above the high flow line to ensure instrument cannot be inundated.
• Bury a 3ft long 8” PVC piece in ground. Place BaroTroll in PVC.
• Lock top in place to prevent theft and/or vandalism.
OR:
3B. Install vented pressure transducer.
a. Secure vertical steel sign post/rebar in streambed, buried 1-2ft in channel substrate. If
possible, use a sign post already installed for passive samplers. Place side braces into
the stream bank to further secure housing, if necessary.
b. Attach PVC (with perforations along bottom 1-2ft) to post/rebar using radiator clamps.
Radiator clamps should be spaced evenly along the length of PVC to properly secure it to
the post/rebar.
c. Install pressure transducer within PVC. Run instrument cable with PC attachment to
bank.
• Ensure vented LevelTroll is purchased with sufficient length of cable to extend
instrument to desired location in stream.
• Special care should be taken to ensure cable does not kink or bend.
• End of cable should be installed in location above the high flow line to ensure cable
top is not inundated.
d. Cable should be locked to prevent theft or vandalism of instrument.
e. No BaroTroll is needed if all Level Trolls used are vented.
Download Procedure
1. Be sure you have:
a. Charged computer plus extra battery
b. Extra adaptor port for computer, with 9-pin serial port
c. Instrument cable
d. A/C adapter to run computer off car, if necessary.
e. Wrench/tool to open PVC housing, and during the winter season warm water to
unfreeze/open PVC housing.
2. Tasks to do:
a. Download data
i. Clean off instrument. Remove debris, organisms from around the probes.
ii. Connect instrument to cable to computer.
iii. Open Win-Situ 5 Software – if no response, check cables assuring there is
a tight connection with the computer.
iv. If device is still not connecting click on “Preferences” on the top toolbar
and select “Comm Settings.” Select 9600 Baud rate and then click ok. The
instrument should connect at this Baud Rate. Once the connection
between the computer and instrument is made change the Baud rate back
to 57600.
iv. Instrument should appear under connection. In bottom right corner the two
plugs inserted into each other indicates a connection.
v. Click on Logging icon, second from left. Window will show active log
indicated by an icon of a man jogging. You must stop the active log in
order to download the data. Right click and select “Stop.” Right click again
and select “Download,” choose to download all data.
vi. View data to assure that instrument was working correctly and collected
data for the full duration and collected all the required parameters during
the deployment.
vi. Downloaded data will be saved to “My Data.” To access data, click on
View and select “My Data.” Right click the recently downloaded file, and
321 Frederick Street Santa Cruz CA 95062 (p) 831.426.9119 (f) 831.426.9023 w.2ndnaturellc.com
Standard Operating Procedure
InSitu Installation and Download
vi.
b. Start
i.
ii.
iii.
iv.
p. 3 of 3
select “Export to Csv.” Select the file under the “Exported Data” File and in
the window to the right the location of the file on the C drive will be
indicated.
Check details on Instrument – Battery Capacity and Storage Capacity in
the upper right corner. Record these values in the field log. If battery
capacity is low, the instrument will need to be sent back to In-situ.
new test.
To start new test, old test must be deleted. Right-click old test and choose
Delete. This is why it is imperative that you check that gage has
downloaded correctly and data is saved!! Deleting this should also clear
out the data storage capacity.
Right-click Tests and choose “New”. Wizard will take you through the setup. If you are unsure of any of the settings, go to the data file just
downloaded. Beginning lines give description of setup, including mode,
reference depths, and sampling intervals. When setting up both Level and
BaroTrolls, it is best to have them recording at same interval with same
start times.
When finished, double check details to make sure test will begin. If you
chose a manual start, do not forget to start test before disconnecting.
Once you’ve convinced yourself that recording will happen, click on the
icon in the right corner to disconnect the instrument and exit Win-Situ
software.
321 Frederick Street Santa Cruz CA 95062 (p) 831.426.9119 (f) 831.426.9023 w.2ndnaturellc.com
Standard Operating Procedure
Sigma Flow Meter and Automated Sampler Installation, Download and Sample Collection
p. 1 of 3
SIGMA FLOW METERS AND AUTOMATED SAMPLERS
Installation
Personnel Needed: 1-2 field personnel 20 hours to install equipment
Equipment Needed:
• Sigma 950 Flow Meter (including submerged area/velocity sensor, sensor cable, power cable,
computer cable, battery pack)
• optional flow meter mounting kits (wall mounting, suspension harness, or manhole rung hanger)
• Sigma 900 Max Portable Sampler (including pump tubing, intake line, tubing connectors, intake
strainer, bottles, battery pack)
• 36” CMP housing
• lock
• drill
• computer
• instrument maintenance log
Instrument Installation:
Note: The most effective installation materials, housing and configuration for each station will depend upon
site conditions and limitations. Trained and experienced field personnel should be used to ensure proper and
safe installation of expensive equipment in stream.
1. Install sampler per instructions provided in instrument manual.
a. Install 36” CMP housing on level ground above and adjacent to sampling source. Choose
location where inside of CMP housing will remain dry.
b. Connect pump tube to body. Consider the following issues when installing the intake tube:
• Tube should be as short in length as possible and free of kinks.
• Tube should slope downward from sampler to allow complete drainage between sampling.
• Tube should be placed in area of well-mixed flow.
• Tube should be well placed vertically in water column to ensure sample collected is
representative of entire water column.
c. Set up bottles.
d. Install and align distributor arm.
e. Install full bottle shutoff device.
f. Connect to power source
2. Install area/velocity sensor per instructions provided in instrument manual.
a. Mount device. Consider the following:
• Sensor should be installed in area of uniform flow with minimal turbidity.
• Sensor should be installed where channel area can be confined.
• Sensor and sampler must be in close proximity for proper connection.
b. Connect to power source.
c. Connect to sampler.
3. Program and calibrate area/velocity meter per instructions provided in instrument manual.
• Level in feet.
• Velocity in feet per second
• Flow as liters per second
• 15 minute intervals
• Submerged area/velocity
• Enter appropriate channel criteria to calculate flow
4. Secure housing with lock.
321 Frederick Street Santa Cruz CA 95062 (p) 831.426.9119 (f) 831.426.9023 w.2ndnaturellc.com
Standard Operating Procedure
Sigma Flow Meter and Automated Sampler Installation, Download and Sample Collection
p. 2 of 3
Monthly Maintenance
Personnel Needed: 1 field personnel 1-2 hours to download data, calibrate and maintain instruments
Equipment Needed:
• charged computer
• appropriate instrument cables
• extra computer battery
• calibration materials
• camera
• field notebook
• pens/pencils
• instrument logs
• instrument batteries (if replaceable)
Monthly Maintenance
1. Connect flow meter to field computer per instrument operations manual.
a. Download data to computer. Check data to ensure there are no data gaps and the data seems
accurate. Recalibrate sensor as necessary.
b. Check date and time.
c. Check battery level.
d. Set up instrument to start recording again on 15-minute intervals.
e. Fill out instrument maintenance log (see Figure 6.11 attached at the end of this section). Take
photos.
2. Clean sensor of any debris.
3. Check and maintain desiccants. Replace as necessary.
4. Place instrument back into housing and lock in place.
Sample Collection
Personnel Needed: 1 field personnel 1-2 hours per targeted event for pre-event preparation of instrument; 1
field personnel 1-2 hours per targeted event to collect samples following event
Equipment Needed:
• sample analysis bottle
• computer
• cable
• sample analysis bottles
• distilled, de-ionized water
• ice
• cooler
• pens/pencils
• field notebook
• camera
• sample labels
• chain of custody
• station monitoring log
• instrument logs
Sample Collection
1. Pre-event
a. Arrive at the station 24 hours prior to the targeted runoff event. In the case of summer
thunderstorms that come with little warning, there may be insufficient time to deploy the samplers
prior to the beginning of the event. While not a preferred method, sample bottles can be deployed
321 Frederick Street Santa Cruz CA 95062 (p) 831.426.9119 (f) 831.426.9023 w.2ndnaturellc.com
Standard Operating Procedure
Sigma Flow Meter and Automated Sampler Installation, Download and Sample Collection
p. 3 of 3
and remain in the field in preparation for summer thunderstorm sampling. However, if this
technique is used, the sample bottles in the field must be checked and cleaned twice weekly to
minimize the potential for contamination of material on the bottle prior to the occurrence of a
runoff event.
b. Connect computer to instruments. Verify that both flow meter and automated sampler are working
properly. Check date/time, battery level, desiccants, probe conditions, etc.
c. Based on anticipated event volume and duration, program sampler to collect samples on specific
volume intervals.
d. As necessary, change interval of flow meter data collection.
e. Ensure bottles in sampler are clean and empty.
f. Verify that sampler is properly connected and will collect runoff from proper location. Check intake
tubing for kinks and dirt and distributor arm for proper alignment.
g. Complete instrument maintenance log. Take photos.
2. Post-event
a. Arrive at site within 12 hours after the event has ended.
b. Download sample history data.
i. Connect sampler to computer and following instrument manual, download the sampling
history for the event.
ii. Verify that number of samples collected by sampler match number reported by the
instrument.
iii. Check date and time of each collected sample.
iv. Complete instrument maintenance log.
c. Collect samples.
i. Composite samples according to project specifications.
ii. If analyses require chemical preservation transfer sample to appropriate sample analysis
bottle.
iii. Complete label for each bottle and firmly secure to bottle. Label should include, at minimum,
project and station name, date, time, and field personnel.
iv. Place all bottles in Ziploc in cooler with ice and complete chain of custody.
v. Take photos. Record staff plate measurement. Complete necessary information in station
visit monitoring log (.
vi. Deliver samples and completed chain of custody to appropriate laboratory within stated
holding times. Keep a copy of chain of custody for records.
321 Frederick Street Santa Cruz CA 95062 (p) 831.426.9119 (f) 831.426.9023 w.2ndnaturellc.com
Standard Operating Procedure
Nalgene Storm Water Sampler Installation and Sample Collection
p. 1 of 3
NALGENE STORM WATER SAMPLERS
Installation – Single Unit Within Flow Path
Personnel Needed: 1-2 field personnel 4-6 hours to install 3 samplers
Equipment Needed (assumes use of Nalgene units):
• three (3) Nalgene Storm Water Samplers [Cat. No. 1100-1000 (HDPE) and/or 1120-1000 (Glass)
depending on targeted pollutants of concern]
• three (3) Nalgene Storm Water Mounting Kits (includes mounting tube, clamp, wire hanger, cable tie,
and mounting stake)
• slot-headed screwdriver
• flagging
• shovel
• digging bar
• Nalgene Installation Guide
• lock
Installation:
Note: The most effective installation materials, housing and configuration for each station will depend upon
site conditions and limitations. Trained and experienced field personnel should be used to ensure proper and
safe installation of equipment.
Note: The Storm Water Sampler should be used during installation of the Storm Water Mounting Kit to ensure
the setup will properly collect a sample. To avoid contamination the sampler should not be left on-site. It
should be installed in the mounting tube just prior to an anticipated runoff event.
1. Follow the instructions provided in the Nalgene Installation Guide, briefly summarized below.
a. Grate mounting
i. Hang mounting tube from stormwater grate near the edge of the storm drain chamber using
wire hanger (provided in mounting kit), cable, or string.
b. Ditch mounting
i. Dig a hole deep enough to set the sampler at grade. Be sure to place dirt at the downstream
end of the hole.
ii. Drive mounting stake into downstream side of hole with open side of V facing upstream.
iii. Set mounting tube at grade and secure to stake using screwdriver and clamp.
iv. Backfill the hole, ensuring that water is directed towards the passive sample.
2. If necessary, secure Mounting Kit against vandalism using lock.
3. Test placement of Storm Water Sampler within Mounting Kit. Use level to ensure sampler rests
evenly on housing. Make any adjustments necessary.
Installation – Hanging Units with Stream, Detention Basin, etc.
Personnel Needed: 1-2 experienced field personnel 6-8 hours per station to install passive samplers.
Equipment Needed:
• three (3) Nalgene Stormwater Samplers [Cat. No. 1100-1000]
• three (3) Nalgene Stormwater Mounting Kits (includes mounting tube, clamp, wire hanger, cable tie,
and mounting stake)
• slot-headed screwdriver
• flagging
• shovel
• digging bar
• Nalgene Installation Guide
• vertical steel sign/fence post or rebar
• side braces
321 Frederick Street Santa Cruz CA 95062 (p) 831.426.9119 (f) 831.426.9023 w.2ndnaturellc.com
Standard Operating Procedure
Nalgene Storm Water Sampler Installation and Sample Collection
•
•
•
•
•
•
p. 2 of 3
lock
post driver
level
radiator clamps
tools
drill
Installation:
Note: The most effective installation materials, housing and configuration for each station will depend upon
site conditions and limitations. Trained and experienced field personnel should be used to ensure proper and
safe installation of expensive equipment in stream.
Note: For best results, samplers should be installed during low flow conditions when access to the channel is
the greatest. To avoid contamination Storm Water Samplers should not be left at site between sampling
events.
1. Installation and housing must be secure and sturdy enough to remain in place during high flow events
and potential collisions with debris.
• Secure vertical steel sign post/rebar in stream bed so it is buried 1-2ft in channel substrate for
stabilization.
• If possible, place side braces into the stream bank to further secure vertical post.
• Depending on the differences in stage between targeted discharges, it may be possible to secure
more than one sampler to a single vertical sign post.
2. Install Nalgene Mounting Kit according to the details in the Nalgene Installation Guide for stream
mounting. Install kit on upstream side of sign post to reduce obstruction of sample.
3. Test placement of Storm Water Sampler at station. Use level to ensure that sampler will rest evenly
on housing. Make any adjustments necessary.
Sample Collection
Deploy Storm Water Sampler:
1. Arrive at station 24-48 hours prior to anticipated runoff event. In the case of summer thunderstorms
that come with little warning, there may be insufficient time to deploy the samplers prior to the
beginning of the event. While not a preferred method, sample bottles can be deployed and remain in
the field in preparation for summer thunderstorm sampling. However, if this technique is used, the
sample bottles in the field must be checked and cleaned twice weekly to minimize the potential
contamination of material in the bottle prior to the occurrence of a runoff event.
2. Check condition of each mounting tube to ensure the sampler is properly and securely installed to
collect stormwater runoff from catchment. If there are any problems, fix if possible. If it cannot be fixed
immediately or prior to runoff event, describe problem on station visit log and report to project
manager. Housing should be fixed prior to any subsequent sampling, to ensure the catchment runoff
is being sampled properly.
3. Avoid contamination. Place all materials on tarp while prepping station. Rinse materials with distilled,
de-ionized water as necessary.
4. Based on targeted pollutants of concerns, install proper sampler type (HDPE or glass) in mounting
tube.
5. Depending on volume and field triplicate requirements, more than one Storm Water Sampler may
need to be deployed for an event.
6. Ensure stormwater runoff will be routed into the sampler(s). Remove any obstructions in flowpath and
adjust installation as necessary.
7. Take photos. Complete necessary information in station visit monitoring log.
Collect Samples:
1. Arrive at the station within 6- 12 hours of the onset of stormwater runoff (and anticipated sample
collection).
2. Remove Storm Water Sampler from mounting tube and immediately seal top with lid.
3. Sample must have been properly collected in order to be submitted to lab.
321 Frederick Street Santa Cruz CA 95062 (p) 831.426.9119 (f) 831.426.9023 w.2ndnaturellc.com
Standard Operating Procedure
Nalgene Storm Water Sampler Installation and Sample Collection
p. 3 of 3
•
4.
5.
6.
7.
8.
9.
If sample has exceeded the proper holding time in the passive sampler, then samples cannot be
submitted to lab. Sediment holding times are lengthy. Samples to be submitted for nutrients,
hydrocarbons, trace metals, and pesticides can remain at site up to 4 days if water/air
temperatures are below 38oC. Evaluations of sample condition must be made in field based on
conditions prior to submission to laboratory.
• If the runoff volume was not great enough to fill the bottle and properly seal the lid, sample in
unusable - the exception being that field personnel arrived within an hour of sample collection. In
this case, sample can be submitted to lab, but must be flagged as “unsealed”.
If analyses require chemical preservation transfer sample to appropriate sample analysis bottle.
Complete label for each bottle and firmly secure to bottle. Label should include, at minimum, project
name, station name, date, time, and field personnel.
For field triplicates, transfer samples into appropriate analysis bottles as necessary and include
replicate number on label.
Place all bottles in Ziploc in cooler with ice and complete chain of custody.
Take photos. Complete necessary information in station visit monitoring log.
Deliver samples and completed chain of custody to appropriate laboratory within stated holding times.
Keep a copy of chain of custody for records.
Some notes about nutrient sample handling:
Samples become contaminated if they are touched by skin. If you touch the inside of the cap, or the rim of
the sample bottle, please dump the sample, rinse the bottle and start over. If you sneeze or cough over
the sample, please dump it. Please pay close attention and take care not to compromise sample.
321 Frederick Street Santa Cruz CA 95062 (p) 831.426.9119 (f) 831.426.9023 w.2ndnaturellc.com
Standard Operating Procedure
Sample Bottle Lableling
p. 1 of 1
SAMPLE BOTTLE LABELING
All samples must be clearly and consistently labeled to ensure no data loss due to poor sampling
handling. All samples collected must be labeled with the following information. The same information
must be simultaneously entered onto the chain of custody to ensure reliable sample tracking.
Sample Labeling
Sample Location: A
Sample Type: B
Bottle #, Composite?: C
Replicate #: D
Date: E
Time collected: F
Field Personnel: G
Example
Sample Location: Osgood KC3
Sample Type: CEC Auto
Bottle or Rep#: 1-4 composite
Replicate: none
Date: 052006
Time collected: 1402
Field Personnel: MM
Example label indicates surface water outflow sample from outlet to Osgood Basin, composite
from bottles #1-4 from autosampler on May 20, 2006 at 14:02 by field personnel with initials MM.
No field replicate was submitted.
A: Sample location (see Figures 1, 3 and 4 for location and IDs):
PA1_IN: Park Avenue Upper Basin Inflow
PA1_OUT: Park Avenue Upper Basin Outflow
PA2_IN: Park Avenue Lower Basin Inflow
PA2_OUT: Park Avenue Lower Basin Outflow
KC2: Osgood Basin Inflow
KC3: Osgood Basin Outflow
SF_IN: StormFilter Vault Inflow
SF_OUT: StormFilter Vault Outflow
RSID: Road Segment ID #
PS#: CRC Passive Sampler
B: Sample Type
CEC Auto: SWT autosampler
CEC Pass: SWT passive sampler
CRC: Road segment grab sample
C: Bottle #, Composite:
CEC Auto: Autosampler bottle(s) #
CEC Pass: Passive sampler bottle # (1-4, 1 is lowest elevation, 4 is highest)
CRC: Time elapsed since flow started (ex: t=10min)
If any of the samples are composited, write composite (or comp) on label.
D:
E:
F:
G:
Replicate number (if field replicate taken at site)
Date of collection
Time of collection (if collected from passive sampler enter FF (first flush))
Initials of field personnel collecting sample
321 Frederick Street Santa Cruz CA 95062 (p) 831.426.9119 (f) 831.426.9023 w.2ndnaturellc.com
Standard Operating Procedure
Chain of Custody
p. 1 of 1
CHAIN OF CUSTODY
1.0
PURPOSE AND SCOPE
1.1
This Standard Operating Procedure (SOP) describes the procedures to be used for documenting the
history and possession of a sample from the time that sample containers are dispatched, through its collection,
analysis and data reporting, to its final disposition.
2.0
RESPONSIBILITY
2.1
The principal investigator is responsible for ensuring that all project personnel are aware of this SOP. The
project hydrogeologist and/or his/her designee will be responsible for ensuring that all sample custody procedures
will be performed in accordance with this SOP and the study protocol.
3.0
FIELD CUSTODY PROCEDURES
3.1
Field documentation will include sample labels, groundwater or surface water sampling information forms,
daily field activities logbook and chain-of-custody and analysis request forms. These documents will be filled out
in indelible ink. Any corrections to the document will be made by drawing a line through the error and entering the
correct value without obliterating the original entry. Persons correcting the original document will be expected to
initial any changes made. The documents are described below.
3.2
Sample Labels will be used to identify samples. Labels will be covered with transparent plastic tape to
protect the label. The sample label, to be filled out using waterproof ink, will be completed as described in the
Bottle Labeling Protocol.
4.0
CHAIN OF CUSTODY
4.1
The chain-of-custody (COC) form is filled out for groups of samples collected at a given location on a
given day and is routinely provided by the contract laboratory, which signs the COC first to relinquish the precleaned sample containers. A project COC form will be used for those occasions when the contract laboratory
COC form is not available and sample containers are purchased from a commercial vendor.
4.2
The COC will be filled out and signed by the field personnel in order to relinquish every shipment of
samples to the respective analytical laboratories.
4.3
One copy is made of the COC prior to shipment and is maintained with the field notes. The COC makes
provision for documenting sample integrity and the identity of any persons involved in sample or sample container
transfer. Other information entered on the COC includes:
- Project name and number
- Sample field I.D. number and number of samples
- Sampler’s/recorder’s signature
- Name of person receiving the sample
- Inclusive dates of possession
- Date of sample receipt
- Project & collection location
- Date and time of collection
- Sample type & preservation information.
- Laboratory name, sample number, and analyses requested
4.4
The original COC forms are sealed in the shipping cooler. If samples are shipped by common carrier, the
sample custodian is responsible for ensuring the custody is formally transferred.
321 Frederick Street Santa Cruz CA 95062 (p) 831.426.9119 (f) 831.426.9023 w.2ndnaturellc.com
PLRM v1 Database Refinement: FINAL Phase II Monitoring Plan FIELD DATASHEETS Road Condition Evaluation Datasheets Instrument Logs (Sigma, InSitu) Chain of Custody Labels 2NDNATURE, LLC
500 Seabright Avenue Suite 205 Santa Cruz CA 95062 p 831.426.9119 w 2ndnaturellc.com
Lake Tahoe PLRM Database Refinement
page 1
May 15, 2009 - Final Sampling Plan
Road Condition Initial Road Segment Characterization Field Datasheet
• Complete only once, at first site visit. Data will generate RS field map and data table.
• All field observations are conducted looking downslope along road segment length.
Road Segment (RS) ID:
Date:
Field Personnel:
Time:
Metadata
Road Name:
Road Segment Slope:
Segment Boundaries:
H
L
Road Segment Tilt:
Upslope:
Dominant Direction:
Downslope:
Severity:
Road Segment Length:
ft
Road Segment Width:
Road Surface Integrity:
No
Protected: Yes
H
M
L
L
Type: Fencing Paving Boulders
Other
% LRS Protected:
% RRS Protected:
Stabilized? Yes
M
No
Other
25-50%
H
RIGHT ROAD SHOULDER
Type: Fencing Paving Boulders
0-25%
R
ft
LEFT ROAD SHOULDER
Protected? Yes
L
50-75%
75-100%
No
0-25%
25-50%
Stabilized? Yes
Dominant Type:
Curb and Gutter Rock Lined
50-75%
75-100%
No
Dominant Type:
Curb and Gutter Rock Lined
Other
Other
% Distribution:
% Distribution:
Curb and Gutter
Curb and Gutter
Rock Lined
Rock Lined
Other
Other
Severity of flow path erosion: H
M
L
Severity of flow path erosion: H
M
L
Notes:
2NDNATURE, LLC
321 Frederick Street Santa Cruz California 95062 phone 831-426-9119 fax 831-421-9023 email [email protected]
Lake Tahoe PLRM Database Refinement
page 2
May 15, 2009 - Final Sampling Plan
Road Condition Visual Observations, Dry Material Sampling and Wet Sediment Sampling
• Complete every site visit for dry (road material) and wet (simulated runoff) sample collection.
• All field observations are conducted looking downslope along road segment length.
Road Segment (RS) ID:
Days since Precip:
Field Personnel:
Evidence of Abrasives:
yes
no
Date:
Evidence of Sweeping:
yes
no
Weather:
Site Dustiness:
M
H
L
DRY (Road Material) Sample Collection
High Accumulation
% of RS:
Sample ID:
Sample Time:
Location:
Flow Path Road Shoulder
Drive Lane
Surface Integrity: H M L
Fines: H
M
L
Sample Volume:
Kept? yes no
Moderate Accumulation
Low Accumulation
% of RS:
Sample ID:
Sample Time:
Location:
Flow Path Road Shoulder
Drive Lane
Surface Integrity: H M L
Fines: H
M
L
Sample Volume:
Kept? yes no
% of RS:
Sample ID:
Sample Time:
Location:
Flow Path Road Shoulder
Drive Lane
Surface Integrity: H M L
Fines: H
M
L
Sample Volume:
Kept? yes no
WET (Simulated Runoff) Sample Collection
Sample ID:
Sample Time:
Accumulation: H M L
Location:
Flow Path Road Shoulder
Drive Lane
Surface Integrity: H M
Fines: H
M
L
Experiment Time:
Average Pressure:
Volume Applied:
L
Volume Recovered:
Material Mobilized: H
Turbidity:
M
L
Spot Turbidity Measurements
Sample ID:
Sample Time:
Location:
Flow Path
Turbidity:
Road Shoulder
Drive Lane
Additional Information
Traffic Density:
H
M
L
Notes:
2NDNATURE, LLC
321 Frederick Street Santa Cruz California 95062 phone 831-426-9119 fax 831-421-9023 email [email protected]
Road Rapid Assessment Methodology: Draft Protocols p. 1 ROAD RAM STEP 4B FIELD OBSERVATIONS – DRAFT FIELD DATASHEET Row # RS ID 1 2 Estimated Width (ft) ROAD RAM STEP 4 Field Observation Datasheet Field Personnel Observation Date Observation Time Road Segment (RS) Length (ft) RS Start [10,000/Width] RS End Primary Flow Path Dominant Flow Accessible to Sweeper? Non‐Native Accumulation? Handful or greater of material easily obtained? Yes No Yes No Yes No 3 4 Impervious Surface? (Y/N) 5 % of Road Segment Volume (ml) 6 Beyond Primary Flow Path Non‐Native Accessible to Sweeper? Accumulation? Yes No Yes No 7 Dry Material Collection MATERIAL ACCUMUNCATION AREA 1 Fines Test Finger print visible? Yes No Height MATERIAL ACCUMUNCATION AREA 2 Fines Test Finger Print Visible? Yes No 8 Height MATERIAL ACCUMUNCATION AREA 3 Fines Test Finger Print Visible? Yes No Area 3 Slimy / Gritty / Both / Neither Seconds Volume (ml) Yes No Percent Distribution Material Accumulation Area Area 1 Area 2 Slimy / Gritty / Both / Neither Seconds Volume (ml) Handful or greater of material easily obtained? Height Slimy / Gritty / Both / Neither Seconds Dust Test Ankle Knee Waist Dust Test Ankle Knee Waist Dust Test Ankle Knee Waist 2NDNATURE, LLC
500 Seabright Avenue Suite 205 Santa Cruz CA 95062 p 831.426.9119 w 2ndnaturellc.com
SIGMA AUTOMATED SAMPLER AND FLOW METER INSTRUMENT CHECKLIST - PLEASE FILL OUT EVERY TIME INSTRUMENT IS SERVICED / DOWNLOADED / CHECKED / ETC.
Samples Collected
Date
Time
Site
Event Type
Personnel
File Downloaded
#Bottles
Sent to Lab,
individ or
composited?
Settings
Event
Trigger
Sample
Interval
Vol per
Sample
Clean
Bottles
Flow
Sample
Reading Installed
per Bottle
Interval
Notes
IN-SITU WATER INSTRUMENT CHECKLIST - PLEASE FILL OUT EVERY TIME INSTRUMENT IS SERVICED / DOWNLOADED / CHECKED / ETC.
Battery
Date
Time
Site
Personnel
Gage
mini / baro / level
mini / baro / level
mini / baro / level
mini / baro / level
mini / baro / level
mini / baro / level
mini / baro / level
mini / baro / level
mini / baro / level
mini / baro / level
mini / baro / level
mini / baro / level
mini / baro / level
mini / baro / level
mini / baro / level
mini / baro / level
mini / baro / level
mini / baro / level
mini / baro / level
mini / baro / level
mini / baro / level
mini / baro / level
mini / baro / level
mini / baro / level
mini / baro / level
mini / baro / level
mini / baro / level
File Extracted
Data
OK
Capacity Changed?
New Test
New
Capacity
Name
Interval
Mode
Start
Time
Notes
CHAIN OF CUSTODY RECORD
2NDNATURE
321 Frederick Street, Santa Cruz, CA 95062
t 831.426.9119
f 831.421.9023
www.2ndnaturellc.com
PAGE
PROJECT NAME AND JOB #:
LABORATORY:
SEND CERTIFIED RESULTS TO:
TURNAROUND TIME:
ELECTRONIC DELIVERABLE FORMAT:
YES
NO
Standard
24hr Rush
OF
48hr Rush
72hr Rush
GLOBAL I.D.:
Sampler:
Date:
SAMPLE CONTAINERS
Sample Identification
Sample Date
Time
Sampled
Sample
Filtered?
REQUESTED ANALYSIS
2.5L bottle
Other
Composite
Samples?
Chlorophyll
Filtered
-
NOx
RELEASED BY:
1.
2.
3.
4.
5.
NOTES:
Date & Time
Additional
Analysis
Nutrients
30 mL
250 mL
Poly Bottles Poly Bottles
RECEIVED BY:
NO2
-
NH4
+
SRP
DP
Date & Time
DKN
TKN
TP
TSS
Grain Size
SAMPLE CONDITION (circle one)
Ambient
Refrigerated
Ice
Ambient
Refrigerated
Ice
Ambient
Refrigerated
Ice
Ambient
Refrigerated
Ice
Ambient
Refrigerated
Ice
08-570 SNPLMA PLRM SAMPLING
Site Location:
Sample Type:
Bottle #, Composite?:
Rep #:
Date:
Time Collected:
Field Personnel:
08-570 SNPLMA PLRM SAMPLING
Site Location:
Sample Type:
Bottle #, Composite?:
Rep #:
Date:
Time Collected:
Field Personnel:
08-570 SNPLMA PLRM SAMPLING
Site Location:
Sample Type:
Bottle #, Composite?:
Rep #:
Date:
Time Collected:
Field Personnel:
08-570 SNPLMA PLRM SAMPLING
Site Location:
Sample Type:
Bottle #, Composite?:
Rep #:
Date:
Time Collected:
Field Personnel:
08-570 SNPLMA PLRM SAMPLING
Site Location:
Sample Type:
Bottle #, Composite?:
Rep #:
Date:
Time Collected:
Field Personnel:
08-570 SNPLMA PLRM SAMPLING
Site Location:
Sample Type:
Bottle #, Composite?:
Rep #:
Date:
Time Collected:
Field Personnel:
08-570 SNPLMA PLRM SAMPLING
Site Location:
Sample Type:
Bottle #, Composite?:
Rep #:
Date:
Time Collected:
Field Personnel:
08-570 SNPLMA PLRM SAMPLING
Site Location:
Sample Type:
Bottle #, Composite?:
Rep #:
Date:
Time Collected:
Field Personnel:
08-570 SNPLMA PLRM SAMPLING
Site Location:
Sample Type:
Bottle #, Composite?:
Rep #:
Date:
Time Collected:
Field Personnel:
08-570 SNPLMA PLRM SAMPLING
Site Location:
Sample Type:
Bottle #, Composite?:
Rep #:
Date:
Time Collected:
Field Personnel:
PLRM v1 Database Refinement: FINAL Phase II Monitoring Plan APPENDIX A. WETLAB QUALITY ASSURANCE PLAN 2NDNATURE, LLC
500 Seabright Avenue Suite 205 Santa Cruz CA 95062 p 831.426.9119 w 2ndnaturellc.com
PLRM v1 Database Refinement: FINAL Phase II Monitoring Plan APPENDIX B. COOPER LABORATORY DOCUMENTATION 2NDNATURE, LLC
500 Seabright Avenue Suite 205 Santa Cruz CA 95062 p 831.426.9119 w 2ndnaturellc.com
COOPER TESTING LABS
STATEMENT OF QUALIFICATIONS
ACCREDITATION
Cooper Testing Labs has been inspected and accredited by AASHTO (American
Association of State Highway & Transportation Officials), The US Army Corps of
Engineers and Caltrans for Geotechnical Laboratory testing.
TESTING PROCEDURES
All testing at CTL is conducted in accordance with the specifications of the American
Society for Testing Materials (ASTM), U.S. Army Corps of Engineers, Caltrans and
other pertinent entities.
QUALITY CONTROL
Quality control is of the utmost importance at CTL. The laboratory managers continually
monitor testing activities in the lab in order to assure that testing is proceeding in
accordance with the appropriate standards. Any discrepancies are reviewed and the test
is rerun if appropriate. A laboratory manager reviews all test results before they are
released to the client. If test result accuracy is suspect, the entire test is reviewed and
rerun if appropriate.
GEOTECHNICAL TESTING EXPERIENCE
The staff at CTL has over 100 combined years of experience in the lab and in the field
doing geotechnical testing. All testing is performed by, or under the direct supervision
of, an experienced geotechnical laboratory technician.
OUTSIDE AUDITS
It is the policy of CTL to participate in testing audit activity, i.e., Caltrans Reference
Sample Program, AASHTO Materials Reference Program etc. Programs such as these
allow us to see how our results compare with those from labs around the state and around
the country.
SAMPLE CUSTODY PROCEDURES
Samples are logged in on arrival. At that time they are assigned a job number and start
date and are cross checked with the request sheet or chain of custody to make sure all the
samples are accounted for. They are then inspected for proper containment; i.e., sample
bags are sealed and have no holes; shelby tube end-caps are taped to prevent moisture
loss. If there is a chance of significant moisture loss prior to testing, samples will be
stored in a wet room that is kept at over 90% relative humidity. After testing is complete
the samples are logged into the sample storage room and assigned a shelf number and
date. The samples are stored for a minimum of 30 days after the report goes out. After 30
days the samples are returned to the sender for proper disposal if they are contaminated,
or discarded if they are not contaminated.
DATA FILING SYSTEM
Separate files are maintained by client and project. All original worksheets, purchase
orders, test requests and/or chain of custody documentation are kept in the client/project
file for a period of 7 years. Additional copies of any test results can be provided upon
request.
EQUIPMENT BACKUP SYSTEMS
It is the policy at CTL to maintain redundant testing systems wherever possible. This
redundancy is designed to minimize the impacts on testing of events such as power
outages or equipment failure. It also allows us to run comparison testing as a check of
the proper functioning of our equipment. For example, the majority of the equipment in
the lab is run on compressed air. Many of the tests such as permeability and consolidation
are long duration tests taking up to two weeks to complete. If the compressed air system
goes down, many tests can be ruined. We have set up our system with a backup
compressor on line, set to come on when the pressure drops below a predesignated
pressure level.
EQUIPMENT MAINTENANCE AND CALIBRATION
Equipment maintenance and calibration are an integral part of the testing process at CTL.
All applicable equipment (scales, load cells LVDTs, etc.) is calibrated at least once every
year by a senior CTL technician. An independent calibration company with equipment
traceable to NBS standards calibrates our calibration equipment annually. Each piece of
equipment is inspected when it is used for testing. All testing equipment and
instrumentation at CTL are regularly checked for signs of damage, wear, or being out of
calibration. Part of the job at CTL is to check the instrument each time it is used. If the
equipment is found to need service it is tagged out of service and reported to the
laboratory manager. The laboratory manager will assure the prompt repair of the
equipment. It is then recalibrated before being put back in service. All equipment
manuals, schematics and calibration reports are maintained in the laboratory manager's
files.
SELECTED LIST OF PROJECTS
The following is a partial list of projects for which we have provided geotechnical
laboratory services:
Dams
Uvas Dam
Danville Reservoir
Sunset Reservoir
Calaveras Dam
Leland Reservoir
Tongue River Dam
Bear Gulch Dam
Willow Lake Dam
Lenihan Dam
Mt. Spring Reservoir
Vikery Reservoir
Landfills
Altamont, Alameda
County
Eastlake, Clear Lake
Sunnyvale Landfill
Maui, Confidential
Koppers, Oroville
(Superfund)
Scotia, Scotia
Hillside, Colma
Casper, Mendocino
Mesquite Landfill
Sacramento Landfill
Fairhaven, Fairhaven
King City Landfill
Tunnels
Caldecott Tunnel
Lenihan Dam
Polhemus Tunnel
Crystal Springs Lake
Tap Shaft Tunnel &
Pipeline
Nuclear Power Plants
Diablo Canyon
Humbolt
Other Geotechnical Projects
Modesto Reservoir
Outlet Works
Los Vaqueros Water
Conveyance Project
Stanford Linear
Accelerator
Gilroy/Morgan Hill
Wastewater Treatment
Facility
Travis AFB
Altamont Pipeline &
Water Treatment Plant
Black Butte
Hydroelectric Project
Copyright © 1997-2008 Cooper Testing Laboratory
Designation: D 422 – 63 (Reapproved 2002)
Standard Test Method for
Particle-Size Analysis of Soils1
This standard is issued under the fixed designation D 422; the number immediately following the designation indicates the year of
original adoption or, in the case of revision, the year of last revision. A number in parentheses indicates the year of last reapproval. A
superscript epsilon (e) indicates an editorial change since the last revision or reapproval.
3.2 Stirring Apparatus—Either apparatus A or B may be
used.
3.2.1 Apparatus A shall consist of a mechanically operated
stirring device in which a suitably mounted electric motor turns
a vertical shaft at a speed of not less than 10 000 rpm without
load. The shaft shall be equipped with a replaceable stirring
paddle made of metal, plastic, or hard rubber, as shown in Fig.
1. The shaft shall be of such length that the stirring paddle will
operate not less than 3⁄4 in. (19.0 mm) nor more than 11⁄2 in.
(38.1 mm) above the bottom of the dispersion cup. A special
dispersion cup conforming to either of the designs shown in
Fig. 2 shall be provided to hold the sample while it is being
dispersed.
3.2.2 Apparatus B shall consist of an air-jet dispersion cup5
(Note 3) conforming to the general details shown in Fig. 3
(Note 4 and Note 5).
1. Scope
1.1 This test method covers the quantitative determination
of the distribution of particle sizes in soils. The distribution of
particle sizes larger than 75 µm (retained on the No. 200 sieve)
is determined by sieving, while the distribution of particle sizes
smaller than 75 µm is determined by a sedimentation process,
using a hydrometer to secure the necessary data (Note 1 and
Note 2).
NOTE 1—Separation may be made on the No. 4 (4.75-mm), No. 40
(425-µm), or No. 200 (75-µm) sieve instead of the No. 10. For whatever
sieve used, the size shall be indicated in the report.
NOTE 2—Two types of dispersion devices are provided: (1) a highspeed mechanical stirrer, and (2) air dispersion. Extensive investigations
indicate that air-dispersion devices produce a more positive dispersion of
plastic soils below the 20-µm size and appreciably less degradation on all
sizes when used with sandy soils. Because of the definite advantages
favoring air dispersion, its use is recommended. The results from the two
types of devices differ in magnitude, depending upon soil type, leading to
marked differences in particle size distribution, especially for sizes finer
than 20 µm.
NOTE 3—The amount of air required by an air-jet dispersion cup is of
the order of 2 ft3/min; some small air compressors are not capable of
supplying sufficient air to operate a cup.
NOTE 4—Another air-type dispersion device, known as a dispersion
tube, developed by Chu and Davidson at Iowa State College, has been
shown to give results equivalent to those secured by the air-jet dispersion
cups. When it is used, soaking of the sample can be done in the
sedimentation cylinder, thus eliminating the need for transferring the
slurry. When the air-dispersion tube is used, it shall be so indicated in the
report.
NOTE 5—Water may condense in air lines when not in use. This water
must be removed, either by using a water trap on the air line, or by
blowing the water out of the line before using any of the air for dispersion
purposes.
2. Referenced Documents
2.1 ASTM Standards:
D 421 Practice for Dry Preparation of Soil Samples for
Particle-Size Analysis and Determination of Soil Constants2
E 11 Specification for Wire-Cloth Sieves for Testing Purposes3
E 100 Specification for ASTM Hydrometers4
3. Apparatus
3.1 Balances—A balance sensitive to 0.01 g for weighing
the material passing a No. 10 (2.00-mm) sieve, and a balance
sensitive to 0.1 % of the mass of the sample to be weighed for
weighing the material retained on a No. 10 sieve.
3.3 Hydrometer—An ASTM hydrometer, graduated to read
in either specific gravity of the suspension or grams per litre of
suspension, and conforming to the requirements for hydrometers 151H or 152H in Specifications E 100. Dimensions of
both hydrometers are the same, the scale being the only item of
difference.
3.4 Sedimentation Cylinder—A glass cylinder essentially 18
in. (457 mm) in height and 21⁄2 in. (63.5 mm) in diameter, and
1
This test method is under the jurisdiction of ASTM Committee D-18 on Soil
and Rock and is the direct responsibility of Subcommittee D18.03 on Texture,
Plasticity, and Density Characteristics of Soils.
Current edition approved Nov. 10, 2002. Published March 2003Originally
published in 1935. Last previous edition approved in 1998 as D 422 – 63 (1998).
2
Annual Book of ASTM Standards, Vol 04.08.
3
Annual Book of ASTM Standards, Vol 14.02.
4
Annual Book of ASTM Standards, Vol 14.03.
5
Detailed working drawings for this cup are available at a nominal cost from the
American Society for Testing and Materials, 100 Barr Harbor Drive, West
Conshohocken, PA 19428. Order Adjunct No. ADJD0422.
Copyright © ASTM International, 100 Barr Harbor Drive, PO Box C700, West Conshohocken, PA 19428-2959, United States.
1
D 422 – 63 (2002)
Metric Equivalents
in.
mm
0.001
0.03
0.049
1.24
0.203
5.16
1⁄2
12.7
3⁄4
19.0
FIG. 1 Detail of Stirring Paddles
NOTE 6—A set of sieves giving uniform spacing of points for the graph,
as required in Section 17, may be used if desired. This set consists of the
following sieves:
3-in. (75-mm)
11⁄2-in. (37.5-mm)
3⁄4-in. (19.0-mm)
3⁄8-in. (9.5-mm)
No. 4 (4.75-mm)
No. 8 (2.36-mm)
No.
No.
No.
No.
No.
16 (1.18-mm)
30 (600-µm)
50 (300-µm)
100 (150-µm)
200 (75-µm)
3.7 Water Bath or Constant-Temperature Room—A water
bath or constant-temperature room for maintaining the soil
suspension at a constant temperature during the hydrometer
analysis. A satisfactory water tank is an insulated tank that
maintains the temperature of the suspension at a convenient
constant temperature at or near 68°F (20°C). Such a device is
illustrated in Fig. 4. In cases where the work is performed in a
room at an automatically controlled constant temperature, the
water bath is not necessary.
3.8 Beaker—A beaker of 250-mL capacity.
3.9 Timing Device—A watch or clock with a second hand.
4. Dispersing Agent
4.1 A solution of sodium hexametaphosphate (sometimes
called sodium metaphosphate) shall be used in distilled or
demineralized water, at the rate of 40 g of sodium
hexametaphosphate/litre of solution (Note 7).
Metric Equivalents
in.
mm
1.3
33
2.6
66
3.75
95.2
FIG. 2 Dispersion Cups of Apparatus
NOTE 7—Solutions of this salt, if acidic, slowly revert or hydrolyze
back to the orthophosphate form with a resultant decrease in dispersive
action. Solutions should be prepared frequently (at least once a month) or
adjusted to pH of 8 or 9 by means of sodium carbonate. Bottles containing
solutions should have the date of preparation marked on them.
marked for a volume of 1000 mL. The inside diameter shall be
such that the 1000-mL mark is 36 6 2 cm from the bottom on
the inside.
3.5 Thermometer—A thermometer accurate to 1°F (0.5°C).
3.6 Sieves—A series of sieves, of square-mesh woven-wire
cloth, conforming to the requirements of Specification E 11. A
full set of sieves includes the following (Note 6):
3-in. (75-mm)
2-in. (50-mm)
11⁄2-in. (37.5-mm)
1-in. (25.0-mm)
3⁄4-in. (19.0-mm)
3⁄8-in. (9.5-mm)
No. 4 (4.75-mm)
No.
No.
No.
No.
No.
No.
4.2 All water used shall be either distilled or demineralized
water. The water for a hydrometer test shall be brought to the
temperature that is expected to prevail during the hydrometer
test. For example, if the sedimentation cylinder is to be placed
in the water bath, the distilled or demineralized water to be
used shall be brought to the temperature of the controlled water
bath; or, if the sedimentation cylinder is used in a room with
controlled temperature, the water for the test shall be at the
temperature of the room. The basic temperature for the
10 (2.00-mm)
20 (850-µm)
40 (425-µm)
60 (250-µm)
140 (106-µm)
200 (75-µm)
2
D 422 – 63 (2002)
FIG. 3 Air-Jet Dispersion Cups of Apparatus B
Metric Equivalents
in.
mm
⁄
22.2
78
1
25.4
3
76.2
61⁄4
158.2
14
356
37
940
FIG. 4 Insulated Water Bath
hydrometer test is 68°F (20°C). Small variations of temperature do not introduce differences that are of practical significance and do not prevent the use of corrections derived as
prescribed.
Nominal Diameter of
Largest Particles,
in. (mm)
3⁄8 (9.5)
3⁄4 (19.0)
1 (25.4)
11⁄2 (38.1)
2 (50.8)
3 (76.2)
5. Test Sample
5.1 Prepare the test sample for mechanical analysis as
outlined in Practice D 421. During the preparation procedure
the sample is divided into two portions. One portion contains
only particles retained on the No. 10 (2.00-mm) sieve while the
other portion contains only particles passing the No. 10 sieve.
The mass of air-dried soil selected for purpose of tests, as
prescribed in Practice D 421, shall be sufficient to yield
quantities for mechanical analysis as follows:
5.1.1 The size of the portion retained on the No. 10 sieve
shall depend on the maximum size of particle, according to the
following schedule:
Approximate Minimum
Mass of Portion, g
500
1000
2000
3000
4000
5000
5.1.2 The size of the portion passing the No. 10 sieve shall
be approximately 115 g for sandy soils and approximately 65
g for silt and clay soils.
5.2 Provision is made in Section 5 of Practice D 421 for
weighing of the air-dry soil selected for purpose of tests, the
separation of the soil on the No. 10 sieve by dry-sieving and
washing, and the weighing of the washed and dried fraction
retained on the No. 10 sieve. From these two masses the
3
D 422 – 63 (2002)
needed. Measurement of the composite corrections may be
made at two temperatures spanning the range of expected test
temperatures, and corrections for the intermediate temperatures
calculated assuming a straight-line relationship between the
two observed values.
7.3 Prepare 1000 mL of liquid composed of distilled or
demineralized water and dispersing agent in the same proportion as will prevail in the sedimentation (hydrometer) test.
Place the liquid in a sedimentation cylinder and the cylinder in
the constant-temperature water bath, set for one of the two
temperatures to be used. When the temperature of the liquid
becomes constant, insert the hydrometer, and, after a short
interval to permit the hydrometer to come to the temperature of
the liquid, read the hydrometer at the top of the meniscus
formed on the stem. For hydrometer 151H the composite
correction is the difference between this reading and one; for
hydrometer 152H it is the difference between the reading and
zero. Bring the liquid and the hydrometer to the other temperature to be used, and secure the composite correction as before.
percentages retained and passing the No. 10 sieve can be
calculated in accordance with 12.1.
NOTE 8—A check on the mass values and the thoroughness of pulverization of the clods may be secured by weighing the portion passing the
No. 10 sieve and adding this value to the mass of the washed and
oven-dried portion retained on the No. 10 sieve.
SIEVE ANALYSIS OF PORTION RETAINED ON NO.
10
(2.00-mm) SIEVE
6. Procedure
6.1 Separate the portion retained on the No. 10 (2.00-mm)
sieve into a series of fractions using the 3-in. (75-mm), 2-in.
(50-mm), 11⁄2-in. (37.5-mm), 1-in. (25.0-mm), 3⁄4-in. (19.0mm), 3⁄8-in. (9.5-mm), No. 4 (4.75-mm), and No. 10 sieves, or
as many as may be needed depending on the sample, or upon
the specifications for the material under test.
6.2 Conduct the sieving operation by means of a lateral and
vertical motion of the sieve, accompanied by a jarring action in
order to keep the sample moving continuously over the surface
of the sieve. In no case turn or manipulate fragments in the
sample through the sieve by hand. Continue sieving until not
more than 1 mass % of the residue on a sieve passes that sieve
during 1 min of sieving. When mechanical sieving is used, test
the thoroughness of sieving by using the hand method of
sieving as described above.
6.3 Determine the mass of each fraction on a balance
conforming to the requirements of 3.1. At the end of weighing,
the sum of the masses retained on all the sieves used should
equal closely the original mass of the quantity sieved.
8. Hygroscopic Moisture
8.1 When the sample is weighed for the hydrometer test,
weigh out an auxiliary portion of from 10 to 15 g in a small
metal or glass container, dry the sample to a constant mass in
an oven at 230 6 9°F (110 6 5°C), and weigh again. Record
the masses.
9. Dispersion of Soil Sample
9.1 When the soil is mostly of the clay and silt sizes, weigh
out a sample of air-dry soil of approximately 50 g. When the
soil is mostly sand the sample should be approximately 100 g.
9.2 Place the sample in the 250-mL beaker and cover with
125 mL of sodium hexametaphosphate solution (40 g/L). Stir
until the soil is thoroughly wetted. Allow to soak for at least 16
h.
9.3 At the end of the soaking period, disperse the sample
further, using either stirring apparatus A or B. If stirring
apparatus A is used, transfer the soil-water slurry from the
beaker into the special dispersion cup shown in Fig. 2, washing
any residue from the beaker into the cup with distilled or
demineralized water (Note 9). Add distilled or demineralized
water, if necessary, so that the cup is more than half full. Stir
for a period of 1 min.
HYDROMETER AND SIEVE ANALYSIS OF PORTION
PASSING THE NO. 10 (2.00-mm) SIEVE
7. Determination of Composite Correction for
Hydrometer Reading
7.1 Equations for percentages of soil remaining in suspension, as given in 14.3, are based on the use of distilled or
demineralized water. A dispersing agent is used in the water,
however, and the specific gravity of the resulting liquid is
appreciably greater than that of distilled or demineralized
water.
7.1.1 Both soil hydrometers are calibrated at 68°F (20°C),
and variations in temperature from this standard temperature
produce inaccuracies in the actual hydrometer readings. The
amount of the inaccuracy increases as the variation from the
standard temperature increases.
7.1.2 Hydrometers are graduated by the manufacturer to be
read at the bottom of the meniscus formed by the liquid on the
stem. Since it is not possible to secure readings of soil
suspensions at the bottom of the meniscus, readings must be
taken at the top and a correction applied.
7.1.3 The net amount of the corrections for the three items
enumerated is designated as the composite correction, and may
be determined experimentally.
7.2 For convenience, a graph or table of composite corrections for a series of 1° temperature differences for the range of
expected test temperatures may be prepared and used as
NOTE 9—A large size syringe is a convenient device for handling the
water in the washing operation. Other devices include the wash-water
bottle and a hose with nozzle connected to a pressurized distilled water
tank.
9.4 If stirring apparatus B (Fig. 3) is used, remove the cover
cap and connect the cup to a compressed air supply by means
of a rubber hose. A air gage must be on the line between the
cup and the control valve. Open the control valve so that the
gage indicates 1 psi (7 kPa) pressure (Note 10). Transfer the
soil-water slurry from the beaker to the air-jet dispersion cup
by washing with distilled or demineralized water. Add distilled
or demineralized water, if necessary, so that the total volume in
the cup is 250 mL, but no more.
NOTE 10—The initial air pressure of 1 psi is required to prevent the
soil-water mixture from entering the air-jet chamber when the mixture is
4
D 422 – 63 (2002)
CALCULATIONS AND REPORT
transferred to the dispersion cup.
9.5 Place the cover cap on the cup and open the air control
valve until the gage pressure is 20 psi (140 kPa). Disperse the
soil according to the following schedule:
Plasticity Index
Dispersion Period,
min
Under 5
6 to 20
Over 20
5
10
15
12. Sieve Analysis Values for the Portion Coarser than
the No. 10 (2.00-mm) Sieve
12.1 Calculate the percentage passing the No. 10 sieve by
dividing the mass passing the No. 10 sieve by the mass of soil
originally split on the No. 10 sieve, and multiplying the result
by 100. To obtain the mass passing the No. 10 sieve, subtract
the mass retained on the No. 10 sieve from the original mass.
12.2 To secure the total mass of soil passing the No. 4
(4.75-mm) sieve, add to the mass of the material passing the
No. 10 sieve the mass of the fraction passing the No. 4 sieve
and retained on the No. 10 sieve. To secure the total mass of
soil passing the 3⁄8-in. (9.5-mm) sieve, add to the total mass of
soil passing the No. 4 sieve, the mass of the fraction passing the
3⁄8-in. sieve and retained on the No. 4 sieve. For the remaining
sieves, continue the calculations in the same manner.
12.3 To determine the total percentage passing for each
sieve, divide the total mass passing (see 12.2) by the total mass
of sample and multiply the result by 100.
Soils containing large percentages of mica need be dispersed
for only 1 min. After the dispersion period, reduce the gage
pressure to 1 psi preparatory to transfer of soil-water slurry to
the sedimentation cylinder.
10. Hydrometer Test
10.1 Immediately after dispersion, transfer the soil-water
slurry to the glass sedimentation cylinder, and add distilled or
demineralized water until the total volume is 1000 mL.
10.2 Using the palm of the hand over the open end of the
cylinder (or a rubber stopper in the open end), turn the cylinder
upside down and back for a period of 1 min to complete the
agitation of the slurry (Note 11). At the end of 1 min set the
cylinder in a convenient location and take hydrometer readings
at the following intervals of time (measured from the beginning
of sedimentation), or as many as may be needed, depending on
the sample or the specification for the material under test: 2, 5,
15, 30, 60, 250, and 1440 min. If the controlled water bath is
used, the sedimentation cylinder should be placed in the bath
between the 2- and 5-min readings.
13. Hygroscopic Moisture Correction Factor
13.1 The hydroscopic moisture correction factor is the ratio
between the mass of the oven-dried sample and the air-dry
mass before drying. It is a number less than one, except when
there is no hygroscopic moisture.
14. Percentages of Soil in Suspension
14.1 Calculate the oven-dry mass of soil used in the
hydrometer analysis by multiplying the air-dry mass by the
hygroscopic moisture correction factor.
14.2 Calculate the mass of a total sample represented by the
mass of soil used in the hydrometer test, by dividing the
oven-dry mass used by the percentage passing the No. 10
(2.00-mm) sieve, and multiplying the result by 100. This value
is the weight W in the equation for percentage remaining in
suspension.
14.3 The percentage of soil remaining in suspension at the
level at which the hydrometer is measuring the density of the
suspension may be calculated as follows (Note 13): For
hydrometer 151H:
NOTE 11—The number of turns during this minute should be approximately 60, counting the turn upside down and back as two turns. Any soil
remaining in the bottom of the cylinder during the first few turns should
be loosened by vigorous shaking of the cylinder while it is in the inverted
position.
10.3 When it is desired to take a hydrometer reading,
carefully insert the hydrometer about 20 to 25 s before the
reading is due to approximately the depth it will have when the
reading is taken. As soon as the reading is taken, carefully
remove the hydrometer and place it with a spinning motion in
a graduate of clean distilled or demineralized water.
P 5 @~100 000/W! 3 G/~G 2 G 1!#~R 2 G1!
(1)
NOTE 13—The bracketed portion of the equation for hydrometer 151H
is constant for a series of readings and may be calculated first and then
multiplied by the portion in the parentheses.
NOTE 12—It is important to remove the hydrometer immediately after
each reading. Readings shall be taken at the top of the meniscus formed
by the suspension around the stem, since it is not possible to secure
readings at the bottom of the meniscus.
For hydrometer 152H:
P 5 ~Ra/W! 3 100
10.4 After each reading, take the temperature of the suspension by inserting the thermometer into the suspension.
(2)
where:
a = correction faction to be applied to the reading of
hydrometer 152H. (Values shown on the scale are
computed using a specific gravity of 2.65. Correction
factors are given in Table 1),
P = percentage of soil remaining in suspension at the level
at which the hydrometer measures the density of the
suspension,
R = hydrometer reading with composite correction applied (Section 7),
11. Sieve Analysis
11.1 After taking the final hydrometer reading, transfer the
suspension to a No. 200 (75-µm) sieve and wash with tap water
until the wash water is clear. Transfer the material on the No.
200 sieve to a suitable container, dry in an oven at 230 6 9°F
(110 6 5°C) and make a sieve analysis of the portion retained,
using as many sieves as desired, or required for the material, or
upon the specification of the material under test.
5
D 422 – 63 (2002)
W
G
G1
TABLE 2 Values of Effective Depth Based on Hydrometer and
Sedimentation Cylinder of Specified SizesA
= oven-dry mass of soil in a total test sample represented by mass of soil dispersed (see 14.2), g,
= specific gravity of the soil particles, and
= specific gravity of the liquid in which soil particles
are suspended. Use numerical value of one in both
instances in the equation. In the first instance any
possible variation produces no significant effect, and
in the second instance, the composite correction for R
is based on a value of one for G1.
Hydrometer 151H
1.000
1.001
1.002
1.003
1.004
1.005
1.006
1.007
1.008
1.009
1.010
1.011
1.012
1.013
1.014
1.015
1.016
1.017
1.018
1.019
1.020
1.021
1.022
1.023
1.024
1.025
1.026
1.027
1.028
1.029
1.030
1.031
1.032
1.033
1.034
1.035
1.036
1.037
1.038
15. Diameter of Soil Particles
15.1 The diameter of a particle corresponding to the percentage indicated by a given hydrometer reading shall be
calculated according to Stokes’ law (Note 14), on the basis that
a particle of this diameter was at the surface of the suspension
at the beginning of sedimentation and had settled to the level at
which the hydrometer is measuring the density of the suspension. According to Stokes’ law: see Table 2
D 5 =@30n/980~G 2 G 1!# 3 L/T
(3)
where:
D = diameter of particle, mm,
n = coefficient of viscosity of the suspending medium (in
this case water) in poises (varies with changes in
temperature of the suspending medium),
L = distance from the surface of the suspension to the
level at which the density of the suspension is being
measured, cm. (For a given hydrometer and sedimentation cylinder, values vary according to the hydrometer readings. This distance is known as effective
depth (see Table 2)),
T = interval of time from beginning of sedimentation to
the taking of the reading, min,
G = specific gravity of soil particles, and
G1 = specific gravity (relative density) of suspending medium (value may be used as 1.000 for all practical
purposes).
A
15.2 For convenience in calculations the above equation
may be written as follows: see Table 3
2.95
2.90
2.85
2.80
2.75
2.70
2.65
2.60
2.55
2.50
2.45
0.94
0.95
0.96
0.97
0.98
0.99
1.00
1.01
1.02
1.03
1.05
0
1
2
3
4
5
6
7
8
9
10
11
12
13
14
15
16
17
18
19
20
21
22
23
24
25
26
27
28
29
30
16.3
16.1
16.0
15.8
15.6
15.5
15.3
15.2
15.0
14.8
14.7
14.5
14.3
14.2
14.0
13.8
13.7
13.5
13.3
13.2
13.0
12.9
12.7
12.5
12.4
12.2
12.0
11.9
11.7
11.5
11.4
31
32
33
34
35
11.2
11.1
10.9
10.7
10.6
36
37
38
39
40
41
42
43
44
45
46
47
48
49
50
51
52
53
54
55
56
57
58
59
60
10.4
10.2
10.1
9.9
9.7
9.6
9.4
9.2
9.1
8.9
8.8
8.6
8.4
8.3
8.1
7.9
7.8
7.6
7.4
7.3
7.1
7.0
6.8
6.6
6.5
Values of effective depth are calculated from the equation:
L 5 L1 1 1 / 2 @L2 2 ~VB/A!#
(5)
Values used in calculating the values in Table 2 are as follows:
For both hydrometers, 151H and 152H:
L2 = 14.0 cm
VB = 67.0 cm3
A
= 27.8 cm2
TABLE 1 Values of Correction Factor, a, for Different Specific
Gravities of Soil ParticlesA
Correction FactorA
16.3
16.0
15.8
15.5
15.2
15.0
14.7
14.4
14.2
13.9
13.7
13.4
13.1
12.9
12.6
12.3
12.1
11.8
11.5
11.3
11.0
10.7
10.5
10.2
10.0
9.7
9.4
9.2
8.9
8.6
8.4
8.1
7.8
7.6
7.3
7.0
6.8
6.5
6.2
where:
L
= effective depth, cm,
L1
= distance along the stem of the hydrometer from the top of the bulb to
the mark for a hydrometer reading, cm,
L 2 = overall length of the hydrometer bulb, cm,
VB = volume of hydrometer bulb, cm3, and
A
= cross-sectional area of sedimentation cylinder, cm2
NOTE 14—Since Stokes’ law considers the terminal velocity of a single
sphere falling in an infinity of liquid, the sizes calculated represent the
diameter of spheres that would fall at the same rate as the soil particles.
Specific Gravity
Hydrometer 152H
Actual
Actual
Effective
Actual
Effective
Effective
Hydrometer
Hydrometer Depth, L,
Hydrometer
Depth, L, cm
Depth, L, cm
cm
Reading
Reading
Reading
For hydrometer 151H:
L1 = 10.5 cm for a reading of 1.000
= 2.3 cm for a reading of 1.031
For hydrometer 152H:
L1 = 10.5 cm for a reading of 0 g/litre
= 2.3 cm for a reading of 50 g/litre
A
For use in equation for percentage of soil remaining in suspension when using
Hydrometer 152H.
D 5 K=L/T
6
(4)
D 422 – 63 (2002)
TABLE 3 Values of K for Use in Equation for Computing Diameter of Particle in Hydrometer Analysis
Specific Gravity of Soil Particles
Temperature,°
C
2.45
2.50
2.55
2.60
2.65
2.70
2.75
2.80
2.85
16
17
18
19
20
21
22
23
24
25
26
27
28
29
30
0.01510
0.01511
0.01492
0.01474
0.01456
0.01438
0.01421
0.01404
0.01388
0.01372
0.01357
0.01342
0.01327
0.01312
0.01298
0.01505
0.01486
0.01467
0.01449
0.01431
0.01414
0.01397
0.01381
0.01365
0.01349
0.01334
0.01319
0.01304
0.01290
0.01276
0.01481
0.01462
0.01443
0.01425
0.01408
0.01391
0.01374
0.01358
0.01342
0.01327
0.01312
0.01297
0.01283
0.01269
0.01256
0.01457
0.01439
0.01421
0.01403
0.01386
0.01369
0.01353
0.01337
0.01321
0.01306
0.01291
0.01277
0.01264
0.01249
0.01236
0.01435
0.01417
0.01399
0.01382
0.01365
0.01348
0.01332
0.01317
0.01301
0.01286
0.01272
0.01258
0.01244
0.01230
0.01217
0.01414
0.01396
0.01378
0.01361
0.01344
0.01328
0.01312
0.01297
0.01282
0.01267
0.01253
0.01239
0.01255
0.01212
0.01199
0.01394
0.01376
0.01359
0.01342
0.01325
0.01309
0.01294
0.01279
0.01264
0.01249
0.01235
0.01221
0.01208
0.01195
0.01182
0.01374
0.01356
0.01339
0.1323
0.01307
0.01291
0.01276
0.01261
0.01246
0.01232
0.01218
0.01204
0.01191
0.01178
0.01165
0.01356
0.01338
0.01321
0.01305
0.01289
0.01273
0.01258
0.01243
0.01229
0.01215
0.01201
0.01188
0.01175
0.01162
0.01149
is not made on a portion of the soil, the preparation of the graph
is optional, since values may be secured directly from tabulated
data.
where:
K = constant depending on the temperature of the suspension and the specific gravity of the soil particles.
Values of K for a range of temperatures and specific
gravities are given in Table 3. The value of K does not
change for a series of readings constituting a test,
while values of L and T do vary.
15.3 Values of D may be computed with sufficient accuracy,
using an ordinary 10-in. slide rule.
18. Report
18.1 The report shall include the following:
18.1.1 Maximum size of particles,
18.1.2 Percentage passing (or retained on) each sieve, which
may be tabulated or presented by plotting on a graph (Note 16),
18.1.3 Description of sand and gravel particles:
18.1.3.1 Shape—rounded or angular,
18.1.3.2 Hardness—hard and durable, soft, or weathered
and friable,
18.1.4 Specific gravity, if unusually high or low,
18.1.5 Any difficulty in dispersing the fraction passing the
No. 10 (2.00-mm) sieve, indicating any change in type and
amount of dispersing agent, and
18.1.6 The dispersion device used and the length of the
dispersion period.
NOTE 15—The value of L is divided by T using the A- and B-scales, the
square root being indicated on the D-scale. Without ascertaining the value
of the square root it may be multiplied by K, using either the C- or
CI-scale.
16. Sieve Analysis Values for Portion Finer than No. 10
(2.00-mm) Sieve
16.1 Calculation of percentages passing the various sieves
used in sieving the portion of the sample from the hydrometer
test involves several steps. The first step is to calculate the mass
of the fraction that would have been retained on the No. 10
sieve had it not been removed. This mass is equal to the total
percentage retained on the No. 10 sieve (100 minus total
percentage passing) times the mass of the total sample represented by the mass of soil used (as calculated in 14.2), and the
result divided by 100.
16.2 Calculate next the total mass passing the No. 200 sieve.
Add together the fractional masses retained on all the sieves,
including the No. 10 sieve, and subtract this sum from the mass
of the total sample (as calculated in 14.2).
16.3 Calculate next the total masses passing each of the
other sieves, in a manner similar to that given in 12.2.
16.4 Calculate last the total percentages passing by dividing
the total mass passing (as calculated in 16.3) by the total mass
of sample (as calculated in 14.2), and multiply the result by
100.
NOTE 16—This tabulation of graph represents the gradation of the
sample tested. If particles larger than those contained in the sample were
removed before testing, the report shall so state giving the amount and
maximum size.
18.2 For materials tested for compliance with definite specifications, the fractions called for in such specifications shall be
reported. The fractions smaller than the No. 10 sieve shall be
read from the graph.
18.3 For materials for which compliance with definite
specifications is not indicated and when the soil is composed
almost entirely of particles passing the No. 4 (4.75-mm) sieve,
the results read from the graph may be reported as follows:
(1) Gravel, passing 3-in. and retained on No. 4 sieve
(2) Sand, passing No. 4 sieve and retained on No. 200 sieve
(a) Coarse sand, passing No. 4 sieve and retained on No. 10 sieve
(b) Medium sand, passing No. 10 sieve and retained on No. 40 sieve
(c) Fine sand, passing No. 40 sieve and retained on No. 200 sieve
(3) Silt size, 0.074 to 0.005 mm
(4) Clay size, smaller than 0.005 mm
Colloids, smaller than 0.001 mm
17. Graph
17.1 When the hydrometer analysis is performed, a graph of
the test results shall be made, plotting the diameters of the
particles on a logarithmic scale as the abscissa and the
percentages smaller than the corresponding diameters to an
arithmetic scale as the ordinate. When the hydrometer analysis
.....
.....
.....
.....
.....
.....
.....
.....
18.4 For materials for which compliance with definite
specifications is not indicated and when the soil contains
7
%
%
%
%
%
%
%
%
D 422 – 63 (2002)
material retained on the No. 4 sieve sufficient to require a sieve
analysis on that portion, the results may be reported as follows
(Note 17):
No. 10 (2.00-mm)
No. 40 (425-µm)
No. 200 (75-µm)
.........
.........
.........
HYDROMETER ANALYSIS
SIEVE ANALYSIS
Sieve Size
3-in.
2-in.
11⁄2-in.
1-in.
3⁄4-in.
3⁄8-in.
No. 4 (4.75-mm)
0.074 mm
0.005 mm
0.001 mm
Percentage
Passing
.........
.........
.........
NOTE 17—No. 8 (2.36-mm) and No. 50 (300-µm) sieves may be
substituted for No. 10 and No. 40 sieves.
.........
.........
.........
.........
.........
.........
.........
19. Keywords
19.1 grain-size; hydrometer analysis; hygroscopic moisture;
particle-size; sieve analysis
ASTM International takes no position respecting the validity of any patent rights asserted in connection with any item mentioned
in this standard. Users of this standard are expressly advised that determination of the validity of any such patent rights, and the risk
of infringement of such rights, are entirely their own responsibility.
This standard is subject to revision at any time by the responsible technical committee and must be reviewed every five years and
if not revised, either reapproved or withdrawn. Your comments are invited either for revision of this standard or for additional standards
and should be addressed to ASTM International Headquarters. Your comments will receive careful consideration at a meeting of the
responsible technical committee, which you may attend. If you feel that your comments have not received a fair hearing you should
make your views known to the ASTM Committee on Standards, at the address shown below.
This standard is copyrighted by ASTM International, 100 Barr Harbor Drive, PO Box C700, West Conshohocken, PA 19428-2959,
United States. Individual reprints (single or multiple copies) of this standard may be obtained by contacting ASTM at the above
address or at 610-832-9585 (phone), 610-832-9555 (fax), or [email protected] (e-mail); or through the ASTM website
(www.astm.org).
8