1
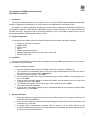
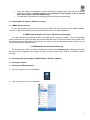
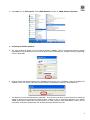
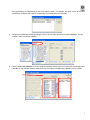
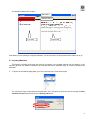
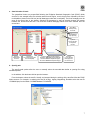
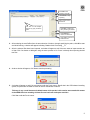
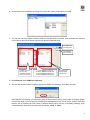
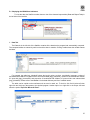
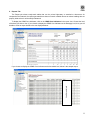
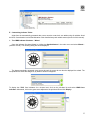
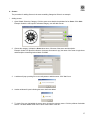
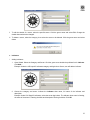
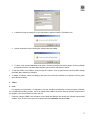
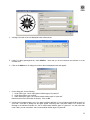
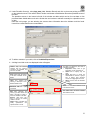
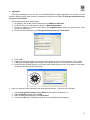
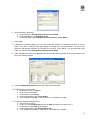
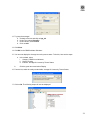
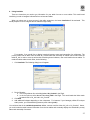
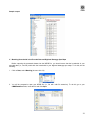
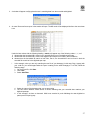
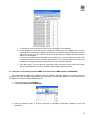
Manual for Manual for CBMS Statistics Simulator (StatSimSGE version 4.0)
Prepared by the CBMS Network Coordinating Team of the Angelo King Institute for Economic and Business Studies This work was carried out by the PEP‐CBMS Network Coordinating Team with the financial support of the Government of Canada provided through the International Development Research Centre (IDRC) and the Canadian International Development Agency (CIDA) User’s Manual for CBMS Statistics Simulator
(StatSimSGE version 4.0)
I.
Introduction
This manual contains guidelines and instructions on the use of the CBMS Statistics Simulator (StatSimSGE
version 4.) designed and customized for the LGU partners of the CBMS Network Coordinating Team.
The StatSim is a MySQL application developed to simulate simple computations and tabulations usually done
using statistical software or other tabulation applications and also to export indicators for use in dissemination such
as tables and maps. Although this has the mentioned capability, this is not intended to replace the use of more
sophisticated statistical software like SAS, Stata or SPSS.
A. System Configuration
It is required that the following system configuration should be met for better and faster processing:
¾
¾
¾
¾
¾
¾
¾
Pentium IV processor or equivalent
256MB of RAM
SVGA monitor
Mouse
80MB of free hard drive space
Microsoft Windows 98, Me, NT 4.0, 2000, XP or 32-bit Vista
Microsoft Office 2003
B. Installation
The step-by-step installation procedure below will update the existing CBMS encoding system in the computer.
The installation is quick and simple.
Steps in installing the software:
1. Insert the installation CD provided by the CBMS Team in the computer’s CD-ROM drive
2. The setup menu will automatically popup. If it does not, open windows explorer and double click the CD
drive where the CD is located and run “manage.exe”.
3. A welcome screen will appear. Click “Next”.
4. The setup will require the user to accept the agreement upon using the software. After agreeing on the
terms, click “Next”.
5. A pop-up screen will appear asking for Customer Information, enter the name of the user as well as the
company/office name. Click “Next”.
6. The user will be prompted to select a set-up type. Select Complete and Click “Next”.
7. Click Install to begin the Installation.
8. A pop-up screen will appear informing that the InstallShield Wizard has successfully installed CBMS
StatSimSGE 4.0. Click “Finish”.
II. General instructions
•
•
•
Set-up and maintain a computer that will serve as your data repository. This computer should store all
encoded text files and NRDB files.
Before using the StatSim for processing and consolidating your data, check first for the accuracy and
consistency of your text files.
If needed, perform concatenation procedure (refer to Section III of the User’s Manual for the
Computerized Data Encoding System) to merge encoded household data from same barangays. This is
crucial prior to the simulation process.
2
•
•
Check the matching of households in the encoded data and digitized spot map using the Household
Identification Number. Complete matching of households for both datasets must be attained
before processing to avoid repeating the steps.
The application will guide the user through the process through clicks and dialogs.
III. Preparing Encoded Data for StatSim Processing
A. CBMS Database Structure
By now, the encoders and processors are most likely familiar with the file structure of the CBMS Database.
However, it must still be noted that the general file/folder structure of the CBMS Database is:
C:\CBMSDatabase\<Region>\<Province>\<Municipality>\<Barangay>
The folder structure was designed so that the encoded data are stored by barangay. Thus, each barangay
folders contains the text (ASCII) file where the household data are stored. Recall that the folder names make use of
the Philippine Standard Geographic Codes (PSGC). For instance, if the encoded data of interest is Brgy. Pila, San
Pascual, Batangas, the target file will be:
C:\CBMSDatabase\04\10\26\019\041026019.hpq
The file path above refers to the folder containing the encoded data (041026019.hpq) of Barangay Pila (019),
San Pascual (26) in Batangas (10) in Region IVA (04). The folder structure is the same in all computers used for
encoding.
IV. Generating Indicators through the CBMS Statistics Simulator (StatSim)
A. Opening the StatSim
1. Starting the StatSim application
a. Click on the shortcut icon from the desktop
b. Click on the shortcut icon in the Start Menu
3
c. Click Start, click on All Programs, select CBMS Database and click on CBMS Statistics Simulator
2. Initializing the StatSim database
a. The Login window will appear. For the username, default is “admin”. There is no password required. Change
the database name according to the name of the province and municipality/city. Example: romblon_magdiwang.
Click the button OK.
b. Another window will appear saying that the database still does not exist. Click Yes to create and initialize the
database. Note: The next time the user will open StatSim, the database is already in the pulldown list.
c.
The Statsim is a menu and dialog driven application. Thus the user only has to click and select from among the
options to proceed and generate the desired outputs. Statsim is also a customized application for a specific
CBMS questionnaire version and local government unit (LGU) using the said questionnaire version, thus all
information contained in questionnaire can be derived and processed for the LGU.
4
Each questionnaire is differentiated by the HPQ version number. For example, the latest version of the HPQ
and BPQ are 10200704 and 5200703, respectively. Check both labels and Click OK.
d. Configuring the database means specifying the level to be municipal, provincial or regional database. For this
example, create a municipal database
e. Click the button View selection. From the listed municipalities, double click on the name of the municipality and
Click OK. For this example, StatSim database for the municipality of Magdiwang in Romblon will be created.
5
The StatSim interface will now open
Main Menu
Shortcut icons
Tree view
Output view
Note: When you are opening a configured database, you will not need to do the procedure discussed in (b) to (e).
B. Importing CBMS Data
This section will guide you through the process of importing your encoded data file into the StatSim. In the
importing process, the StatSim transforms the encoded data into a database ready for further processing and
tabulation.
1. To import an encoded barangay data, go to File in the main menu, then select Import.
The user has 2 ways of importing the encoded data: one is the option to select the text file through the Auto
selection of levels and the other is by the Specify path option.
6
a. Auto Selection of levels
The geopolitical levels are pre-specified following the Philippine Standard Geographic Code (PSGC) folder
structure. In the example below, the selection starts from the region, next is the province, followed by the list of
municipalities (viewed in the first box) and all barangays under each municipality. The list of barangays can be
seen at the second box in the window. Selecting the barangays is easy as selection buttons are present
between the second and third box. The third box contains barangays which have been selected from the
second box.
Click OK to
start importing
of text file
Click Cancel to
stop Importing
Option to
specify the path
to import the
text file
First box:
PSGC folder
structure
Second box:
List of barangays under
each municipality
st
1 button: Select a single barangay
2nd button: Deselect a single barangay
3rd button: Select multiple barangays
4th button: Deselect multiple barangays
Third box:
List of selected
barangays from
the second box
b. Specify path
The specify path options allow the user to manually select the encoded data similar to opening files using
windows explorer.
In the window, click the button Add to open the browser.
From the browser, select the text file. Usually, as instructed during the training, all the text files follow the PSGC
folder structure. For example, in selecting the text file of Brgy. Agutay, Magdiwang, Romblon select the text file
175908002.hpq from the folder C:\CBMSDatabase\17\59\08\002.
7
Click OK to start
importing of text file
Click Cancel to stop
Importing
Option to Auto-select
the text file
The user can add multiple
text files by going to desired
paths.
Click Add.. to add a text
file by browsing the folders
Click Remove to
remove an added text
Click Clear to remove all
added text files
2. After selecting the text file/files from the auto selection of levels or through specifying the paths, click OK to start
and while fetching, a window will appear indicating “Statsim fetch: Processing __%”
3. After the selected files have been imported, a window will appear to ask if the user wants to import another set
of data. Click Yes button to add again using the same process or No if user is already done importing desired
text files.
4. Another window will appear, click Yes to start the processing.
5. A window will appear to ask if the user wants to edit the Purok names. Recall that in the CSPro-based encoding
system, all puroks are encoded as codes to reduce mismatches in names.
This step is very crucial because the labels/names of the puroks in this section must match their names
in the NRDB file since matching of these files are both case- and space-sensitive.
Click Yes to edit the Purok names.
8
6. Double-click on the PurokName to change the names. After editing all the names, click OK.
7. The user will now be prompted to select at what level the data will be processed. User can select from the label
in the first box and click the button to specify the desired geopolitical levels.
Click OK to start
processing data
Click Cancel to
stop processing
First Box: All levels
are seen here.
Highlight the desired
level to process data
st
1 button: Select a single level
2nd button: Deselect a single level
3rd button: Select multiple levels
4th button: Deselect multiple levels
Second Box: All
selected levels
are seen here.
C. Processing the 13+1 CBMS Core Indicators
1. The user will be asked if she/he wants to process the CBMS core indicators. Click Yes to proceed.
While StatSim is processing, you will see the status of the processing activity at the bottom of the page. Please
note that the length of time required in processing the data depends on the size of the file, number of text files
that the user is processing and the number of selected levels (region, province, municipality, barangay, purok
and households). When done, the status will now indicate “ready” or “done”.
9
D. Displaying the CBMS Core Indicators
To view the data, the StatSim contains the tree view of the data and report tables (Data and Report Tabs) in
the left side of the interface.
1. Data Tab
The Data tab in the left side of the StatSim contains all the data that the program had automatically computed.
The computed tables are named by each level and the data it contains. Clicking a table shows the variable names
and data.
For example, the table brgy_hhmaln05 shows the brgyid, region, province, municipality, barangay, number of
households with children 0-5 years old who are malnourished (brgy_hhmaln05), number of households with children
0-5 years old (brgy_hhwmem05) and proportion of households with children 0-5 years old who are malnourished
(brgy_hhmaln05). Please refer to the Annex 1 for the data dictionary and list of variable names.
The table can be copied to other software such as excel or word, etc. To do this, click Ctrl-A (select all) then
right-click and click copy then paste to the desired program. Another option is to right-click in the output view and
select the option “Export to Microsoft Excel”.
or
10
2. Reports Tab
The Report tab shows ready-made tables that can be printed right-away or attached to documents. As
compared to the Data tab, the reports generated here does not contain variable names as column headings but are
properly titled so that it can be easily understood.
To display the CBMS Core Indicators, click on the CBMS Core Indicators in the report view. Choose the level
of the data you wish to view. If you choose to display the CBMS Core Indicators at the barangay level, then you will
be able to view an output similar to the one displayed below:
Confidential info
If you choose to display the CBMS Core Indicators at the household level, below is the sample output:
11
Users can also choose to display one indicator at a time only by clicking on the specific sector and indicator
then chose the level of data to view. For this example, the user opted to see prevalence of malnutrition at the purok
level. The output view shows data for 4 puroks of Brgy. Agutay.
Users can also view Selected LGU indicators and the Simple Composite Index automatically computed by
the StatSim.
Confidential info
There are 14 basic needs (14 CMS core indicators) that each household should meet. The Simple Composite
Index (SCI) is the sum of all unmet needs of the households. For example, HH#1 have (1) income below poverty
threshold; (2) have children who are malnourished; and (3) have children who are not attending elementary school.
Thus, the SCI of HH#1 is 3. Below is a sample output. Note that the list is sorted according to the lowest to the
highest SCI.
At the purok and higher geopolitical levels, the SCI is the average household scores at that level. In the
example below, the average unmet needs of the households in Brgy. Agutay is 3. This number is useful in targeting
barangays with the highest average unmet needs.
12
E. Customizing Indicator Tables
Aside from the automatically generated data, users can also create their own tables using all variables found
the HPQ. Customization involves familiarization of the data dictionary and variable names (Annex A of this manual).
1. The CBMS Indicator Simulator – Wizard
Open the Indicator Simulator-Wizard by clicking the Stats/Indicators in the main menu and select Wizard…
(shortcut: Ctrl+W). The following dialog box will be displayed.
The data automatically generated users access through the report tab can also be displayed the wizard. The
first pulldown list shows the categories; by default it shows 3 categories:
To display the CBMS Core Indicators for a chosen level, click on the pull-down list and select CBMS Core
Indicators. Afterwards, click on the green arrow adjacent to the pull-down list and click Display.
13
The user will be prompted to choose at what level to display the CBMS Core Indicators: region, province,
municipality, barangay, purok or household.
Results are the same as in Section D.2. Automatically-generated indicator tables also follow the same
procedure.
2. Categories, Sectors and Indicators
a. Categories
There are 3 default categories in the StatSim. These are: CBMS Core Indicators, LGU Specific Indicators and
Simple Composite Index.
i.
If the user wants to add another category: here are the steps:
1. Open Wizard. Click the green arrow beside the pulldown list for Category. Click Add…
2. Indicate the Category short name, full name of the category and description. Click OK when done.
ii.
To edit the details of a category, select the specific category. Click the green arrow and select Edit. Change the
details that needed to be changed.
iii. To delete a category, select the category to be deleted. Click the green arrow and select delete.
14
b. Sectors
The procedure for adding Sectors is the same as adding Categories. Below is an example:
i.
Adding sectors
1. Open Wizard. Select the Category. Click the green arrow beside the pulldown list for Sector. Click Add…
Example: Under the LGU specific indicators category, user will add a sector.
2. Choose the category. Indicate the Sector short name, full name of the sector and description.
Example: Under LGU Specific Indicators, the sector short name is agri, the name of the sector is Agriculture
and description entered Agricultural data. Click OK.
3. A window will pop-up asking if the user really wants to add the sector. Click Yes if sure.
4. Another window will open indicating the sector had been added.
5. To check if the user had added the sector name, choose the category name. Click the pulldown list beside
sectors. The latest added Sector can be seen at the bottom of the list.
15
ii.
To edit the details of a sector, select the specific sector. Click the green arrow and select Edit. Change the
details that needed to be changed.
iv. To delete a sector, select the category, then select the sector to be deleted. Click the green arrow and select
delete.
c. Indicators
i.
Adding Indicators
1. Open Wizard. Select the Category and Sector. Click the green arrow beside the pulldown list for Indicator.
Click Add…
Example: Under the LGU specific indicators category and Agriculture Sector, user will add an indicator.
2. Choose the category and sector. Indicate the Indicator short name, full name of the indicator and
description.
Example: Under LGU Specific Indicators, select the sector Agriculture. The indicator short name is farming,
the name of the sector is Farming Activities and description Farming Activities. Click OK.
16
3. A window will pop-up asking if the user really wants to add the indicator. Click Yes if sure.
4. Another window will open indicating the indicator had been added.
5. To check if the user had added the sector name, choose the category and sector names. Click the pulldown
list beside indicators. The latest added Indicator can be seen at the bottom of the list.
ii.
To edit the details of an indicator, select the specific indicator. Click the green arrow and select Edit. Change
the details that needed to be changed.
iii. To delete an indicator, select the category and sector, then select the indicator to be deleted. Click the green
arrow and select delete.
3. Tables
a. Lists
For targeting of beneficiaries, it is important to list who should be beneficiaries of certain programs. Example,
for a supplemental feeding program, the list of malnourished children should be listed as primary beneficiaries of
this program. Here are the steps to produce this list:
i.
Under the category CBMS Core Indicators, select Health and Nutrition and choose the indicator malnourished
children. Then left click on the green arrow button and click Customize and select Table…
17
ii.
A dialog box similar to the one displayed below will be shown:
iii. Under For table (parent/geolevel), select Member.
member level.
Note that you do this because the indicator is at the
iv. Click on the Add button. A dialog box similar to the one displayed below will appear:
v.
On the dialog box, do the following:
1. Under Table, type “List of malnourished children ages 0-5 years old”
2. Under Short Name, type “maln05”.
3. Under Description, type “List of malnourished children ages 0-5 years old”
Note that some of the information is arbitrary. Click on OK.
vi. A dialog box will appear asking you if you want to add the definition of “List of malnourished children ages 0-5
years old.” Click Yes. A dialog box will again appear confirming that it has been added. You will then be
directed to the Indicator Simulator for “List of malnourished children ages 0-5 years old.” You will notice that
under Table, you can now select “List of malnourished children ages 0-5 years old.”
18
vii. Under Plausible Source(s), select hpq_mem (label: Member Record) and click on the arrow pointing to the box
on the selected sources. User will be asked if he/she would want to add Member Record as plausible source of
the table.
The plausible sources in the bottom left side of the window are tables which can be from raw data or from
processed data. Added tables such as the list that the user is about to add will eventually be a plausible source
of data.
Note that in this stage, you are selecting the sources where information about the indicator could be found.
User will be notified that the source was added.
viii. To define contents of your table, click on Variables/Expressions.
ix. A dialog box similar to the one displayed below will appear:
Source: Only the sources
selected from the previous
procedure are available are
source for the table.
Alias: Names that will appear
in the table. Variables can be
aliases.
Label: This contains the
meaning or description of the
aliases/variables used.
Advanced edit: For mysql
commands
Add: After specifying the
source, type, alias, column and
labels, click Add to include in
the list of variables in the table.
Remove: Used when user
wish to remove the added
variable in the list.
Update: Select a variable and
modify
specifications
and
updated to edit in the list.
The type only determines what kind of
component is needed.
1. Expression—mostly done to get
aggregates, counts, averages, etc.
2. Value—used to display only the
value.
3. Group by—used to divide the
observations into classes or groups.
This is always used whenever
counts or and aggregates are used.
4. Where—used to filter the tabulation
or listing.
Column: Contains all the variables include
in the selected source.
Click Close when all desired variables
were added to the list.
19
x.
In building the table, the variables must be added one at a time. Thus, the user is advised to draft a dummy
table first before actual building a table in the statsim. For the example, list of malnourished children, do the
following:
1. To display barangay name:
a. Under Source, click on hpq_mem.
b. In Type, use Value.
c. In Alias, type “brgy”. You can repeat this in the Label.
d. Under Column, select brgy which contains information on the barangay name.
2. To display purok name:
a. Under Source, click on hpq_mem.
b. In Type, use Value.
c. In Alias, type “Purok”. You can repeat this in the Label.
d. Under Column, select purok which contains information on the purok name.
e. Click Add.
3. To display household ID:
a. Under Source, click on hpq_mem.
b. In Type, use Value.
c. In Alias, type “household id”. You can repeat this in the Label.
d. Under Column, select hcn which contains information on the household ID.
e. Click Add.
4. To display surname of child:
a. Under Source, click on hpq_mem.
b. In Type, use Value.
c. In Alias, type “surname”. You can repeat this in the Label.
d. Under Column, select msname.
e. Click Add.
5. To display first name of child:
a. Under Source, click on hpq_mem.
b. In Type, use Value.
c. In Alias, type “firstname”. You can repeat this in the Label.
d. Under Column, select mfname.
e. Click Add.
6. To display age of child:
a. Under Source, click on hpq_mem.
b. In Type, use Value.
c. In Alias, type “age”. You can repeat this in the Label.
d. Under Column, select age_yr.
e. Click Add.
7. To display sex of child:
a. Under Source, click on hpq_mem.
b. In Type, use Value.
c. In Alias, type “sex”. You can repeat this in the Label.
d. Under Column, select sex.
e. Click Add.
8. To filter only children ages 0-5:
a. Under Source, click on hpq_mem.
b. In Type, use <Where>.
c. Under Column, select age_yr. The operator will be activated. Select “<=”. In the last box, type “5”
so that the list will only contain children will age_yr<=5 years old.
20
d. Click Add.
9. To filter only children ages 0-5 who are malnourished:
a. Under Source, click on hpq_mem.
b. In Type, use <Where>.
c. Under Column, select mnutind. The operator will be activated. Select “>=”. In the last box, type “3”
so that the list will only contain children whose nutritional status is 3 and 4, which means
moderately and severely malnourished, respectively.
d. Click Add.
10. You can replicate this if you would like other information about the household.
xi. Click Close and OK in the next dialog.
xii. You can now display the list of malnourished children. To do this, here are the steps:
1. In the wizard, select
a. Category: CBMS core indicators
b. Sector: Health and Nutrition
c. Indicator: malnourished children
2. Click the green arrow and select Display
3. From the list, select the newly-created table, List of malnourished children
Confidential info
4. Here is the output:
21
b. Aggregates
Aside from generating lists, you can also use the CBMS StatSim to display aggregates. For example, you may
follow the following step-by-step process in generating an output that can display the Average Household Income
by Type of Tenure Status:
i.
Add an indicator with the ff. specifications:
1. On Category, click on the pull-down list and click on CBMS Core Indicators.
2. On Sector, click on the pull-down list and click on Water and Sanitation.
3. On the box adjacent to Indicator Short Name, type AvgHHincTenure. Again, note that the short name
should be one word only.
4. On the box under Description, type Average Household Income by Tenure Status.
5.
6.
7.
8.
ii.
Click on OK.
A dialog box will appear asking if you want to add ‘Average HH Income by Tenure Status’. Click on Yes.
A dialog box will again appear confirming that ‘‘Average HH Income by Tenure Status’ has been added.
On the Indicator Simulator Wizard, you will notice that ‘Average HH Income by Tenure Status’ is now part of
the Indicator pull-down list as shown below:
Now, you could link to and customize for the newly defined indicator. To do this, do the following:
1.
2.
3.
4.
Click on Average HH Income by Tenure Status and click the arrow adjacent to it.
Select Customize and then click on Table.
Under for table (parent/geolevel), select Household.
Click on the Add button. A dialog box similar to the one displayed below will appear:
22
5. Do the following in the dialog:
a. Under Table, type Average HH Income by Tenure Status.
b. Under Short Name, type AvgHHincTenure.
c. Under Description, type Average Household Income by Tenure Status.
6. Click on Ok.
7. A dialog box will appear asking you if you want to add the definition of “Average HH Income by Tenure
Status.” Click Yes. A dialog box will again appear confirming that it has been added. You will then be
directed to the Indicator Simulator for “Average HH Income by Tenure Status.” You will notice that under
Table, you can now select Average HH Income by Tenure Status.
8. Under Plausible Source(s), select hpq_hh (label: Household Record) and click on the arrow pointing to the
box on the selected sources.
9. Click on Variables/Expressions to select the components of the table.
10. To display types of tenure stats:
a. Under Source, click on hpq_hh.
b. Under Type, select Value.
c. Under Column, select tenure.
d. Under Alias and label, type Tenure Status.
e. Click on Add. The variable on Tenure Status is now added as a variable.
11. To display average household income:
a. Source: click on hpq_hh.
b. Under Type, select Expression and click on AVG (Average) on the box next to it.
c. Under Column, select totin (Total Income).
d. Under Alias and label, type Average HH income.
e. Click on Add. The variable on Total Income is now added as a variable.
23
12. To group the averages:
a. Go back to Source and click on hpq_hh.
b. Under Type, select Group By.
c. Under Column, select tenure.
d. Click on Add.
13. Click Close.
14. Click OK on the CBMS Indicator Simulator.
15. You can now display the Average income by tenure status. To do this, here are the steps:
a. In the wizard, select
i. Category: CBMS core indicators
ii. Sector: Housing
iii. Indicator: Average HH income by Tenure Status
b.
Click the green arrow and select Display
16. From the list, select the newly-created table, Average HH income by Tenure Status
17. Click on Ok. The following output will now be displayed:
24
4. Using Interlinks
There are times that you need to get information for your table from two or more tables. This would need
interlinking in order to integrate information from at least two tables.
When you select two or more sources in the table customizer, the button Interlinks will be activated. This
would prompt the user to integrate the two tables through linking.
For example, if you would like to display household poverty status and ownership of a refrigerator. The
poverty status can be taken from the table hh_CoreInd while the ownership of assets can be found from the
table hh_ind. In order to come up with a table containing these indicators, user must interlink the two tables. To
make the tables relate to each other, do the following:
1. Click Interlinks. The following dialog box will appear:
2. Do the following:
a. In the Left pulldown list, select hh_ind and hh_CoreInd in the Right.
b. In the Left column, select hcn and also hcn_nrdb in the Right. This would make the linker match
household IDs in ‘hh_ind’ and in ‘hh_CoreInd’.
3. Click Add.
4. Add additional linkages depending on the uniqueness. For instance, if your barangay utilizes ID’s unique
within puroks, you must add linking between purok codes (purok).
You could see that in the variables/expressions builder, sources could be either ‘hh_ind’ or ‘hh_CoreInd’. Hence,
you could make the table harness information from the two tables and eventually display the household’s poverty
status and ownership of an asset.
25
Sample output:
V. Matching Households in the Encoded Data and Digitized Barangay Spot Maps
Before exporting the processed dataset into the NRDB Pro, you should ensure that the households in your
encoded data (i.e., text file) match with the households in your digitized barangay spot maps. To do this, do the
following:
1. Click on Data, select Matching (shortcut: Alt + M)
2. You will be prompted to open your NRDB file (i.e., file with .mdb file extension). To do this, go to your
CBMSDatabase folder, locate the file and click Open.
26
3. A window will appear verifying that the user is matching data from the encoded and digitized.
4. An excel file as well as a report in the statsim will open. The MS excel will be displayed similar to the one shown
here.
Under the last column with the following heading: ~match, will appear any of the following codes: 1, -1, or 0.
1 denotes that the household ID is found in your encoded file but not in the digitized spot map.
-1 denotes that the household ID is found in the digitized spot map but not found in the encoded file.
0 denotes that the household ID match on both files, that is, the household ID can be found in both the
encoded file as well as in the digitized spot map.
i.
In the example, since you are only matching the text file of your barangay (in this case, Brgy. Agutay) with
your .mdb file, you can disregard what the report is stating for the other barangays. To do this, follow the
following steps:
1. On your Excel file, click Data.
2. Click Filter.
3. Select AutoFilter.
4. Select the name of the barangay that you are processing
5. The last column labeled ~match shows 0 values indicating that your encoded data matches your
digitized spotmap.
6. In this example, we have a mismatch: HH#1 was encoded in purok Molobago but was digitized to
parent purok Proper Agutay
27
7. To correct this, we need to find if the error is in the encoding or in the digitizing.
8. In this example, the user were able to identify the mistake was in the digitized file. The error
committed was in parenting the digitized household id in a different parent purokname. To resolve
cases such as this, go to the nrdb file and correct the parenting by changing the purok as parent
feature of that household.
If however, the mistake was in parenting in the encoding file, it can be resolved by going to the
concerned household record’s persistent items section in the encoding system and correct the
parenting by changing the purok in the persistent items to the appropriate purok.
9. Once this is done, you can repeat the steps above and the matching report should now indicate
that the household IDs in both the encoded file and the digitized spot map match.
VI. Instructions on Exporting Processed CBMS Core Dataset from CBMS StatSim to CBMS-NRDB
After processing the CBMS Core Indicators using the Statistics Simulator (StatSim) and ensuring that the
household IDs in the encoded file and digitized spot map match, the processed dataset can now be exported into
the NRDB Pro in order to map the CBMS indicators.
1. From the File menu, select EXPORT.
2. Select Core Indicators for CBMS-NRDB.
3. Select the following levels to process (whichever is applicable): Municipality, Barangay, Purok and
Household.
28
4. Click OK. The following message box will appear:
You are now ready to map CBMS Core Indicators using the CBMS-NRDB.
Notes:
1. Every table need not to have its own exclusive indicator. For instance, proportion of households without
access to safe water is distributed to several indicator tables: household, purok, barangay, municipality,
province and region. Hence, you do not need to add an indicator whenever a new table must be made.
You must link this table to the related indicator. (The above examples only exhibit the whole process).
2. Short names are important because the system uses this to make tables. Although it is arbitrarily set by
users, this must be set such that it could tell what it contains.
3. You can tabulate alphanumeric columns.
programs, perception, etc.
This means you could tabulate texts such as occupation,
Some commonly-used abbreviations/acronyms (please see Annex 1 to view data dictionary and list of variable
names):
1. regn—Region code
2. prov—Province code
3. mun—Municipality code
4. brgy—Barangay code
5. purok—Purok code
6. hcn—household control number/ID
7. Prop—proportion
8. SWS—Safe water supply
9. STF—Sanitary toilet facility
10. Death05—Child death (0-5)
11. DeathPreg—Death due to pregnancy related causes
12. Maln05—Malnutrition
13. Squat—Squatters
14. MSH—Makeshift housing
15. Povp—Poverty
16. Subp—Subsistent poverty
17. Fshort—Food shortage
18. Unempl15ab—Unemployment (15 years old and above)
19. Elem612—Elementary participation (6-12)
20. HS1316—High school participation (13-16)
21. Sch616—School participation (6-16)
29
ANNEX 1: DATA DICTIONARY AND LIST OF VARIABLE NAMES
Table
hpq_hh
hpq_hh
hpq_hh
hpq_hh
hpq_hh
hpq_hh
hpq_hh
hpq_hh
hpq_hh
hpq_hh
hpq_hh
hpq_hh
hpq_hh
hpq_hh
hpq_hh
hpq_hh
hpq_hh
hpq_hh
hpq_hh
hpq_hh
hpq_hh
hpq_hh
hpq_hh
hpq_hh
hpq_hh
hpq_hh
hpq_hh
hpq_hh
hpq_hh
hpq_hh
hpq_hh
hpq_hh
hpq_hh
hpq_hh
hpq_hh
hpq_hh
hpq_hh
hpq_hh
hpq_hh
hpq_hh
hpq_hh
hpq_hh
hpq_hh
hpq_hh
hpq_hh
hpq_hh
hpq_hh
hpq_hh
hpq_hh
hpq_hh
hpq_hh
hpq_hh
hpq_hh
hpq_hh
hpq_hh
hpq_hh
hpq_hh
hpq_hh
Variable
rtype
urb
regn
prov
mun
brgy
purok
hcn
interviewer
respondent
addr_l1
addr_l2
int_date
int_mm
int_dd
int_yy
start_hr
start_min
start_mer
end_hour
end_min
end_mer
qual_ass1
qual_ass2
expmemind
nexpmem
ofwind
nofw
hhuniparind
nunipar
hhdisableind
ndisabled
nmem60ab
hhboardpassind
nboardpass
cure_sick
where_cure
where_cure_o
ncouple
prevmind
ndeath
water
water_o
water_dist
toil
toil_o
tenur
tenur_o
imprnt
acrent
welec
elec_company
elec_generator
elec_solar
elec_battery
elec_source_o
elec_source_o_lb
elec_bill
Label
(record type)
Urbanity
Region
Province
Muncipality/City
Barangay
Purok
Household ID Number
Interviewer
Respondent
Household address line 1
Household address line 2
Interview date
Interview Month
Interview Day
Interview Year
Starting hour
Starting minute
Starting meridian
Ending hour
Ending minute
Ending meridian
Quality assessment line 1
Quality assessment line 2
With expected family members
Number of expected family members
OFW Indicator
Number of OFW
Single‐parent indicator
Number of Single‐parent
With members with disability
Number of members with disability
Number of members 60 years old and above
Board passer indicator
Number of board passers
Received treatment/cure for sickness
Place where received cure
Other place where received cure
How many couples?
Any member who died?
How many deaths?
Type of water facility
Other types of water facility
Distance of water source
Type of toilet facility
Other types of toilet facility
Tenure status of house/lot
Other tenure status
Total imputed rent per month
Total actual rent per month
Electricity Indicator
Electric company?
Generator?
Solar?
Battery?
Others
Other source
Electric Bill
30
hpq_hh
hpq_hh
hpq_hh
hpq_hh
hpq_hh
hpq_hh
hpq_hh
hpq_hh
hpq_hh
hpq_hh
hpq_hh
hpq_hh
hpq_hh
hpq_hh
hpq_hh
hpq_hh
hpq_hh
hpq_hh
hpq_hh
hpq_hh
hpq_hh
hpq_hh
hpq_hh
hpq_hh
hpq_hh
hpq_hh
hpq_hh
hpq_hh
hpq_hh
hpq_hh
hpq_hh
hpq_hh
hpq_hh
hpq_hh
hpq_hh
hpq_hh
hpq_hh
hpq_hh
hpq_hh
hpq_hh
hpq_hh
hpq_hh
hpq_hh
hpq_hh
hpq_hh
hpq_hh
hpq_hh
hpq_hh
hpq_hh
hpq_hh
hpq_hh
hpq_hh
hpq_hh
hpq_hh
hpq_hh
hpq_hh
hpq_hh
hpq_hh
hpq_hh
hpq_hh
hpq_hh
radio
tv
vplayer
stereo
karaoke
ref
efan
iron
stove
wmach
microw
computer
celfone
telefone
airc
sewmach
car
wall
roof
cropind
cropincsh
cropinknd
poultind
pouincsh
pouinknd
fishind
fishincsh
fishinknd
forind
forincsh
forinknd
salind
salincsh
salinknd
manind
manincsh
maninknd
servind
servincsh
servinknd
trnind
trnincsh
trninknd
minind
minincsh
mininknd
cnsind
cnsincsh
cnsinknd
eothind
eoincsh
eoinknd
etotcsh
etotknd
freq_wage
wagcsh
wagknd
agscsh
agsknd
ofwcsh
ofwknd
Own Radio/cassette
Own TV
Own VHS/VCD/DVD player
Own Stereo/component
Own karaoke
Own ref
Own electric fan
Own electric iron
Own LPG/gas stove/range
Own washing machine
Own microwave oven
Own computer
Own cellphone
Own Telephone
Own aircon
Own sewing machine
Own vehicles
Construction materials of walls
Construction materials of roof
Engaged in crop farming and gardening
Total income from the activity (cash)
Total income from the activity (kind)
Engaged in livestock/poultry
Total income from the activity (cash)
Total income from the activity (kind)
Engaged in fishing
Total income from the activity (cash)
Total income from the activity (kind)
Engaged in forestry
Total income from the activity (cash)
Total income from the activity (kind)
Engaged in wholesale/retail
Total income from the activity (cash)
Total income from the activity (kind)
Engaged in manufacturing
Total income from the activity (cash)
Total income from the activity (kind)
Engaged in community, social & personal service
Total income from the activity (cash)
Total income from the activity (cash)
Engaged in transportation, storage & communicat
Total income from the activity (cash)
Total income from the activity (kind)
Engaged in mining & quarrying
Total income from the activity (cash)
Total income from the activity (kind)
Engaged in construction
Total income from the activity (cash)
Total income from the activity (kind)
Other activities NEC
Total income from the activity (cash)
Total income from the activity (kind)
Total income from entrepreneurial activities (cash)
Total income from entrepreneurial activities (kind)
Number of waged HH members
Total income from salaries/wages (cash)
Total income from salaries/wages (kind)
Net share of crops (cash)
Net share of crops (kind)
Receipts from OFW (cash)
Receipts from OFW (kind)
31
hpq_hh
hpq_hh
hpq_hh
hpq_hh
hpq_hh
hpq_hh
hpq_hh
hpq_hh
hpq_hh
hpq_hh
hpq_hh
hpq_hh
hpq_hh
hpq_hh
hpq_hh
hpq_hh
hpq_hh
hpq_hh
hpq_hh
hpq_hh
hpq_hh
hpq_hh
hpq_hh
hpq_hh
hpq_hh
hpq_hh
hpq_hh
hpq_hh
hpq_hh
hpq_hh
hpq_hh
hpq_hh
hpq_hh
hpq_hh
hpq_hh
hpq_hh
hpq_hh
hpq_hh
hpq_hh
hpq_hh
hpq_hh
hpq_hh
hpq_hh
hpq_hh
hpq_hh
hpq_hh
hpq_hh
hpq_hh
hpq_hh
hpq_hh
hpq_hh
hpq_hh
hpq_hh
hpq_hh
hpq_hh
hpq_hh
hpq_hh
hpq_hh
hpq_hh
hpq_hh
hpq_hh
supfcsh
supfknd
suprcsh
suprknd
rentvcsh
rentvknd
intrcsh
intrknd
pencsh
penknd
divcsh
divknd
othscsh
othsknd
othstotcsh
othstotknd
imprnttot
totincsh
totinknd
totin
agriland_tenur
agriland_tenur_o
agriland_area
ncrop
livestock_produce
meat_produce
milk_produce
egg_produce
cul_fishpond
cul_fishcage
cul_sea
cul_marsh
cul_lake
cul_river
cul_stream
cul_other_place
cul_other_place_lb
fishpond_area
nfcage
naquani
own_fishboat
garb_collect
garb_burn
garb_comp
garb_recycl
garb_wsegr
garb_cpit
garb_opit
garb_mgt_o
garb_mgt_o_lb
garb_collector
freq_garb_coll
freq_garb_coll_o
calamind
fshort
fsmonth_1
fsdays_1
fsmonth_2
fsdays_2
fsmonth_3
fsdays_3
Receipts from abroad (cash)
Receipts from abroad (kind)
Receipts from domestic (cash)
Receipts from domestic (kind)
Rentals received (cash)
Rentals received (kind)
Interest earned (cash)
Interest earned (kind)
Pensions received (cash)
Pensions received (kind)
Dividends (cash)
Dividends (kind)
Other sources of income NEC (cash)
Other sources of income NEC (kind)
Total income from other sources (cash)
Total income from other sources (kind)
Total imputed rent
Total income (cash)
Total income (kind)
Total household income
Tenure in agricultural land
Other tenure in agricultural land
Area of farm
Number of harvested crops
Livestock production
Meat production
Milk production
Egg production
Fishpond
Fishcage
Sea
Marsh
Lake
River
Stream/creek
Other
Other place
Area of fishpond
Number of fish cage
Number of aquatic animals
Own fishing boat
Garbage collected
Garbage burned
Garbage composted
Garbage recycled
Garbage segregated
Garbage dumped to closed pit
Garbage dumped to open pit
Other waste management
What waste management
Garbage collector
How frequent is the garbage collection
Other frequency of collection
Experienced man‐made disasters/natural calamity
Experienced food shortage
Months of shortage_1
Number of days of shortage_1
Months of shortage_2
Number of days of shortage_2
Months of shortage_3
Number of days of shortage_3
32
hpq_hh
hpq_hh
hpq_hh
hpq_hh
hpq_hh
hpq_hh
hpq_hh
hpq_hh
hpq_hh
hpq_hh
hpq_hh
hpq_hh
hpq_hh
hpq_hh
hpq_hh
hpq_hh
hpq_hh
hpq_hh
hpq_hh
hpq_hh
hpq_hh
hpq_hh
hpq_hh
hpq_hh
hpq_hh
hpq_hh
hpq_hh
hpq_hh
hpq_hh
hpq_hh
hpq_hh
hpq_hh
hpq_hh
hpq_hh
hpq_hh
hpq_hh
hpq_hh
hpq_hh
hpq_hh
hpq_hh
hpq_hh
hpq_hh
hpq_hh
hpq_hh
hpq_hh
hpq_hh
hpq_hh
hpq_hh
hpq_hh
hpq_hh
hpq_hh
hpq_hh
hpq_hh
hpq_hh
hpq_hh
hpq_hh
hpq_hh
hpq_hh
hpq_hh
hpq_hh
hpq_hh
carpind
carprcv_mm
carprcv_dd
carprcv_yy
philhealthind
philhealthimplementor
philhealtheffect
philhealthrating
infantsab2500g
da_doctor
da_nurse
da_midwife
da_hilot
da_other
da_other_lb
infantsbreastfed
immunize_bcg
immunize_dpt1
immunize_dpt2
immunize_dpt3
immunize_opv1
immunize_opv2
immunize_opv3
immunize_hepa1
immunize_hepa2
immunize_hepa3
immunize_measles
diarrhea
ab15leftab10
examind
nexam
major_dialect
major_dialect_o
hire_farm_worker
nfw_land_prep
nfw_planting
nfw_crop_care
nfw_harv
nfw_post_harv
nfw_food_proc
ntree
petind
pet_vaccine
phsize
hsize
nmem01
nmem04
nmem06
nmem08
nmem09
nmem05
nmaln05
nmem611
nelem611
nmem612
nelem612
nmem1215
nhs1215
nmem1316
nhs1316
nmem616
Received CARP program
CARP Received ‐ Month
CARP Received ‐ Day
CARP Received ‐ Year
Received Philhealth for indigents?
Implementor
Effect of the program
Effect rating
All infants weigh more than 2.5 kilos
Attended deliveries ‐ doctor
Attended deliveries ‐ nurse
Attended deliveries ‐ midwife
Attended deliveries ‐ trained hilot/personnel
Attended deliveries ‐ others
Attended deliveries ‐ others label
all infants exclusively breastfeed for 1st 4 month
Immunization ‐ BCG
Immunization ‐ DPT 1
Immunization ‐ DPT 2
Immunization ‐ DPT 3
Immunization ‐ OPV 1
Immunization ‐ OPV 2
Immunization ‐ OPV 3
Immunization ‐ Hepa 1
Immunization ‐ Hepa 2
Immunization ‐ Hepa 3
Immunization ‐ Measles
diarrhea episode
left members 10 below w/o any adult 15 above
with members passed civil service/tesda exam
Number of members passed civil service/tesda exam
major dialect
OIther major dialect
hire workers in the farm?
Land preparation
All planting
Care of crops
Harvesting
Post harvest activities
Food processing
Number of type of trees
own pets
pets vaccinated
Preliminary household size
Household size
Number of infants
Number of members 0‐4 years old
Number of members 0‐6 years old
Number of members 0‐8 years old
Number of members 0‐9 years old
Number of members 0‐5 years old
Number of malnourished members 0‐5 years old
Number of members 6‐11 years old
Number of mems 6‐11 years old who are attending
Number of members 6‐12 years old
Number of mems 6‐12 years old who are attending
Number of members 12‐15 years old
Number of mems 12‐15 years old attending HS
Number of members 13‐16 years old
Number of mems 13‐16 years old attending HS
Number of members 6‐16 years old
33
hpq_hh
hpq_hh
hpq_hh
hpq_hh
hpq_hh
hpq_hh
hpq_hh
hpq_hh
hpq_hh
hpq_hh
hpq_hh
hpq_hh
hpq_hh
hpq_hh
hpq_hh
hpq_hh
hpq_mem
hpq_mem
hpq_mem
hpq_mem
hpq_mem
hpq_mem
hpq_mem
hpq_mem
hpq_mem
hpq_mem
hpq_mem
hpq_mem
hpq_mem
hpq_mem
hpq_mem
hpq_mem
hpq_mem
hpq_mem
hpq_mem
hpq_mem
hpq_mem
hpq_mem
hpq_mem
hpq_mem
hpq_mem
hpq_mem
hpq_mem
hpq_mem
hpq_mem
hpq_mem
hpq_mem
hpq_mem
hpq_mem
hpq_mem
hpq_mem
hpq_mem
hpq_mem
hpq_mem
hpq_mem
hpq_mem
hpq_mem
hpq_mem
hpq_mem
hpq_mem
hpq_mem
nsch616
nmemcol
nmemsch
nmem10ab
nliter10
nmem15ab
nm15abwjob
nmwjob
loc_long
loc_long_deg
loc_long_min
loc_long_sec
loc_lat
loc_lat_deg
loc_lat_min
loc_lat_sec
rtype
urb
regn
prov
mun
brgy
purok
hcn
memno
msname
mfname
reln
reln_o
sex
age_yr
age_mo
birth_date
birth_mm
birth_dd
birth_yy
birth_reg
civstat
civstat_o
relgn
relgn_o
ipind
ipgrp
ipgrp_o
ylen_resid
mlen_resid
country_resid
country_resid_o
prov_resid_code
mun_resid_code
brgy_resid_code
mun_resid_txt
brgy_resid_txt
educind
gradel
sch_type
educal
sub_educal
course_o
literind
orgind
Number of mems 6‐16 years old who are attending
Number of members attending college
Number of members attending school
Number of members 10 years old and above
Number of members who are literate
Number of members 15 years old and above
Number of members 15 yrs above with job
Number of members with job
Geographic location (Longitude)
Geographic location (Longitude ‐ degrees)
Geographic location (Longitude ‐ minutes)
Geographic location (Longitude ‐ seconds)
Geographic location (Latitude)
Geographic location (Latitude ‐ degrees)
Geographic location (Latitude ‐ minutes)
Geographic location (Latitude ‐ seconds)
(record type)
Urbanity
Region
Province
Muncipality/City
Barangay
Purok
Household ID Number
Line number
Member surname
Member first name
Relation to the HH reference person
Other relationship
Sex
Age in years
Age in months
Birth Date
Birth Month
Birth Day
Birth Year
Birth Registration
Civil Status
Other Civil Status
Religion
Other religion
IP Indicator
IP Group
Other IP Group
Length in years of residency
Length in months of residency
Country of previous residence
Other country
Provincial code of previous residence
Municipality code
Barangay code
Municipality of previous residence
Barangay of previous residence
Attended school
Grade/Year code
Public or private
Educational attainment code
Educational attainment subcode
Other course
Literacy indicator
Member of any community organization
34
hpq_mem
hpq_mem
hpq_mem
hpq_mem
hpq_mem
hpq_mem
hpq_mem
hpq_mem
hpq_mem
hpq_mem
hpq_mem
hpq_mem
hpq_mem
hpq_mem
hpq_mem
hpq_mem
hpq_mem
hpq_mem
hpq_mem
hpq_mem
hpq_mem
hpq_mem
hpq_mem
hpq_mem
hpq_mem
hpq_mem
hpq_mem
hpq_mem
hpq_mem
hpq_mem
hpq_mem
hpq_mem
hpq_mem
hpq_mem
hpq_mem
hpq_mem
hpq_mem
hpq_wage
hpq_wage
hpq_wage
hpq_wage
hpq_wage
hpq_wage
hpq_wage
hpq_wage
hpq_wage
hpq_wage
hpq_wage
hpq_asset
hpq_asset
hpq_asset
hpq_asset
hpq_asset
hpq_asset
hpq_asset
hpq_asset
hpq_asset
hpq_asset
hpq_asset
hpq_crime
hpq_crime
org_name_1
org_type_1
org_type_o_1
org_name_2
org_type_2
org_type_o_2
org_name_3
org_type_3
org_type_o_3
regvotind
voted_last_election
mnutind
jobind
occup
g_occ
sub_occ_1
sub_occ_2
sub_occ_3
indust
sector
country_job
country_job_o
prov_job_code
mun_job_code
brgy_job_code
mun_job_txt
brgy_job_txt
jstatus
workcl
fjob
jsearch_meth
jsearch_meth_o
ynotlookjob
ynotlookjob_o
lastlookjob
joppind
wtwind
rtype
urb
regn
prov
mun
brgy
purok
hcn
wage_line
wagcshm
wagkndm
rtype
urb
regn
prov
mun
brgy
purok
hcn
asset_line
asset
owner_line
rtype
urb
Name of organization 1
Type of community organization 1
Other type of community organization 1
Name of organization 2
Type of community organization 2
Other type of community organization 2
Name of organization 3
Type of community organization 3
Other type of community organization 3
Registered voter
Voted in last election
Nutrition status of members 0‐5 years old
Job/Work indicator
Occupation/economic activity
Occupation general code
Occupation subcode 1
Occupation subcode 2
Occupation subcode 3
Business/industry
Sector code
Country of economic activity
Other country
Province code of economic activity
Municipal code of economic activity
Barangay code of economic activity
Municipality of economic activity
Barangay of economic activity
Job status
Class of Worker
Find job
Job search method
Other job search method
Reasons why did not look for work
Other reasons why did not look for work
Last time looked for work
Had opportunity for work?
Willing to take up work?
(record type)
Urbanity
Region
Province
Muncipality/City
Barangay
Purok
Household ID Number
Line number referenced to line number in member record
Wage of a HH member (cash)
Wage of a HH member (kind)
(record type)
Urbanity
Region
Province
Muncipality/City
Barangay
Purok
Household ID Number
Line number
Asset
Line number of owner
(record type)
Urbanity
35
hpq_crime
hpq_crime
hpq_crime
hpq_crime
hpq_crime
hpq_crime
hpq_crime
hpq_crime
hpq_crime
hpq_crime
hpq_crime
hpq_crime
hpq_crime
hpq_death
hpq_death
hpq_death
hpq_death
hpq_death
hpq_death
hpq_death
hpq_death
hpq_death
hpq_death
hpq_death
hpq_death
hpq_death
hpq_death
hpq_death
hpq_prog
hpq_prog
hpq_prog
hpq_prog
hpq_prog
hpq_prog
hpq_prog
hpq_prog
hpq_prog
hpq_prog
hpq_prog
hpq_prog
hpq_prog
hpq_prog
hpq_prog
hpq_prog
hpq_calam
hpq_calam
hpq_calam
hpq_calam
hpq_calam
hpq_calam
hpq_calam
hpq_calam
hpq_calam
hpq_calam
hpq_calam
hpq_calam
hpq_ofw
hpq_ofw
hpq_ofw
hpq_ofw
hpq_ofw
regn
prov
mun
brgy
purok
hcn
crime_line
crimetype
crimetype_o
crimeind
ctvicttot
ctvictmale
ctvictfemale
rtype
urb
regn
prov
mun
brgy
purok
hcn
death_line
deadsn
deadfn
mdeadsx
mdeadage
mdeady
mdeady_o
rtype
urb
regn
prov
mun
brgy
purok
hcn
prog_line
progtype
progtype_o
progind
progname
progimplementor
progeffect
prograting
rtype
urb
regn
prov
mun
brgy
purok
hcn
calam_line
calam_type
calam_type_o
calam_type_ind
rtype
urb
regn
prov
mun
Region
Province
Muncipality/City
Barangay
Purok
Household ID Number
Line number
Type of crime
Other crime
Crime indicator
Total victims
Total male victims
Total female victims
(record type)
Urbanity
Region
Province
Muncipality/City
Barangay
Purok
Household ID Number
Line number
Surname
First Name
Sex
Age
Cause of death
Other cause
(record type)
Urbanity
Region
Province
Muncipality/City
Barangay
Purok
Household ID Number
Line number
Program Type
Other program type
Program indicator
Program name
Implementor
Effect of the program
Effect rating
(record type)
Urbanity
Region
Province
Muncipality/City
Barangay
Purok
Household ID Number
Line number
calamity
other calamity
calamity indicator
(record type)
Urbanity
Region
Province
Muncipality/City
36
hpq_ofw
hpq_ofw
hpq_ofw
hpq_ofw
hpq_ofw
hpq_ofw
hpq_ofw
hpq_ofw
hpq_ofw
hpq_ofw
hpq_ofw
hpq_ofw
hpq_couple
hpq_couple
hpq_couple
hpq_couple
hpq_couple
hpq_couple
hpq_couple
hpq_couple
hpq_couple
hpq_couple
hpq_couple
hpq_couple
hpq_couple
hpq_couple
hpq_unipar
hpq_unipar
hpq_unipar
hpq_unipar
hpq_unipar
hpq_unipar
hpq_unipar
hpq_unipar
hpq_unipar
hpq_unipar
hpq_unipar
hpq_boardpass
hpq_boardpass
hpq_boardpass
hpq_boardpass
hpq_boardpass
hpq_boardpass
hpq_boardpass
hpq_boardpass
hpq_boardpass
hpq_boardpass
hpq_boardpass
hpq_exam
hpq_exam
hpq_exam
hpq_exam
hpq_exam
hpq_exam
hpq_exam
hpq_exam
hpq_exam
hpq_exam
hpq_exam
hpq_handicap
hpq_handicap
brgy
purok
hcn
ofw_line
ofwsn
ofwfn
ofw_reln
ofw_reln_o
ofw_occ
ofw_occode
ofw_country
ofw_country_o
rtype
urb
regn
prov
mun
brgy
purok
hcn
couple_line
husband_line
wife_line
fam_plan
fp_meth
fp_meth_o
rtype
urb
regn
prov
mun
brgy
purok
hcn
unipar_line
unipar_why
unipar_why_o
rtype
urb
regn
prov
mun
brgy
purok
hcn
boardpass_line
boarpass_prof
boardpass_prof_o
rtype
urb
regn
prov
mun
brgy
purok
hcn
exam_line
exam_type
exam_type_ind
rtype
urb
Barangay
Purok
Household ID Number
Line number
OFW Surname
OFW First Name
Relation to household head
Other relation to hh reference person
Occupation
Occupation code
Country code
Other country
(record type)
Urbanity
Region
Province
Muncipality/City
Barangay
Purok
Household ID Number
Line number
Husband line number refrenced to line number in member record
Wife line number refrenced to line number in member record
Engage in family planning
Family planning method
Other family planning method
(record type)
Urbanity
Region
Province
Muncipality/City
Barangay
Purok
Household ID Number
Line number referenced to line number in member record
Reason why solo parent
Other Reason why solo parent
(record type)
Urbanity
Region
Province
Muncipality/City
Barangay
Purok
Household ID Number
Line number referenced to line number in member record
Profession code
Other profession
(record type)
Urbanity
Region
Province
Muncipality/City
Barangay
Purok
Household ID Number
Line number referenced to line number in member record
Type of exam
Exam indicator
(record type)
Urbanity
37
hpq_handicap
hpq_handicap
hpq_handicap
hpq_handicap
hpq_handicap
hpq_handicap
hpq_handicap
hpq_handicap
hpq_handicap
hpq_handicap
hpq_handicap
hpq_handicap
hpq_handicap
hpq_handicap
hpq_handicap
hpq_handicap
hpq_handicap
hpq_handicap
hpq_handicap
hpq_handicap
hpq_handicap
hpq_handicap
hpq_handicap
hpq_seniorcit
hpq_seniorcit
hpq_seniorcit
hpq_seniorcit
hpq_seniorcit
hpq_seniorcit
hpq_seniorcit
hpq_seniorcit
hpq_seniorcit
hpq_seniorcit
hpq_seniorcit
hpq_seniorcit
hpq_seniorcit
hpq_expmem
hpq_expmem
hpq_expmem
hpq_expmem
hpq_expmem
hpq_expmem
hpq_expmem
hpq_expmem
hpq_expmem
hpq_expmem
hpq_expmem
hpq_expmem
hpq_expmem
hpq_expmem
hpq_expmem
hpq_expmem
hpq_expmem
hpq_crop
hpq_crop
hpq_crop
hpq_crop
hpq_crop
hpq_crop
hpq_crop
hpq_crop
regn
prov
mun
brgy
purok
hcn
handicap_line
disability_1
disability_o_1
ydisability_1
ydisability_o_1
disability_2
disability_o_2
ydisability_2
ydisability_o_2
disability_3
disability_o_3
ydisability_3
ydisability_o_3
assist_ind
assist_recvd
assist_src
assist_src_o
rtype
urb
regn
prov
mun
brgy
purok
hcn
seniorcit_line
withscid
use_scid_1
use_scid_2
use_scid_3
rtype
urb
regn
prov
mun
brgy
purok
hcn
expmem_line
expmemsn
expmemfn
expmemsex
expmemage
expmemreln
expmemreln_o
expmemynotinhh
expmemynotinhh_o
rtype
urb
regn
prov
mun
brgy
purok
hcn
Region
Province
Muncipality/City
Barangay
Purok
Household ID Number
Line number referenced to line number in member record
Physical/mental disability 1
Other disability 1
Cause of disability 1
Other cause 1
Physical/mental disability 2
Other disability 2
Cause of disability 2
Other cause 2
Physical/mental disability 3
Other disability 3
Cause of disability 3
Other cause 3
Received assistance?
Assistance received
Assistance source
Other Assistance source
(record type)
Urbanity
Region
Province
Muncipality/City
Barangay
Purok
Household ID Number
Line number referenced to line number in member record
With SCID
Usage SC ID 1
Usage SC ID 2
Usage SC ID 3
(record type)
Urbanity
Region
Province
Muncipality/City
Barangay
Purok
Household ID Number
Line number
Surname
First Name
Sex
Age
Relation to household head
Other relation to hh reference person
Why not present in the household
Other reason why not present in the household
(record type)
Urbanity
Region
Province
Muncipality/City
Barangay
Purok
Household ID Number
38
hpq_crop
hpq_crop
hpq_crop
hpq_crop
hpq_agriequip
hpq_agriequip
hpq_agriequip
hpq_agriequip
hpq_agriequip
hpq_agriequip
hpq_agriequip
hpq_agriequip
hpq_agriequip
hpq_agriequip
hpq_agriequip
hpq_agriequip
hpq_agriequip
hpq_lstock
hpq_lstock
hpq_lstock
hpq_lstock
hpq_lstock
hpq_lstock
hpq_lstock
hpq_lstock
hpq_lstock
hpq_lstock
hpq_lstock
hpq_lstock
hpq_lstock
hpq_fcage
hpq_fcage
hpq_fcage
hpq_fcage
hpq_fcage
hpq_fcage
hpq_fcage
hpq_fcage
hpq_fcage
hpq_fcage
hpq_aquani
hpq_aquani
hpq_aquani
hpq_aquani
hpq_aquani
hpq_aquani
hpq_aquani
hpq_aquani
hpq_aquani
hpq_aquani
hpq_aquani
hpq_aquani
hpq_aquaequip
hpq_aquaequip
hpq_aquaequip
hpq_aquaequip
hpq_aquaequip
hpq_aquaequip
hpq_aquaequip
hpq_aquaequip
hpq_aquaequip
crop_line
croptype
croptype_o
crop_vol
rtype
urb
regn
prov
mun
brgy
purok
hcn
agriequip_line
agriequiptype
agriequiptype_o
agriequipind
agriequip_owned
rtype
urb
regn
prov
mun
brgy
purok
hcn
lstock_line
lstocktype
lstocktype_o
lstockind
nlstock
rtype
urb
regn
prov
mun
brgy
purok
hcn
fcage_line
fcage_area
rtype
urb
regn
prov
mun
brgy
purok
hcn
aquani_line
aquanitype
aquanitype_o
aquani_vol
rtype
urb
regn
prov
mun
brgy
purok
hcn
aquaequip_line
Line number
Crop type
Other type
Quantity harvested (in kilo)
(record type)
Urbanity
Region
Province
Muncipality/City
Barangay
Purok
Household ID Number
Line number
Equipment
Other equipment
Equipment indicator
Owner
(record type)
Urbanity
Region
Province
Muncipality/City
Barangay
Purok
Household ID Number
Line number
Type of livestock
Other type of livestock
Livestock indicator
How many
(record type)
Urbanity
Region
Province
Muncipality/City
Barangay
Purok
Household ID Number
Line number
Area
(record type)
Urbanity
Region
Province
Muncipality/City
Barangay
Purok
Household ID Number
Line number
Type
Other type
Volume harvested
(record type)
Urbanity
Region
Province
Muncipality/City
Barangay
Purok
Household ID Number
Line number
39
hpq_aquaequip
hpq_aquaequip
hpq_aquaequip
hpq_aquaequip
hpq_tree
hpq_tree
hpq_tree
hpq_tree
hpq_tree
hpq_tree
hpq_tree
hpq_tree
hpq_tree
hpq_tree
hpq_tree
hpq_tree
hpq_tree
aquaequiptype
aquaequiptype_o
aquaequipind
aquaequip_owned
rtype
urb
regn
prov
mun
brgy
purok
hcn
tree_line
tree_type
tree_type_o
tree_area
tree_vol
Equipment
Other equipment
Equipment indicator
Owned
(record type)
Urbanity
Region
Province
Muncipality/City
Barangay
Purok
Household ID Number
Line number
Type
Other type
Area
Volume harvested
40
THE CBMS NETWORK COORDINATING TEAM
DR. CELIA M. REYES
CBMS Network Leader
ANNE BERNADETTE E. MANDAP
JASMINDA A. QUILITIS
JOEL E. BANCOLITA
JUAN PAULO M. FAJARDO
MARSMATH A. BARIS, JR
ALELLIE B. SOBREVIÑAS
JEREMY L. DE JESUS
ERICA PAULA S. SIOSON
NOVEE LOR C. LEYSO
Research Staff
Inquiries regarding this CBMS work may be sent to:
CBMS Network Coordinating Team
Angelo King Institute for Economic and Business Studies
10th Floor Angelo King International Center
Estrada Corner Arellano Avenue, Malate, Manila, Philippines 1004
Tel. No.: (632) 5262067; (632)524-8888 loc 274
Fax No.: (632) 5262067
E-mail: [email protected]
[email protected]
Website: www.pep-net.org
41


![Section VII - Technical Specifications [ 920 KB]](http://vs1.manualzilla.com/store/data/005668651_1-8dca2c6e1104d59f56f239e80ee70ed9-150x150.png)