1
CS+ for CC V3.00.00
Release Note
R20UT3159EJ0100
Rev. 1.00
Aug.22, 2014
Chapter 1.
Target Devices...................................................................................................................... 2
Chapter 2.
User's Manuals ..................................................................................................................... 3
Chapter 3.
Keywords When Uninstalling the Product ............................................................................ 4
Chapter 4.
Changes ............................................................................................................................... 5
Chapter 5.
Points for Caution ................................................................................................................. 8
Chapter 6.
Restrictions ......................................................................................................................... 18
Chapter 7.
Changes to the User's Manuals ......................................................................................... 19
R20UT3159EJ0100 Rev. 1.00
Aug.22, 2014
Page 1 of 22
CS+ for CC V3.00.00
Release Note
Chapter 1.
Target Devices
The target devices supported by the CS+ are listed on the Website.
Please see this URL.
CS+ Product Page:
http://www.renesas.com/cs+
R20UT3159EJ0100 Rev. 1.00
Aug.22, 2014
Page 2 of 22
CS+ for CC V3.00.00
Release Note
Chapter 2.
User's Manuals
Please read the following user’s manuals along with this document.
Manual Name
CS+ V3.00.00 Installer
CS+ V3.00.00 Editor
CS+ V3.00.00 Python Console
CS+ V3.00.00 Updater
CS+ V3.00.00 Message
CS+ V3.00.00 Project Operation
CubeSuite+ V2.02.00 Analysis
CS+ V3.00.00 RH850 Debug Tool
CS+ V3.00.00 RX Debug Tool
R20UT3159EJ0100 Rev. 1.00
Aug.22, 2014
Document Number
R20UT3094EJ0100
R20UT3096EJ0100
R20UT3097EJ0100
R20UT3098EJ0100
R20UT3099EJ0100
R20UT3101EJ0100
R20UT2868EJ0100
R20UT3082EJ0100
R20UT3083EJ0100
Page 3 of 22
CS+ for CC V3.00.00
Chapter 3.
Release Note
Keywords When Uninstalling the Product
There are two ways to uninstall this product.
• Use the integrated uninstaller from Renesas (uninstalls all CS+ components)
• Use the Windows uninstaller (only uninstalls this product)
To use the Windows uninstaller, select the following from the Control Panel:
• Programs and Features
Then select [CS+ for CC].
R20UT3159EJ0100 Rev. 1.00
Aug.22, 2014
Page 4 of 22
CS+ for CC V3.00.00
Release Note
Chapter 4.
Changes
This chapter describes changes from V2.02.01 to V3.00.00.
4.1
Improvement of CS+ functionality
4.1.1
Change of the name
CubeSuite+ has been changed to CS+ from this version.
The expression of "CubeSuite+" may remain in some documents but this should be read as "CS+".
4.1.2
Multiple startup menus
Startup from the Start menu of Windows is divided into two types.
• CS+ for CC (RX, RH850)
• CS+ for CA, CX (78K, RL78, V850)
Use either of the above startup menus according to the compiler in use.
Family
RX
RH850
78K
78K0R
78K0
RL78
V850
V850E
V850E2
Compiler
CC-RX
CC-RH
CA78K0R
CA78K0
CA78K0R
CA850
CX
Start Menu of Windows
CS+ for CC (RX, RH850)
CS+ for CC (RX, RH850)
CS+ for CA, CX (78K, RL78, V850)
CS+ for CA, CX (78K, RL78, V850)
CS+ for CA, CX (78K, RL78, V850)
CS+ for CA, CX (78K, RL78, V850)
CS+ for CA, CX (78K, RL78, V850)
Note that when CS+ is started up by double-clicking a project file, the CS+ appropriate for the project
type will be started up.
4.1.3
Addition of a new facility to split panels
Highlighting of the focused tab in split panels is now supported.
4.1.4
Addition of the memory mapping profiler function
The memory mapping profiler function is now supported.
4.1.5
Improvement of the Option dialog box
[Build / Debug] is separated into [Build] and [Debug].
The [Enable parallel build between projects] check box is added to [Build].
4.1.6
Improvement of the external tool startup function
Placeholders that can be specified with startup options of an external tool are added.
Placeholder Name
ActiveProjectDir
ActiveProjectName
FileDir
MainProjectDir
MainProjectName
MicomToolPath
ProjectDir
ProjectName
TempDir
WinDir
R20UT3159EJ0100 Rev. 1.00
Aug.22, 2014
Description
Replacement with the absolute path of the active project folder
Replacement with the active project name
Replacement with the absolute path of the folder containing the file that
is currently selected in the Project Tree panel
Replacement with the absolute path of the main project folder
Replacement with the main project name
Replacement with the absolute path of the installation folder of this
product
Replacement with the absolute path of the project folder
Replacement with the project name
Replacement with the absolute path of the temporary folder
Replacement with the absolute path of the Windows system folder
Page 5 of 22
CS+ for CC V3.00.00
4.1.7
Release Note
Change of the configuration of user's manuals and online help
The configuration for user's manuals and online help is changed. The main configuration is as follows:
Installer (only user's manual and no online help)
Project Operation
Peripheral Function Operation
Pin View
API Reference
Editor
Compiler
Build Tool Operation
Debug Tool
Analysis
Python Console
Updater
Message
4.2
Improvement of functionality of build tool
4.2.1
Addition of the parallel build function
The parallel build function is now supported.
Usage of the parallel build function enables multiple CPU cores on the host machine to simultaneously
execute compilation and thus reduce the build time. This function can also perform parallel build between
projects, that is, simultaneous build of multiple projects.
4.3
Improvements to the debugging tool
4.3.1
Improvement of Debug Console Panel (RX)
The font of Debug Console Panel was changed into the monospaced font.
4.3.2
Improvement of Debug the program re-writing the on-chip FLASH (RX).
The specification was changed so that the software break could not be set as on-chip PROGRAM
ROM and on-chip DATA FLASH, when “Debug the program re-writing the on-chip PROGRAM ROM”
or “Debug the program re-writing the on-chip DATA FLASH” was set as YES.
4.3.3
Trusted memory function of RX64M series (RX).
The Trusted memory function of RX64M series was supported.
4.3.4
Improvement of Action Event (RX,RH850)
The specification was changed so that variable expression could also set up blank in Printf event tab.
4.3.5
Improvement of download (RX,RH850)
The specification was changed so that the applicable address might be displayed, when the error
occurred.
R20UT3159EJ0100 Rev. 1.00
Aug.22, 2014
Page 6 of 22
CS+ for CC V3.00.00
4.4
Release Note
Improvement of functionality of Python Console
4.4.1
Addition of Python functions
The following Python functions are added.
Function Name
common.PythonInitialize
debugger.ActionEvent.Delete
debugger.ActionEvent.Disable
debugger.ActionEvent.Enable
debugger.ActionEvent.Get
debugger.ActionEvent.Information
debugger.ActionEvent.Set
debugger.GetIORList
4.4.2
Functional Overview
Initializes Python.
Deletes an action event.
Disables the action event settings.
Enables the action event settings.
Refers to the action event results.
Displays the action event information.
Sets an action event.
Displays a list of IOR registers.
Addition of Python classes
The following Python classes are added.
Class Name
ActionEventCondition
ActionEventInfo
ActionInfo
IORInfo
4.4.3
Functional Overview
Sets conditions for action events.
Holds information on action events.
Holds information on action event results.
Holds information on IOR registers.
Addition of Python properties
The following Python properties are added.
Property Name
common.ExecutePath
build.Compile.Macro
build.Version
debugger.ActionEvent.GetLine
debugger.Option.AccessStopExecution
debugger.Option.AfterTraceMemoryFull
R20UT3159EJ0100 Rev. 1.00
Aug.22, 2014
Functional Overview
Refers to the absolute path of the folder for the exe file of the
running CS+.
Sets or refers to definition macros which are compiler options
of the active project.
Refers to the version of the compiler package.
Sets or refers to the number of action event results to be held.
Sets or refers to an option of the debug tool.
Sets or refers to an option of the debug tool.
Page 7 of 22
CS+ for CC V3.00.00
Release Note
Chapter 5.
Points for Caution
This section describes points for caution regarding CS+.
5.1
Points for caution regarding CS+ (general)
5.1.1 File names
The following rules apply to folder and file names.
- Folder and file names
Do not use folder or file names that cannot be created from Windows Explorer.
- Source file names, load module file names, and project file names
File names consist of the characters a-z, A-Z, 0-9, the period (.), the underscore (_), plus sign (+),
and minus sign (−).
File names cannot start or end with a period (.).
Filenames cannot start with a plus sign (+) or minus sign (−).
CS+ is not case-sensitive to file names.
File names may have up to 259 characters, including the path.
Do not use source files with the same file name. Even if they are on different paths, CS+ cannot
classify them.
- File names other than the above
File names comply with Windows conventions.
Note that the following characters cannot be used in file names.
\/:*?"<>|;
File names cannot start or end with a period (.) or space.
CS+ is not case-sensitive to file names.
File names may have up to 259 characters, including the path.
- Folder names
Folder names comply with Windows conventions.
Note that the characters below cannot be used in file names.
(),=
5.1.2 Panel display
If your hardware environment does not meet the recommended specifications for CS+, the [Property]
panel may appear small and have scrambled contents.
If this happens, move the [Property] panel outside the split panel area.
- Enable [Dockable], and make it a docking panel
- Enable [Floating], and make it a floating panel
5.1.3 User Account Control (UAC) function (Windows Vista, Windows 7)
If the UAC function is disabled on Windows Vista or Windows 7, then if a user without administrator
privileges creates a project, and no Device Dependence Information is installed, installation of the
Device Dependence Information will begin, but the installation will fail. If the UAC function is disabled,
create projects after logging in with administrator privileges.
5.1.4 Command accelerators included in split panels/categories
Although accelerators are displayed in the command menus of split panels and categories, pressing
these key combinations (shortcut keys) will have no effect. Use the mouse to select menu items.
5.1.5 Problem with a Windows update program
Your computer may suffer a "blue screen" error if you apply the KB2393802 patch published by
Microsoft Corporation. If this error occurs, please apply the patch provided by your computer's
manufacturer or another source.
R20UT3159EJ0100 Rev. 1.00
Aug.22, 2014
Page 8 of 22
CS+ for CC V3.00.00
Release Note
5.1.6 Renesas Electronics real-time OS
If you use the real-time operating system for the RX family provided by Renesas Electronics, install CS+
in a folder and path where the names contain no parentheses. If you install it under the 64-bit version of
Windows, it will be installed in the "Program Files (x86)" folder by default, and since the folder path
includes parentheses, this will produce an error.
5.1.7
Changing microcontrollers
Note the following points for caution when changing the microcontroller.
The microcontroller can only be changed to another within the same family, since this will
correspond to the same build tool (RH850 and RX).
When changing the microcontroller, do so while the debugger is not connected.
Save the project before changing the microcontroller.
Information on pin layout (design tool), code generation (design tool), and debugging (except for
watch registration information) are not carried over after the microcontroller has been changed.
5.1.8
Plug-in Manager function
We recommend that the checkbox for the plug-in for the microcontroller that is the target for
development is not deselected on the [Basic Function] tabbed page of the [Plug-in Manager] dialog
box.
Deselect the checkboxes for the build tool and debugging tool plug-ins that are for microcontrollers that
are not the target for development. For example, if only the plug-in for the build tool is deselected, the
file to be downloaded by the debugging tool will not be found and an error will occur.
5.1.9 [Editor] panel
The [Page Setup] dialog box is not available.
Although there is a [Copy] button on the [Print Preview] toolbar, it does not work.
When a variable or label is selected and the Jump to Function feature is used from the context
menu, execution does not jump to the variable or label.
The Jump to Function feature will not jump to a static function defined in another file.
The following notes apply to the editor, when source files with the same name but from different
folders are registered with a main project and a sub project, and load modules from both the main
project and sub project are downloaded.
The address of the main project is displayed on the file.
At jumping to a source file from disassembled code, the file registered with the main project is
opened.
If the file is opened from either project, only one file will be opened.
The smart edit function does not work correctly for a structure that does not have a name.
If the arguments of a function include a function call, incorrect information will be displayed in the
tooltip.
Names of member variables and functions are not correctly supplemented by the smart edit function
in arrays of classes and of pointers to classes.
Supplementation does not produce appropriate strings even if a part of a member name is entered
and 'ctrl + (space)' is also entered.
Outlining (collapse/expand) only works with files that have been registered with the project. Any files
that have not been registered with the project will not be outlined in the [Editor] panel of CS+.
On Windows 8, the display may become unclear due to anti-aliasing.
In mixed display mode, if a line number is specified for a jump, the disassembled code is inserted
and displayed, so the specified line may not be displayed on the screen.
If a structure is nested, the smart edit function does not work on the third and subsequent stages. In
addition, information is not displayed in the tooltip.
For the first line of code immediately after ‘#ifdef - #endif’, the smart edit function does not show
candidate members. In addition, no tooltip is displayed.
For the first variable in ‘#ifdef - #endif’, the smart edit function does not show candidate members
for the code after ‘#endif’. In addition, no tooltip is displayed.
When a file not included in a project is opened, a bookmark is set, the project is closed, the setting
for the bookmark in the file is changed, the project is opened again, and the [Bookmarks] dialog box
is opened, the dialog box will display the bookmark with the setting when the project was closed
while the source window displays the bookmark with the new setting that was made after the project
was closed. That is, different settings are displayed for the bookmark in the dialog box and source
window.
In such cases, close the file and then open it again. The display of the bookmark in the [Bookmarks]
dialog box will then reflect the display in the source window.
When the rectangular selection tool (obtained by holding the Alt key down and then using the
R20UT3159EJ0100 Rev. 1.00
Aug.22, 2014
Page 9 of 22
CS+ for CC V3.00.00
Release Note
mouse to select an area) is used and the selected area is pasted to add lines in and after the last
line, the selected area is pasted from the beginning of the line after last regardless of the location
specified for pasting. Insert spaces after pasting as required.
When saving a file in the [Save As] dialog box, the extension listed at the top of the [Save as type]
drop-down list is automatically added unless another extension is specified. Note however, that an
extension is not added when a file name is input with an extension that is selected in the [Save as
type] drop-down list or with an extension that is registered with Windows. When an automatically
added extension is not as expected, modify the name of the file by using, for example, Explorer.
5.1.10 Conversion from PM+ to CS+ projects
CS+ cannot read CA850 projects made by PM+ V6.00/V6.10/V6.11 then the Build Mode has been newly
added. Handling by CS+ is as follows.
1) When [Debug Build] or [Release Build] is specified, information on the added Build Mode cannot be
read.
2) When the added Build Mode is specified, it leads to an error.
[Workaround]
Use V6.20 or a later version of PM+ to read the project, save it, then read the project into CS+.
5.1.11 Debugging tool settings during project appropriation
When you create a project by appropriate settings from another project, only the settings for the default
debugging tool will be imported. In the RX family, however, internal processing is common to the
emulator and simulator, so the settings are imported regardless of which debugging tool is selected.
5.1.12 Online help
If you close the online help while the Search tab is being displayed and you then open the online help
again and display the [Contents] tab, the Coding and Build sections may disappear.
If this happens, close the online help while the [Contents] tab is being displayed, and then open the
online help again.
5.1.13 Changing the target device during the process of converting a project
When the target device is changed in the [Project Convert Setting] dialog box while it is open for
conversion of a project created by using the High-performance Embedded Workshop, PM+, or an earlier
version of CubeSuite, the value chosen in [Kind of project] is returned to the default value (top type in
the combo box).
For example:
The setting for [Kind of project] changes to the default type (for example, [Application]) when the device
selection is changed.
5.1.14 Converting High-performance Embedded Workshop projects
Attempting to load a High-performance Embedded Workshop project into the CS+ under certain
conditions may not be possible, or may lead to an error during conversion or building of the project.
(1) Converting a High-performance Embedded Workshop project to make it compatible with the CS+ fails
when any of the following conditions is satisfied.
No toolchain from Renesas Electronics Corp. is selected for the project.
The project contains no tps file for use in setting up the High-performance Embedded Workshop
environment (the tps file is automatically created when the project is opened through the
High-performance Embedded Workshop). To avoid this problem, you should open the project
through the High-performance Embedded Workshop once before starting conversion.
The project contains multiple CFG files, each of which is used to set up a realtime OS from
Renesas Electronics Corp.
(2) Converting a High-performance Embedded Workshop project to make it compatible with the CS+
succeeds but building of the project leads to an error when any of the following conditions is satisfied.
Placeholder $(TCINSTALL) is used in the project.
$(TCINSTALL) remains in the project even after conversion but the CS+ does not recognize
$(TCINSTALL). Placeholder $(TCINSTALL) that has been used as a parameter for [Options]
in the High-performance Embedded Workshop is simply passed to the CS+ and may cause
an unintended result (e.g. an error) upon building of the project. For this reason, you should
manually change $(TCINSTALL) after converting the project.
R20UT3159EJ0100 Rev. 1.00
Aug.22, 2014
Page 10 of 22
CS+ for CC V3.00.00
Release Note
Placeholder $(WORKSPDIR) is used in the project.
If you select a HEW project file (with extension hwp) in the CS+, this is automatically
converted to “%ProjectDir%\..” (the directory above the project directory). An error may occur
during building of the project if the workspace does not exist in the directory indicated by
“%ProjectDir%\..”.
For this reason, you should manually change “%ProjectDir%\..” after converting the project.
A custom build phase is used in the project.
Since all custom phases are deleted upon conversion, an error may occur during building of a
project that involved a file output created for a custom build phase in the High-performance
Embedded Workshop.
After converting the project, register the custom build-phase command with the CS+ as a
command to be executed before or after each phase as required.
A custom placeholder is used in the project.
Custom placeholders are not converted because the CS+ does not recognize them. Any
custom placeholder that has been used as a parameter for [Options] in the High-performance
Embedded Workshop is simply passed to the CS+ and may cause an unintended result (e.g.
an error) upon building of the project. For this reason, you should manually change the
custom placeholders after converting the project.
(3) Other
(a) $(FILEDIR) is converted to %FileDir%.
Leaving %FileDir% as it is when the pathname is edited in the [Path Edit] dialog box will lead to the
following error: The specified path contains a non-existent folder. (W0205012)
Edit the pathnames and replace %FileDir% with another placeholder or directory name.
(b) $(WINDIR) is converted to %WinDir%.
(c) The order in which folders are displayed in CS+ may differ from that in the High-performance
Embedded Workshop.
(d) If a High-performance Embedded Workshop project for which downloaded files have been
specified is loaded into CS+, CS+ will show these files as the second and subsequent items in the
list of downloaded files for each debugging tool.
(e) The compiler option -output=src is converted to –output=obj (default).
(f) If you load a library project that has been linked to the standard library into CS+, the linkage setting
will be discarded (this is indicated in the log information that is output as a result of loading the
project).
(g) If [Use an existing library file] has been selected for the library generator in the High-performance
Embedded Workshop, the setting is changed to [Do not add a library file] in CS+. For this reason,
linking with the specified library will not proceed (this is indicated in the log information that is
output as a result of loading the project).
(h) Option settings that were made on the [Toolchain Option] tabbed page of the High-performance
Embedded Workshop are not converted but discarded (i.e. they are not moved across to CS+).
(i) If a sub-command file has been selected for the linkage editor in the High-performance Embedded
Workshop, the [Use external subcommand file] setting is discarded when the project is loaded into
CS+. The linkage editor options will have their default settings.
(j) Any files specified with the -library, -input, or -binary option will not be listed in the [Link Order]
dialog box. The result is that the order of linkage for these files will not be selectable.
(k) RTOS configuration files will not be displayed under the [Configuration file] category node after the
project is loaded into CS+.
(l) RTOS option settings that were made in the High-performance Embedded Workshop are discarded.
RTOS options will have their default settings in CS+.
(m) The build mode for RTOS projects will be "DefaultBuild" after the project is loaded into CS+. You
will need to change the build mode as required.
(n) The order of linkage of the assembly output files (ritbl.obj) for an RTOS project will differ from that
in the High-performance Embedded Workshop.
5.1.15 Creating new projects
Applies to: RX
If a new project is created by selecting [Empty Application[CC-RX]] under the environment for the RX,
building the project may lead to the following errors.
** L2132 (E) Cannot find "D" specified in option "rom"
** L2132 (E) Cannot find "D_1" specified in option "rom"
** L2132 (E) Cannot find "D_2" specified in option "rom"
If you encounter these errors, change the setting of [ROM to RAM mapped section] on the [Link Options]
sheet in CS+.
R20UT3159EJ0100 Rev. 1.00
Aug.22, 2014
Page 11 of 22
CS+ for CC V3.00.00
Release Note
5.1.16 Microsoft IME
If you are using Microsoft Office IME 2010, which is included in Office 2010 from Microsoft Corporation,
CubeSute+ may output error E2000006.
Since Microsoft Office IME 2010 may have caused this problem, replace it with Microsoft’s standard IME or
install the KB2687611 module provided by Microsoft Corporation to fix Microsoft Office IME 2010.
5.1.17 Tutorials
The Code Generator Plug-in, Pin Configurator Plug-in and Program Analyzer Plug-in are used in tutorials.
Enable them through the [Plug-in Manager] dialog box.
5.1.18 Starting multiple instances of CS+
Two or more instances of CS+ can be started on the same host machine, but if you do so, take note of the
points listed below.
When two or more instances of CS+ are started, the most recent information to have been written is
saved in the information file for each user’s own PC.
When two or more instances of CS+ are started, the most recent information to have been written is
saved in the information file for the stack analysis tools (including CallWalker).
When the same project file is used in two or more instances of CS+, the most recent information to
have been written is saved.
When the same project file is used in two or more instances of CS+, do not attempt building from more
than one instance at the same time since the names of the output files will be identical.
5.1.19 Options when starting CS+
Although the options below can be specified when starting CS+W.exe, do not specify them. If specified,
they will prevent the edit function from operating normally.
/npall
/np to specify an editor
5.1.20 Mentions of “R8C” in user’s manuals and online help
“R8C” is mentioned in the user’s manuals and online help, but CS+ does not support the R8C family.
R20UT3159EJ0100 Rev. 1.00
Aug.22, 2014
Page 12 of 22
CS+ for CC V3.00.00
5.2
Release Note
Points for caution regarding design tools
5.2.1 Changing packages
If you change the package name in the pin layout properties, the data input in the device top view and
device pin list will be cleared.
5.2.2 Saving projects
If you save a project that has sub-projects while the [Device Top View] or [Device Pin List] panel is open,
then the device top view and device pin list of the last sub-project in the Project Tree will always appear.
5.3
Points for caution regarding debugging tools
The abbreviations listed below collectively denote the corresponding tools in this section.
OCD (serial): E1 Emulator (serial), E20 Emulator (serial)
OCD (JTAG): E1 Emulator (JTAG), E20 Emulator (JTAG)
5.3.1 Adding sub-projects
Applies to: All debugging tools, common to all devices
Disconnect the debugging tool before adding a sub-project that handles a different device from the main
project.
5.3.2 Low-power consumption modes
Applies to: All debugging tools for RX
When a forced break occurs in a low-power consumption mode (e.g. sleep, stop, or standby) or an
instruction that makes the CPU enter a low-power consumption mode is executed during stepped
execution, the behavior of the simulator and the emulator will differ as follows.
Emulator: The forced break leads to release of the CPU from the low-power consumption mode.
Furthermore, the CPU will enter the low-power consumption mode during stepped execution.
Simulator: Transitions to low-power consumption modes (e.g. by a register setting) are not
supported. Executing a WAIT instruction causes a break, with the PC placed at the address of the
next instruction. During stepped execution, the CPU does not enter the low-power consumption
mode and the PC is placed at the address of the next instruction.
5.3.3 Traces over desired intervals
Applies to: Simulator for all devices
If you perform a trace from a trace start event until a trace end event, the simulator will not include the
trace end event in the results of the trace. For this reason, if you are using a simulator, set the trace end
event one line below the range for which you require display of the trace data.
5.3.4 Adding sub-projects
Applies to: Common to all debugging tools and devices
If you add a sub-project while a debugging tool is connected, downloading and so on may fail. Only add
sub-projects while the debugging tool is disconnected.
5.3.5 Breakpoints and other settings becoming invalid
Applies to: Common to all debugging tools and devices
If you use leading underscores to differentiate function or variable names, the debugger may recognize
them incorrectly and change the symbols or invalidate breakpoint settings.
This applies in cases such as when you have two functions, one named _reset and the other named
__reset.
5.3.6
Two or more variables having the same name
Applies to: All debugging tools for RX
When two or more variables are defined with the same name in unnamed name spaces of different
source files, the [Watch] panel only shows the information on the first variable to be found.
R20UT3159EJ0100 Rev. 1.00
Aug.22, 2014
Page 13 of 22
CS+ for CC V3.00.00
5.3.7
Release Note
Member-variable pointers
Applies to: All debugging tools for RX
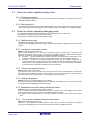
After the member-variable pointer "mp1" defined in the program below is registered with the [Watch] and
[Local Variables] panels, the type of the pointer is indicated as "int *", not "int Foo::*".
class Foo {
int m1;
};
int Foo::*mp1 = &Foo::m1;
5.3.8
Assigning unions to registers
Applies to: All debugging tools for RX
When a union is assigned to a register, it is assumed that the members of the union are assigned to the
lower-order bytes of the register. For this reason, the values of the members will be incorrect when
displayed as big endian.
5.3.9
Functions with the same name and char-type parameters
Applies to: All debugging tools for RX
When three functions with char-type parameters are defined as shown below, the address of
"Func(signed char)" will not be displayed (i.e. the address of "Func(char)" will be displayed instead).
void Func(char);
void Func(signed char);
void Func(unsigned char);
5.3.10 Char-type one-dimensional arrays
Applies to: All debugging tools for RX
When a char-type one-dimensional array is assigned to multiple locations in registers or memory as
shown below, no character string will be displayed in the value column of the [Watch] or [Local Variables]
panel even after the array "array" has been registered with the panel (“” is displayed instead).
char array[5] = "ABCD";
5.3.11 Changing the priority section among overlaid sections
Applies to: All debugging tools for RX
Changing the priority section among overlaid sections is not immediately reflected in debugger
operations. To update the display of addresses in the editor, for example, you need to close the file and
open it again. To update the display of variables in the [Watch] panel, execute a single step of the
program.
5.3.12 Variables assigned to registers
Applies to: All debugging tools for RX
When the selection for [Scope] in the [Local Variables] panel is not [Current], the values of variables
assigned to registers are not displayed correctly. Editing these values is also not possible.
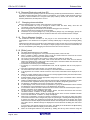
5.3.13 Locations to which variables are assigned
Applies to: All debugging tools for RX
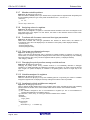
When a defined variable satisfies both of the conditions given below, the [Watch] and [Local Variables]
panels indicate the location of the entire variable rather than the location of its member variables.
Conditions:
(1) The variable is assigned to two or more addresses or registers (i.e. two or more addresses or
registers are displayed in the address column).
(2) A structure-, class-, array-, or union-type member is defined in the variable.
Example:
struct Mem {
long m_base;
};
struct Sample {
long m_a;
struct Mem m_b; <- Condition (2)
};
R20UT3159EJ0100 Rev. 1.00
Aug.22, 2014
Page 14 of 22
CS+ for CC V3.00.00
Release Note
main () {
struct Sample obj;
}
Display in the [Watch] and [Local Variables] panels:
"obj"
{ R1:REG, R2:REG }
(struct Sample)
L m_a
0x00000000
{ R1:REG }
(long)
L m_b
{ R1:REG, R2:REG }
(struct Base)
L m_base 0x00000000
{ R2:REG }
(long)
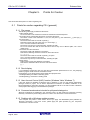
5.3.14 Casting variables
Applies to: All debugging tools for RX
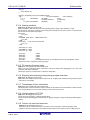
When a variable is cast to another type in the [Watch] panel, casting of the variable is C-style.
For this reason, the result of casting a class using virtual inheritance to its base class is not the same as
the result of the cast within the program
class AAA [
int m_aaa;
} objA;
class BBB : public AAA { // BBB inherits AAA.
int m_bbb;
} objB;
class CCC { // CCC does not inherit AAA.
int m_ccc;
} objC
class AAA* pa = objA;
class BBB* pb = objB;
class CCC* pc = objC;
"(AAA*)pa"
Usable
"(BBB*)pb"
Usable
"(AAA*)pb"
Usable
"(CCC*)pc"
Usable
"(AAA*)pc"
Not usable because pc is considered to point to the top address of AAA.
Image of the cast in a program: (AAA*)((void*)pc)
5.3.15 PC entering the sleep state
Applies to: OCD (JTAG) and OCD (serial) for RX
When a PC running Windows Vista or Windows 7 enters the sleep state, debugging by CS+ cannot be
continued after the PC reawakes.
Please set up the PC so that it does not enter the sleep state.
5.3.16 Stopping and restarting tracing during program execution
Applies to: All debugging tools for RX
When trace start events and end events have been set, stopping and restarting tracing during program
execution is not possible.
5.3.17 Timestamps of trace information
Applies to: OCD (JTAG) and OCD (serial) for RX
The timestamps of trace information will not indicate the right times if the time between frames exceeds
that corresponding to the trace counter (20 bits) or when trace output is lost.
5.3.18 Linkage options of CC-RX
Applies to: All debugging tools for RX
CC-RX does not support the ‘-sdebug’ linkage option.
Please set [Outputs debugging information] in the [output] category of the [Link Options] tabbed page to
'-debug'.
5.3.19 Return-out command execution
Applies to: All debugging tools for RX
Executing a return-out command from a recursive function may lead to execution stopping at the
address of the return instruction in the called function instead of the correct line in the calling function.
R20UT3159EJ0100 Rev. 1.00
Aug.22, 2014
Page 15 of 22
CS+ for CC V3.00.00
Release Note
5.3.20 Startup program protection
Applies to: OCD (serial) for RX100
Executing a CPU reset after one of the following operations during the execution of a user program will
lead to a discrepancy between the contents of ROM as displayed by the debugger and the contents of
the actual ROM of the MCU.
In this case, the contents will match after re-executing then stopping the user program.
Calling the R_FCL_ChangeSwapFlag function to immediately swap boot areas
Controlling the flash initial setting register (FISR) to immediately swap boot areas
5.3.21 Coverage measurement function
Applies to: E20 emulator (JTAG) for RX64M
(1) If you connect the emulator by using hot plug-in, the coverage measurement function is not
available.
If you use hot plug-in to connect the emulator, please select [No] for [Use code coverage measurement
function] in the [Coverage] category of the debugging tool properties.
(2) When the error message "The system was reset." is displayed during program execution, coverage
from the start of the program to the system reset will not have been measured.
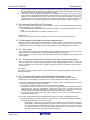
5.3.22 The break point setup in for statement or inline-expanded function
Applies to: All debugging tools for RX
If the following programs are described in C sauce, the command of the source program is arranged at
two or more addresses,but the editor panel shows only one address.
When the break point is set up to this line, the program stops only when the address that displayed on
the editor panel is executed.
1. Inline-expanded function (*1)
2. template function
3. Head sentence of for statement or do-while statement
*1 Include the function that inline expansion was performed by optimization.
5.3.23 The setting for DMAC/DTC trace
Applies to: E20 emulator (JTSG) for RX64M
When [Bus Master of data access] in the [Trace] category on the Property panel's [Debug Tool Settings]
tab is set as [DTAC/DTC], If [External trace output] in the [Trace] category is set as [Trace output], the
trace function may not work correctly.
Please set as [CPU execution] or [Do not output].
5.3.24 Main clock source setting when PLL is selected as clock source
Applies to: OCD(JTAG),OCD(Serial),RX64M
Please set up the following, when PLL is selected as clock source.
Set the [Main clock source] of the [Clock] category of the [Connection settings] tab of a debug tool
property as [EXTAL].
When EXTAL is selected as PLL clock source, set the frequency of EXTAL to [Main clock frequency].
When HOCO is selected as PLL clock source, set the frequency of HOCO to [Main clock frequency].
5.4
Points for caution regarding analysis tools
5.4.1 [Analysis Chart] panel
•
•
•
•
•
The [Execution Time(Percentage) Chart] tabbed page of the [Analysis Chart] panel cannot be
displayed (E1/E20 for RH850).
[Variable Value Changing Chart] tabbed page of the [Analysis Chart] panel does not support
“Analysis of trace data” mode (E1/E20 for RH850).
When the emulator does not support the time tags of the internal trace, the [Analysis Chart] panel
cannot be used (E1/E20 for RX).
When a simulator is specified as the debugging tool in a graph of transitions in values, realtime
sampling of IORsis not supported.
The results on an [Execution Time(Percentage) Chart] may not be exact. This is because the
counter for time-lag measurement of the trace is small and may overflow. Please check whether it
has overflowed by checking the timestamp of the [Trace] panel (E1/E20 for RX).
R20UT3159EJ0100 Rev. 1.00
Aug.22, 2014
Page 16 of 22
CS+ for CC V3.00.00
Release Note
5.4.2 [Function List] and [Variable List] panels (E1/E20 for RH850)
•
•
5.5
The [Function List] panel does not support “Execution Time”, “Execution Time(Percentage)” and
“Code Coverage”.
The [Variable List] panel does not support “Data Coverage”.
Points for caution regarding the Python Console
5.5.1 Japanese input
The Japanese input facility cannot be activated from the Python Console. To enter Japanese text, write
it in an external editor etc., copy it, and paste it into the console.
5.5.2 Display of the prompt
The Python Console prompt “>>>” may be displayed more than once, as in “>>>>>>”, results may be
displayed after the “>>>”, or the caret may appear without a preceding “>>>” prompt. Entering functions
is still possible in these situations.
5.5.3 Paths to folders and files
IronPython recognizes the backslash character (\) as a control character. For example, if a folder or file
name starts with a “t”, then the sequence “\t” will be recognized as a tab character. Please use r +
"path_name" to avoid this.
Example: r"c:\test\test.py"
A forward slash (/) can be used instead of a backslash (\).
5.5.4 Executing scripts for projects that do not have load modules
If a script is specified in the startup options for use with a project that does not have a load module file,
or if project_file.py is placed in the same folder as the project file, then although the script would have
been executed automatically after normal loading of the project, it will not be executed if there is no load
module file.
5.5.5 Forced termination
The following actions while a script such as an infinite loop is running may lead to the results of function
execution being in error because the actions forcibly terminate the execution of functions.
1. Forcible termination by selecting “Forcibly terminate” from the context menu or pressing Ctrl+D in the
Python Console
2. Changing the active project in a project with multiple projects
5.5.6 Forced stopping
Executing “Abort” from the context menu will forcibly stop an executing script or function, but hook and
callback functions that had not started at the time the “Abort” was executed will still be executed in
order after that.
5.5.7
Executing Python commands during building
Do not issue Python commands while building is in progress.
5.6
I/O Header File Generation
5.6.1 A Function to set I/O Header Generation options
It is possible to set I/O Header Generation option at the [I/O Header File Generation Options] tab on the
property panel of the build tool .The following 2 settings are now possible.
• Update I/O header file on build
• Other additional options
5.6.2 Generating I/O Header File
It is possible to generate I/O Header File when selecting “Generate I/O Header File” on the context
menu of the build tool node on the project tree.
R20UT3159EJ0100 Rev. 1.00
Aug.22, 2014
Page 17 of 22
CS+ for CC V3.00.00
Release Note
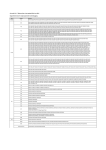
Chapter 6.
Restrictions
This section describes restrictions on CS+.
6.1
Restrictions imposed by debugging tools
The abbreviations listed below collectively denote the corresponding tools in this section.
OCD (serial): E1 Emulator (serial), E20 Emulator (serial)
OCD (JTAG): E1 Emulator (JTAG), E20 Emulator (JTAG)
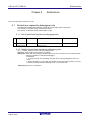
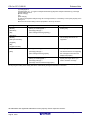
6.1.1 List of restrictions imposed by debugging tools
No.
Target tool
Target device
Description
1
OCD (serial)
OCD (JTAG)
RX64M
Restriction on ID code authentication
due to an error
Remarks
6.1.2 Details of restrictions imposed by debugging tools
No.1 Condition leading to errors in ID code authentication
Applies to: OCD (serial) and OCD (JTAG) for RX64M
Description: When both of the following conditions are met, an error will occur in ID code authentication
making it impossible to continue with debugging.
[Conditions]
1. A device having an ID code setting other than all FF is being debugged in user boot
mode.
2. After downloading a program that includes data for the option-setting memory, the CPU
is reset by a RESET command, RES# pin reset, or an internal reset.
Workaround: There is no workaround.
R20UT3159EJ0100 Rev. 1.00
Aug.22, 2014
Page 18 of 22
CS+ for CC V3.00.00
Release Note
Chapter 7.
Changes to the User's Manuals
This section describes changes to the user's manuals for CS+.
7.1
Changes to the description of hook processes
This section describes changes to the description of hook processes.
Hook processes are described in the Debugging editions.
You can configure a hook transaction in the [Hook Transaction Settings] tab on the [Property] panel.
Setting up a hook transaction provides a way of changing the values of I/O registers and CPU registers by
executing a Python script before downloading a load module, or before running or after resetting the CPU.
This makes the following points realizable.
(1) In program development, even if the setting program for the I/O registers is incomplete, debugging can
proceed by setting the I/O registers before running the program.
(2) You can increase the download speed by configuring the I/O registers before downloading a program.
(3) Downloading to external RAM can be easily handled by setting up I/O registers before downloading.
You can use the following commands in a Python script to be executed as a hook process of the debugger.
debugger.Register.GetValue
debugger.Register.SetValue
debugger.Memory.GetValue
debugger.Memory.SetValue
If you want to use other Python commands, please use the Hook command in the Python console.
7.2
Change to CubeSuite+ V2.02.00 Analysis
This section describes a change to the CubeSuite+ V2.02.00 Analysis:(document number
R20UT2868EJ0100).
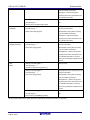
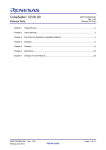
7.2.1 The setting of Dynamic analysis
(1) Change part 1
[Location] page 10 1.1.2 Types of analysis information (2) Dynamic analysis information (a) Trace
function after remarks2.
[Before change]
non
[After change]
In order to use dynamic analysis using the trace function, it is necessary to set up the property of the
debug tool.
Below, the list of each debug tool and properties to be set up is shown.
Debug tool
Properties
Description
[RH850]
[Debug Tool Settings]tab ->
Select [Yes]
[Simulator]
[Trace]category ->
[RX]
[Use trace function] property(*)
[Simulator]
[Debug Tool Settings]tab ->
Select trace size from the drop-down
[Trace]category ->
list
[Trace memory size[frames]] property
[RH850]
[Debug Tool Settings]tab ->
Select [Branch PC] when acquiring only
[Full-spec Emulator]
[Trace]category ->
the function information.
[Select trace data] property
Select [Data Access] when acquiring
R20UT3159EJ0100 Rev. 1.00
Aug.22, 2014
Page 19 of 22
CS+ for CC V3.00.00
Release Note
only the variable information.
Select [PC + Data Access] when
acquiring the function information and
the variable information.
[Debug Tool Settings]tab ->
Select trace size from the drop-down
[Trace]category ->
list
[Trace memory size[frames]] property
[RH850]
[Debug Tool Settings]tab ->
Select [Branch PC] when acquiring only
[E1]/[E20]
[Trace]category ->
the function information.
[Select trace data] property
Select [Data Access] when acquiring
only the variable information.
Select [PC + Data Access] when
acquiring the function information and
the variable information.
[RX]
[Debug Tool Settings]tab ->
Select [Branch] when acquiring only the
[E1]/[EZ Emulator]
[Trace]category ->
function information.
[Trace data type] property
Select [Data Access] when acquiring
only the variable information.
Select [Branch + Data Access] when
acquiring the function information and
the variable information. The setup
which can be selected is dependent on
device.
[RX]
[Debug Tool Settings]tab ->
[E20]
[Trace]category ->
Select [Trace]
[Usage of trace function] property (*)
[Debug Tool Settings]tab ->
Select [Branch] when acquiring only the
[Trace]category ->
function information.
[Trace data type] property
Select [Data Access] when acquiring
only the variable information.
Select [Branch + Data Access] when
acquiring the function information and
the variable information. The setup
which can be selected is dependent on
device.
[Debug Tool Settings]tab ->
Select trace size from the drop-down
[Trace]category ->
list.
[Trace memory size[MByte]] property
(*)If [Settings] tab-> [General] category-> [Enable dynamic analysis information] property in Program Analyzer plugin is
set as [Yes], the setting of the debug tool will be automatically changed at the time of connection
R20UT3159EJ0100 Rev. 1.00
Aug.22, 2014
Page 20 of 22
CS+ for CC V3.00.00
Release Note
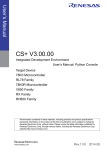
(2) Change part 2
[Location] page 10 1.1.2 Types of analysis information (2) Dynamic analysis information (b) RRM
function/RAM monitor (pseudo RRM) function after caution.
[Before change]
non
[After change]
In order to use dynamic analysis using the RRM function/RAM monitor (pseudo RRM) function, it is
necessary to set up the property of the debug tool.
Below, the list of each debug tool and properties to be set up is shown.
Debug tool
Properties
Description
[RH850]
[Debug Tool Settings]tab ->
Select [Yes]
[Simulator]
[Access Memory While Running] category->
[RX]
[Access during the execution] property(*)
[Simulator]
[Debug Tool Settings]tab ->
Specify the interval between 100 and
[Access Memory While Running] category->
65500
[Display update interval[ms] ] property
[RH850]
[Debug Tool Settings]tab ->
[Full-spec Emulator]/
[Access Memory While Running] category->
[E1]/[E20]
[Access during the execution] property(*)
[RX]
[Debug Tool Settings]tab ->
[E1]/[EZ Emulator]
[Access Memory While Running] category->
Select [Yes]
Select [Yes]
[Update display during the execution]
property(*)
[Debug Tool Settings]tab ->
Specify the interval between 100 and
[Access Memory While Running] category->
65500
[Display update interval[ms] ] property
[RX]
[Debug Tool Settings]tab ->
[E20]
[Trace]category ->
Select [Real-time RAM monitor]
[Usage of trace function] property
[Debug Tool Settings]tab ->
Select [Yes]
[Access Memory While Running] category->
[Enable the automatic update of realtime
display] property
[Debug Tool Settings]tab ->
Specify the interval between 100 and
[Access Memory While Running] category->
65500
[Display update interval[ms] ] property
(*)If [Settings] tab-> [General] category-> [Enable dynamic analysis information] property in Program Analyzer plugin is
set as [Yes], the setting of the debug tool will be automatically changed at the time of connection
R20UT3159EJ0100 Rev. 1.00
Aug.22, 2014
Page 21 of 22
CS+ for CC V3.00.00
Release Note
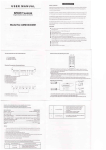
(3) Change part 3
[Location] page 11 1.1.2 Types of analysis information (2) Dynamic analysis information (c) Coverage
function after caution 3.
[Before change]
non
[After change]
In order to use dynamic analysis using the Coverage function, it is necessary to set up the property of the
debug tool.
Below, the list of each debug tool and properties to be set up is shown.
Debug tool
Properties
[RH850]
[Debug Tool Settings]tab ->
[Simulator]
[Coverage] category->
[RX]
[Use coverage function] property(*)
Description
Select [Yes]
[Simulator]
[RH850]
-
[Full-spec Emulator]/
The coverage function is not
supported.
[E1]/[E20]
[RX]
[E1]/[EZ Emulator]
[RX]
[Debug Tool Settings]tab ->
Select [Yes]
[E20]
[Coverage] category->
The device which is not supporting
[Use coverage function] property
the coverage function does not
display this property.
[Debug Tool Settings]tab ->
Specify the ranges where you
[Coverage] category->
want to measure coverage
[Coverage area of measurement] property
(*)If [Settings] tab-> [General] category-> [Enable dynamic analysis information] property in Program Analyzer plugin is
set as [Yes], the setting of the debug tool will be automatically changed at the time of connection
All trademarks and registered trademarks are the property of their respective owners.
R20UT3159EJ0100 Rev. 1.00
Aug.22, 2014
Page 22 of 22
Notice
1.
Descriptions of circuits, software and other related information in this document are provided only to illustrate the operation of semiconductor products and application examples. You are fully responsible for
the incorporation of these circuits, software, and information in the design of your equipment. Renesas Electronics assumes no responsibility for any losses incurred by you or third parties arising from the
use of these circuits, software, or information.
2.
Renesas Electronics has used reasonable care in preparing the information included in this document, but Renesas Electronics does not warrant that such information is error free. Renesas Electronics
assumes no liability whatsoever for any damages incurred by you resulting from errors in or omissions from the information included herein.
3.
Renesas Electronics does not assume any liability for infringement of patents, copyrights, or other intellectual property rights of third parties by or arising from the use of Renesas Electronics products or
technical information described in this document. No license, express, implied or otherwise, is granted hereby under any patents, copyrights or other intellectual property rights of Renesas Electronics or
others.
4.
You should not alter, modify, copy, or otherwise misappropriate any Renesas Electronics product, whether in whole or in part. Renesas Electronics assumes no responsibility for any losses incurred by you or
third parties arising from such alteration, modification, copy or otherwise misappropriation of Renesas Electronics product.
5.
Renesas Electronics products are classified according to the following two quality grades: "Standard" and "High Quality". The recommended applications for each Renesas Electronics product depends on
the product's quality grade, as indicated below.
"Standard": Computers; office equipment; communications equipment; test and measurement equipment; audio and visual equipment; home electronic appliances; machine tools; personal electronic
equipment; and industrial robots etc.
"High Quality": Transportation equipment (automobiles, trains, ships, etc.); traffic control systems; anti-disaster systems; anti-crime systems; and safety equipment etc.
Renesas Electronics products are neither intended nor authorized for use in products or systems that may pose a direct threat to human life or bodily injury (artificial life support devices or systems, surgical
implantations etc.), or may cause serious property damages (nuclear reactor control systems, military equipment etc.). You must check the quality grade of each Renesas Electronics product before using it
in a particular application. You may not use any Renesas Electronics product for any application for which it is not intended. Renesas Electronics shall not be in any way liable for any damages or losses
incurred by you or third parties arising from the use of any Renesas Electronics product for which the product is not intended by Renesas Electronics.
6.
You should use the Renesas Electronics products described in this document within the range specified by Renesas Electronics, especially with respect to the maximum rating, operating supply voltage
range, movement power voltage range, heat radiation characteristics, installation and other product characteristics. Renesas Electronics shall have no liability for malfunctions or damages arising out of the
use of Renesas Electronics products beyond such specified ranges.
7.
Although Renesas Electronics endeavors to improve the quality and reliability of its products, semiconductor products have specific characteristics such as the occurrence of failure at a certain rate and
malfunctions under certain use conditions. Further, Renesas Electronics products are not subject to radiation resistance design. Please be sure to implement safety measures to guard them against the
possibility of physical injury, and injury or damage caused by fire in the event of the failure of a Renesas Electronics product, such as safety design for hardware and software including but not limited to
redundancy, fire control and malfunction prevention, appropriate treatment for aging degradation or any other appropriate measures. Because the evaluation of microcomputer software alone is very difficult,
please evaluate the safety of the final products or systems manufactured by you.
8.
Please contact a Renesas Electronics sales office for details as to environmental matters such as the environmental compatibility of each Renesas Electronics product. Please use Renesas Electronics
products in compliance with all applicable laws and regulations that regulate the inclusion or use of controlled substances, including without limitation, the EU RoHS Directive. Renesas Electronics assumes
no liability for damages or losses occurring as a result of your noncompliance with applicable laws and regulations.
9.
Renesas Electronics products and technology may not be used for or incorporated into any products or systems whose manufacture, use, or sale is prohibited under any applicable domestic or foreign laws or
regulations. You should not use Renesas Electronics products or technology described in this document for any purpose relating to military applications or use by the military, including but not limited to the
development of weapons of mass destruction. When exporting the Renesas Electronics products or technology described in this document, you should comply with the applicable export control laws and
regulations and follow the procedures required by such laws and regulations.
10. It is the responsibility of the buyer or distributor of Renesas Electronics products, who distributes, disposes of, or otherwise places the product with a third party, to notify such third party in advance of the
contents and conditions set forth in this document, Renesas Electronics assumes no responsibility for any losses incurred by you or third parties as a result of unauthorized use of Renesas Electronics
products.
11. This document may not be reproduced or duplicated in any form, in whole or in part, without prior written consent of Renesas Electronics.
12. Please contact a Renesas Electronics sales office if you have any questions regarding the information contained in this document or Renesas Electronics products, or if you have any other inquiries.
(Note 1)
"Renesas Electronics" as used in this document means Renesas Electronics Corporation and also includes its majority-owned subsidiaries.
(Note 2)
"Renesas Electronics product(s)" means any product developed or manufactured by or for Renesas Electronics.
SALES OFFICES
http://www.renesas.com
Refer to "http://www.renesas.com/" for the latest and detailed information.
Renesas Electronics America Inc.
2801 Scott Boulevard Santa Clara, CA 95050-2549, U.S.A.
Tel: +1-408-588-6000, Fax: +1-408-588-6130
Renesas Electronics Canada Limited
1101 Nicholson Road, Newmarket, Ontario L3Y 9C3, Canada
Tel: +1-905-898-5441, Fax: +1-905-898-3220
Renesas Electronics Europe Limited
Dukes Meadow, Millboard Road, Bourne End, Buckinghamshire, SL8 5FH, U.K
Tel: +44-1628-585-100, Fax: +44-1628-585-900
Renesas Electronics Europe GmbH
Arcadiastrasse 10, 40472 Düsseldorf, Germany
Tel: +49-211-6503-0, Fax: +49-211-6503-1327
Renesas Electronics (China) Co., Ltd.
Room 1709, Quantum Plaza, No.27 ZhiChunLu Haidian District, Beijing 100191, P.R.China
Tel: +86-10-8235-1155, Fax: +86-10-8235-7679
Renesas Electronics (Shanghai) Co., Ltd.
Unit 301, Tower A, Central Towers, 555 Langao Road, Putuo District, Shanghai, P. R. China 200333
Tel: +86-21-2226-0888, Fax: +86-21-2226-0999
Renesas Electronics Hong Kong Limited
Unit 1601-1613, 16/F., Tower 2, Grand Century Place, 193 Prince Edward Road West, Mongkok, Kowloon, Hong Kong
Tel: +852-2265-6688, Fax: +852 2886-9022/9044
Renesas Electronics Taiwan Co., Ltd.
13F, No. 363, Fu Shing North Road, Taipei 10543, Taiwan
Tel: +886-2-8175-9600, Fax: +886 2-8175-9670
Renesas Electronics Singapore Pte. Ltd.
80 Bendemeer Road, Unit #06-02 Hyflux Innovation Centre, Singapore 339949
Tel: +65-6213-0200, Fax: +65-6213-0300
Renesas Electronics Malaysia Sdn.Bhd.
Unit 906, Block B, Menara Amcorp, Amcorp Trade Centre, No. 18, Jln Persiaran Barat, 46050 Petaling Jaya, Selangor Darul Ehsan, Malaysia
Tel: +60-3-7955-9390, Fax: +60-3-7955-9510
Renesas Electronics Korea Co., Ltd.
12F., 234 Teheran-ro, Gangnam-Ku, Seoul, 135-920, Korea
Tel: +82-2-558-3737, Fax: +82-2-558-5141
© 2014 Renesas Electronics Corporation and Renesas Solutions Corp.
© 2014 Renesas Electronics Corporation. All rights reserved.
Colophon
Colophon4.0
4.0