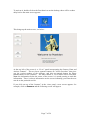
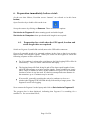
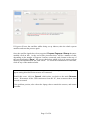
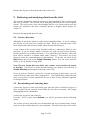
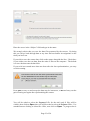
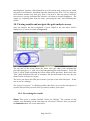
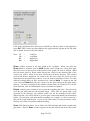
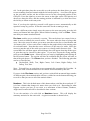
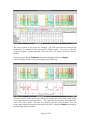
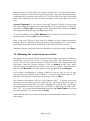
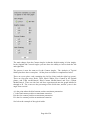
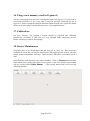
1
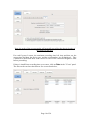
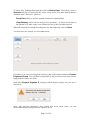
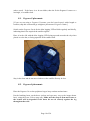
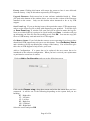
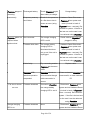
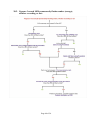
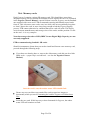
EQUINE GAIT ANALYSIS SYSTEMS User Manual. V9.0 May 2013 Page 1 of 54 Table of Contents 1. 2. 3. Introduction ............................................................................................................ 4 Glossary .................................................................................................................. 4 Poseidon software – a brief introduction:............................................................... 6 3.1. Starting Poseidon............................................................................................. 6 4. Sequence of operations (overview): ....................................................................... 8 5. Preparation the day before a trial:........................................................................... 9 6. Preparation immediately before a trial: ................................................................ 12 6.1. Preparation for a trial when the GPS speed, location and stride length data are required .............................................................................................................. 12 6.2. Preparation for a trial when the Pegasus-S sensor is not required. ............... 16 7. Dual Sensor system .............................................................................................. 16 7.1. How to operate a dual Sensor System ........................................................... 17 8. Performing a trial: ................................................................................................. 17 8.1. Pegasus-S placement: .................................................................................... 18 8.2. Pegasus-I placement: .................................................................................... 18 9. Retrieving and analysing data from the trial: ....................................................... 21 9.1. Create a directory .......................................................................................... 21 9.2. Downloading and Analysing data. ................................................................ 21 10. Viewing results and navigate the gait analysis screen. ..................................... 24 10.1. Presenting the results ................................................................................. 24 11. The Region Navigator ....................................................................................... 28 11.1. Analysis of Typical Stride Plot .................................................................. 29 12. Selecting a new Region ..................................................................................... 30 12.1. Preparing a report: ..................................................................................... 32 12.2. Saving the data: ......................................................................................... 34 13. Storing data for later analysis or clearing data from the sensors: ..................... 34 14. Obtaining the results from saved data:.............................................................. 36 15. Hock Angles...................................................................................................... 37 15.1. Pegasus-I sensor placement for Hock angles: ........................................... 37 15.2. Retrieving and processing data: ................................................................. 39 16. Using a new memory card in Pegasus-I: .......................................................... 42 17. Calibration: ....................................................................................................... 42 18. Sensor Maintenance .......................................................................................... 42 19. To get help from ETB: ...................................................................................... 44 20. Frequently Asked Questions ............................................................................. 45 20.1. Pegasus System Troubleshooting Chart .................................................... 45 20.2. Pegasus-I record LED permanently flashes amber (orange), whether recording or not: ....................................................................................................... 48 20.3. Pegasus-I record LED flashes amber (orange) AND green, only when recording: ................................................................................................................. 49 20.4. Pegasus-I records a file of zero length (as reported by Poseidon): ........... 50 20.5. Pegasus-I – no response when record button pressed: .............................. 51 20.6. Memory cards: ........................................................................................... 52 20.7. Pegasus-I sensors: ...................................................................................... 53 20.8. Laptop (hardware only): ............................................................................ 53 Page 2 of 54 Document History Version 9.0.0 Date May 2013 Page 3 of 54 Changes Initial Issue 1. Introduction This user guide is only applicable for Poseidon Software version 9.0.x and is intended to take you through the process of using ETB’s Pegasus Gait Analysis Products. The way the Pegasus product operates is dependent on the configurations that have purchased. Each of the Pegasus products builds on the functionality of the previous system. Hence the manual is written in detail for the lowest configuration which is called Cannon Angles, to the more complex Hock Angles. Other manuals that you may wish to consult are the Sensors manual and the results interpretation manual. If you feel we have not been clear or correct, please do let us know so we can improve! 2. Glossary csv = comma separated variable GPS = Global Positioning System HTML = HyperText Mark-up Language LED = Light Emitting Diode, the type of indicator on the sensors. NiMH = nickel metal hydride, referring to types of battery used PC = Personal Computer .pdf = file in Portable Document Format (by Adobe Systems) SD = Secure Digital (memory card) Trial = a test, using the Pegasus System to gather and analyse data USB = Universal Serial Bus LF = Left Fore RF = Right Fore LH = Left Hind RH = Right Hind LT = Left Tibia RT = Right Tibia s = time in seconds m/s = speed in metres per second m = length in metres Throughout this document the following is used. Page 4 of 54 Bold Text in the Aerial font refers to the name of a screen button. “Views” Names in speech quotes are area on the screen to observe or click by. Page 5 of 54 3. Poseidon software – a brief introduction: Poseidon is the software that you need at every stage apart from actually recording data and charging the sensors’ batteries. The user needs to understand the function of the taskbar. This is where the task panels are stored when using Poseidon. The main desktop is standard but Poseidon uses the Taskbar extensively during operation, especially during plotting of trial data. The screen shot below shows where the taskbar and task panels are stored. The area highlighted above is the Taskbar. The image below shows Taskpanels that are in the Taskbar. The user can swop between different applications in this area. Taskpanels are used extensively when the user generates plots of their trials in Cannon Angle or Hock Angle analysis. 3.1. Starting Poseidon Page 6 of 54 To activate it, double click on the Poseidon icon on the desktop, there will be a short delay before the main screen appears. This brings up the main screen, see below: At the top left of the screen is a “Views” panel incorporating the Sensors, Data and Actions “buttons”. The two lower separate buttons are "About Poseidon" that gives you the version number of the software, and also an upgrade button for future enhancements for the software. The other button is "Exit" which closes Poseidon. Note: the information below the centre of the screen: it is worth pausing to read this information. There is always information on the screen informing you what the user can do on the particular screen. If you click on one of the “buttons” in the views panel, a new screen appears: for example, click on Sensors and the following screen will appear. Page 7 of 54 Notice how the selected button is now filled in within the “Views” panel. A new panel has appeared along the top called “Processes”. Buttons which are inactive are “greyed out”. On some screens, you may see the following small button, a caret symbol, to the right of the processes ribbon. If a sensor(s) are connected, this button allows maintenance activities, or is used for troubleshooting on other screens. 4. Sequence of operations (overview): Since it can be daunting to read through a whole set of instructions, we felt it may be helpful to present the main essential process steps before describing them in detail. They are: A Preparation the day before a trial: charging the sensor batteries. This is done with the complete system. Best Practice Suggestion: Always charge the sensors overnight before a trial. B Preparation on the day of a trial. Connect laptop to a power outlet if available, otherwise the laptop will be ruining on batteries and will last approximately one hour. C Run Poseidon software and synchronise the sensors. Page 8 of 54 D Disconnect sensors and take them to the horse. E Set Pegasus-I sensors to logging and fit them to the horse using the brushing boots. Turn on the Pegasus-S sensor and fit to the rider using the silk, or to the horse if not being ridden. F Carry out the trial. G Remove the Pegasus-I sensors from the horse and rider and stop them logging. Switch off the Pegasus-S Sensor. H Download of the collected data: under the control of the Poseidon software, the recorded data is transferred from the sensors to the Laptop allowing the user to analyse the trial data. The process will now be described in detail along with many options that are available to the user. 5. Preparation the day before a trial: Open the case and check that all sensors are connected to their USB cable. Check all USB connections. Depending on the Pegasus system you have purchased, there will be either two or three USB connections on to the laptop, (these should never normally be removed) and they can be on the left or right hand side of the laptop. The other connections are to all the sensors purchased with your Pegasus system. The Pegasus-I units will only have the amber light next to the battery icon glowing. For more information about the sensors refer to the separate Sensor Manual. Ensure Pegasus-S unit is switched off and only the charging red light should be on. Ensure the laptop power supply is connected and plugged into a power socket. Take care not to trap the laptop power supply cable by accidentally closing or slamming the case lid. Do NOT lead the cable over the case side: Page 9 of 54 (The section of cable that plugs into the notebook PC carries non-hazardous low voltage.) Switch on the laptop. (Poseidon software does not have to be running at this stage.) Leave overnight to enable the sensors to fully charge, which takes around 12 hours. The sensors should have the following LED indicators lit: Pegasus-I amber charging LED (next to the battery symbol on the case), see image below, the orange light is lit. This will remain on while the sensors are connected to the laptop with the latter switched on (occasionally, this may change to blue but this is of no consequence: charging is unaffected). Page 10 of 54 Pegasus-S red battery charging LED, which initially flashes three times, then lights continuously until charged. This will extinguish when the unit is fully charged. Note: this sensor will not charge if it is switched on. Ensure that the laptop lid remains open during charging. If it is closed it will turn off the power and the sensors will not be charged. When the lid is opened, the laptop will be locked. Enter the password given to you to gain access to the laptop. Please note passwords are case sensitive. Once fully charged, the sensors will be able to record data for up to 6 hours on the day of your trial. If you have a Hock angle system this is reduced to 4.5 hours. If you require 6 hours for a Hock system then a separate Charging station can be purchased. Best Practice Suggestion: After a trial even if it is only a short one, always charge the sensors overnight before using Pegasus the next day. Page 11 of 54 6. Preparation immediately before a trial: (In the text that follows, Poseidon screen “buttons” are referred to in this form: button.) Open Poseidon by a double-click on the icon: Set up the sensors by clicking on Sensors. There are then two options: Set clocks to Pegasus-S when wanting speed and stride length. Set clocks to Computer when speed and stride length is not required. 6.1. Preparation for a trial when the GPS speed, location and stride length data are required Switch on Pegasus-S (small slide switch) next to the USB cable connector. Pegasus-S generally needs to be operated outdoors in the clear so that it can acquire the necessary GPS satellite signals. When you switch on the Pegasus-S sensor the following sequence will be carried out: For 30 seconds to 1 minute after switching on, the blue logging LED will be lit continuously. This is to allow connection to the laptop. The logging lamp will flash, being lit and off for about equal lengths of time, while the unit attempts to acquire satellite signals. From switching on, it may take a couple of minutes to arrive at this condition if Pegasus-S is in a similar location to where it was last used. If it has been transported some distance in the meantime, up to 15 minutes may be needed. If successful, (generally requiring the unit to be outdoors or close to a window) the logging LED will blink briefly followed by a longer pause. The Pegasus-S unit is now logging. Now connect the Pegasus S to the laptop and click on Set clocks to Pegasus-S. The progress bar is then displayed, indicating that Pegasus-S is searching for a satellite fix. See screen shot below; Page 12 of 54 If Pegasus-S loses the satellites whilst being set up indoors, take the whole system outdoors and start the process again. Once the satellite signals have been acquired, Prepare Pegasus-I Group becomes enabled: click on this. At the end of this procedure there will be a number of tabs depending on the number of Pegasus-I sensors connected, and a button at the top of the screen indicating ‘Done’. See screen shot below which is for a six sensor system showing information about the sixth sensor. To check the information for each unit, click on any of the numbered tabs. In rare instances, despite all sensors being connected correctly, an error message may appear stating that insufficient sensors are connected. Should this occur, click on Cancel, which takes you back to the main Sensors screen. Disconnect all the USB connectors from the PC, then reconnect them, then proceed as normal. If the problem persists, also reboot the laptop, then re-attach the sensors, and restart Poseidon. Page 13 of 54 Note: the order of the on-screen tabs will generally not reflect the physical order of the sensors in the case. For each Pegasus-I sensor, the maximum recording time left, time and date set, the current time and data, the device type, and the serial number, are all displayed. Take a moment to check that these look correct for each of the connected Pegasus-I units before proceeding. If there is insufficient recording time on a sensor, click on Data in the "Views" panel. The files on the card are then shown. See screen shot below; Page 14 of 54 To delete files, highlight them and then click on Delete Data. When done, click on Sensors and you are returned to the sensor set-up screen. The other buttons that are available in the "Processes" panel are; Fetch Data which is used for manual download of captured data. Clear Memory which can be used for two operations, a) delete all the data on the SDcard or b) make ready a new SDcard for use by the Poseidon software. When all sensors have enough recording time for data collection, click on Done. You now have two options, see screenshot below; If you have a an extra set of Pegasus-S sensors, then connect these and press Prepare Pegasus-I Group. You will then be taken back to the previous screen when you are happy that the sensors are all ok. Now select Prepare Pegasus S, a Popup window appears saying “Are you sure?” See below; Note: Any previous Pegasus-S data would have been saved when you last downloaded data providing chose the option to do so. Page 15 of 54 Select Yes, then Done in the Processes panel. All the sensors are now ready for a trial. Switch off the Pegasus-S sensor and disconnect each of the sensors and proceed to carry out your trial. Best Practice Suggestion: Always prepare the Pegasus-S because if you don’t the memory will get full, and earlier data will be overwritten. Also when the memory is near full it will take longer to download the GPS data for your trial. 6.2. Preparation for a trial when the Pegasus-S sensor is not required. If you do not need speed, stride length or location, choose Set clocks to Computer: The only options then available in the Processes panel are Cancel and Prepare Pegasus-I Group. Click on Prepare Pegasus-I Group, the progress of setting the time stamp on each unit is displayed then follow the same instructions as before for clearing sensors of excess data. When all sensors have enough recording time for data collection, click on Done. Disconnect each of the sensors and proceed to carry out your trial. Best Practice Suggestion: If you notice that the number of files is larger than that displayed in the window (there is a scroll bar on the right side of the window) and you have to scroll down, you should delete the earlier dated files. Ensure you have previously saved the data from the sensors. 7. Dual Sensor system Some users like to operate the equipment using two complete sets of sensors. Having two sets of sensors allows the user to do the following; Carry out a test on more than one subject at the same time. Have a test being carried out whilst down loading a set of trial data. If you have purchased or upgraded to this system, the Pegasus box has been modified to include a charging station. The power supply has been removed from the right hand side of the box, and an insert that holds the four Pegasus-I sensors and the Pegasus-S sensor takes its place. See photograph below. The mains power supply is connected as normal, but is stored in the supplied rucksack. The sensors are now considered a set, so the labels for both the Pegasus-I and Pegasus-S sensors are annotated with Set 1 and Set 2. Ensure you keep the sensors in their designated sets otherwise you will get incorrect results. Page 16 of 54 The second set of sensors are connected to the laptop using two USB cables on the right side of the laptop. This configuration allows the user to charge two complete sets overnight and reduces the need for extra boxes to house the sensors. Note: Charging this many sensors at one time reduces the recording time of the sensors from 6 hours to 4 hours. 7.1. How to operate a dual Sensor System You can only prepare one set at a time. Remove the two USB cables from the right hand side. You may have to lift the laptop slightly to remove the connectors. Now synchronise the sensor set for the front sensors as normal, and disconnect all of them from the laptop (that also includes the Pegasus-S even if it is not to be used). You can now reconnect the two USB connectors on the right hand side, and synchronise the second set. Now carry out your trials. Once the trial(s) have been completed carry out the following; Connect the first set of sensors at the front and analyse the data. Once complete, disconnect and remove the sensor set. Attach the next sensor set to the front and analyse the data. If you connect both sets of sensors you will receive error messages that too many sensors are connected. Once your day’s trials are complete, re-attach the sensor sets. If you require a full six hour charge in the sensors, the second sensor set needs to be charged at a charging station. A charging stations can be purchased from ETB. Both sensor sets can now be charged overnight. 8. Performing a trial: The trial should be carried out within an hour of setting up the sensors. If this is not the case, the sensors should be set up again following the procedure described in the previous section. This will ensure that all sensors remain adequately synchronised. Disconnect the sensors from the laptop and take the four Pegasus-I units, plastic bags for protection plus 4 brushing boots, the Pegasus S unit (where used) and the hat silk Page 17 of 54 (where used). If the horse is to be un-ridden, then the fit the Pegasus-S sensor to a surcingle, or a saddle cloth. . 8.1. Pegasus-S placement: [If you are not using a Pegasus-S, because you don’t need speed, stride length or location, skip this section and go straight to placement of Pegasus-I units.] Switch on the Pegasus-S wait for the blue logging LED to blink regularly and briefly, indicating that it has acquired the satellite signals. Place it in the silk with the blue logging LED facing upwards towards the sky when placed over the hat, or facing upwards in the saddle cloth. Stay in the clear and do not move indoors or the satellite fix may be lost. 8.2. Pegasus-I placement: Place the Pegasus-I in a clear polythene bag to keep out dust and moisture. Put the brushing boots on the horse (colour and type may vary to the image shown here), using the lower Velcro strap only. Make sure the strap is firm and secure or the results will be degraded if the boots do not sit securely against the leg throughout the trial: Page 18 of 54 [Each sensor has a label which defines on which limb it should be placed. It is essential that each sensor is mounted in the correct location and orientation.] Take a Pegasus-I and press the button firmly but briefly once, checking that the unit is logging data (green LED blinking will start). Fit the Pegasus-I into the appropriate brushing boot pocket, taking careful note of the label indicating its position on the animal. The unit should be upright (not upside down), and the LEDs should face outwards: Page 19 of 54 Once in the pocket the second Velcro strap should then be fastened. Again, make sure the strap is tight and secure: Best Practice Suggestion: When putting boots on make sure straps fit over the sensor pockets Repeat these steps for the remaining Pegasus-I sensors. The horse is now required to remain stationary for 10 seconds to allow the sensors to calibrate. The horse should now be exercised as required for the trial. Once the trial is complete, remove the brushing boots from the horse. Remove the Pegasus-I sensors from the pockets. Check that only the green status LED is flashing (the presence of amber indicates a stuck sensor or a loose memory card: if this happens, refer to the Sensors Manual). Stop each Pegasus-I logging by pressing the button once: no LEDs should remain lit or flashing. Page 20 of 54 Remove the Pegasus-S from the pocket and switch it off. 9. Retrieving and analysing data from the trial: The system is designed to make the analysis of data immediately after a trial as quick and easy as possible. This section covers analysing data from a four sensor Pegasus system. The next section covers downloading data for a six sensor system were the sensors are attached to the tibia, commonly known as Pegasus Hock Angles, see section 15. Return to the laptop and open Poseidon. 9.1. Create a directory When data is stored the default is under the PoseidonData folder. If you are doing a one off test you can just start to analyse the data. When you enter the name of the horse, this becomes the directory/folder where the data will be stored. A new feature in this version of the Poseidon software is choosing a folder to store your data. If you are doing a number of horses at a yard, you can create a directory for this yard before you analyse the horses. If we called the yard "Saracen", then each horse will be created as a separate folder under "Saracen". You need to set up the directory before the commencement of data analysis. To do this you click on the Data button then click on the Create Directory button. You can create and new folder, or use an already existing folder. Note: This new default directory/folder only remains current whilst you remain in Poseidon. If you have to restart Poseidon during your analysis you will need to Create Directory and navigate to the folder you set up. If you go back to "Saracen" yard to do a second screening of their horses, you can create a directory under that called "August2012". This significantly reduces the data entry over previous versions and allows the user to have a more structured approach to storing trial data. 9.2. Downloading and Analysing data. Connect the Pegasus-I units used during your trial (the order in which the Pegasus-I units are placed in the recessed foam within the case does not matter). The orange charging light will be illuminated. Connect the Pegasus-S and switch on. From the "Views" panel select Actions, you will be presented with the following screen. The Actions screen is where the user can determine the level of analysis they want to carry out on the trail that they have just completed. The table below gives a list of the Page 21 of 54 configurations for a four sensor system. The action screen will vary depending on the version of Pegasus you have purchased. Configuration Description Gait Calculate stride classified by gait and limb phasing Gait with Position Calculates strides classified by gait and limb phasing with GPS data Gait & Cannon Angle Calculate the gait and the cannon angles on all limbs Gait & Position & Cannon angle Calculate the gait with position and the cannon angles on all limbs The white box in the centre of the screen lists all of the actions that can be carried out. The list shown depends on the type of system that you have purchased. In this example we will calculate “Gait & Position & Cannon Angle” this is the most comprehensive analysis and will show all the features that can be used. Using the curser highlight “Gait & Position & Cannon Angle” then press Execute from the Processes panel. You cannot start the task by double clicking on it. You will be presented with the following screen. Page 22 of 54 Place the curser in the “Subject” field and type in the name. We strongly advise that you save the data files generated by the sensors. By doing this you can go back through data at any time and run further investigations on the trials you have run. If you wish to save the sensor data, click on the square alongside the line: ‘Check here if you wish to save the raw data from the units as files on the computer.’ The default is to save the data onto the hard disc. If your trial was started more than one hour after the last synchronisation, you may see this warning. Press yes to carry on and accept the data may be inaccurate, or no and carry out the gait screening test again after synchronising the sensors. You will be asked to select the Pegasus-S file for the trial (only S files will be visible), then click on Open, then you will be asked to select the Pegasus-I files. Use standard mouse clicking to select the 4 files, now click on Open. A progress bar is Page 23 of 54 then displayed, together with information as to the current stage in the process which may take several minutes, depending upon the duration of the trial. If it is a long trial the Poseidon window may turn grey, there is no need to take any action, when the next process is being calculated the window will return to normal brightness. The stages are: collecting data from the units, processing the data, and calculating the results. 10. Viewing results and navigate the gait analysis screen. Once the analysis has been completed a screen similar to the one below will be displayed. You can now switch off Pegasus-S. The top half of the screen shows the entire trial (gait chart) with automatically generated gait types (i.e. walk, trot et al) limb phasing plus stride duration. To the left is the "Legend" panel explaining the colour coding on the gait chart. Below this is the "Plot" panel that allows the user to customise the gait chart and to also save the gait chart for later inclusion in a report. The lower part shows the GPS plot of where you rode or the trial took place. In this case it was in a ménage. The “Region Navigator” is a floating window that allows you to easily add regions of specific interest from your trial when you start to produce your report. 10.1. Presenting the results Show: This opens a window labelled “Select for Display” The contents of this window vary depending on the item that you selected to 'Execute' after you pressed the Actions button. See screen shot below. Page 24 of 54 Click in the appropriate box where you would like to add more plots to the graph then press OK. These values are then added to the graph and the legend on the left hand side is shown for each of the lines added. Note: LF LH RF RH = = = = Left Fore Left Hind Right Fore Right Hind Zoom: enables sections of the time graph to be expanded. When you press the Zoom button it renames itself to Hold and the curser changes to a large plus sign. Move the cursor to the top left of the portion of the graph you wish to analyse. Hold the left mouse pad key down whilst moving the cursor to the bottom right of the section you wish to zoom in on, then release the left mouse pad key. The zoomed section will then be displayed. To return to the full view, place the cursor over the chart and press the right mouse pad key. You can zoom in a number of times. To work with the selection that you have zoomed in on, click on Hold. To return to the full view, click on Zoom then place the cursor over the chart and press the right mouse pad key. You have to do this for the number of times that you zoomed in. To exit the zoom function, click on Hold and the curser will return to a pointer. Export: enables you to include in your report the complete gait chart. You can zoom in to the gait chart and save the zoomed image. These files are stored with a .png extension in the directory you defined earlier, but are not included in the report. When selected, you will be asked to give the plot a name and identify the destination folder. Give the plot a title that means something, for example “1st trot in warm up”: this will be saved with the plot. If you use the same name as a plot previously saved, the first one will be overwritten without warning. Scan: This function allows you to follow the GPS tracking and watch it against the gait chart. Click on Scan, a cursor appears on the plot chart in red at the start of the Page 25 of 54 rial. In the gait chart place the curser this over the point on the chart where you want to start scanning from and commit with the left mouse pad key. A red line will appear on the gait chart, and the red dot will have moved to the correspond position in the GPS plot. Press the right key to move the cursor to the right: on the GPS plot the red dot moves along the trace, and the starting position is indicated by a white dot. Press the left key to return to the start point. Note, if you keep the right key pressed it will appear to move automatically as this equates to many key presses. It can take some time for the scanning to stop. To scan a different point, simply move the cursor to the new start point, press the left mouse pad button and start again. When finished scanning, click on Clear. Please note that you cannot scan backwards. Re-class: enables you to reclassify a section. This can be done in a zoomed view to make it easier to identify the correct strides. The curser takes the form of a large thin cross. Move the cursor to where you want to start the section for re-classification and ‘left mouse click’, a blue vertical line is added to the graph which is the starting point for reclassification. Note that the cursor will move to the start of a stride. Move the cursor to past the end of the stride you want to re-classify and left mouse click. The second blue line will then appear and a dialogue box will appear showing all the types of gaits that can be chosen for that region. If you have chosen the wrong starting point press the Undo button. Select the one you want by highlighting and clicking on the left mouse button. The section will then be redefined and the colour will alter to that of the gait chosen. Click Done when you have finished. The following gaits that can be re-classified are: Unclassified, Walk, Trot, Right Canter, Left Canter, Right Gallop, Left Gallop, Tolt, Pace. Note: Tolt and Pace are gaits that are not automatically recognised by Poseidon. In these cases each section would need to be chosen and reclassified by the user. If you are in the Re-class section, and you have reclassified an unusual large number of different gaits, the statistical table will have a slider bar on the bottom allowing you to scroll so that you can see all of the statistical data. Numbers: This is the default name of this button when a trial has been analysed. IT is in fact a button that changes it's name when you click on it. Depending on what Pegasus version you have it can circle to a maximum of three buttons, Numbers, Angles and Location all will be described in later sections. To see the statistics of a trial click on Numbers button. This will display the summary statistics for the entire trial. A typical screenshot is shown below; Page 26 of 54 The lower portion of the screen has changed. The GPS plot has been removed and replaced by the statistical table showing the different gaits. You can see that the “region navigator” window partially covers the data. To remove this there are two options. You may notice that the Numbers button has changed its label to Angles Click on Angles and the screen will change to the following. The lower portion of the screen now shows the default plot of the stride length which is the same plot as the gait chart above. This chart behaves the same as the gait chart, refer to the "Plot" panel. Currently it is showing just the stride duration. You can zoom, show different parameters and export the plot. Clicking on Show will bring up the following display window. Page 27 of 54 You have three selections of plot, the first two are Sagittal Angles and Coronal Angles which show how the cannon bone is moving in those planes for each individual leg. The third selection also allows you to overlay the limb phasing information if required. You can click on any combination of legs and/or angles. You can also zoom in to any part of the graph just the same as the gait graph. 11. The Region Navigator The Region Navigator is the window that allow you to select all of the areas of interest that you want to have highlighted in your report. It allows you to build up a comprehensive story to the trial. Once you have fully analysed the trial you can determine what plots you want in the report. The “Region Navigator” window has two useable buttons, New, and Delete. The Region labelled ‘All’ is shown and the data pertaining to the complete trial is detailed in the table below. Note: any white regions were the automatic gait classifier does not understand the gait information are not included in the summary table. If you know what gait should be in the white areas, you can use the Re-class button, see previous sections. The default table shown is for the complete plot. To obtain statistics for a specific section, click on New in the “Region Navigator” pane. Now move the crossbow cursor to the start time that you want to examine. Left click puts the blue start line in place. Move the cursor to the end of the region you want to examine and left click. It will then put a second blue line, and a window will open requesting you to “enter a name for the selected region”. Type in a name, for example ‘trot on left circle’ and then press Ok. Page 28 of 54 Two things now happen. The first is that the complete trial plot will change to show a plot of the zoomed section and the table shows the statistics for the region selected. You will also notice that there is a darker region in the gait chart, this is the stride that the software has selected as the typical stride of the region selected. This happens quickly so you may not see it. The second is that a new window opens showing the typical stride of those selected. See plot below in the Analysis of typical Stride Section. You will now see a zoomed graph area with a summary table of the region selected. Another window will open showing the analysis of Typical Stride "name you selected" To turn off the “Region Navigator” you can “right click” on the “Region Navigator” in the taskbar. A selection window appears. Untick “Always on Top”. If you now click anywhere outside of the “Region Navigator” the window it will disappear. To use the “Region Navigator” again just click on the “Region Navigator” in the taskbar. 11.1. Analysis of Typical Stride Plot The plot of the typical stride is shown below. Page 29 of 54 The plots show the sagittal and medial-lateral position of the cannon bones in each of these two planes. Sagittal is in line with the forward motion, and the medial-lateral (can also be called coronal) is side to side (dishing). There are four profile plots, each containing the left cannon (blue) and the right cannon (green). The plot areas are labelled; Hind Cannon, Fore Cannon in the sagittal planes, and the same again for the medial-lateral planes. There are also four vertical red lines superimposed onto the four plots labelled A through to D. The x-axis is the percentage of the stride time, and the y-axis is the angle of motion. A is the point where the hind cannon reaches maximum protraction. C is the hind cannon position at maximum retraction. B is the fore cannon position at maximum protraction. D is the fore cannon position at maximum retraction. There are a number of panels in the window that can be selected. The major one is the "Display" panel which has the following sub panes; Focus, Angles, Y-axes and Phase, these are all discussed below. Focus: Left is default, this uses the left leg as the reference limb. Select Right to use the right leg as the reference limb, the red lines then change colour to orange to make you aware of the selection. Angles: Relative is the default that displays the two cannon plots from a zero point. This allows the user to easily see how similar the left and right cannons are. Select Absolute if you wish to see the actual angle values. Y-axis: Autoscale is the default that displays the graphs at the largest size for easier viewing. Select Fixed scale for each plot to have the y-axis the same. Sagittal 0 to 80 degrees, hind medial-lateral -20 to +20 degrees, and fore medial-lateral 0 to +30 degrees. Phase: Best fit is the default setting. The display shows the left and right cannons overlaid onto each to give minimum error between the two hind legs. If you wish to see how far from symmetry the horse is then select 50%. How the forelimbs are aligned with the hind limbs is dependent upon the gait selected. Please read more in the 'How to interpret the results manual'. Note; this feature is not present on the canter or gallop gaits as these are asymmetric gaits. Publish: press the Publish button to the graph to the report. You will also notice in the Region Navigator under the "P" column notification that you have published this graph. 12. Selecting a new Region To select a new region move your cursor to the ‘All’ label in the ‘Region Navigator’. This brings you back to seeing the complete trial. You can now select another region. Also note that in the gait graph display you will see the blue lines for each of your previously selected regions. The “Start” and “Stop” headers in the region navigator Page 30 of 54 inform you of the selected start and stop times along the x-axis of the time graph. See example below; To display your selected regions just click on the name you have given it within the ‘Region Navigator’. The display shows the region that you selected. You can zoom in on any section within the zoomed section. If you want to keep that plot and the data click on Publish as explained in the previous section. You may notice that another window is sitting on top of the “Gait Analysis” window called “Poseidon”. Do not close this, to get back to the Gait Analysis window just click anywhere on that window. You will also notice that in the “Region Navigator” that the column “P” has an asterisk “*^” against the region name. The "*" means you have published the report, and the "^" means it is an angle region. This informs you that you have published that region and it will be included in the report. Note: If you decide that you no longer wish to have a region published, just delete it from the “Region Navigator”. To save other sections repeat the same process. If you want to delete any sections, then highlight the section in the “Region Navigator” and press delete. Poseidon is saving each of the regions in preparation to produce your report. Each region will appear in the report in the order you Published them. If you publish the same region more than once, it will be in the report more than once. To return to the complete trial move the cursor up to ‘All’ and left click. Note: The statistical data for all the trial provides the median, and the upper and lower interquartile range. Page 31 of 54 For the zoomed sections it provides the median and the min and max values. This means that the maximum stride lengths for example in the chosen region are provided. To return to the original view, click on the Location button. Note: If you have not selected the ‘All’ region in the Region Navigator and the press the Location button the system will display the zoomed section and you will not be able to get back to the full trial plot. To return to the full trial plot, click on Numbers, and select ‘All’ in the Region Navigator window and then click on Location. 12.1. Preparing a report: To generate a report you need to be on the Poseidon window. To get to this click on the Poseidon "Taskpanel" in the taskbar. A report can be produced by clicking on the Report button. The “Report Title” defaults to the one entered when initially downloading the data from the sensors. This can be edited by simply typing the new title in where the existing title is displayed. If you want to enter any comments or observations, this is done in the free form “Comments” section. Enter any text to include in the report: for example, “The first 2 minutes were un-ridden, the rest ridden” or “Horse kept spooking in the right hand corner of the ménage”. This will put context behind some of the results. Note: this box is free form text so no formatting of the text occurs, including carriage returns do not work in this section to provide new lines. The third section is the "Plot Selection" which lists the regions that you selected to have published during your analysis. If you wish to delete plots then click on the arrow which will list the plots and uncheck the box. See figure below. Page 32 of 54 When complete click the OK button. After a short pause, your report will be open in the supplied browser window. Best Practice Suggestion: Include facts such as horse’s details, protocol of trial, where trial was held and any significant points of relevance. If you want to analyse more regions you can click View Gait Results and carry on. Note: If you have completed all of your analysis you can now press Done. This takes you back to the window that is presented when you click the Actions button. If you realised that there was another region you wanted to review, then the only way to do that is to re-analyse the data from the beginning. See the section on “Obtaining the results from saved data”. The .html report is stored in the same folder as the sensor data and exported plots. To open other previously stored reports, navigate to the correct folder and double click on the *.html file, where * is the name you have given to the report. This will open the web Brower where you can review the report. The report contains the plot of each of the regions selected. The details of the selected region are also tabulated. An extra table is shown in the report that gives the main values from the graphs of the typical stride. Page 33 of 54 At the same time as the .html file was being generated, the same file was created as a pdf and is stored in the same folder. This allows you to safely transmit the file so other people can view them. Also, all of the plots that you generated whilst carrying out your analysis are also stored in the folder that you selected in Change directory If you want to see the Typical Stride graph for a particular region, just highlight the region in the Region Navigator and the press the Plot button in the Gait Processes panel. 12.2. Saving the data: When you are finished analysing regions, you can now click on Quit which takes you back to the Poseidon window. If you have made a mistake and want to carry on analysing regions, then click on the View Gait Results button and you will be taken back to the “Gait Analysis” window. To save the trial data click on Save in the "Processes" panel. A window opens asking you for a file name. Check that the file will be saved in the folder that you are working in, and then press Save. This saves the results as a .csv (comma separated variable) file which can then be reviewed at a later date or exported into other software packages. Contents of this file are described in the results interpretation manual. Best Practice Suggestion: To aide your memory it is best to call the file the same as you do when producing your report. Best Practice Suggestion: Don’t save the file until you have completed all your analysis because the regions won't be included in the file. Note: Once you exit the Poseidon programme you will not be able to add any other sections of data. So ensure you have completed your analysis and areas of interest, saved a CSV file and created your report. 13. Storing data for later analysis or clearing data from the sensors: The system is configured to automatically analyse the most recent set of data. If more than one trial has been carried out before returning to the PC, the data for earlier trials must be taken off the sensors and then analysed. Page 34 of 54 NOTE: We strongly recommend to download the data from the sensors on to the laptop after each trial. You don't have to carry out any analysis this can be done later allowing you carry on further trials. Remember to resynchronise the sensors before each trial. To save data from the units open Poseidon and then click on Data, (screen left hand side). The following options are then available along the top: Create Directory Access card reader Access Pegasus-I Access Pegasus-S Create Directory is used to organise trials of a number of horses, it is covered in an earlier section. Access card reader should be chosen if the micro SD card has been removed from the Pegasus-I unit, placed into a SD card adaptor and then inserted into the card reader on the PC. This is only advisable if the file size is very large and would therefore take some time to download using the USB connector. The micro cards are very small, easy to mishandle and fiddly to remove and put back into the Pegasus-I. If the card reader option is chosen, the files on the micro SD card will be displayed. Choose the files for download, by selecting Fetch Data and the destination folder and then OK. A progress bar will then show the data being transferred. Once this is completed the Ready status is shown. If you wish to delete data, highlight the files to be deleted and select Delete Data. In the next dialogue, confirm by selecting Yes and the files will be deleted. If you wish to clear the memory and reformat the card, select Clear Memory. You will then be asked if you are sure. In the next dialogue, confirm with Yes and the micro SD card will be reformatted. Click on Done when finished. Access Pegasus I provides the safer and easier (but slower) way to extract data from Pegasus-I by downloading the data directly from the unit. Ensure that only one Pegasus-I is connected before selecting this option. To make the data structure easy for subsequent analysis, one file should be selected and placed in the folder set up for a particular trial; for example ‘Saracen lunged June 14th 09’. To do this, highlight the appropriate file and click on Fetch Data. The progress bar indicates the data transfer to the chosen folder. When completed the Status returns to Ready. Repeat the transfer process for as many files as required, putting each into a unique folder. If you wish to delete files, highlight them and click on Delete Data. A dialogue allows you to confirm or cancel. Click Yes and the files will be deleted. If you wish to clear the memory and reformat the card then select Clear Memory. In the dialogue which opens, confirm with Yes and the micro SD card will be reformatted. When finished select Done. Page 35 of 54 Repeat the above for each of the four Pegasus-I units in turn. You should then have a number of folders, each with four Pegasus-I data files. Note, down loading using this method the files do not have the prefix of LF, LH, RF or RH. You need to ensure that each folder contains all four files to allow Poseidon to analyse the data in the saved files. Access Pegasus-S: if you wish to access the Pegasus-S, switch it on and select this option which then allows you to fetch the data or clear the memory. To fetch the data click on Fetch data and navigate to the destination folder, then select Save. The progress bar will then show the data being saved. To clear the memory, select Clear Memory. You will then be warned that this will destroy the data. Selecting Yes clears the memory. Note: if the same Pegasus-S was used for a number of trials without clearing the memory, there is a single file which only needs to be downloaded once. It can then be copied into all the other folders which relate to the other trials that it covered. When data storage or deletion has been completed for all Pegasus units, select Done. 14. Obtaining the results from saved data: This applies to data downloaded from the units and organised into separate folders, as described in the previous section. To analyse these files, first disconnect all the sensors. The Poseidon software will then search for the files on the laptop, rather than the sensors. Open the Poseidon software. Click on Actions in the Views panel. Select the type of analysis that you wish to carry out. For example “Gait & Position” and then click Execute. Enter the subjects name, and then click on Continue. Now instead of navigating or creating a folder to save the files to, you are now requested by the top banner of the window to “Choose the matching Pegasus-S file”. Navigate to the Pegasus-S file that you want to use. Click on Open. The window will change to “Select a set of Pegasus-I files”. It defaults to the same folder that you just used to select the Pegasus-S file. You will be asked to navigate to where the Pegasus-I data files are stored. Highlight the required files. If you have already analysed the data previously they will all have a different prefix, RHC, LHC, RFC, LFC. If you previously downloaded them by using Fetch Data they will not have these prefixes, you can now click on Open. If this trial had started more than one hour after synchronising the sensors you will see this warning. Page 36 of 54 Press yes to carry on and accept the data may be inaccurate, or no and carry out the gait screening test again after synchronising the sensors. A progress bar is then displayed, together with information as to where the system is in the procedure. The stages are: collect data from the units, processing the data, and calculating the results. This may take several minutes, depending upon the duration of the trial. From this point the operation of the software is the same as explained earlier in this manual. 15. Hock Angles The Hock Angle product is not only a software module add-on to the Limb Phasing and Cannon Angles, it also comes with another two Pegasus-I sensors giving a total of 6 sensors. This section of the user guide takes you through the process of using the Pegasus Hock Angle System to gather data on a horse’s gait, retrieving that data, and finally analysing it. It is assumed that you are proficient with the Cannon Angle four sensor systems use. Only differences applicable to hock angle are covered in this section. 15.1. Pegasus-I sensor placement for Hock angles: [Each sensor has a label which defines on which limb it should be placed. It is essential that each sensor is mounted in the correct location and orientation.] Attach the cannon straps as per the Limb Phasing section. Now attach the two hock straps. Make sure each strap is tight and secure as the results will be degraded if the sensors are not held firmly in place. Page 37 of 54 Take a Pegasus-I sensor and press the button once, checking that the unit is logging data (green LED blinking). Fit the Pegasus-I into the appropriate strap pocket, taking careful note of the label indicating its position on the horse. The unit should be upright, button uppermost (not inverted), and the LEDs should face outwards, away from the leg. As already noted, it should be parallel to the direction of leg swing: Page 38 of 54 Repeat these steps for the remaining Pegasus-I sensors. Once data collection is complete, remove the straps from the horse. Remove the Pegasus-I sensors from the pockets. Check that only the green status LED is flashing (the presence of amber indicates a stuck sensor or a loose memory card), if this happens, refer to the Pegasus-I Sensor Section. Stop each Pegasus-I logging by pressing the button: no LEDs should be lit. 15.2. Retrieving and processing data: The system is designed to make the analysis of data as quick and easy as possible. The screen now behaves in a similar manner as for Cannon Angles. Start Poseidon and press the Actions button. For Hock angle you can select with or without position data. See screen shot below. After you have analysed the data from the sensors, the second button in the Gait Processes panel cycles numbers, angles and location, but the default display for the angles graph is joint angles for the left and right hock. Clicking on Show in the Plot panel for the hock angles brings up the following “Select for Display” panel. See screen shot below. Page 39 of 54 The main change from the Cannon Angles is that the default setting is Joint Angles. In the Sagittal and Coronal Angles you now have the ability to look at both the left and right tibia. The process is now the same as for the Cannon Angles. The Analysis of Typical Stride plots have three extra plots. All the plots are listed for completeness below. There are seven plots, each containing the left leg (blue) and the right leg (green). There are four plot areas, Hock, Tibia, Hind Cannon, Fore Cannon in the sagittal planes, and Tibia medial-lateral, Hind Cannon Medial-lateral and Fore Cannon Medial-lateral. There are also four red lines superimposed onto the graph labelled A through to D. The x-axes are the percentage of the stride time, and the y-axes is the angle from vertical. A is the point where the hind cannon reaches maximum protraction. C is the hind cannon position at maximum retraction. B is the fore cannon position at maximum protraction. D is the fore cannon position at maximum retraction See below the example of the typical stride. Page 40 of 54 Publishing the data is exactly the same as the Cannon Angle product. Page 41 of 54 16. Using a new memory card in Pegasus-I: You are encouraged to use only the card supplied with your Pegasus-I. If you wish, or it becomes necessary, to use a new card, it must be specially formatted for use in Pegasus-I. Please consult the Support document supplied with your system for details of how to do this using Poseidon: the process is very straightforward. 17. Calibration: For best accuracy, the Pegasus-I sensors should be checked and calibrated periodically, preferably at least once per year, through ETB's calibration service. Please contact us to enquire and arrange. 18. Sensor Maintenance Generally there is no maintenance that the user has to carry out. But sometimes problems do occur and you may be asked by an ETB support person to carry out some simple Sensor maintenance activities. These activities take place on a sensor one at a time. Open Poseidon and only have one sensor attached. Click on Sensors and navigate to the small caret < to the right side Processes panel. Click on it and and a new button will be revealed called Open Sensor . Click on this button and it will open the following window. Page 42 of 54 Factory reset: Clicking this button will restore the sensor to how it was delivered from the factory. Only do this when requested by ETB support. Upgrade Firmware: Each sensor has its own software embedded inside it. When you look at the bottom of the window above you can see the version of the Firmware installed on the sensor. Only use this button when instructed to do so by ETB support. Save Event Log: IF you are having issues with a particular sensor, ETB support may ask to see the sensor log file to help with diagnosing your problem. To do this click on Save Event Log, A window will open and you are asked to name the log file. Note as to which folder it is going to be saved in and press Save. A window will pop up informing you if the file was successfully saved, click OK. You can now copy the file to a USB memory card and email it to ETB support. Get Battery Status: If you feel that the sensors are not operating for as long as they should, then ETB support may ask you to use this button. Press Get Battery Status and a window will pop up showing the voltage of the battery. You will need to give this value to ETB support to help resolve your issue. Add to Configuration: If a sensor has to be replaced, the new sensor has to be introduced to the software configuration. When you have received your replacement or purchased a second set of sensors. Click on Add to Configuration and you get the following screen. Click on the Choose a tag: drop down menu and select the sensor that you have connected. It will be one of the following depending on the system that you are building. RT - Right tibia LT - Left tibia LF - Left fore RF - Right fore LH - Left hind RH - Right hind Select the sensor and press OK Page 43 of 54 The window changes to the following, The window informs you what sensor has been added. The last three digits will be the serial number of the senor that you have added. Press OK, Press Close Sensor, and now disconnect the sensor and put it to one side. Connect the next sensor, press Open Sensor as before. You may get a Poseidon Fault window appear, example below, This is an issue between the Operating System and the Laptop. So just press OK, and Exit Poseidon. Now restart Poseidon, and click Sensors, >, Open Sensor, Add to Configuration. You will now get the Select Location Sensor window. Select the correct tag in ‘Choose a tag:’ press OK, check the serial number of the sensor. Press OK, Close Sensor. Now repeat the same steps for the remaining sensors 19. To get help from ETB: e-mail: [email protected] e-mail is generally our preferred option since for anything other than simple queries, it gives us time to attempt to reproduce the problem. Please try to provide a detailed description of the problem, giving as much detail as you can. Particularly helpful are screen shots copied into a document to show where things appear to be going wrong. Sensor serial number, Pegasus firmware issue and Poseidon software version may also be useful. Telephone: (office hours, weekdays): +44 (0)1438 822822 (answer-phone facility for out-of-hours) Page 44 of 54 Trace Log: If you contact ETB for support you may be asked to email the trace log to ETB. To do this open Poseidon, click on actions, and to the right of the "Processes" panel there is a smallcaret ">"button. Click on this and a new button will appear called Retrieve Log. Click on this and follow the instructions. This log informs the support person what you were doing when you had the issue, hence allowing us to replicate your problem so we can resolve the issue. Note: if the caret does not appear when you click Actions, it is because you have clicked somewhere else before. Simply close and reopen Poseidon. 20. Frequently Asked Questions There is a good chance that if an issue does arise, you will be able to deal with it, and this section is intended to help you. We recognise that any interruption in normal operation is inconvenient, so want issues to be resolved as quickly as possible. The following chart and tree diagrams should be a good starting point – see whether they deal with what you are experiencing. It may be necessary also to consult the text which follows the charts and diagrams, in order to see exactly what to do. Don’t feel you have to study the chart before the tree diagrams – start with whichever feels more comfortable and useful to you. You may also find useful information on our website. 20.1. Pegasus System Troubleshooting Chart Observation Tests Remedial Action Pegasus-I does not Discharged battery Check Pegasus-I again Charge battery respond when the after battery re-charge record button is pressed Possible Causes Firmware shut down Connect to Pegasus Hardware Reset Disconnect system:: the orange Pegasus-I from system and charging LED does not come on Memory corruption Following a Hardware Reset the record button still inoperative Memory card Following a Factory damaged Reset the record button still fails Page 45 of 54 reset (via hole in back of Pegasus-I case – see text) Factory Reset (using Poseidon software Diagnostics) Replace card (format is necessary using Poseidon) Pegasus-I stopped Discharged battery recording prematurely Check Pegasus-I again Charge battery after battery re-charge Temporary memory Check for the presence Hardware Reset Disconnect card failure of a file whose size is Pegasus-I from system and shown as zero (using reset (via hole in back of Poseidon) Pegasus-I case – see text) Reconnect to system - if the file is the last one on the card it can be retrieved using Poseidon Pegasus-I does not Not connected The orange charging respond when LED is not lit synchronised Firmware shut down Check cable to Pegasus-I is plugged in firmly The orange battery Hardware Reset Disconnect charging LED is Pegasus-I from system and illuminated but does reset (via hole in back of not go out if the unit is Pegasus-I case – see text) Re- unplugged connect to system - if the file is the last one on the card it can be retrieved using Poseidon Cable faulty Try connecting another Replace cable Pegasus-I to the same cable Poseidon USB Poseidon reports no interface operation unit connected though suspended cable connection is Close and restart Poseidon. If unsuccessful, re-start notebook PC secure File size is shown Firmware shutdown as zero Connect to Poseidon: the orange battery charging LED is not lit Disconnect Pegasus-I from system and do Hardware Reset (via hole in back of Pegasus-I case – see text) Re-connect to system - if the file is the last one on the card it can be retrieved using Poseidon Orange charging Firmware shutdown None LED is on Disconnect Pegasus-I from system and do Hardware Reset Page 46 of 54 (via hole in back of Pegasus-I permanently case – see text) Orange charging Battery is becoming LED is flashing discharged and None Charge battery operation will cease shortly Orange warning Pegasus-I is not Any files recorded will LED flashes during synchronised be date-stamped on, or recording Synchronise all Pegasus-I units (connect all to system) close to, January 1st 1970. Orange recording A sensor within LED goes out when LED is lit Pegasus-I is recording stopped continuously during physically jammed Free sensor by lightly tapping Pegasus-I (see text) recording Orange recording No memory card Check that a card is LED is flashing present seated in Pegasus-I Memory card is not Check card status on formatted correctly Poseidon Memory card is full Check card status on Poseidon Page 47 of 54 Insert card Clear memory using Poseidon Clear memory or delete some files using Poseidon 20.2. Pegasus-I record LED permanently flashes amber (orange), whether recording or not: Page 48 of 54 20.3. Pegasus-I record LED flashes amber (orange) AND green, only when recording: Page 49 of 54 20.4. Pegasus-I records a file of zero length (as reported by Poseidon): Page 50 of 54 20.5. Pegasus-I – no response when record button pressed: Page 51 of 54 20.6. Memory cards: Each Pegasus-I contains a micro-SD memory card. This should have more than adequate capacity and you should not normally need to replace the card. As explained in the Pegasus-I Sensor Manual, a special format is used in Pegasus, not the standard one supplied with a new card. ETB recommends sourcing individually-tested cards from us. This is because some cards, once in a while, take an exceptionally long time to “burn” data to the card, in some cases long enough to halt the Pegasus logging process. ETB cannot otherwise be confident that a new card will work. This aspect varies between manufacturers and storage sizes of the cards, and the position of a file on the card – it is very complex. Note that storage sizes above 2GB (SDHC Secure Digital High Capacity) are not currently supported. ETB recommend using Sandisk 1 GB cards. Should circumstances dictate that you need to install and format a new memory card, proceed through the following steps: If you have not already done so, remove the old memory card (this can be a little fiddly to do – a paper clip is a useful tool – see also the Pegasus-I Sensor Manual). Once the card is out, the amber status LED should flash. Ensure any new card does not contain files (such as precious images or documents) which you need. Formatting the card for Pegasus will delete these files. Insert the new card. If this has not yet been formatted for Pegasus, the amber status LED will continue to flash. Page 52 of 54 Run the Poseidon software and click on Data, then Access Pegasus-I. The Status box shows “Not a Pegasus format card”. Click on Clear Memory. A warning dialogue appears stating “This will destroy all data on the memory card”. Click on Yes to confirm. You should now see that the Status box has changed to Ready, and at the bottom of the screen, the card capacity and recording time are displayed. The amber status LED should also have stopped flashing. The card is now formatted and ready to record Pegasus data. 20.7. Pegasus-I sensors: If there appears to be an issue with a Pegasus-I, please consult the charts and diagrams above, if not already done, and also Pegasus-I Sensor Manual to see if this covers what you have experienced. If this does not provide an answer, contact your supplier in the first instance. If there is still something unresolved, contact ETB (details at the end of this document). 20.8. Laptop (hardware only): If there is a definite hardware problem with the laptop or an accessory such as the power supply, consult the supplied laptop documentation and contact Dell support for your territory. You will need your Service Tag number or Express Service code which can be found on the underside of the Laptop PC. It may not be obvious that the problem is indeed with the laptop hardware. To check this, consult your laptop support pack (Setup and Quick Reference Guide) and run the support CD, following the supplied instructions. This will pinpoint a problem with the laptop hardware. If one is found, please contact Dell support for your territory. You supplied laptop is guaranteed next business day fix for the first 12 months. If there is still something unresolved, contact ETB (details at the end of this document). Screen lock up. If you are in the ‘region navigator’ and pressed publish, you will get a dialogue box asking you to press OK. If you don’t do this and mouse click anywhere on the screen, the dialogue box window goes, but you cannot do anything on the screen. Resolution: Move the mouse to the top bar on the window, left mouse click and hold which allows you to drag the window down toward the bottom of the screen. You Page 53 of 54 will see the dialogue box, just press OK. Now click on the maximise button on the previous window to return the window to the correct position. Plot or statistical table cut off in PDF file There are two issues that can cause one of these problems. Plot cut off: This happens if the paper size in the page set up within the Firefox browser has been changed. Default setting is A3 portrait. Statistical Table cut off: This occurs if your trial has two many gaits classified. All though you can have the maximum when working in Poseidon, only six will be printed out. If you see the slider bar appear when you are in the ‘Region Navigator’ you are likely not to get a printout of the gaits seven and eight. Page 54 of 54