1
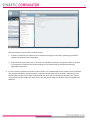
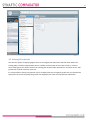
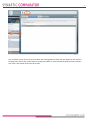
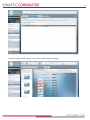
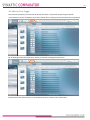
Version 1.0 2 Contents 1 Introduction ......................................................................................................................................................................... 3 2 Logging in to Illustrator ........................................................................................................................................................ 3 3 Illustrator ............................................................................................................................................................................. 5 3.1 Costs and Charges Calculator ....................................................................................................................................... 5 3.2 Projection Calculator .................................................................................................................................................... 8 3.3 Critical Yield Calculator ...............................................................................................................................................10 3.3.1 Critical Yield .............................................................................................................................................................12 3.3.2 Maturity Value .........................................................................................................................................................13 4 Open Illustrator ..................................................................................................................................................................14 4.1 Generic Fund ..............................................................................................................................................................14 4.2 Existing Plan details ....................................................................................................................................................16 4.3 Stakeholder Comparison ............................................................................................................................................19 4.4 Adviser Fees Toggle ....................................................................................................................................................20 4.5 Comparison Report.....................................................................................................................................................21 3 1 Introduction This user manual has been put together to guide you through accessing the Illustrator software. Illustrator is designed to give you the data needed to build a compliant switch process for investments and non-occupational pensions. 2 Logging in to Illustrator Illustrator is a completely online system and can be accessed from any device that has an internet connection. To use Illustrator you will need Microsoft Silverlight installed. If you don’t have Microsoft Silverlight installed or are not sure, please visit: http://www.microsoft.com/getsilverlight/ If you don’t have Silverlight installed, please install it, following the instructions provided. If Silverlight is already installed, and the version number is 3 or greater no further action is required. Illustrator is accessed via the Synaptic Software Limited website. Go to www.synaptic.co.uk and scroll down the screen until you find the ‘log in’ option. Click on Synaptic. 4 This will take you to the Synaptic suite login page as shown below. Input your username and password and click Sign in. If you don’t have the required software to be able to use Illustrator, once you try to log in a screen will appear to confirm which software will need to be installed for it to function. 5 3 Illustrator When you click on the Illustrator tab, there are 5 options, 4 are calculators and the other is a research tool. Click on Costs and Charges Calculator to start the research. 3.1 Costs and Charges Calculator The Costs and Charges Calculator enables you to take the values and projected figures for their clients existing plans issued by the relevant providers and recalculate them based upon you inputting any additional costs they believe should be taken into consideration together with the original figures on the provider projection. You can input a charge as a fixed cost or % and annotate the frequency it is charged. In order for the calculator to work you must supply the following; A value the existing plans figures are calculated from (Initial Value) A term the existing figures are over (years and months) A contribution profile, if there are any regular contributions in the existing figures At least one set of existing figures (growth rate and maturity value (projection rate) It is also possible to specify a projection rate that uses a negative growth rate. The calculation will also use this rate when calculating the additional costs. Once the calculator has these parameters it will calculate the existing figures RIY (reduction in yield) but should this figure be supplied by the existing provider you can overtype this calculated figure. If you do overtype the RIY then this field will be locked and any changes to the other figures will not affect the number supplied until you “unlock” the field. 6 Once you have input the existing figures you can go on to specify any extra costs you wish to include. For example if you wanted to include fund charges then you could specify them as shown below; You have the ability to define multiple charges both as a % or a fixed cost. A fixed cost should be entered as the amount per frequency, i.e. £10 monthly will take a £10 charge each month. % costs should be entered as the annual % cost, we will then apply the proportion due per frequency to equate to the annual % cost. 7 Once you are satisfied that you have entered everything you can press calculate and the calculator will work out what the maturity value would have been if the extra costs were taken into account for each of the projection rates supplied. You also have the ability to override the term entered by ticking the override term box, and entering a new term in the boxes underneath the Revised Projection term heading. 8 Once the calculation is complete you can print off a “quick report” that will contain all the inputs and outputs to be put on the client file. If you change any of the parameters after calculating they will need to press calculate again in order for the calculation to refresh. All figures produced are an approximation and are dependent on the accuracy of the inputs. For exact figures you would need to get the existing provider to recalculate their projected figures including the additional charges you have applied. 3.2 Projection Calculator The above enables you to calculate a maturity value where none currently exists. Enter the initial value, term and any existing contributions if applicable together with the growth rates you wish to use. For each growth rate you enter the calculator will return the “no charges” maturity value. 9 You can then enter a set of charges to calculate what the maturity value would be on an illustration from the provider. 10 3.3 Critical Yield Calculator This calculator has two functions, one being the reverse of the other. It is designed to calculate a growth rate or maturity value. It is possible to specify a projection rate (or multiple) that uses a negative growth rate. You must supply 3 points of reference for the calculation. So, 3 gross growth rates & 3 corresponding maturity values. You can then specify either; a target maturity value and the calculator will return a growth rate, or a target growth rate and the calculator will return a maturity value. 11 You will also be able to produce a report of inputs and results. The calculator estimates the equation of the line that connects the three reference points allowing you to find the values on any other point of that line e.g. If you supply the value for one of the question marks it will calculate the other for them. 12 3.3.1 Critical Yield This is designed to allow you to calculate the critical yield and hence hurdle rate that a new plan would have to achieve in order for the maturity value to be the same as the existing plan. The three rates you supply should be three different results from Illustrator for the new plan you intend to recommend. The target maturity value should be taken from the existing plans figures that you wish to compare against. Once you have input these you can press calculate and it will return the growth rate the new plan would need to grow at in order to get to the maturity value you are comparing against. For example; If the existing plan has a growth rate of 6% and maturity value of £27,000 and the results from Illustrator (for the plan you intend to recommend) are; 4% - £20,000 6% - £25,000 8% - £30,000 Then the calculator will return a growth rate of 6.89%. This is the critical yield the new plan would need to achieve and hence the hurdle rate is 6.89% minus 6% = 0.89%. Again you can produce a “quick report” which will contain the figures for the client file. 13 3.3.2 Maturity Value This is designed to allow you to calculate the maturity value if they supply a growth rate. It is possible to enter a target growth rate that is a negative. From the example above if 6.89% is used then the resulting maturity value is calculated as £27,014.08 (which would round down to £27,000) i.e. the maturity value we asked for when it calculated the 6.89% This feature can be used for single or multiple plans where you wish to compare different rates from different plans and align them together. I.e. you are researching two plans, one which has supplied figures at 4%, 6% & 8% and the other has used 5%, 7% & 9%. You can use this calculator to combine both plans figures (by turning the 4%, 6% & 8% to be 5%, 7% & 9% or vice versa) so that they can research switching both plans into one as well as looking at them individually. All figures produced are an approximation and are dependent on the accuracy of the inputs. This is especially apparent when the numbers used are supplied to 3 significant figures as the exact maturity value could be quite different which would in turn result in a different output. I.e. a maturity value displayed to 3 significant figures of £25,000 could in reality actually be any number up to £25,099.99. This means that the equation of the line between the points would be different and hence the output would also be different. Ideally, you would always supply exact figures but in reality this is not always possible so it may pay to run two calculations that cover the extremes i.e. in the above example, run the calculation with £20,099.99, £25,099.99 & £30,099.99 and maturity value of £27,000 again which results in a growth rate of 6.85% 14 This means that the critical yield could actually be somewhere between 6.85% and 6.89% making the hurdle rate between 0.85% & 0.89% 4 Open Illustrator When you click on “Open Illustrator” it will open and enable the functionality defined below. 4.1 Generic Fund When making fund selection you will be able to bypass the need for a portfolio and apply the same fund costs across all products. You will need to define the net initial and on-going costs of the fund & the growth rate the fund has. It is possible to specify a growth rate for the Generic Fund to be a negative. The projection will then use the figures supplied across all the products in the comparison. You will also need to select what type of fund they are representing (internal, external or ETF). Some providers have specific charges for different fund types and this will ensure the correct charges are applied to the projections. The use of the generic fund will not filter out any providers. 15 This functionality can be used in a number of ways: 1. It allows a comparison of product costs as all the fund charges are the same, assuming your adviser charges are identical across all products. 2. If data for a fund you wish to use is currently not available in Illustrator, the generic fund may be used as a substitute to represent this fund assuming you are familiar with all the associated charges applicable to that fund. 3. It can be used to represent a provider’s internal funds, only available within their product, which if selected as a portfolio would filter out all providers, except the internal funds of that provider. Assuming you can demonstrate that the costs of these internal funds that they wish to compare the data from are “similar” across those providers funds, they wish to use, then the generic fund can represent various provider fund solutions. 16 4.2 Existing Plan details You have the option of supplying figures from an existing pension plan which will then show where the existing plan is ranked compared with what is available in the market on the results screen. In order to enter some figures you need to click on the existing plan section under “Retirement” and then on the “add growth rate” button in the bar at the top. It is also possible to specify a projection rate (or multiple) that uses a negative growth rate, this will then be replayed in the results assuming the growth rate supplied is the same as the projection undertaken. 17 You can add as many rates as they have about the existing plan but these will only appear in the results if the projection rate for the results (either manually overridden or asset allocated by fund selection) matches one of the rates already entered in this section. 18 The existing plan will then appear in the results and be ranked accordingly. 19 4.3 Stakeholder Comparison In accordance with the FCA update (RU64), a generic stakeholder comparison is required to accompany all PP and SIPP retirement projections. This will return a generic Stakeholder in the results whenever a retirement product has been selected for comparison, using charges of 10yrs @ 1.5% p.a. then 1% p.a. thereafter. No other charges apply. The stakeholder will always appear at the top of the screen and not be ranked with the other results. The figures will follow through into the reports. 20 4.4 Adviser Fees Toggle This function will allow you to remove all adviser fees from a comparison by pressing one button. (The alternative to this would be to turn all the adviser fees in Setup to 0 and recalculate the comparison). By unchecking the box the comparison will be recalculate excluding all adviser fees. The purpose of this functionality is to easily demonstrate the effect of the adviser fees. 21 4.5 Comparison Report This function is to allow you to take a snapshot of a set of results. It is likely that you will be producing lots of different comparisons at different growth rates, different portfolios etc. This report will allow you to save a report for each of the comparisons they have made. The report will contain the top ten results and the stakeholder figures as well as all the input criteria. You can produce as many reports as required and all will be stored against the piece of research in the same way the final report is currently. This document is the property of Synaptic Software Limited and the information contained herein is confidential. This document, either in whole or in part, must not be reproduced or disclosed to others or used for purposes other than that for what it has been supplied, without prior permission from Synaptic Software Limited. September 2015