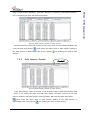
1
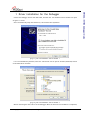
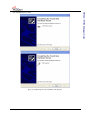
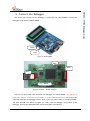
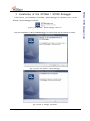
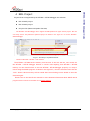
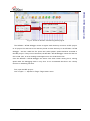
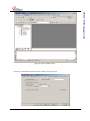
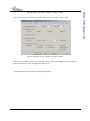
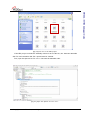
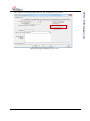
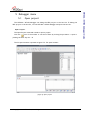
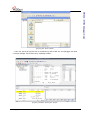
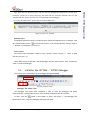
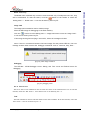
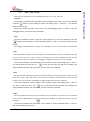
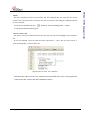
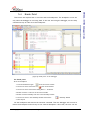
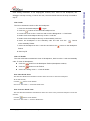
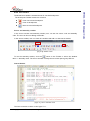
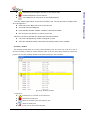
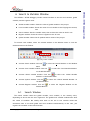
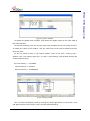
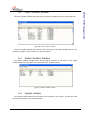
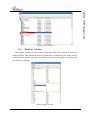
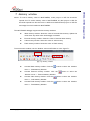
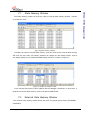
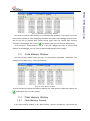
W7100A / W7100 Debugger Guide W7100A / W7100 Debugger Guide Version 1.1 © 2012 WIZnet Co., Inc. All Rights Reserved. For more information, visit our website at http://www.wiznet.co.kr © Copyright 2012 WIZnet Co., Inc. All rights reserved. Ver. 1.1 1 W7100A / W7100 Debugger Guide Table of Contents 1 Driver installation for the Debugger ................................................................ 3 2 Connect the Debugger................................................................................. 5 3 Installation of the W7100A / W7100 Debugger .................................................... 7 4 KEIL Project ............................................................................................. 8 5 Debugger menu ........................................................................................ 14 6 7 5.1 Open project ............................................................................... 14 5.2 Initialize the W7100A / W7100 Debugger ............................................. 16 5.3 Run and Stop ............................................................................... 18 5.4 Break Point ................................................................................. 20 Search & Variable Window ........................................................................... 24 6.1 Search Window ............................................................................ 24 6.2 Local Variable Window ................................................................... 26 6.3 Global Variable Window .................................................................. 26 6.4 Symbol window ............................................................................ 26 6.5 Register window ........................................................................... 27 Memory window ....................................................................................... 28 7.1 IData Memory Window .................................................................... 29 7.2 External Data Memory Window ......................................................... 29 7.3 Code Memory Window .................................................................... 30 7.4 Flash Memory Window .................................................................... 30 7.4.1 Code Memory Domain ........................................................... 30 7.4.2 Data Memory Domain ............................................................ 31 © Copyright 2012 WIZnet Co., Inc. All rights reserved. Ver. 1.1 2 W7100A / W7100 Debugger Guide 1 Driver installation for the Debugger Connect the Debugger and PC with USB cable, and then the ‘new hardware search window’ will open as figure 1.1 below. Select ‘Automatically setup the software (I)’ and click the Next (N) button. [Fig.1.1] The new hardware search window 1 If it is not automatically installed, select the ‘Install from a list or specific location (Advanced) and set our attached driver as below. [Fig.1.2] The new hardware search window 2 Wait for searching the device driver of the Debugger. When the device driver installation is completed, © Copyright 2012 WIZnet Co., Inc. All rights reserved. Ver. 1.1 3 W7100A / W7100 Debugger Guide click the END button to finish. [Fig.1.3] Completing the new hardware searching #2 © Copyright 2012 WIZnet Co., Inc. All rights reserved. Ver. 1.1 4 W7100A / W7100 Debugger Guide 2 Connect the Debugger This section will explain how the Debugger is connected with iMCU7100EVB. Connect the Debugger to the DTAG of IMCU7100EVB. DTAG Reset [Fig.2.2] iMCU7100EVB LED5 DTAG USB Reset Button [Fig.2.2] W7100A / W7100 Debugger Connect the other DTAG cable between the Debugger and iMCU7100EVB. The red line of DTAG cable must be connected to line number 1 of iMCU7100A DTAG socket. Also connect the USB cable between the Debugger and PC. Next, insert the power cable to the IMCU7100EVB, and push the EVB reset button as figure 2.1. Then, push the debugger reset button of the Debugger. Confirm the LED5 (RUN LED) after pushing these reset button. © Copyright 2012 WIZnet Co., Inc. All rights reserved. Ver. 1.1 5 W7100A / W7100 Debugger Guide If the Debugger successfully recognizes the W7100A / W7100, the LED5 (RUN LED) will turn on. But if the LED5 is not turned on, it means that W7100A / W7100 is not recognized. Check the connecting cable or try to reset the IMCU7100EVB and the Debugger. The LED5 should be turned on before using the W7100A / W7100 Debugger. © Copyright 2012 WIZnet Co., Inc. All rights reserved. Ver. 1.1 6 W7100A / W7100 Debugger Guide 3 Installation of the W7100A / W7100 Debugger In this section, the installation of W7100A / W7100 Debugger is explained. First, run the W7100A / W7100 Debugger install file. [Fig.3.1] The W7100A / W7100 Debugger install file Then the installation of iMCU7100EVB debugger is started. Push the Next button to setup. [Fig.3.2] Setup the W7100A / W7100 Debugger [Fig.3.3] End of debugger installation © Copyright 2012 WIZnet Co., Inc. All rights reserved. Ver. 1.1 7 W7100A / W7100 Debugger Guide 4 KEIL Project Projects that are supported by the W7100A / W7100 debugger are as below. Keil uVision2 project Keil uVision3 project Only hex file (Restricted symbol function) ※ The W7100A / W7100 Debugger don’t support the KEIL µVision4 or upper version project. But user can easily convert the µVision4 to µVision3 project as shown in the figure 4.1 to use the W7100A / W7100 debugger. <Fig.4.1> Save Project to µVision3 format ※ Caution on W7100A / W7100A Lock function The W7100A / W7100A has the memory lock function. If the lock was set, user cannot use the W7100A / W7100 debugger because it cannot read anything from W7100A / W7100A memory. So user should unlock to use the W7100A / W7100 debugger properly. It is easy to unlock using the WizISP program. As shown in the figure 4.2, clear the check box and click the “Lock” button. Whole memory will be erased after the unlocking so user should re-write the firmware again. Please refer to the Wiz ISP user manual for more detailed information about WizISP. WizISP program and user manual are available on the WIZnet website. © Copyright 2012 WIZnet Co., Inc. All rights reserved. Ver. 1.1 8 W7100A / W7100 Debugger Guide <Fig.4.2> Unlock the W7100A / W7100A using WizISP program The W7100A / W7100 debugger cannot recognize multi directory structure of KEIL project so all project file and source file must be placed in same directory to use W7100A / W7100 debugger. And the ‘make hex file’ option and ‘make symbol’ option should be activated in the KEIL project. If they are not activated, the W7100A / W7100 debugger cannot find the hex file to load. Also, an error message could appear even if it finds the hex file. Since the W7100A / W7100 debugger use slower clock than normal running clock, running speed under the debugging mode is very slow. So we recommend that don’t use a delay function or something like that. First, open the KEIL project. Click ‘Project’ => ‘Options for Target ‘Target name’ menu. © Copyright 2012 WIZnet Co., Inc. All rights reserved. Ver. 1.1 9 W7100A / W7100 Debugger Guide [Fig.4.3] Open the KEIL project Check the ‘Create HEX File’ option from the ‘Output’ tap as figure 4.2. © Copyright 2012 WIZnet Co., Inc. All rights reserved. Ver. 1.1 10 W7100A / W7100 Debugger Guide [Fig.4.4] Output tap of the ‘Options for Target’ window Select the ‘Listing’ tap and check the ‘Symbols’ option of the ‘C Compiler Listing’ region. [Fig.4.5] Listing tap of the ‘Options for Target’ window Also check the ‘Symbols’ option of the ‘Assembler Listing’ region. The ‘Assembler Listing’ is optional. Click the ‘OK’ button to finish, and compile the KEIL project. Confirm the HEX file in the project directory after compiling. © Copyright 2012 WIZnet Co., Inc. All rights reserved. Ver. 1.1 11 W7100A / W7100 Debugger Guide [Fig.4.6] Hex file of the KEIL project If the KEIL project includes the assembly code such as xxx.SRC file, the ‘Generate Assemble SRC File’ and ‘Assembler SRC File’ options must be checked. First, open the Options for File ‘xxx.c’ that uses the Assemble code. [Fig.4.7] Open the Options for File ‘xxx.c’ © Copyright 2012 WIZnet Co., Inc. All rights reserved. Ver. 1.1 12 W7100A / W7100 Debugger Guide Then, check the ‘Generate Assembler SRC File’ and ‘Assemble SRC File’ options. [Fig.4.8] Setting the Options for File ‘xxx.c’ © Copyright 2012 WIZnet Co., Inc. All rights reserved. Ver. 1.1 13 W7100A / W7100 Debugger Guide 5 Debugger menu 5.1 Open project The W7100A / W7100 debugger can debug the KEIL project or the hex file. To debug the KEIL project or the hex file, run the W7100A / W7100 debugger and open the hex file. Open Project. The Open Project command is used to open a project. Click the icon of the toolbar. It can also be done by clicking Project Menu => Open or pushing the short key Ctrl + O The file open browser is opened as figure 5.2 ‘File open browser.’ [Fig.5.3] Open project © Copyright 2012 WIZnet Co., Inc. All rights reserved. Ver. 1.1 14 W7100A / W7100 Debugger Guide [Fig.5.2] File open browser If the user opens the project that is consisted only with a HEX file, the Debugger will show a caution message. And it shows only ‘Assembly window’. [Fig.5.3] Complete opening the project © Copyright 2012 WIZnet Co., Inc. All rights reserved. Ver. 1.1 15 W7100A / W7100 Debugger Guide *Note: When the user open the project and have the error message like shown below, the user must delete the xxx.SRC file in project directory, and check both the ‘Generate Assembler SRC File’ and ‘Assemble SRC File’ options to avoid error on the W7100A / W7100 debugger. For a more detailed solution, please refer to section4 ‘KEIL Project’. [Fig.5.4] Open error message Reload project The Reload command is used to reload a project. When the loaded project is changed, click the reload toolbar button to reload the project. It can also be done by clicking ‘Project’ => ‘Reload’ or pushing the short key F4. Close project The Close project command is used to close a project. Select ‘Project’ => ‘Close’ or push the short key Ctrl + Q. *Note: While using the W7100A / W7100 debugger, the user must use the ‘stop’ command in order to close the debugger. 5.2 Initialize the W7100A / W7100 Debugger This section is for initialization of the debugger and iMCU7100EVB [Fig.5.5] Initialize menu Debugger and board reset The Debugger and board reset command is used to reset the debugger and board simultaneously. If breakpoints were set, all initialized breakpoints will be removed. To reset, click the button on the toolbar, or select ‘Tool menu’ => ‘Init Debugger and Board reset’ menu. Then the Debugger and board will reset. © Copyright 2012 WIZnet Co., Inc. All rights reserved. Ver. 1.1 16 W7100A / W7100 Debugger Guide Board reset only The Board reset command only is used to reset the board only. If breakpoints were set, they will be maintained. To reset the board, click the button of the toolbar or select the ‘Debug menu’ => ‘Board reset’. It can also be done by short key F2. Image load The Image load command is used to load an image. Write the HEX image for debugging to the Flash memory. Click the button or select Debug menu => Image Load menu to execute ‘Image Load.’ It can also be done by short key F3. If the image writing and verifying is successful, ‘Write OK’ message will show. Note: If there is a mismatch between the board image file and present HEX file, the error message is shown when execute the ‘Debugger commands’ such as ‘Continue, Step, Next’. [Fig.5.6] Load image mismatch Debugging The W7100A / W7100 Debugger serves ‘Debug’ and ‘Tool’ menu and Toolbar button for debugging. [Fig.5.7] Deugging menu Go to Source Line The Go to Source Line command is used to move the cursor to the wanted source line. To use this function, select the ‘Tool’ menu => ‘Go to Source Line’ or use short key Ctrl + G. Find The Find command is used to find some words on the source window. To use this function, select the ‘Tool’ menu => ‘Find’ or use short key Ctrl + F. © Copyright 2012 WIZnet Co., Inc. All rights reserved. Ver. 1.1 17 Run and Stop W7100A / W7100 Debugger Guide 5.3 This section will explain how to use commands like step in, out, next, and more Continue The Continue command runs the program until the Break point is met. To use this command, click the button on the toolbar or select the Debug menu => Continue. It can also be done by short key F5. During the Continuing state, user cannot use the debugging menu. In order to use the debugging menu, execute the Stop command. Stop The Stop command is used to stop the running program. To use this command, click the button on the toolbar or select the Debug menu => Stop. It can also be done by short key F6. The debugging commands (Search, memory view, break point, etc.) are executed only in the Stop state. Step The step command is used to run only one specific line among all lines. The Step command is executed in units of one line of the C code. If there is a Function call, the Step command will enter into the related Function. After the execution, the debugger is stopped and waits for the next command. To use this command, click the button on the toolbar or select the Debug menu => Step. It can also be done by short key F11. If the user has only the HEX file to debug, the Step command executes one instruction, just like the Stepi command. Next The Next command is basically the same as the Step command. The Next command is executed in units of one line of the C code. But if there is a Function call, the Next command does not enter into the Function. After the execution, the debugger is stopped and waits for the next command. To use this command, click the button on the toolbar or select the Debug menu => Next. It can also be done by short key F10. If the user has only the HEX file to debug, the Step command executes one instruction, just like the Nexti command. Stepi The Stepi command executes only one instruction. If the instruction is a Function call, the command enters into the related Function. After the execution, the debugger is stopped and waits for the next command. To use this command click the button on the toolbar or select the Debug menu => Stepi. It can also be done by short key F7. © Copyright 2012 WIZnet Co., Inc. All rights reserved. Ver. 1.1 18 W7100A / W7100 Debugger Guide Nexti The Nexti command executes one instruction. But the command does not enter into the related Function even if the instruction is a Function call. After its execution, the debugger is stopped and waits for next command. To use this command click the button or select the Debug menu => Nexti. It can also be done by short key F6. Run to cursor line The ‘Run to cursor line’ command executes the code until the cursor on the debugger source window is met. To use this command, select the push the mouse right button => select ‘Run To Cursor Line(n)’ or select the Debug Menu => Run To Cursor Line. [Fig.5.8] Run To Cursor Line command Sometimes the ‘Run To Cursor Line’ command continues when the cursor is not properly set. If that is the case, execute the Stop command to stop it. © Copyright 2012 WIZnet Co., Inc. All rights reserved. Ver. 1.1 19 W7100A / W7100 Debugger Guide 5.4 Break Point This section will explain how to set/clear and find breakpoints. The breakpoint can be set only when the debugger is not being used. If the user was using the debugger, use the Stop command to stop in order to set the breakpoint. [Fig.5.9] Break point of the debugger Set break point To set the breakpoint 1. Click the shadowed region 2. Locate the cursor and click the aside of the source window button on the Toolbar 3. Locate the cursor and click the Debug Menu => ‘Set Break’ 4. Double click the C code line in the source window 5. Double click the Assembly code line in the Assembly window 6. Locate the cursor in the Assembly window and click the on the Assembly Toolbar 7. Short key F9 Set the breakpoint and execute the Continue command. Then the debugger will run until it meets the breakpoint and will stop at the checked breakpoint. After that, the user can use © Copyright 2012 WIZnet Co., Inc. All rights reserved. Ver. 1.1 20 W7100A / W7100 Debugger Guide other Debug commands. If the PC(program counter) can’t move to the breakpoint, the debugger will keep running. If that is the case, the user should execute the Stop command to stop it. Clear Break The Clear command is used to clear the breakpoint. 1. Click the checked breakpoint 2. Click the region button on the selected breakpoint line 3. Locate the cursor at the C code line and click the Debug Menu => Clear Break 4. Double click the breakpoint directly on the C code line 5. Double click the breakpoint directly on the Assembly code line 6. Select the breakpoint on the Assembly code line and click the button on the Assembly Toolbar 7. Select the breakpoint on the C code line and select the button on the Breakpoint Toolbar 8. Short key F9 Clear All Breaks The clear all breaks command will clear all breakpoints, both from the C code and Assembly code. To clear all breakpoints, Click the button on the Breakpoint Toolbar (Breakpoint window) Click the button on the Toolbar Select the ‘Debug’ menu => ‘Clear All Breaks’ Goto Next Break Point The Goto Next Break Point Command is used to move the cursor to the next break point. To use this function, Click the button on the Toolbar Select the ‘Tool’ menu => ‘Goto Next Break Point’ Goto Previous Break Point The Goto Previous Break Point command will move the cursor to the previous break point. To use this function, Click the button on the Toolbar Select the ‘Tool’ menu => ‘Goto Pre Break Point’ © Copyright 2012 WIZnet Co., Inc. All rights reserved. Ver. 1.1 21 W7100A / W7100 Debugger Guide Break Point Window The Break Point Window command shows all checked breakpoints. The break point Toolbar buttons are as below. : Clear the selected breakpoint : Clear all breakpoints : Move to selected breakpoint Source and Assembly window In the Source window and Assembly window, user can see the source code and assembly code. The user can also use Debug commands. In the source window, user can check all variables and add it to the search window. [Fig.5.10] Window menu To use the Assembly window, click the button on the Toolbar or select the Window Menu => Assembly menu. The Source window is always shown unless opening only HEX file. Source Window [Fig.5.11] Source Window menu The Source window is shown in the figure 5.11. © Copyright 2012 WIZnet Co., Inc. All rights reserved. Ver. 1.1 22 : indicates the PC (Program Counter) in the source code : means Breakpoint is set on this line : the breakpoint can only be set on this shadowed line W7100A / W7100 Debugger Guide Click the mouse right button in the Source window, user can see the Source window menu as in the figure5.11. Goto source line: Move the cursor to the set line Set break: Set the breakpoint Insert Variable window: Add the variable to the Search window Run To Cursor Line: Run the C code to cursor line Moreover, the Source window can assist some functions as below. Can set the breakpoint by double clicking the C code. Show the indicated variable value when the mouse pointer on the variable. Assembly window The assembly window shows the currently running assembly code. Also if the user clicks the C code at the source window, it shows the related assembly codes. If the user opens only the HEX file without Keil project files, only the assembly window will be shown without the source window. [Fig.5.12] Assembly window In figure5.12, : Indicates the PC’s location of the instruction : Indicates the break point : Shows the assemble code with related C code : Shows the break point double click: Sets or unsets the break point © Copyright 2012 WIZnet Co., Inc. All rights reserved. Ver. 1.1 23 W7100A / W7100 Debugger Guide 6 Search & Variable Window The W7100A / W7100 debugger provides various windows to see the local variable, global variable, and the register value. Global variable window: Shows the value of global variable in the project Local variable window: Shows the value of local variable at the PC(program counter) now Search window: Puts the variable name, then it shows the value at the PC now Register window: Shows the value of registers at the PC now Symbol window: Shows the all symbols and its values of the project To activate each window, select the related window on the Window menu or click the window button on the Toolbar. [Fig.5.13] Search window Activate Search window: Click the or select the ‘Search Window’ on the Window Menu Activate Local variable window: Click the or select the ‘Local Variable Window’ on the Window Menu Activate Global variable window: Click the or select the ‘Global Variable Window’ on the Window Menu Activate Symbol window: Click the or select the ‘Global Variable Window’ on the Window Menu Activate Register window: Click the or select the ‘Register Window’ on the Window Menu 6.1 Search Window The search window shows the global variable, local variable, or the memory value, depending on which ones the user registered. The global/local variable windows also show the values of variables. But usually users want to see one or two variable values and sometimes want to see both global and local variables simultaneously. In this case, just register the variables on the search window. © Copyright 2012 WIZnet Co., Inc. All rights reserved. Ver. 1.1 24 W7100A / W7100 Debugger Guide [Fig.5.14] Search windows To register the global/local variables, write down the register name on the name field of the search window. On the search window, user can not only confirm the variable but also can modify its value. To modify the value of the variable, click the value field on the search window and write down the value. To see the memory value on the search window, write in the form, ‘memory type : address : size.’ The memory types are C, D, and X. (code memory, internal data memory and external data memory). Ex) Code memory => C:0x1000:5 Internal memory => D:0x30:2 External memory => E:0x000300:4 [Fig.6.1] Display format User can select the display format by clicking the mouse right button on the search, local and global window such as binary, octal, decimal and hexadecimal. © Copyright 2012 WIZnet Co., Inc. All rights reserved. Ver. 1.1 25 Local Variable Window W7100A / W7100 Debugger Guide 6.2 The local variable window shows the value of the local variable in the PC located function. [Fig.6.2] Local variable window The local variable window has almost the same interface as the search window. But it is not allowed to register a new variable or a memory address. 6.3 Global Variable Window The global variable window shows all the global variables in the project. The global variable window has the same interface as the local variable window. [Fig.6.3] Global variable window 6.4 Symbol window The symbol window shows the information of all symbols in the project. It shows the class type and the address of the related symbol. © Copyright 2012 WIZnet Co., Inc. All rights reserved. Ver. 1.1 26 W7100A / W7100 Debugger Guide [Fig.6.4] Symbol window 6.5 Register window In the register window, user can check or modify the value of the register. It shows the default registers, PSW, and special function register (SFR). To modify the value of the register, click the field of register value and write the new value. But if the register is read only, then the value is not changed. [Fig.6.5] Register window © Copyright 2012 WIZnet Co., Inc. All rights reserved. Ver. 1.1 27 W7100A / W7100 Debugger Guide 7 Memory window Notice: To read a memory value of iMCU7100EVB, a Keil project or HEX file should be opened first. To read a memory value of iMCU7100EVB, any Keil project or HEX file should be opened first. But there are no differences between Keil project or HEX file and image file which loaded to iMCU7100EVB. The iMCU7100API debugger supports below memory windows. IData memory window: Shows the value of internal data memory. Update the value when stop state after the debugger command External memory window: Shows the value of external data memory Code memory window: Shows the value of code memory Flash memory window: Shows the value of flash memory To activate each window, use the ‘Window’ menu and Toolbar as in the figure7.1. [Fig.7.1] Memory window Activate IData memory window: Click the button or select the ‘Window’ menu => ‘IData Memory Window’ Activate External memory window: Click the button or select the ‘Window’ menu => ‘External Memory Window’ Activate Code memory window: Click the button or select the ‘Window’ menu => ‘Code Memory Window’ Activate Flash memory window: Click the button or select the ‘Window’ menu => ‘Flash Memory Window’ © Copyright 2012 WIZnet Co., Inc. All rights reserved. Ver. 1.1 28 W7100A / W7100 Debugger Guide 7.1 IData Memory Window The IData memory window can show the value of internal data memory (D:0x00 ~ D:0xFF) or modify the value. [Fig.7.2] IData Memory window To modify the value of internal data memory, click the value field of internal data memory and write the new value. All memory windows can change into the display format, such as 2/4/8 byte display unit or CHAR/INT/LONG display format. It is shown in figure7.3. [Fig.7.3] Change the display format If the internal data memory value updates and the debugger command is in stop state, it updates the internal data memory value to the iMCU7100API board. 7.2 External Data Memory Window The external data memory window shows the value of external data memory (X:0x000000 ~ X:0xFFFFFF). © Copyright 2012 WIZnet Co., Inc. All rights reserved. Ver. 1.1 29 W7100A / W7100 Debugger Guide [Fig.7.4] External Data memory window The value of external data memory is not automatically updated. If the value of external data memory updates on each debugging command, the speed of the debugger may be slower due to the size of external data memory being larger than the internal data memory. Therefore, the debugger has a button for updating the value of external data memory. As in section7.1 ‘IData Memory Window,’ if the user changes the value of external data memory in the debugger, the real value of iMCU7100API board will also change. 7.3 Code Memory Window The code memory window shows the value of code memory (0xFF0000 ~ 0xFFFFFF). This window is for reading only, it cannot be modified. [Fig.7.5] Code Memory window As in the section7.2 External Data Memory Window, the code memory window has a button for updating the value of code memory. 7.4 7.4.1 Flash Memory Window Code Memory Domain In the flash memory window, if the ‘Data memory’ option is unchecked, it will shows the © Copyright 2012 WIZnet Co., Inc. All rights reserved. Ver. 1.1 30 W7100A / W7100 Debugger Guide value of code memory (0xFF0000 ~ 0xFFFFFF). Basically it is same the ‘Code Memory Window’ but it can modify the value with flash write button. [Fig.7.6] Flash memory window for code memory The basic interface of the flash memory window is the same as other memory windows. But it has the flash write button which writes the whole value of flash memory window to the flash memory of iMCU7100API. Also it has a button for updating the value of flash memory. 7.4.2 Data Memory Domain Checked!! [Fig.7.6] Flash memory window for data memory If the ‘Data memory’ option is checked, it will shows the value of flash data memory (0x00 ~ 0xFF). It can modify the value with flash write button. The basic interface of the flash memory window is the same as other memory windows. But it has the flash write button which writes the whole value of flash memory window to the flash memory of iMCU7100API. Also it has a button for updating the value of flash memory. © Copyright 2012 WIZnet Co., Inc. All rights reserved. Ver. 1.1 31 W7100A / W7100 Debugger Guide Document History Information Version Date Descriptions Ver. 0.9 βeta 2009. 8. 13 Release with W7100 launching Ver. 0.91 2009. 12 Modify section2 “Connect the debugger”. Add about debugger reset button. Ver. 1.0 2011. 6 Release with W7100A lunching Ver. 1.1 Jun, 2012 Fixed some awkward expressions of English documents Copyright Notice Copyright 2012 WIZnet, Inc. All Rights Reserved. Technical Support: [email protected] Sales & Distribution: [email protected] For more information, visit our website at http://www.wiznet.co.kr © Copyright 2012 WIZnet Co., Inc. All rights reserved. Ver. 1.1 32