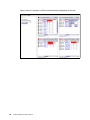
1
Redpaper Ian MacQuarrie David Lutz Jon Tate Fabric Resiliency Best Practices In this IBM® Redpaper™ publication, we describe best practices for deploying and using advanced Brocade Fabric OS (FOS) features to identify, monitor, and protect Fibre Channel (FC) SANs from problematic device and media behavior. Fabric Operating System: This paper covers the FOS command options from version 6.4 to version 7.1. If you are using a code level higher than this, the guidance and strategy provided by the paper is still applicable. However, you might find additional options available that allow even greater granularity in establishing specific alerting features. Introduction Faulty or improperly configured devices, misbehaving hosts, and faulty or substandard FC media can significantly impact the performance of FC fabrics and the applications they support. In most real-world scenarios, these issues cannot be corrected or completely mitigated within the fabric itself. Instead, the behavior must be addressed directly. However, with the proper knowledge and capabilities, the fabric can often identify and, in some cases, mitigate or protect against the effects of these misbehaving components to provide better fabric resiliency. This document provides a high-level description of the most commonly experienced, detrimental device and link behaviors, and explains how to use features in recent levels of FOS to protect your data center. In FOS 6.1, Brocade introduced Port Fencing as part of the optional Fabric Watch offering. In FOS 6.3, Brocade added a new set of base features referred to as Bottleneck Detection. This was extended in FOS 6.4 with broader monitoring, improved configuration, and detection capabilities for additional types of bottlenecks. For further details about the features described in this publication, reference the following product documents appropriate for your FOS release that are available with registration at http://my.brocade.com/wps/portal/registration: Fabric OS Administrator’s Guide Fabric OS Command Reference Manual Fabric Watch Administrator’s Guide © Copyright IBM Corp. 2011, 2012, 2014. All rights reserved. ibm.com/redbooks 1 Brocade Network Advisor SAN User Manual Bottleneck Detection Best Practices Guide It is assumed that you are familiar with the basic functionality of features, such as bottleneck detection, fabric watch, and port fencing. Factors affecting fabric resiliency There are several common types of abnormal behavior originating from fabric components or attached devices: Faulty media (fiber-optic cables and Small Form-Factor Pluggables [SFPs]/optics): Faulty media can cause frame loss due to excessive cyclic redundancy check (CRC) errors, invalid transmission words, and other conditions. This can result in I/O failure and application performance degradation. Misbehaving devices, links, or switches: Occasionally, a condition arises where a device (server or storage array) or link (inter-switch link, or ISL) behaves erratically and causes disruptions in the fabric. If not immediately addressed, this may result in severe stress on the fabric. Congestion: This is caused by latencies or insufficient link bandwidth. End devices that do not respond as quickly as expected can cause the fabric to hold frames for excessive periods of time. This can result in application performance degradation or, in extreme cases, I/O failure. Faulty media In addition to high-latency devices causing disruptions to data centers, fabric problems are often the result of faulty media. Faulty media can include bad cables, SFPs, extension equipment, receptacles, patch panels, improper connections, and so on. Media can fault on any port type (E_Port or F_Port) and fail, often unpredictably and intermittently, making it even harder to diagnose. Faulty media involving F_Ports results in an impact to the end device attached to the F_Port and to devices communicating with this device. Failures on E_Ports can have an even greater impact. Many flows (host and target pairs) can simultaneously traverse a single E_Port. In large fabrics, this can be hundreds or thousands of flows. In the event of a media failure involving one of these links, it is possible to disrupt some or all of the flows using the path. Severe cases of faulty media, such as a disconnected cable, can result in a complete failure of the media, which effectively brings a port offline. This is typically easy to detect and identify. When this occurs on an F_Port, the impact is specific to flows involving the F_Port. E_Ports are typically redundant, so severe failures on E_Ports typically only result in a minor drop in bandwidth because the fabric automatically uses redundant paths. Also, error reporting built into FOS readily identifies the failed link and port, allowing for simple corrective action and repair. With moderate cases of faulty media, failures occur but the port can remain online or transition between online and offline. This can cause repeated errors, which can occur indefinitely or until the media fails completely. When these types of failures occur on E_Ports, the result can be devastating because there can be repeated errors that impact many flows. 2 Fabric Resiliency Best Practices This can result in significant impacts to applications that last for prolonged durations. Signatures of these types of failures include: CRC errors on frames Invalid Transfer Words (includes encoder out errors) State Changes (ports going offline or online repeatedly) Credit loss (complete loss of credit on a virtual channel (VC) on an E_Port prevents traffic from flowing on that VC, resulting in frame loss and I/O failures for devices using the VC) Misbehaving devices Another common class of abnormal behavior originates from high-latency end devices (host or storage). A high-latency end device is one that does not respond as quickly as expected and thus causes the fabric to hold frames for excessive periods of time. This can result in application performance degradation or, in extreme cases, I/O failure. Common examples of moderate device latency include disk arrays that are overloaded and hosts that cannot process data as fast as requested. Misbehaving hosts, for example, become more common as hardware ages. Bad host behavior is usually caused by defective host bus adapter (HBA) hardware, bugs in the HBA firmware, and problems with HBA drivers. Storage ports can produce the same symptoms due to defective interface hardware or firmware issues. Some arrays deliberately reset their fabric ports, if they are not receiving host responses within their specified timeout periods. Severe latencies are caused by badly misbehaving devices that stop receiving, accepting, or acknowledging frames for excessive periods of time. However, with the proper knowledge and capabilities, the fabric can often identify and, in some cases, mitigate or protect against the effects of these misbehaving components to provide better fabric resiliency. Congestion Congestion occurs when the traffic being carried on a link exceeds its capacity. Sources of congestion could be links, hosts, or storage responding more slowly than expected. Congestion is typically due to either fabric latencies or insufficient link bandwidth capacity. As Fibre Channel link bandwidth has increased from one to 16 Gbps, instances of insufficient link bandwidth capacities have radically decreased. Latencies, particularly device latencies, are the major source of congestion in today’s fabrics, due to their inability to promptly return buffer credits to the switch. Device-based latencies A device experiencing latency responds more slowly than expected. The device does not return buffer credits (through R_RDY primitives) to the transmitting switch fast enough to support the offered load, even though the offered load is less than the maximum physical capacity of the link connected to the device. Fabric Resiliency Best Practices 3 Figure 1 illustrates the condition where a buffer backup on ingress port 6 on B1 causes congestion upstream on S1, port 3. When all available credits are exhausted, the switch port connected to the device needs to hold additional outbound frames until a buffer credit is returned by the device. S2 S1 P2 Capacity: 8 Gbps Throughput: 1 Gbps Wants to do: 8 Gbps P4 B1 P1 Capacity: 8 Gbps Throughput: 1 Gbps Wants to do: 8 Gbps ? P3 P6 Figure 1 Device latency example When a device does not respond in a timely fashion, the transmitting switch is forced to hold frames for longer periods of time, resulting in high buffer occupancy. This in turn results in the switch lowering the rate at which it returns buffer credits to other transmitting switches. This effect propagates through switches (and potentially multiple switches, when devices attempt to send frames to devices that are attached to the switch with the high-latency device) and ultimately affects the fabric. Figure 2 shows how latency on a switch can propagate through the fabric. Hosts Hosts 4. All servers using ISL impacted ed 2. Backfbw of credit exhaustion depleting credits on ISL port on Switch A B 3. Continuing backflow of credit exhaustion to ISL port on Switch B x x B x A A 1. Buffer credits exhausted Storage arrays x Storage arrays x 5. Connection on to second storage orage device now w at risk Figure 2 Latency on a switch can propagate through the fabric Note: The impact to the fabric (and other traffic flows) varies based on the severity of the latency exhibited by the device. The longer the delay caused by the device in returning credits to the switch, the more severe the problem. Moderate device latencies Moderate device latencies from the fabric perspective are defined as those not severe enough to cause frame loss. If the time between successive credit returns by the device is between a few hundred microseconds to tens of milliseconds, the device exhibits mild to moderate latencies, since this delay is typically not enough to cause frame loss. This does 4 Fabric Resiliency Best Practices cause a drop in application performance but typically does not cause frame drops or I/O failures. The effect of moderate device latencies on host applications may still be profound, based on the average disk service times expected by the application. Mission-critical applications that expect average disk service times of, for instance, 10 ms, are severely affected by storage latencies in excess of the expected service times. Moderate device latencies have traditionally been very difficult to detect in the fabric. Advanced monitoring capabilities implemented in Brocade ASICs and FOS have made these moderate device latencies much easier to detect by providing the following information and alerts: Switches in the fabric generate Bottleneck Detection Alerts if Bottleneck Detection is activated on the affected ports Elevated tim_txcrd_z (see note box) counts on the affected F_Port; that is, the F_Port where the affected device is connected Potentially elevated tim_txcrd_z counts on all E_Ports carrying the flows to and from the affected F_Port/ device Note: tim_txcrd_z is defined as the number of times that the port was polled and that the port was unable to transmit frames because the transmit Buffer-to-Buffer Credit (BBC) was zero. The purpose of this statistic is to detect congestion or a device affected by latency. This parameter is sampled at intervals of 2.5 microseconds, and the counter is incremented if the condition is true. Each sample represents 2.5 microseconds of time with zero Tx BBC. “tim_txcrd_z” counts are not an absolute indication of significant congestion or latencies and are just one of the factors in determining if real latencies or fabric congestion are present. Some level of congestion is to be expected in a large production fabric and is reflected in tx_crd_z counts. The Brocade FOS Bottleneck Detection capability was introduced to remove the uncertainty around identifying congestion in a fabric. Severe device latencies Severe device latencies result in frame loss, which triggers the host Small Computer System Interface (SCSI) stack to detect failures and to retry I/Os. This process can take tens of seconds (possibly as long as 30 to 60 seconds), which can cause a very noticeable application delay and potentially results in application errors. If the time between successive credit returns by the device is in excess of 100 ms, the device is exhibiting severe latency. When a device exhibits severe latency, the switch is forced to hold frames for excessively long periods of time (on the order of hundreds of milliseconds). When this time becomes greater than the established timeout threshold, the switch drops the frame (per Fibre Channel standards). Frame loss in switches is also known as C3 discards or timeouts. Since the effect of device latencies often spreads through the fabric, frames can be dropped due to timeouts, not just on the F_Port to which the misbehaving device is connected, but also on E_Ports carrying traffic to the F_Port. Dropped frames typically cause I/O errors that result in a host retry, which can result in significant decreases in application performance. The implications of this behavior are compounded and exacerbated by the fact that frame drops on the affected F_Port (device) result not only in I/O failures to the misbehaving device (which are expected), but also on E_Ports, which may cause I/O failures for unrelated traffic flows involving other hosts (and typically are not expected). Latencies on ISLs Latencies on ISLs are usually the result of back pressure from latencies elsewhere in the fabric. The cumulative effect of many individual device latencies can result in slowing the link. The link itself might be producing latencies, if it is a long-distance link with distance delays or Fabric Resiliency Best Practices 5 there are too many flows using the same ISL. Whereas each device may not appear to be a problem, the presence of too many flows with some level of latency across a single ISL or trunked ISL may become a problem. Latency on an ISL can ripple through other switches in the fabric and affect unrelated flows. FOS can provide alerts and information indicating possible ISL latencies in the fabric, through one or more of the following items: Switches in the fabric generate Bottleneck Detection Alerts, if Bottleneck Detection is activated on the affected ports C3 transmit discards (er_tx_c3_timeout) on the device E_Port or EX_Port carrying the flows to and from the affected F_Port or device Brocade Fabric Watch alerts, if they are configured for C3 timeouts Elevated tim_txcrd_z counts on the affected E_Port, which also may indicate congestion C3 receive discards (er_rx_c3_timeout) on E_Ports in the fabric containing flows of a high-latency F_Port Credit loss Buffer credits are an integral part of the Fibre Channel flow control and the mechanism Fibre Channel connections used to track the number of frames sent to the receiving port. Every time a frame is sent the credit count is reduced by one. When the sending port runs out of credits, it is not allowed to send any more frames to the receiving port. When the receiving port successfully receives a frame, it tells the sending port that it has the frame by returning an r_rdy primitive. When the sending port receives an r_rdy, it will increment the credit count. Credit loss occurs when either the receiving port does not recognize a frame (usually due to bit errors), so it doesn't return an r_rdy, or the sending port doesn't recognize the r_rdy (usually due to link synchronization issues). Fibre Channel links are never perfect so the occasional credit loss can occur but it only becomes an issue when all available credits are lost. Credit loss can occur on both external and internal Fibre Channel links. When credit loss occurs on external links, it is usually caused by faulty media, whereas credit lost on internal ports is usually associated with jitter, which in most cases is adjusted for by the internal adapter firmware. The switch will automatically try and recover from a complete loss of credit on external links after 2 seconds by issuing a link reset. For the switch to perform automatic recovery from internal link credit loss, the bottleneck credit tool must be enabled. Designing resiliency into the fabric These are options to be considered to ensure that the fabric is resilient by design. Forward error correction Forward error correction (FEC) provides a data transmission error control method by including redundant data (error-correcting code) to ensure error-free transmission on a specified port or port range. When FEC is enabled, it can correct one burst of up to 11-bit errors in every 2112-bit transmission, whether the error is in a frame or a primitive. FEC is enabled by default, and is supported on E_Ports on 16 Gbps-capable switches and on the N_Ports and F_Ports of an access gateway using RDY, Normal (R_RDY), or Virtual Channel (VC_RDY) flow control modes. It enables automatically when negotiation with a switch detects FEC capability. This feature is enabled by default and persists after driver reloads and system reboots. It functions with features such as QoS, trunking, and BB_Credit recovery. 6 Fabric Resiliency Best Practices Limitations The following limitations apply to this feature: FEC is configurable only on Gen 5 16 Gbps-capable switches. FEC is supported only on 1860 and 1867 Brocade Fabric Adapter ports operating in HBA mode connected to 16 Gbps Gen 5 switches running Fabric OS 7.1 and later. FEC is not supported: When HBA port speed changes to less than 16 Gbps this feature is disabled. For HBA ports operating in loop mode or in direct-attach configurations. On ports with dense wavelength division multiplexing (DWDM). ClearLink Diagnostics Brocade ClearLink Diagnostics, a patent-pending technology, leverages the unique Brocade Diagnostic Port (D_Port) mode to ensure optical and signal integrity for Gen 5 Fibre Channel optics and cables, simplifying deployment and support of high performance fabrics. By pro-actively verifying the integrity of critical transceivers, organizations can quickly address any physical layer issues without the need for special optical testers. ClearLink Diagnostics allows users to automate a battery of tests to measure and validate latency and distance across the switch links, as well as verify the integrity of the fiber and 16 Gbps transceivers in the fabric either prior to deployment or when there are suspected physical layer issues. With ClearLink Diagnostics, only the ports attached to the link being tested need to go offline, leaving the rest of the ports to operate online. Example 1 is an example about how to run the D_Port command. This is a pre-production or troubleshooting command so you configure D_Port, run the D_Port test, check the results, and then disable D_Port. Example 1 shows how to configure a single port as a D_Port. Example 1 Configure single port switch:admin> portdisable 42 switch:admin> portcfgdport --enable 42 switch:admin> portenable 42 You must repeat the preceding step to configure the port at the other end of the link for D_Port. After both ends of the link are configured as D_Ports, to initiate the D_Port test on a single port (42), follow Example 2. Example 2 Start D_Port test switch:admin> portdporttest --start 42 To display the runtime status for a single D_Port while the test is in progress, follow Example 3. Example 3 Displaying runtime status switch:admin> portdporttest --show 42 D-Port Information: =================== Port: 42 Remote WWNN: 10:00:00:05:33:13:2f:b4 Fabric Resiliency Best Practices 7 Remote port: 26 Mode: Automatic Start time: Wed Feb 2 01:41:35 2011 End time: Wed Feb 2 01:43:23 2011 Status: PASSED ============================================================ Test Start time Result EST(secs) Comments ============================================================ Electrical loopback 01:42:12 PASSED ---------Optical loopback 01:43:10 PASSED ---------Link traffic test 01:43:17 PASSED ---------============================================================ Roundtrip link latency: 1108 nano-seconds Estimated cable distance: 20 meters To display D_Port summary information, follow Example 4. Example 4 Displaying D_Port summary information switch:admin> portdporttest --show all 42 Port State SFP Capabilities Test Result ============================================= 24 ONLINE E,O PASSED 26 ONLINE E,O RESPONDER 33 OFFLINE --RESPONDER To clear the D_Port configuration, follow Example 5. Example 5 Clearing D_Port configuration switch:admin> portdisable 42 switch:admin> portcfgdport --disable 42 switch:admin> portenable 42 Inter-switch link trunking Trunking optimizes the use of bandwidth by allowing a group of links to merge into a single logical link, called a trunk group. Traffic is distributed dynamically and in order over this trunk group, achieving greater performance with fewer links. Within the trunk group, multiple physical ports appear as a single port, thus simplifying management. Trunking improves system reliability by maintaining in-order delivery of data and avoiding I/O retries if one link within the trunk group fails. Trunking provides excellent protection from credit lost on inter-switch links. If credit loss occurs on an inter-switch link, frames will continue to flow using the other link until the switch can detect the credit loss (typically 2 seconds) and perform a link reset to recover the credits. In environments where a large number of flows are required between switches, it is better to create several two-link trunks than one large trunk with multiple links. For example, it is better to have two 2-link trunk groups than one 4-link trunk group. Note: A flow is a logical path from Initiator (server) to Target (storage). 8 Fabric Resiliency Best Practices Maintaining an optimal FC SAN environment Although there are many features available in FOS to assist you with monitoring, protecting, and troubleshooting fabrics, several recent enhancements have been implemented that deal exclusively with this area. This section focuses specifically on those newer features and related capabilities that help provide optimum fabric resiliency. Most of those features and capabilities are available and supported on the majority of 4 Gbps, 8 Gbps, and 16 Gbps platforms, provided that the most recent FOS releases are used. Some features might require optional licensing. This section discusses these features, minimum release levels, licensing requirements, and platform limitations. Edge Hold Time Edge Hold Time (EHT) allows an overriding value for Hold Time (HT) that will be applied to individual F_Ports on Gen 5 Fibre Channel platforms or all ports on an individual application-specific integrated circuit (ASIC) for 8 Gbps platforms if any of the ports on that ASIC are operating as F_Ports. The default setting for HT is 500 ms. Hold Time is the amount of time a Class 3 frame can remain in a queue before being dropped while waiting for credit to be given for transmission. Lowering the HT can reduce the likelihood of frame discards on ISLs due to high latency initiators or devices. The default HT is calculated from the RA_TOV, ED_TOV, and maximum hop count values configured on a switch. When using the standard 10 seconds for RA_TOV, 2 seconds for ED_TOV, and a maximum hop count of 7, a Hold Time value of 500 ms is calculated. Extensive field experience has shown that when high latencies occur even on a single initiator or device in a fabric, not only does the F_Port attached to this device see Class 3 frame discards, but the resulting back pressure due to the lack of credit can build up in the fabric and cause other flows not directly related to the high latency device to have their frames discarded at ISLs. Edge Hold Time can be used to reduce the likelihood of this back pressure into the fabric by assigning a lower Hold Time value only for edge ports (initiators or devices). The lower EHT value ensures that frames are dropped at the F_Port where the credit is lacking, before the higher default Hold Time value used at the ISLs expires, allowing these frames to begin moving again. This localizes the impact of a high latency F_Port to just the single edge where the F_Port resides and prevents it from spreading into the fabric and impacting other unrelated flows. Like Hold Time, Edge Hold Time is configured for the entire switch, and is not configurable on individual ports or ASICs. Whether the EHT or HT values are used on a port depends on the particular platform and ASIC as well as the type of port and also other ports that reside on the same ASIC. This behavior is described in further detail in the following sections. Configuring Edge Hold Time In this section we describe how to configure Edge Hold Time. Supported releases and licensing requirements EHT was introduced in FOS v6.3.1b and is supported in FOS v6.3.2x, v6.4.0x, v6.4.1x, v6.4.2x, v6.4.3x, and all v7.X releases. Some behaviors have changed in later releases and Fabric Resiliency Best Practices 9 are noted in later sections. There is no license required to configure the Edge Hold Time setting. Edge Hold Time must be explicitly enabled in all supporting FOS v6.x releases. In FOS v7.0 and later, EHT is enabled by default. Behavior In this section we describe Edge Hold Time behavior. 8 Gbps Platforms and the IBM 2109-M48 (Brocade 48000) On the 2109-M48, Brocade 48000, and all 8 Gbps platforms including the DCX/DCX-4S, Hold Time is an ASIC-level setting that is applied to all ports on the same ASIC chip: If any single port on the ASIC chip is an F_Port, the alternate EHT value will be programmed into the ASIC, and all ports (E_Ports and F_Ports) will use this one value. If all ports on the single ASIC chip are E_Ports, the entire ASIC will be programmed with the default Hold Time value (500 ms). When Virtual Fabrics is enabled on an 8 Gbps switch, the programming of the ASIC remains at the ASIC level. If any single port on the ASIC is an F_Port, regardless of which Logical Switch it resides in, the alternate EHT value will be programmed into the ASIC for all ports in all Logical Switches regardless of the port type. For example: If one ASIC has five ports assigned to Logical Switch 1 comprised of four F_Ports and one E_Port, and this same ASIC has five ports assigned to Logical Switch 2 comprised of all E_Ports, the EHT value will be programmed into all five ports in Logical Switch 1 and also all five ports in Logical Switch 2. The programming of EHT is at the ASIC level and is applied across Logical Switch boundaries. When using Virtual Fabrics, the EHT value configured into the Base Switch is the value that will be used for all Logical Switches. Gen 5 Platforms All Brocade Gen 5 platforms (16 Gbps) are capable of setting the Hold Time value on a port-by-port basis for ports resident on Gen 5 ASICs: All F-ports will be programmed with the alternate Edge Hold Time All E_Ports will be programmed with the default Hold Time value (500 ms) The same EHT value set for the switch will be programmed into all F_Ports on that switch. Different EHT values cannot be programmed on an individual port basis. If 8 Gbps blades are installed into a Gen 5 platform (that is, an FC8-64 blade in a DCX 8510), the behavior of EHT on the 8 Gbps blades will be the same as the description provided for 8 Gbps platforms, as shown in the preceding example. The same EHT value will be programmed into all ports on the ASIC: If any single port on an ASIC is an F_Port, the alternate EHT value will be programmed into the ASIC, and all ports (E_Ports and F_Ports) will use this one value. If all ports on an ASIC are E_Ports, the entire ASIC will be programmed with the default Hold Time value (500 ms). When deploying Virtual Fabrics with FOS versions 7.0.0x, 7.0.1x, or 7.0.2x, the EHT value configured into the Default Switch is the value that will be used for all Logical Switches. 10 Fabric Resiliency Best Practices Starting with FOS v7.1.0, a unique EHT value can be independently configured for each Logical Switch for Gen 5 Platforms. 8 Gbps blades installed in a Gen 5 platform will continue to use the Default Logical Switch configured value for all ports on those blades regardless of which Logical Switches those ports are assigned to. Default EHT settings The default setting used for EHT is pre-loaded into the switch at the factory based on the version of FOS installed. Table 1 shows the factory default EHT settings. Table 1 Factory Default EHT Settings Factory installed version of FOS Default EHT value Any version of FOS 7.X 220 ms FOS 6.4.3x 500 ms FOS 6.4.2x 500 ms FOS 6.4.1x 220 ms FOS 6.4.0x 500 ms Any version prior to FOS 6.4.0 500 ms The default setting can be changed using the “configure” command. The EHT can be changed without having to disable the switch and will take effect immediately after being set. When using the configure command to set EHT, a suggested EHT value will be provided. If the user accepts this suggested setting by pressing <enter>, this suggested value will become the new value for EHT on the switch. The suggested value will be the value that was set during the previous time the configure command was run, even if the user just pressed the <enter> key when encountering this configuration parameter. If the configure command has never been run before, and thus the default value is what is currently set in the system, the suggested value shown will be as follows. Table 2 shows the suggested EHT settings for various FOS releases. Table 2 Suggested EHT settings for various FOS releases FOS version currently on switch Suggested EHT value when configure has not been run previously Any version of FOS 7.X 220 ms FOS 6.4.3x 500 ms FOS 6.4.2x 500 ms FOS 6.4.1x 220 ms FOS 6.4.0x 500 ms Any version prior to FOS 6.4.0 500 ms Note that the suggested value shown when running the configure command may not be the same as the default value that is currently running in the system. This is because the default Fabric Resiliency Best Practices 11 EHT value is set based on the FOS version that was installed at the factory, and the suggested EHT value is based on the FOS version currently running in the system and whether or not the configure command had ever been run in the past. When set by the configure command, the EHT value will be maintained across firmware upgrades, power cycles, and HA fail-over operations. This is true for all versions of FOS. The behavior of EHT has evolved over several FOS releases. The three different behaviors are shown in the following three different examples. Example (FOS 6.X) Example 6 shows the configure command for FOS 6.X. Example 6 Configure command sw0:FID128:admin> configure Not all options will be available on an enabled switch. To disable the switch, use the “switchDisable” command. Configure... Fabric parameters (yes, y, no, n): [no] y Configure edge hold time (yes, y, no, n): [no] y Edge hold time: (100..500) [220] System services (yes, y, no, n): [no] Example (FOS 7.0.X) Example 7 shows the configure command for FOS 7.0.X. Example 7 Configure command sw0:FID128:admin> configure Not all options will be available on an enabled switch. To disable the switch, use the “switchDisable” command. Configure... Fabric parameters (yes, y, no, n): [no] y Edge Hold Time (0 = Low(80ms),1 = Medium(220ms),2 = High(500ms): [220ms]: (0..2) [1] System services (yes, y, no, n): [no] Example (FOS 7.0.2 and higher) Example 8 shows the configure command for FOS 7.0.2 and higher. Example 8 Configure command sw0:FID128:admin> configure Not all options will be available on an enabled switch. To disable the switch, use the “switchDisable” command. Configure... Fabric parameters (yes, y, no, n): [no] y Edge Hold Time in ms (80(Low), 220(Medium), 500(High), 80-500(UserDefined)): (80..500) [220] System services (yes, y, no, n): [no] Recommended Settings Edge Hold Time does not need to be set on “Core Switches” that are comprised of only ISLs and will therefore only use the standard Hold Time setting of 500 ms. 12 Fabric Resiliency Best Practices Recommended values for platforms containing initiators and targets are based on specific deployment strategies. End users typically either separate initiators and targets on separate switches or mix initiators and targets on the same switch. A frame drop has more significance for a target than an initiator because many initiators typically communicate with a single target port, whereas target ports typically communicate with multiple initiators. Frame drops on target ports usually result in “SCSI Transport” error messages being generated in server logs. Multiple frame drops from the same target port can affect multiple servers in what appears to be a random fabric or storage problem. Since the source of the error is not obvious, this can result in time wasted determining the source of the problem. Extra care should be taken therefore when applying EHT to switches where targets are deployed. The most common recommended value for EHT is 220 ms The lowest EHT value of 80 ms should only be configured on edge switches comprised entirely of initiators. This lowest value would be recommended for fabrics that are well maintained and when a more aggressive monitoring and protection strategy is being deployed. Bottleneck credit tools The bottleneck credit tool is used to automatically reset back-end ports when loss of credits is detected on the back-end ports. This function was introduced in FOS v7.0.0 and v6.4.2 and was further enhanced with improved credit loss detection in FOS v7.0.1b and v6.4.3 Enabling bottleneck credit tools Use the --cfgcredittools commands to enable or disable credit recovery of back-end ports, and use the --showcredittools parameter to display the configuration. When this feature is enabled, credit is recovered on back-end ports (ports connected to the core blade or core blade back-end ports) when credit loss is detected on these ports. If complete loss of credit on a Condor 2 back-end port causes frame timeouts, a link reset (LR) is performed on that port regardless of the configured setting, even if that setting is -recover off. When used with the -recover onLrOnly option, the recovery mechanism takes the following escalating actions: When the mechanism detects credit loss, it performs an LR and logs a RASlog message (CX-1014). If the LR fails to recover the port, the port reinitializes. A RASlog message is generated (CX-1015). Note that the port reinitialization does not fault the blade. If the port fails to reinitialize, the port is faulted. An RASlog message (RAS CX-1016) is generated. If a port is faulted, and there are no more online back-end ports in the trunk, the port blade is faulted. A RASlog message (RAS CX-1017) is generated. When used with the -recover onLrThresh option, recovery is attempted through repeated LRs, and a count of the LRs is kept. If the threshold of more than two LRs per hour is reached, the blade is faulted (RAS CX-1018). Note that regardless of whether the LR occurs on the port blade or on the core blade, the port blade is always faulted. If complete credit loss on a particular VC on a particular back-end port is suspected, use the -check option to examine that particular back-end port and VC for credit loss. If the command detects complete credit loss, the information is reported. In addition, if the option to “enable link resets on back-end ports” is configured, this command performs an LR on the link in an Fabric Resiliency Best Practices 13 attempt to recover from the problem. The user must explicitly initiate this check, and it is a one-time operation. In other words, this command does not continuously monitor for credit loss in the background. Detection of credit loss takes 2 - 7 seconds, after which the results of the operation are displayed. An LR also generates a RASlog message. The recommended setting is to enable credit tools with the onLrOnly option: bottleneckmon --cfgcredittools -intport -recover onLrOnly FOS 6.3.2b/6.3.2 and 6.4.0 introduced the credittools function, but was enhanced in the 6.4.3a and 7.0.2 code levels. Table 3 summarizes the enhancements made to the back-end credit recovery function. Table 3 FOS response to back-end credit loss FOS version Action Alert Prior to v6.3.1a Issues LR after 2 seconds for full stoppage in traffic. CDR-5021 or C2-5021 messages logged Versions 6.3.1a, 6.3.2, and 6.4.0 (and later releases) Improved detection for lost credits (multiple lost credits, single VC). CDR-5021 or C2-5021 messages enhanced Versions 6.3.2b, 6.4.2, and 7.0.0 (and later releases) Automatic recovery of lost credits on BE ports via an LR. Permanent blade errors result in blade being faulted. This feature is activated via the bottleneckmon command. CDR-1012 or C2-1012 messages logged Versions 6.4.3a and 7.0.2 (and later releases) Enhanced automatic recovery C2-1027 for credit loss Manual check for congestion versus permanently lost credit invoked automatically, if transmit timeouts are detected on BE. No need for 2 seconds without traffic. C2-1014 if an LR is performed Any detected lost credits result in link reset on the BE port. Example 9 shows the use of the --cfgcredittools command to enable credit recovery on back-end ports. Example 9 cfgcredittools command example SANA_DCX1_BB:FID128:admin> bottleneckmon --cfgcredittools -intport -recover onLrOnly SANA_DCX1_BB:FID128:admin> bottleneckmon --showcredittools Internal port credit recovery is Enabled with LrOnly SANA_DCX1_BB:FID128:admin> Fabric Watch Fabric Watch is an optional (licensed) feature that monitors various FOS metrics, statistics, and switch component states. You can set thresholds on most counter values, rates of 14 Fabric Resiliency Best Practices counter value change, and component states, and alerts can be generated when thresholds are exceeded. Fabric Watch usability was improved with FOS v6.4.0, through changes to the command-line interface (CLI). Fabric Watch documentation also received a major face-lift as part of the FOS v6.4.0 release. It is now much easier to specify threshold values and activate special features such as Port Fencing. Fabric Watch has several notification mechanisms. Fabric Watch can notify the user through any of the following mechanisms: Send a Simple Network Management Protocol (SNMP) trap Log a RASlog message Send an email alert Log a syslog message Refer to the version of the Fabric OS Brocade Fabric Watch Administrator’s Guide appropriate for your release of FOS for complete details about the use of Fabric Watch. Enable Fabric Watch to monitor for CRC errors, Invalid Transfer Words, and State Changes. Configure for alerts on reaching low thresholds and fence (disable) a port when reaching high thresholds. See“Configuring Port Fencing” on page 27 for details about how to enable and configure Fabric Watch Port Fencing. Fabric Watch monitoring Fabric Watch monitors can be enabled to automatically detect most of the faulty media conditions previously noted. For example, Fabric Watch can monitor CRC errors (available in FOS 6.1), Invalid Transfer Words (available in FOS 6.1), and State Changes (ports transitioning between offline and online, available in FOS 6.3). Fabric Watch generates alerts based on user-defined thresholds for these conditions. The most common cause of credit loss is corruption to credit return messages (VC_RDY or R_RDY) due to faulty media. Credit corruption is tracked by an encoding out error, which is an Invalid Transfer Word error. Monitoring and mitigating Invalid Transfer Word issues protects against credit loss. The symptoms of misbehaving devices and faulty media are very similar. In addition to monitoring and isolation, FOS also provides the following RASlog messages for symptoms such as State Changes, devices not returning buffer credits, and loss of sync on device links. Configuring Fabric Watch alerting Fabric Watch alerting is enabled through the use of the portthconfig command. Table 4 lists the suggested thresholds to apply for F_Ports and E_Ports. Table 4 Suggested Fabric Watch alerting thresholds for F_Ports and E_Ports Condition (Area) Action F_Ports E_Ports Link reset (LR) raslog,snmp 3 3 C3TX_TO (C3 Discard) raslog,snmp 5 5 Transmitted Packets% (TXP) raslog 90 75 Transmitted Packets% (RXP) raslog 90 75 CRC raslog 10 N/A Fabric Resiliency Best Practices 15 Condition (Area) Action F_Ports E_Ports State Change (ST) raslog,snmp N/A 1 Notes: In the actions specified in Table 4, email can be used as an alternate reporting method over SNMP in cases where an SNMP infrastructure is not in place. For threshold alerts to be acted upon by writing them to the RASlog, sending an email, or sending an SNMP trap, the -trigger and -action parameters must be specified. Multiple actions can be specified when separated by commas. Example: portthconfig --set fop-port -area LR -lowthreshold -value 3 -trigger above -action raslog,email,snmp Example 10 CLI commands used to set and apply alerting threshold values for C3TX_TO portthconfig --set fop-port -area C3TX_TO -lowthreshold -value 3 -trigger above -action raslog, snmp portthconfig --apply fop-port -area C3TX_TO -action_level cust -threhsold_level cust Note: Fabric Watch alerting can be configured using the command-line interface as shown in Example 10 or using the Web Tools interface, which is accessed through Network Advisor. Refer to the following Brocade product documents for more information about configuring Fabric Watch. These documents are available with registration at the following site: http://my.brocade.com/wps/portal/registration: Brocade Network Advisor SAN User Manual 53-1002948 Fabric Watch Administrator’s Guide 53-1002153 Bottleneck Detection Bottleneck Detection was introduced in FOS v6.3.0 with monitoring for device latency conditions, and then enhanced in FOS v6.4.0 with added support for congestion detection on both E_Ports and F_Ports. FOS v6.4 also added improved reporting options and simplified configuration capabilities. The FOS v6.3.1b release introduced enhancements to improve the accuracy of detecting device latency. Bottleneck Detection does not require a license and is supported on 4 Gbps, 8 Gbps, and 16 Gbps platforms. Enhanced Bottleneck Detection In FOS v6.4.3 and v7.0.1b, additional enhancements were made to distinguish between congestion and latency conditions. Alerts for congestion and latency were de-coupled, to help reduce the potential of having “alert storms,” where a sudden spike in congestion conditions mask latency events. 16 Fabric Resiliency Best Practices Configuring Bottleneck Detection A synopsis of the evolution of Bottleneck Detection CLI command parameters is described. See the Fabric OS Command Reference Manual for the appropriate release that you are using for definitive usage explanation. FOS v6.3 FOS v6.3 marked the initial release of Bottleneck Detection. Starting with FOS v6.3.1b, Bottleneck Detection was made available for F_Port latencies. Alerting is supplied through RASlog only. Bottleneck Detection in FOS v6.3 produces a RASlog message (AN-1003) when a latency threshold is exceeded. The message has a severity level of WARNING. FOS v6.3 Bottleneckmon parameters -time: A measurement interval (default 300 seconds). An integer value between 1 and 10800 inclusive, the time value is used to calculate a percentage of affected seconds that is compared to the threshold percentage, to determine if an alert can be generated. -qtime: A reporting interval (default 300 seconds). An integer value between 1 and 10800 inclusive, the quiet time value is the minimum amount of time in seconds between alerts for a port. Alerts are suppressed until the quiet time is satisfied. -thresh: A latency threshold (minimum % of -time when a latency detected) default (.1 or 10%). A decimal value with 3 digits of precision between 0 and 1. When the value is multiplied by 100, it gives a latency threshold percentage. When the percentage of affected seconds over the time value is greater than the latency threshold percentage, an alert can be produced, depending on the quiet time setting. -alert: Adding this parameter specifies that an alert is generated when a threshold is exceeded. -show: Displays a history of the bottleneck severity on the specified port. The output shows the percentage of one-second intervals affected by the bottleneck condition within the specified time interval. This command succeeds only on online F_Ports. -interval interval_size: Specifies the time window in seconds over which the bottlenecking percentage is displayed in each line of the output. The maximum interval is 10800 seconds. The default is 10 seconds. -span span_size: Specifies the total duration in seconds covered in the output. History data is maintained for a maximum of three hours per port, so the span can be 10800 seconds at most. -status: Lists the ports for which Bottleneck Detection is enabled in the current logical switch, along with alert configuration settings. The ports may be moved to a different logical switch, but they are still shown if their configuration is retained. Specifying ports and port ranges Ports may be specified by port number, port index number, port ranges by slot 2/0-5, or wild card “*” to specify all ports. There is a constraint on 2109-M48/Brocade 48000 directors only that no more than 100 ports are monitored at a time. Port numbers and ranges may be supplied in a list as the last parameters on the command line. Fabric Resiliency Best Practices 17 Parameter values are activated only when the monitors are enabled. You must disable monitors first before a parameter value may be changed. All parameter values that are different from the defaults must be specified when using the --config option. All unspecified parameter values revert to their defaults. CLI examples bottleneckmon --enable -alert 2/1 2/5-15 2/18-21 Enable Bottleneck Detection using defaults on ports 1, 5 to 15, and 18 to 21 on blade 2. bottleneckmon --enable -alert -thresh 0.2 -time 30/0-31 Enable Bottleneck Detection on blade 1, ports 0 to 31 with a threshold of 20% and a time interval of 30 seconds. bottleneckmon --disable “*” Disable Bottleneck Detection on all ports. bottleneckmon --disable 2/1 2/12-15 Disable Bottleneck Detection on ports 1 and 12 to 15 on blade 2. Display commands To display bottleneck statistics on a specified port, use the command shown in Example 11. Example 11 bottleneckmon --show switch:admin> bottleneckmon --show -interval 5 -span 30 2/24 ============================================================= Mon Jun 15 18:54:35 UTC 2009 ============================================================= Percentage of From To affected secs ============================================================= Jun 15 18:54:30 Jun 15 18:54:35 80.00% Jun 15 18:54:25 Jun 15 18:54:30 40.00% Jun 15 18:54:20 Jun 15 18:54:25 0.00% Jun 15 18:54:15 Jun 15 18:54:20 0.00% Jun 15 18:54:10 Jun 15 18:54:15 20.00% Jun 15 18:54:05 Jun 15 18:54:10 80.00% To display the ports that are monitored for devices affected by latency bottlenecks, use the command shown in Example 12. Example 12 bottleneckmon --status switch:admin> bottleneckmon --status Slot Port Alerts? Threshold Time (s) Quiet Time (s) ========================================================== 2 0 N -- -- -2 1 Y 0.200 250 500 2 24 N -- -- -- FOS v6.4 Bottleneck Detection was enhanced significantly in FOS v6.4. Support was added for congestion and latencies on E_Ports. Congestion Bottleneck Detection was added for E_Ports, EX_Ports, and F_Ports. 18 Fabric Resiliency Best Practices A new parameter, -cthresh, was added to monitor port bandwidth utilization. To avoid confusion, the latency threshold parameter, -thresh, was changed to -lthresh. An important change to note is that from FOS v6.4 onwards, when Bottleneck Detection is enabled, all online ports are monitored by default. The intent here is to simplify the enabling of the feature, on the assumption that most ports are monitored. This is the equivalent of bottleneckmon --enable “*”. To facilitate the port selection, two new operations were added: --exclude and --include. Note that --exclude and --include cannot be combined with other operations. They must be issued as separate commands on their own. Alerting was enhanced to include a special Bottleneck Detection SNMP MIB, called the BD MIB. Additional enhancements to Bottleneck Detection were added to several FOS v6.4.x maintenance releases by back-porting of new capability introduced in FOS v7.x. Changes include: v6.4.2: Added BE credit recovery. v6.4.3: Decoupled alerts for latency and congestion. In addition to changes in FOS, Bottleneck Detection support was added to Brocade Network Advisor. Refer to the Brocade Network Advisor documentation for more detail. There is a constraint on 2109-M48/Brocade 48000 directors only that no more than 100 ports are monitored at a time. Port numbers and ranges may be supplied in a list as the last parameters on the command line. All parameter values that are different from the defaults must be specified when using the -config option. All unspecified parameter values revert to their defaults. FOS v6.4 Bottleneckmon parameters -time, -qtime, and -alert remain unchanged. -thresh was changed to -lthresh. -cthresh (% utilization, default is 80% – .8) Congestion Threshold: A decimal value with 3 digits of precision between 0 and 1. When the value is multiplied by 100, it gives a congestion threshold percentage. When the percentage of affected seconds over the time value is greater than the congestion threshold percentage, an alert can be produced, depending on the quiet time setting. This threshold actually refers to the percentage of time the time interval -time that exceeds 95% link utilization. --config: Change a parameter threshold value without disable. You must explicitly provide values for parameters that you do not want to revert to their default values. --configclear: Clear the current values and revert to any switch-wide settings. --exclude: Specify a port range to be excluded from monitoring. --include: Specify a port range to be included for monitoring. -lthresh: Was -thresh in 6.3. -noalert: Disable alerts. --show: Was enhanced to refresh latency or congestion displays. --cfgcretdittools: Configure BE port credit recovery. --showcretdittools: Show BE port credit recovery values (added in v6.4.2). Fabric Resiliency Best Practices 19 -alert=latency: --configs parameter to alert only on latency bottlenecks (added in v6.4.3). -alert=congestion: --configs parameter to alert only on congestion bottlenecks (added in v6.4.3). CLI examples bottleneckmon --enable -alert -lthresh 0.2 -cthresh .7 -time 30 -qtime 30 1/0-31 Enable Bottleneck Detection on blade 1, ports 0 to 31 with a latency threshold of 20%, a congestion threshold of 70%, and a time interval of 30 seconds and quiet time of 30 seconds. bottleneckmon --config -cthresh .7 -lthresh .1 -time 60 -qtime 120 1/0-15 Change the congestion and latency thresholds on ports 0 to 15 on blade 1. Note that --config requires you to specify all the parameter values that you do not want to revert to the default values. bottleneckmon --configclear 2/0-7 Clear the configuration on ports 0 to 7 on blade 2 and revert to the switch-wide configuration. bottleneckmon --exclude 2/9-11 Exclude ports 9-11 on blade 2. bottleneckmon --cfgcredittools -intport -recover onLrOnly Activate the back-end credit recovery mechanism via the bottleneckmon CLI command. This instructs the firmware to issue an LR whenever a loss of credit condition is detected on a back-end link. The firmware continuously scans the links, and during any 2-second window of inactivity, credit levels are confirmed. FOS v7.0 In this section we describe pertinent options added in FOS v7.0. Increased Resolution FOS v7.x added the ability to use Bottleneck Detection to monitor for latency at a resolution below one second. Details on new commands enabling this are included in the following information. Decoupled alerting FOS v7.0.2 introduced the option to decouple latency and congestion alerts. In FOS releases prior to FOS v7.0.2, when users enabled bottleneck alerts, alerting for both congestion and latency bottleneck conditions was enabled. Starting with FOS v7.0.2, users can choose to enable alerts only for latency bottleneck while not enabling alerts for congestion bottleneck, or vice versa. Users still have the option to enable alerts for both congestion and latency bottleneck conditions. FOS v7.0.x Bottleneckmon parameters --cfgcretdittools: Configure BE_Port credit recovery. --showcretdittools: Show E_Port credit recovery values. --lsubsectimethresh: Set the threshold for latency bottlenecks at the sub-second level. --lsubsecsevthresh: Set the severity (bandwidth effect) for latency bottlenecks at the sub-second level. 20 Fabric Resiliency Best Practices The sub-second parameters allow much finer tuning of bottleneck sampling. -lsubsectimethresh time_threshold Sets the threshold for latency bottlenecks at the sub-second level. The time_threshold specifies the minimum fraction of a second that must be affected by latency, in order for that second to be considered affected by a latency bottleneck. For example, a value of 0.75 means that at least 75% of a second must have had latency bottleneck conditions, in order for that second to be counted as an affected second. The time threshold value must be greater than 0 and no greater than 1. The default value is 0.8. Note that the application of the sub-second numerical limits is approximate. This command erases the statistics history and restarts alert calculations (if alerting is enabled) on the specified ports. When used with the config option, you must specify a port. -lsubsecsevthresh severity_threshold Specifies the threshold on the severity of latency in terms of the throughput loss on the port at the sub-second level. The severity threshold is a floating-point value in the range of no less than 1 and no greater than 1000. This value specifies the factor by which throughput must drop in a second, in order for that second to be considered affected by latency bottlenecking. For example, a value of 20 means that the observed throughput in a second must be no more than 1/20 the capacity of the port, in order for that second to be counted as an affected second. The default value is 50. This command erases the statistics history and restarts alert calculations (if alerting is enabled) on the specified ports. When used with the config option, you must specify a port. CLI example Example 13 shows a bottleneckmon --status example. Example 13 bottleneckmon --status switch:admin> bottleneckmon --status Bottleneck Detection - Enabled ============================== Switch-wide sub-second latency bottleneck criterion: ==================================================== Time threshold - 0.800 Severity threshold - 50.000 Switch-wide alerting parameters: ================================= Alerts - Yes Congestion threshold for alert - 0.800 Latency threshold for alert - 0.100 Averaging time for alert - 300 seconds Quiet time for alert - 300 seconds Per-port overrides for sub-second latency bottleneck criterion: =============================================================== Slot Port TimeThresh SevThresh ========================================= 0 3 0.500 100.000 0 4 0.600 50.000 0 5 0.700 20.000 Per-port overrides for alert parameters: ======================================== Slot Port Alerts? LatencyThresh CongestionThresh Time(s) QTime(s) ================================================================= 0 1 Y 0.990 0.900 3000 600 Fabric Resiliency Best Practices 21 0 2 Y 0.990 0.900 4000 600 0 3 Y 0.990 0.900 4000 600 Excluded ports: =============== Slot Port ============ 0 2 0 3 0 4 Back-end port credit recovery examples To enable back-end port credit recovery with the link reset only option and to display the configuration: switch:admin> bottleneckmon --cfgcredittools \ -intport -recover onLrOnly switch:admin> bottleneckmon --showcredittools Internal port credit recovery is Enabled with LrOnly To enable back-end port credit recovery with the link reset threshold option and to display the configuration: switch:admin> bottleneckmon --cfgcredittools -intport \ -recover onLrThresh switch:admin> bottleneckmon --showcredittools Internal port credit recovery is Enabled with LrOnThresh To disable back-end port credit recovery and to display the configuration: switch:admin> bottleneckmon --cfgcredittools \ -intport -recover off switch:admin> bottleneckmon --showcredittools Internal port credit recovery is Disabled Command parameter summary Table 5 shows the command parameter summary. Table 5 Command parameter summary 22 Paramet ers and Subpara meters 6.3.1 6.4.0 6.4.2 6.4.3 7.0.0 7.0.1 7.0.2 --enable Y Y Y Y Y Y Y --disable Y Y Y Y Y Y Y --config Y Y Y Y Y Y Y -alert Y Y Y Y Y Y Y -alert=lat ency – – – Y – Y Y -alert=co ngestion – – – Y – Y Y -noalert Y Y Y Y Y Y Y Fabric Resiliency Best Practices Paramet ers and Subpara meters 6.3.1 6.4.0 6.4.2 6.4.3 7.0.0 7.0.1 7.0.2 -thresh 0.1 * – – – – – -lthresh 0.1 0.1 0.1 0.1 0.1 0.1 -cthresh 0.8 0.8 0.8 0.8 0.8 0.8 -time 300 sec 300 sec 300 sec 300 sec 300 sec 300 sec 300 sec -qtime 300 sec 300 sec 300 sec 300 sec 300 sec 300 sec 300 sec -lsubsecti methresh – – – – 0.8 sec 0.8 sec 0.8 sec -lsubsecs evthresh – – – – 50 50 50 --include – Y Y Y Y Y Y --exclude – Y Y Y Y Y Y --configcl ear – Y Y Y Y Y Y --show Y Y Y Y Y Y Y -refresh – Y Y Y Y Y Y -latency – Y Y Y Y Y Y -congesti on – Y Y Y Y Y Y -interval 10 sec 10 sec 10 sec 10 sec 10 sec 10 sec 10 sec -span 300 sec 300 sec 300 sec 300 sec 300 sec 300 sec 300 sec --status Y Y Y Y Y Y Y --help Y Y Y Y Y Y Y --cfgcredi ttools – – Y Y Y Y Y -intport – – Y Y Y Y Y -recover – – Y Y Y Y Y Off – – Y Y Y Y Y onLRonly – – Y Y Y Y Y onLrThre sh – – Y Y Y Y Y --showcr edittools – – Y Y Y Y Y Notes on release descriptions: – means not supported Y means supported Fabric Resiliency Best Practices 23 * means -lthresh is backwards compatible with -thresh for this release Anything else means default value Suggested parameter settings Field experience shows that the original strategy of enabling Bottleneck Detection with conservative values for latency thresholds almost always yields no results. There was a concern that aggressive values would result in Bottleneck Detection alert storms, but this has not been the case. Even the most aggressive values result in relatively few alerts being generated. As a result, it is now recommended that the most aggressive settings are tried first and then backed off gradually if too many alerts are seen. Table 6 shows the bottleneckmon configuration values. Table 6 bottleneckmon configuration values Parameter Conservative Setting Normal Setting Aggressive Setting -time 300 60 5 -qtime 300 60 1 -thresh 0.3 0.2 0.1 -time 300 60 5 -qtime 300 60 1 -lthresh 0.3 0.1 0.2 -cthresh 0.8 0.5 0.1 -time 300 60 5 -qtime 300 60 1 -lthresh 0.3 0.1 0.2 -cthresh 0.8 0.5 0.1 -lsubsectimethresh 0.8 0.5 0.5 (no less) -lsubsecsevthresh 75 50 1 FOS v6.3 FOS v6.4 FOS v7.0.x Note: The following sections are intended to be illustrative of the commands required to configure and enable FOS features. The actual commands and output will vary slightly, depending on the version of the FOS deployed. Refer to the FOS command reference manual for the FOS version in your environment. Enabling and disabling Bottleneck Detection When Bottleneck Detection is enabled, RASlog alerts can be enabled to be sent when the bottleneck conditions at a port exceed a specified threshold. On the switch with target port connections, log in with administrator privileges. 24 Fabric Resiliency Best Practices Enter the bottleneckmon --enable command to enable Bottleneck Detection on an F_Port or FL_Port. bottleneckmon --enable [ -alert ] [ -thresh threshold ] [ -time window ] [ -qtime quiet_time] [slot/]portlist [[slot/]portlist]... If the alert parameter is not specified, alerts are not sent, but a history of bottleneck conditions for the port can be viewed. The thresh, time, and qtime parameters are also ignored if the alert parameter is not specified. Use the default values for the thresh (0.1), time (300), and qtime (300) parameters. Enabling Bottleneck Detection example (preferred use case) The following example enables bottleneck detection on all F_ and FL_Ports in the switch with RASlog alerts using default values for threshold and time. Alerts are logged when a port is experiencing a bottleneck condition for 10% of the time (default value for thresh/lthresh) over any period of 300 seconds (default value for time) with a minimum of 300 seconds (default value for qtime) between alerts. switch:admin> bottleneckmon --enable -alert * Enabling Bottleneck Detection on ports 3 - 7 with default values example The following example enables Bottleneck Detection on ports 3 through 7 using default values for threshold and time. No alerts will be delivered to report bottleneck conditions, but the bottleneck history can be viewed using the CLI. switch:admin> bottleneckmon --enable 3-7 Example: Disabling Bottleneck Detection You can disable Bottleneck Detection by following these steps: 1. Connect to the switch to which the target port belongs, and log in as administrator. 2. Enter bottleneckmon --disable to disable Bottleneck Detection on a port. Example: Disabling Bottleneck Detection on port 3 You can disable Bottleneck Detection on port 3 by using this command: switch:admin> bottleneckmon --disable 3 Displaying a list of ports with Bottleneck Detection enabled Follow these steps to display a list of ports that have Bottleneck Detection enabled: 1. Connect to the switch to which the target ports belong and log in as administrator. 2. Enter bottleneckmon --status to display a list of ports on which Bottleneck Detection is enabled, as shown in Example 14 on page 26. Note: When using Virtual Fabrics, the output displays ports that do not belong to the logical switch if the ports were moved out of the logical switch after Bottleneck Detection was enabled on them. Fabric Resiliency Best Practices 25 Example 14 Results of the bottleneckmon --status command switch:admin> bottleneckmon --status Port Alerts? Threshold Time(s) Quiet Time(s) ======================================================================= 3 N ---4 Y 0.100 300 300 5 Y 0.100 300 300 6 N ---- Changing Bottleneck Detection settings on a port The default settings for Bottleneck Detection are the preferred settings. These settings are configurable in the event that a user has specific reasons for modifying them, but in most cases, the default settings should not be changed. Examples of reasons to change the defaults can include transient events that cause moderate congestion that are considered normal. Increasing the time or threshold might accommodate such events. Using the following procedure, RASlog alerts can be enabled or disabled, along with configuration of the following settings: Threshold: The percentage of one-second intervals required to generate an alert Time: The time window in seconds in which bottleneck conditions are monitored and compared against the threshold Quiet Time (qtime) options Note: Bottleneck Detection must be disabled on a port before any of the settings can be modified. To change settings on a port: 1. Connect to the switch to which the target port belongs and log in as administrator. 2. Enter bottleneckmon --disable to disable Bottleneck Detection on the port. 3. Enter bottleneckmon --enable to enable Bottleneck Detection, specify the new threshold values, and set the alert option. Example 15 changes the Bottleneck Detection settings on port 4. In this example, the bottleneck --status commands show the before and after settings. Example 15 Before and after running the bottleneck --status command switch:admin> bottleneckmon --status Port Alerts? Threshold Time(s) Quiet Time(s) ======================================================================= 4 Y 0.800 300 300 switch:admin> bottleneckmon –-disable 4 switch:admin> bottleneckmon –-enable –thresh 0.6 –time 420 4 switch:admin> bottleneckmon –-status Port Alerts? Threshold Time(s) Quiet Time(s) ======================================================================= 4 Y 0.600 420 300 26 Fabric Resiliency Best Practices Displaying the history of bottlenecks on a port Use the bottleneckmon –show command to display a history of bottleneck conditions for an individual port: 1. Connect to the switch to which the target port belongs and log in as administrator. 2. Enter the bottleneckmon --show command to display a history of the bottleneck severity for a specific port. Example 16 shows the bottleneck history for port 3 in 5-second windows over a period of 30 seconds. Example 16 Results of the bottleneckmon --show command fcr_saturn1:root> bottleneckmon --show -interval 5 -span 30 3 ============================================================= Mon Jun 15 18:54:35 UTC 2010 ============================================================= From To affected secs ============================================================= Jun 15 18:54:30 Jun 15 18:54:35 80.00% Jun 15 18:54:25 Jun 15 18:54:30 40.00% Jun 15 18:54:20 Jun 15 18:54:25 0.00% Jun 15 18:54:15 Jun 15 18:54:20 0.00% Jun 15 18:54:10 Jun 15 18:54:15 20.00% Jun 15 18:54:05 Jun 15 18:54:10 80.00% Bottleneck alert example Example 17 shows a Bottleneck Detection alert on an F_Port. Example 17 Example Bottleneck Detection alert on an F_Port 2010/03/16-03:40:47, [AN-1003], 21760, FID 128, WARNING, sw0, Latency bottleneck at slot 0, port 38. 100.00 percent of last 300 seconds were affected. Avg. time b/w transmits 80407.3975 us. Port Fencing You can use Fabric Watch thresholds to protect a switch by automatically blocking a port when specified thresholds are reached. This feature is called Port Fencing, and it was a Fabric Watch enhancement in FOS v6.1.0. Configuring Port Fencing The portFencing CLI command is used to enable error reporting for the Brocade Fabric Watch Port Fencing feature. When enabled, all ports of a specified type can be configured to report errors for one or more areas. Supported port types include E_Ports, F_Ports, and physical ports. Port Fencing monitors ports for erratic behavior and disables a port if specified error conditions are met. The portFencing CLI command enables or disables the Port Fencing feature for an area of a class. You can customize or tune the threshold of an area using the portthConfig CLI command. Use portFencing to configure Port Fencing for C3 transmit timeout events. For example: portfencing --enable fop-port -area LR Fabric Resiliency Best Practices 27 You can use the same command to configure Port Fencing on link reset. For example: portfencing --enable fop-port -area C3TX_TO Use the portThconfig command to customize Port Fencing thresholds: switch:admin> portthconfig --set port -area LR -highthreshold -value 5 -trigger above -action snmp switch:admin> portthconfig --set port -ar LR -lowthreshold -value 3 -trigger above -action snmp To apply the new custom settings so they become effective: switch:admin> portthconfig --apply port -area LR -action cust -thresh_level custom To display the port threshold configuration for all port types and areas: switch:admin> portthconfig --show Port Fencing suggested thresholds Table 7 lists the suggested thresholds for Port Fencing. Table 7 Suggested Port Fencing thresholds Condition (Area) Link reset (LR) Action F_Ports raslog,snmp Low 3 High 5 After you select the type of thresholds for an environment, set the low threshold with an action of ALERT (RASlog, email, SNMP trap). The alert will be triggered whenever the low threshold is exceeded. Set the high threshold with an action of Fence. The port will be fenced (disabled) whenever the high threshold is detected. Network Advisor dashboards Network Advisor 12 introduced dashboards and was further enhanced in the 12.1 version. Dashboards are a visual way to view key fabric metrics to help quickly identify issues. The 12.1 version has 4 standard dashboards with the Main Dashboard displayed by default. Details on setting up additional dashboards and configuring the dashboard widgets can be found in the Network Advisor SAN User Manual in the Dashboard Management section. The dashboard contains either performance widgets which display switch metrics such as link utilization, link CRC rates, link loss of sync rates; or status widgets, which display charts or counts of the number of events, or the number of bottleneck ports, or overall switch status. Figure 3 on page 29 shows an example of the dashboard. The widgets shown are: Event status widget showing the number and type of events for all of the fabrics managed by Network Advisor for the past hour. ITW performance widget showing server TSM03 has had a very high number of ITW events in the past month averaging 33/sec. Loss of sync performance metric showing FTSS_n3600 has high loss of sync. C3 discard performance metric showing an unlabeled port having some CRCs errors in the past month. 28 Fabric Resiliency Best Practices Figure 3 Main Dashboard window The default is to display the metrics for all fabrics managed by Network Advisor, but this and the duration can be changed from the toolbar. Figure 4 shows how to alter network scope and duration. Figure 4 Main Dashboard: Altering network scope and duration The Customize Dashboard panel can be used to select which widgets are displayed, alter threshold settings which determine the color displayed, or create custom widgets. Figure 5 on page 30 shows how to customize the dashboard. Fabric Resiliency Best Practices 29 Figure 5 Main Dashboard - customizing dashboard Figure 6 shows a customized dashboard. Figure 6 Customize Dashboard panel 30 Fabric Resiliency Best Practices Figure 7 shows how to add a custom monitor. Figure 7 Add Performance Dashboard Monitor Fabric Resiliency Best Practices 31 Figure 8 shows an example of a SAN Port Health dashboard highlighting C3 discards. Figure 8 Customized Dashboard for C3 discards 32 Fabric Resiliency Best Practices Clicking the connected port name or target port name displays the properties for all the ports for this device. Figure 9 shows an example of resulting output. Figure 9 Port Properties For complete information about setting and using Network Advisor Dashboards, refer to the Brocade Network Advisor SAN User Manual, Dashboard Management Chapter. Monitoring Alerting Policy Suite Monitoring Alerting Policy Suite (MAPS) provides a new, easy-to-use solution for policy-based threshold monitoring and alerting. MAPS proactively monitors the health and performance of the SAN infrastructure to ensure application uptime and availability. By leveraging pre-built rule-/policy-based templates, MAPS simplifies threshold configuration, monitoring, and alerting. Organizations can configure the entire fabric (or multiple fabrics) at one time using Fabric Resiliency Best Practices 33 common rules and policies, or customize policies for specific ports or switch elements, all through a single dialog. The integrated dashboard displays an overall switch health report, along with details about out-of-policy conditions, to help administrators quickly pinpoint potential issues and easily identify trends and other behaviors occurring on a switch or fabric. MAPS offers the following functions: Policy-based monitoring, including: Pre-defined monitoring groups and pre-validated monitoring policies that users can leverage. Pre-defined monitoring groups include switch ports attached to servers, switch ports attached to storage, E_Ports, short-wavelength SFPs, long-wavelength SFPs, and more. Pre-defined monitoring policies include aggressive, moderate, and conservative policies based on monitoring thresholds and actions. Flexibility to create custom monitoring groups, such as switch ports attached to high-priority applications and another group of switch ports attached to low-priority applications, and monitor each group according to its own unique rules. Flexible monitoring rules to monitor a given counter for different threshold values and take different actions when each threshold value is crossed. For example, users can monitor a CRC error counter at a switch port and generate a RASlog when the error rate reaches two per minute, send an email notification when the error rate is at five per minute, and fence a port when the error rate exceeds ten per minute. Ability to monitor both sudden failures and gradually deteriorating conditions in the switch. For example, MAPS can detect and alert users if a CRC error counter suddenly increases to five per minute, or gradually increases to five per day. Support for multiple monitoring categories, enabling monitoring of the overall switch status, switch ports, SFPs, port blades, core blades, switch power supplies, fans, temperature sensors, security policy violations, fabric reconfigurations, CPU and memory utilization, traffic performance, Fibre Channel over IP (FCIP) circuit health, and more. Support for multiple alerting mechanisms (RAS logs, SNMP traps, email notifications) and actions such as port fencing when errors exceed the specified threshold. The CLI dashboard offers the following information: Dashboard of health and error statistics to provide at-a-glance views of switch status and various conditions that are contributing to the switch status, enabling users to get instant visibility into any hot spots at a switch level and take corrective actions Overall status of the switch health and the status of each monitoring category, including any out-of-range conditions and the rules that were triggered Historical information about the switch status for up to the last seven days; automatically provides raw counter information for a variety of error counters Bottleneck detection integration with MAPS dashboard: Bottleneck detection information is integrated with the MAPS dashboard, showing bottleneck events detected by the Bottleneck Monitor as well as transient bottlenecks that are not detected by the Bottleneck Monitor. This enables users to get at an instant view of the bottlenecked ports in the switch, and enables rapid problem resolution. Proactive flow monitoring using MAPS: MAPS can monitor flows that are established within Flow Vision and generate alerts based on user-defined rules, enabling users to monitor and be alerted when established thresholds are exceeded. 34 Fabric Resiliency Best Practices Automated migration of Fabric Watch configurations to MAPS: Organizations currently using Fabric Watch can automatically import existing thresholds into a MAPS policy, enabling seamless migration from Fabric Watch to MAPS to access the new MAPS capabilities and usability enhancements. Flow Vision Flow Vision enables administrators to identify, monitor, and analyze specific application and data flows in order to maximize performance, avoid congestion, and optimize resources. Flow Vision includes: Flow Monitor: Provides comprehensive visibility into flows in the fabric, including the ability to automatically learn (discover) flows and non-disruptively monitor flow performance. Users can monitor all flows from a specific host to multiple targets/LUNs or from multiple hosts to a specific target/LUN; monitor all flows across a specific ISL; or perform LUN-level monitoring of specific frame types to identify resource contention or congestion that is impacting application performance. Flow Monitor provides the following capabilities: – Comprehensive visibility into application flows in the fabric, including the ability to learn (discover) flows automatically. – Monitoring of application flows within a fabric at a given port. – Statistics associated with the specified flows to gain insights into application performance, such as transmit frame count, receive frame count, transmit throughput, receive throughput, SCSI Read frame count, SCSI Write frame count, number of SCSI Reads and Writes per second (IOPS), and more. – When N-Port ID Virtualization (NPIV) is used on the host, users can monitor virtual machine (VM)-to-LUN-level performance. – Monitoring of various frame types at a switch port to provide deeper insights into the storage I/O access pattern at the LUN level, reservation conflicts, and I/O errors. Examples of frame types include SCSI Read, SCSI Write, SCSI Reserve, ABTS, and BA_ACC. – Flow Monitor is integrated with Brocade Monitoring and Alerting Policy Suite (MAPS) to enable threshold-based monitoring and alerting of flows. Summary of best practice recommendations Recommended features and capabilities to improve the overall resiliency of FOS-based FC fabric environments are as follows: Enable the Edge Hold Time feature Enable bottleneck credit recovery Enable Brocade Fabric Watch to alert on anomalous conditions Enable Bottleneck Detection Configure 2-link trunk groups Enable Port Fencing for F_Ports Suggested implementation A suggested sequence follows for implementing the fabric resiliency features provided by the FOS along with recommended configuration values. Fabric Resiliency Best Practices 35 Note: The suggested sequence and associated thresholds presented have been identified as appropriate for most environments. It is possible that specific environments might require alternate settings to meet specific requirements. Edge Hold Time Enable EHT on edge switches using 220 ms. Note: Edge Hold Time is a switch-wide setting and if the switch is set up for virtual switches, it is set from the default switch (FID 128). Example 18 shows the CLI command used to set the Edge Host Time. Example 18 Output of configure command SANA_DCX1_BB:FID128:admin> configure Not all options will be available on an enabled switch. To disable the switch, use the "switchDisable" command. Configure... Fabric parameters (yes, y, no, n): [no] yes Configure edge hold time (yes, y, no, n): [yes] yes Edge hold time: (100..500) [220]220 System services (yes, y, no, n): [no] no Credit tools Enable credit recovery tool with the LROnly option. Example 19 shows the CLI commands used to enable credit recovery. Example 19 Enabling credit recovery SANA_DCX1_BB:FID128:admin> bottleneckmon --cfgcredittools -intport -recover onLrOnly SANA_DCX1_BB:FID128:admin> bottleneckmon --showcredittools Internal port credit recovery is Enabled with LrOnly SANA_DCX1_BB:FID128:admin> Fabric Watch alerting Enable Fabric Watch Alerting on both F_Ports and E_Ports using suggested thresholds defined in Table 5 on page 22. Example 20 shows the CLI commands used to set the low and high threshold values for F_Ports and E_Ports. Example 20 Setting threshold values portthconfig --set fop-port -area LR -lowthreshold -value 3 -trigger above -action raslog,snmp portthconfig --set fop-port -area C3TX_TO -lowthreshold -value 5 -trigger above 36 Fabric Resiliency Best Practices -action raslog,snmp portthconfig --set fop-port -area TXP -lowthreshold -value 90 -trigger above -action raslog portthconfig --set fop-port -area RXP -lowthreshold -value 90 -trigger above -action raslog portthconfig --set fop-port -area CRC -lowthreshold -value 10 -trigger above -action raslog portthconfig --set e-port -action raslog,snmp portthconfig --set e-port -action raslog,snmp portthconfig --set e-port -action raslog portthconfig --set e-port -action raslog portthconfig --set e-port -action raslog,snmp -area LR -lowthreshold -value 3 -trigger above -area C3TX_TO -lowthreshold -value 5 -trigger above -area TXP -lowthreshold -value 75 -trigger above -area RXP -lowthreshold -value 75 -trigger above -area ST -lowthreshold -value 1 -trigger above After the custom thresholds and actions have been defined as shown in Example 20 on page 36, they must then be applied. Example 21 shows the CLI commands used to apply the custom defined threshold and action for each area. Example 21 Applying thresholds portthconfig portthconfig portthconfig portthconfig portthconfig portthconfig portthconfig portthconfig portthconfig portthconfig --apply --apply --apply --apply --apply --apply --apply --apply --apply --apply fop-port -area LR -action_level cust -threhsold_level cust fop-port -area C3TX_TO -action_level cust -threhsold_level cust fop-port -area TxPerf -action_level cust -threhsold_level cust fop-port -area RxPerf -action_level cust -threhsold_level cust fop-port -area CRC -action_level cust -threhsold_level cust e-port -area LR -action_level cust -threhsold_level cust e-port -area C3TX_TO -action_level cust -threhsold_level cust e-port -area TxPerf -action_level cust -threhsold_level cust e-port -area RxPerf -action_level cust -threhsold_level cust e-port -area CRC -action_level cust -threhsold_level cust Bottleneck Detection Enable Bottleneck Detection using the “Normal settings” defined in Table 6 on page 24. Example (FOS 6.4) Example 22 on page 38 shows the commands used to enable Bottleneck Detection alerting on FOS 6.4. The output from bottleneckmon --status shows ports that have been enabled. Fabric Resiliency Best Practices 37 Example 22 Enable and show status SANA_DCX1_BB:FID128:admin> bottleneckmon --enable -lthresh 0.1 -time 60 -qtime 60 -alert SANA_DCX1_BB:FID128:admin> SANA_DCX1_BB:FID128:admin> bottleneckmon --status Bottleneck detection - Enabled ============================== Switch-wide alerting parameters: ============================ Alerts Latency threshold for alert Congestion threshold for alert Averaging time for alert Quiet time for alert - -cthresh 0.5 Yes 0.100 0.500 60 seconds 60 seconds Example (FOS 7.0) Example 23 shows the commands used to enable Bottleneck Detection alerting on FOS 7.0. The output from bottleneckmon --status shows ports that have been enabled. Example 23 Enable and show status SANC_DCX2_BB:FID128:admin> SANC_DCX2_BB:FID128:admin> bottleneckmon --enable -lthresh 0.1 -cthresh 0.5 -time 60 -qtime 60 -lsubsectimethresh 0.5 -lsubsecsevthresh 50 -alert SANC_DCX2_BB:FID128:admin> SANC_DCX2_BB:FID128:admin> bottleneckmon --status Bottleneck detection - Enabled ============================== Switch-wide sub-second latency bottleneck criterion: ==================================================== Time threshold - 0.500 Severity threshold - 50.000 Switch-wide alerting parameters: ================================ Alerts Latency threshold for alert Congestion threshold for alert Averaging time for alert Quiet time for alert SANC_DCX2_BB:FID128:admin> Yes 0.100 0.500 60 seconds 60 seconds Port fencing Enable port fencing for LR on F_Ports for edge switches only (in core-edge designed networks). Fencing will occur on the high threshold value specified in the portthconfig command. See Table 7 on page 28 for the suggested port fencing thresholds. 38 Fabric Resiliency Best Practices Example 24 shows the commands used to enable port fencing for LR on F_Ports. Example 24 Command used to enable port fencing for LR on F_Ports portthconfig --set fop-port -area LR -lowthreshold -value 3 -trigger above -action raslog,snmp portthconfig --set fop-port -area LR -highthreshold -value 5 -trigger above -action raslog,snmp portfencing --enable fop-port -area LR Note: It is recommended that port fencing only be applied to switches with only initiators (servers) attached. It is not recommended that port fencing be applied to switches with connected storage ports. Using Frame Viewer Frames discarded due to hold-time timeout are sent to the CPU for processing. During subsequent CPU processing, information about the frame such as SID, DID, and transmit port number is retrieved and logged. This information is maintained for a certain fixed number of frames. Frame Viewer captures only FC frames that are dropped due to a timeout received on an Edge ASIC (ASIC with FE ports). If the frame is dropped due to any other reason, it is not captured by Frame Viewer. If the frame is dropped due to timeout on an Rx buffer on a Core ASIC, the frame is not captured by Frame Viewer. Timeout is defined as a frame that lives in an Rx buffer for longer than the Hold Time default of 500 ms or the Edge Hold Time value custom setting. The user is provided a CLI command to retrieve and display this information, as shown in Example 25 on page 40. Note: If the switch is a single ASIC switch, such as an embedded switch or a Brocade 300 Switch, Brocade 5100 Switch, Brocade 6505 Switch, Brocade 6510 Switch, and so on, there are no Core ASIC or back-end ports, and Frame Viewer captures dropped frames due to timeout. The number of frames captured depends on available switch resources. A Core ASIC has only back-end ports and UltraScale Inter-Chassis Link (ICL) ports. If a frame is dropped and captured by Frame Viewer, it displays the frame (FC Header and Payload) with a time stamp of the time when the frame was dropped. Fabric Resiliency Best Practices 39 Example 25 framelog example framelog --show -n 1200: ================================================================================== =========== Wed Dec 28 08:51:02 EST 2012 ================================================================================== =========== Log TX RX timestamp port port SID DID SFID DFID Type Count ================================================================================== =========== Dec 19 11:37:00 -1/-1 10/29 0x01dd40 0x018758 129 129 timeout 8 Dec 19 11:37:00 -1/-1 1/29 0x018d40 0x01874b 129 129 timeout 8 Dec 19 11:37:00 -1/-1 12/5 0x017500 0x018758 129 129 timeout 8 Dec 19 11:37:00 -1/-1 10/5 0x015500 0x018758 129 129 timeout 8 Dec 19 11:37:00 -1/-1 3/5 0x012500 0x01874b 129 129 timeout 6 Dec 19 11:37:00 -1/-1 3/5 0x012500 0x018541 129 129 timeout 4 Dec 19 11:37:00 -1/-1 1/5 0x010500 0x01874b 129 129 timeout 12 Dec 19 11:37:00 1/23 -1/-1 0x01dd40 0x018758 128 128 timeout 4 Dec 19 11:37:00 1/23 -1/-1 0x015500 0x01874b 128 128 timeout 2 Dec 19 11:37:00 1/23 -1/-1 0x012500 0x018758 128 128 timeout 4 Dec 19 11:37:00 1/23 -1/-1 0x010500 0x018758 128 128 timeout 10 Dec 19 11:36:59 -1/-1 3/5 0x012500 0x01874b 129 129 timeout 8 Dec 19 11:30:51 -1/-1 10/29 0x01dd40 0x01874b 129 129 timeout 8 Dec 19 11:30:51 -1/-1 1/29 0x018d40 0x01874b 129 129 timeout 8 Dec 19 11:30:51 -1/-1 10/5 0x015500 0x018756 129 129 timeout 8 Dec 19 11:30:51 -1/-1 3/5 0x012500 0x01874b 129 129 timeout 8 Dec 19 11:30:51 -1/-1 1/5 0x010500 0x01874b 129 129 timeout 8 Dec 19 11:30:50 1/23 -1/-1 0x01dd40 0x018756 128 128 timeout 6 Dec 19 11:30:50 1/23 -1/-1 0x018d40 0x018756 128 128 timeout 8 Dec 19 11:30:50 1/23 -1/-1 0x012500 0x018756 128 128 timeout 6 Be aware that: TX Port is the port that discarded the frame. SID is the source Port ID (PID). DID is the destination PID. -1/-1 in the port column refers to a BE port. CX-XXXX type messages CX-XXXX messages are documented in the Fabric OS Message Reference Guide appropriate for your release. The message code “CX” is displayed as either “C2” or “C3,” depending on whether the port is on an 8 Gbps Condor 2 (C2) or Gen 5 16 Gbps Condor 3 (C3) ASIC. 40 Fabric Resiliency Best Practices Authors This paper was produced by a team of specialists from around the world, working at the IBM International Technical Support Organization. The content is based on Brocade documentation and is presented in a form that specifically identifies IBM recommendations. Ian MacQuarrie is a Senior Technical Staff Member with the IBM Systems and Technology Group located in San Jose, California. He has 26 years of experience in enterprise storage systems in a variety of test and support roles. He is currently a member of the Systems and Technology Group (STG) Field Assist Team (FAST) supporting clients through critical account engagements, availability assessments, and technical advocacy. His areas of expertise include storage area networks (SANs), open systems storage solutions, and performance analysis. Ian co-authored a previous IBM Redbooks® publication, Implementing the IBM System Storage SAN Volume Controller V6.1, SG24-7933. David Lutz is a Consulting Remote Technical Support Specialist in the IBM Global Technology Services® - Technical Support group in Canada. David is currently the senior technical team lead of the Canadian Remote Technical IBM System z® and SAN Storage teams. He has 35 years experience in the mainframe and enterprise storage systems and has spent the last 20 years supporting the IBM DS8000®, SVC, and Fibre Channel Switches. Jon Tate is a Project Manager for IBM System Storage® SAN Solutions at the International Technical Support Organization, San Jose Center. Before joining the ITSO in 1999, he worked in the IBM Technical Support Center providing Level 2 and Level 3 support for IBM storage products. Jon has 28 years of experience in storage software and management, services, and support, and is both an IBM Certified IT Specialist and an IBM SAN Certified Specialist. He is also the UK Chairman of the Storage Networking Industry Association. Special thanks to Brocade for its unparalleled support of this paper in terms of equipment and support in many areas, and to the following people at Brocade: Silviano Gaona Owen Higginson Blayne Rawsky Brian Steffler Now you can become a published author, too! Here’s an opportunity to spotlight your skills, grow your career, and become a published author—all at the same time! Join an ITSO residency project and help write a book in your area of expertise, while honing your experience using leading-edge technologies. Your efforts will help to increase product acceptance and customer satisfaction, as you expand your network of technical contacts and relationships. Residencies run from two to six weeks in length, and you can participate either in person or as a remote resident working from your home base. Find out more about the residency program, browse the residency index, and apply online at: ibm.com/redbooks/residencies.html Fabric Resiliency Best Practices 41 Stay connected to IBM Redbooks Find us on Facebook: http://www.facebook.com/IBMRedbooks Follow us on Twitter: http://twitter.com/ibmredbooks Look for us on LinkedIn: http://www.linkedin.com/groups?home=&gid=2130806 Explore new Redbooks publications, residencies, and workshops with the IBM Redbooks weekly newsletter: https://www.redbooks.ibm.com/Redbooks.nsf/subscribe?OpenForm Stay current on recent Redbooks publications with RSS Feeds: http://www.redbooks.ibm.com/rss.html 42 Fabric Resiliency Best Practices Notices This information was developed for products and services offered in the U.S.A. IBM may not offer the products, services, or features discussed in this document in other countries. Consult your local IBM representative for information on the products and services currently available in your area. Any reference to an IBM product, program, or service is not intended to state or imply that only that IBM product, program, or service may be used. Any functionally equivalent product, program, or service that does not infringe any IBM intellectual property right may be used instead. However, it is the user's responsibility to evaluate and verify the operation of any non-IBM product, program, or service. IBM may have patents or pending patent applications covering subject matter described in this document. The furnishing of this document does not grant you any license to these patents. You can send license inquiries, in writing, to: IBM Director of Licensing, IBM Corporation, North Castle Drive, Armonk, NY 10504-1785 U.S.A. The following paragraph does not apply to the United Kingdom or any other country where such provisions are inconsistent with local law: INTERNATIONAL BUSINESS MACHINES CORPORATION PROVIDES THIS PUBLICATION "AS IS" WITHOUT WARRANTY OF ANY KIND, EITHER EXPRESS OR IMPLIED, INCLUDING, BUT NOT LIMITED TO, THE IMPLIED WARRANTIES OF NON-INFRINGEMENT, MERCHANTABILITY OR FITNESS FOR A PARTICULAR PURPOSE. Some states do not allow disclaimer of express or implied warranties in certain transactions, therefore, this statement may not apply to you. This information could include technical inaccuracies or typographical errors. Changes are periodically made to the information herein; these changes will be incorporated in new editions of the publication. IBM may make improvements and/or changes in the product(s) and/or the program(s) described in this publication at any time without notice. Any references in this information to non-IBM websites are provided for convenience only and do not in any manner serve as an endorsement of those websites. The materials at those websites are not part of the materials for this IBM product and use of those websites is at your own risk. IBM may use or distribute any of the information you supply in any way it believes appropriate without incurring any obligation to you. Any performance data contained herein was determined in a controlled environment. Therefore, the results obtained in other operating environments may vary significantly. Some measurements may have been made on development-level systems and there is no guarantee that these measurements will be the same on generally available systems. Furthermore, some measurements may have been estimated through extrapolation. Actual results may vary. Users of this document should verify the applicable data for their specific environment. Information concerning non-IBM products was obtained from the suppliers of those products, their published announcements or other publicly available sources. IBM has not tested those products and cannot confirm the accuracy of performance, compatibility or any other claims related to non-IBM products. Questions on the capabilities of non-IBM products should be addressed to the suppliers of those products. This information contains examples of data and reports used in daily business operations. To illustrate them as completely as possible, the examples include the names of individuals, companies, brands, and products. All of these names are fictitious and any similarity to the names and addresses used by an actual business enterprise is entirely coincidental. COPYRIGHT LICENSE: This information contains sample application programs in source language, which illustrate programming techniques on various operating platforms. You may copy, modify, and distribute these sample programs in any form without payment to IBM, for the purposes of developing, using, marketing or distributing application programs conforming to the application programming interface for the operating platform for which the sample programs are written. These examples have not been thoroughly tested under all conditions. IBM, therefore, cannot guarantee or imply reliability, serviceability, or function of these programs. © Copyright International Business Machines Corporation 2011, 2012, 2014. All rights reserved. Note to U.S. Government Users Restricted Rights -- Use, duplication or disclosure restricted by GSA ADP Schedule Contract with IBM Corp. 43 This document REDP-4722-02 was created or updated on May 12, 2014. ® Send us your comments in one of the following ways: Use the online Contact us review Redbooks form found at: ibm.com/redbooks Send your comments in an email to: [email protected] Mail your comments to: IBM Corporation, International Technical Support Organization Dept. HYTD Mail Station P099 2455 South Road Poughkeepsie, NY 12601-5400 U.S.A. Redpaper ™ Trademarks IBM, the IBM logo, and ibm.com are trademarks or registered trademarks of International Business Machines Corporation in the United States, other countries, or both. These and other IBM trademarked terms are marked on their first occurrence in this information with the appropriate symbol (® or ™), indicating US registered or common law trademarks owned by IBM at the time this information was published. Such trademarks may also be registered or common law trademarks in other countries. A current list of IBM trademarks is available on the Web at http://www.ibm.com/legal/copytrade.shtml The following terms are trademarks of the International Business Machines Corporation in the United States, other countries, or both: DS8000® Global Technology Services® IBM® Redbooks® Redpaper™ Redbooks (logo) System Storage® System z® ® The following terms are trademarks of other companies: Other company, product, or service names may be trademarks or service marks of others. 44 Fabric Resiliency Best Practices