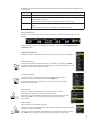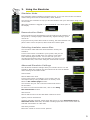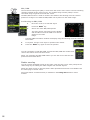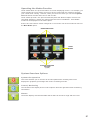
1
Zeus Multi-function Display
User Manual
English
Preface
Disclaimer
As Navico is continuously improving this product, we retain the right to make changes to
the product at any time which may not be reflected in this version of the manual. Please
contact your nearest distributor if you require any further assistance.
It is the owner’s sole responsibility to install and use the instrument and transducers in
a manner that will not cause accidents, personal injury or property damage. The user of
this product is solely responsible for observing safe boating practices.
NAVICO HOLDING AS AND ITS SUBSIDIARIES, BRANCHES AND AFFILIATES DISCLAIM
ALL LIABILITY FOR ANY USE OF THIS PRODUCT IN A WAY THAT MAY CAUSE ACCIDENTS,
DAMAGE OR THAT MAY VIOLATE THE LAW.
Governing Language: This statement, any instruction manuals, user guides and other
information relating to the product (Documentation) may be translated to, or has been
translated from, another language (Translation). In the event of any conflict between any
Translation of the Documentation, the English language version of the Documentation
will be the official version of the Documentation.
This manual represents the product as at the time of printing. Navico Holding AS and its
subsidiaries, branches and affiliates reserve the right to make changes to specifications
without notice.
Copyright
Copyright © 2010 Navico Holding AS.
Feedback from you
Your feedback is important and helps Navico ensure that this manual is a valuable
resource for all instrument users. E-mail your comments or suggestions about this
manual to the following address:
[email protected]
Warranty
The warranty card is supplied as a separate document.
In case of any queries, refer to the brand web site of your display or system:
www.bandg.com
Declarations and conformance
This equipment is intended for use in international waters as well as coastal sea areas
administered by countries of the E.U. and E.E.A. For more information refer to the
separate Z8/Z12 Installation manual.
About this manual
This manual is a reference guide for operating the B&G Z8 and Z12 systems. It assumes
that all equipment is installed and configured, and that the system is ready to use.
The manual assumes that the user has basic knowledge of navigation, nautical
terminology and practices.
The manual does not cover basic background information about how equipment such as
radars, echo sounders and AIS work. Such information is available from our web site:
www.bandg.com
Important text that requires special attention from the reader is emphasized as follows:
Used to draw the reader’s attention to a comment or some important information.
Used when it is necessary to warn personnel that they should proceed carefully
to prevent risk of injury and/or damage to equipment/personnel.
1
In this manual you will see few direct text references to keys, menus and menu entries,
and few step-by-step descriptions. By using graphics we will guide you to the key and
the required menu selections.
In the illustrations throughout the manual the following symbols are used:
Single short press
on illustrated key
MENU
WIN
MENU
WIN
MENU
3s
MENU
WIN
Press twice on
illustrated key
x2
WIN
Press and hold on
illustrated key with
time indication
Rotate rotary knob
Single short
press on rotary
knob
References to keys on the operator panel are written in boldface, e.g. ‘WIN’ key.
The software
This manual is written for B&G Zeus Release to Market 1 (RTM1). Please check web site
for details on release version.
x2
MENU
WIN
The About dialogue above is an example only and may not match the software installed
on your unit!
The manual will be continuously updated to match new software releases. The latest
available manual version can be downloaded from www.bandg.com.
2
Contents
1.
Overview .................................................................................... 7
Front Panel ..................................................................................... 7
The Zeus Screen Structure ............................................................... 8
Operating Zeus ............................................................................... 9
2.
Basic Operation .......................................................................... 11
Turning the Unit On/Off .................................................................. 11
Positioning a Man Over Board Mark .................................................. 11
Adjusting the Backlight .................................................................. 12
Operating the Menu System............................................................ 12
Using the Cursor ........................................................................... 13
Adding Entries in Dialog Boxes ........................................................ 13
Working with Pages and Panels ....................................................... 14
3.
Using the Simulator .................................................................... 15
Simulator Mode ............................................................................. 15
Demonstration Mode...................................................................... 15
Selecting simulator source files ....................................................... 15
Advanced Simulator Settings .......................................................... 15
4.
Using Charts ............................................................................... 17
The Chart Panel ............................................................................ 17
The Vessel Symbol ........................................................................ 18
Using the Cursor on Chart Panel ...................................................... 18
Extension Lines ............................................................................ 19
Laylines ....................................................................................... 19
Chart Scale .................................................................................. 20
Searching for Chart Objects............................................................ 20
Displaying Chart Information .......................................................... 20
Positioning the Chart on the Panel ................................................... 21
Selecting Chart Details Level .......................................................... 21
Chart Categories ........................................................................... 22
Chart Imagery Style ...................................................................... 22
Chart Overlay ............................................................................... 22
Chart Data ................................................................................... 22
Chart Options in Navionics Chart Database ....................................... 23
Photo Overlay ............................................................................... 23
Navionics Fish’n Chip ..................................................................... 25
3
5.
Waypoints, Routes & Tracks........................................................ 26
Waypoints .................................................................................... 26
Tracks.......................................................................................... 27
Routes ......................................................................................... 28
The Waypoints, Routes and Tracks Page ........................................... 29
6.
Using the Radar .......................................................................... 30
The Radar Panel ............................................................................ 30
The Radar Operational Modes ......................................................... 31
Setting up the Radar Image ............................................................ 31
Using the Cursor on the Radar Panel ................................................ 32
Optimizing the Radar Image ........................................................... 33
Dual Radar ................................................................................... 34
Target Tracking on Radar and Chart Panels ....................................... 35
True Motion .................................................................................. 35
Fast Scan Mode ............................................................................. 35
Setting a Guard Zone Around Your Vessel ......................................... 36
Other Vessels on the Radar Image ................................................... 37
Measuring Range and Bearing to a Target ......................................... 37
7.
Other Vessels on Chart and Radar Image ................................... 39
Target Symbols ............................................................................. 39
How to Display Other Vessels .......................................................... 40
Defining a Guard Zone Around Your Vessel ........................................41
Finding Other AIS Vessels ...............................................................41
8.
Echosounder .............................................................................. 42
The Echosounder Image ................................................................. 42
Pausing the Sounder Image ........................................................... 42
Setting Up the Sounder Display ...................................................... 43
Using Colors ................................................................................. 44
Using the Cursor on the Echosounder Panel ...................................... 45
Optimizing the Echosounder Image .................................................. 46
Recording the Echosounder Data ..................................................... 47
9.
StructureScan ............................................................................. 49
StructureScan Panel ...................................................................... 49
The StructureScan Image ............................................................... 49
Pausing StructureScan .................................................................. 49
Setting Up the StructureScan Display .............................................. 50
Using Structure Palettes ................................................................. 51
Using the Cursor on the StructureScan Panel .................................... 51
Optimizing the StructureScan Image................................................ 52
Recording the StructureScan Data ................................................... 53
4
10.
Navigating .................................................................................. 55
Start Navigating ............................................................................ 55
Cancel Navigation.......................................................................... 55
Navigation Parameters ................................................................... 56
Navigation Panels .......................................................................... 57
Data History ................................................................................. 58
11.
Information Panels ..................................................................... 61
Instrument Panels ......................................................................... 61
12.
H3000 Performance Functions .................................................... 63
Polar Tables .................................................................................. 63
TWA Correction Table .................................................................... 66
TWS Correction Table .................................................................... 66
13.
The Utilities Pages ...................................................................... 67
Vessels ........................................................................................ 67
Alarms ......................................................................................... 67
H3000 Calibration.......................................................................... 68
Satellites ...................................................................................... 68
Find ............................................................................................. 68
Waypoints/routes/tracks ................................................................ 68
Trip Log ....................................................................................... 69
Sun/Moon .................................................................................... 69
Tides ........................................................................................... 69
Files ............................................................................................ 69
14.
Customizing Your System ........................................................... 70
Page Setup ................................................................................... 70
Adjusting Panel Size ...................................................................... 72
Setting the Appearance of the Instrument Bar .................................. 72
Changing System Settings .............................................................. 73
15.
Weather ...................................................................................... 74
GRIB Weather ............................................................................... 74
GRIB Disclaimer ............................................................................ 77
Setting up the weather image ......................................................... 77
Weather overlay transparency......................................................... 78
Color Codes ................................................................................. 78
Weather Forecast .......................................................................... 78
Weather Alarm Settings ................................................................. 78
5
16.
Audio .......................................................................................... 79
Sonic Hub..................................................................................... 79
Sirius Audio .................................................................................. 79
17.
Using Video ................................................................................. 81
The Video Panel ............................................................................ 81
Customizing Your Video Settings ..................................................... 81
Optimizing the Video Image ............................................................ 82
Selecting Video Standard ............................................................... 82
18.
The Alarm System ....................................................................... 83
Type of Messages .......................................................................... 83
Acknowledging a Message .............................................................. 83
Customizing the Alarm Settings ...................................................... 84
19.
Using BEP CZone ......................................................................... 85
The BEP CZone Panel ..................................................................... 86
Operating the Modes Function ......................................................... 87
System Overview Options............................................................... 87
The BEP CZone Dashboard ............................................................. 88
Editing the CZone Dashboard .......................................................... 88
20.
Maintenance ............................................................................... 89
Preventive Maintenance.................................................................. 89
Simple Maintenance Procedures ...................................................... 89
Backing Up Your System Data ......................................................... 89
21.
Menu Overview ........................................................................... 91
Settings Menus ............................................................................. 91
Context Menus .............................................................................. 92
Plot Menu ..................................................................................... 92
Goto Menu ................................................................................... 92
6
1. Overview
Front Panel
2
3
4
6
5
PLOT
MARK
GO TO
VESSEL
7
8
MENU
10
11
WIN
IN
1MOB
2 ABC
4 GHI
5 JKL
6 MNO
7 PQRS 8 TUV
9WXYZ
STBY
AUTO
9
OUT
0
3 DEF
12
PWR
13
CHART
RADAR
ECHO
NAV
INFO
PAGES
1
1
Direct Access Keys (DAK). Provide direct access to a page. Repeated presses
of each DAK cycles through several different pages that relate to the DAK
2
PLOT/MARK key. A short press activates the Plot menu, a long press positions
a waypoint at the vessel position
3
Rotary knob. Used to maneuver in the menu system, and for context specific
operation
4
GOTO/VESSEL key. A short press activates the Goto menu, a long press
centers the chart to vessel position
5
3 (Tick) key. Activates/confirms current selection
6
X (Exit) key. Used to close dialogs, and to return to previous menu level.
Toggles between cursor and vessel position on chart panels. Removes the
cursor from the screen on radar and echosounder panels
7
Cursor keypad used to move the cursor on the display, and to maneuver in the
menu system
8
MENU key. A single press displays the context menu for active panel/overlay/
operation. Pressing the key twice displays the Settings menu
9
WIN key, used on multiple panels pages. A short press toggles between the
panels, a long press expands active panel to a full page panel
10
Zoom keys for radar, echosounder and chart pages
11
MOB key. A long press positions a MOB waypoint at the vessel’s position
12
13
Alpha numeric keypad used for entering numbers and text in dialog boxes.
NOTE: The STBY/AUTO key is reserved for future use.
Power key. A short press activates the Light dialog, a long press turns the unit
off
7
The Zeus Screen Structure
Pages and page groups
The Zeus screen is comprised of page groups, accessed by pressing one of the Direct
Access Keys (DAK). A single press of a ‘DAK’ will open the page previously viewed from
this ‘DAK’. A second press will give the page group and edit options.
CHART
RADAR
ECHO
NAV
INFO
PAGES
Chart
Radar
Echosounder
Navigation
Info
Utilities
Each page group (except the Utilities pages) may include up to 5 pages. The first page in
a page group will always be a full screen panel.
The system comes pre-configured with some commonly used pages, and you can also
define your own pages. Refer to the Customizing your system section.
Chart page group example
Radar page group example
Panels
Each application connected to the Zeus system is presented on panels, and you can have
up to 4 panels per page.
1-panel page
2-panels page
3-panels page
4-panels page
The following panels are available:
Panel
8
Description
Chart
Marine chart. Can be displayed as 2D or 3D (Navionics charts)
Radar
Radar PPI (Plan Position Indicator)
Echo
Echosounder
Instruments
Configurable set of screens representing live data from the vessel.
Shown as digits analog/linear gauges
Steer
Navigation information
Video
Live video
Position
GPS Position, SOG/COG and time
Wind Plot
Shows TWD & TWS over a specific time period
Time Plot
Shows selected data over a specific time period
In addition to these panels the following applications can be connected and displayed on
other panels:
Application
Description
AIS
AIS information as an overlay on chart and radar panels
Weather
Weather graphics and data as overlay on chart panel.
GRIB Weather Overlay.
Sirius Weather application is available in North America only.
Audio
SonicHub & Satellite radio functions as a panel along the bottom of a
page.
Sirius Audio application is available in North America only.
Instrument bar
Sensors connected to the system can be viewed in an instrument bar on top of your
screen.
Several display options are available for this bar; refer to the Customizing your
system section.
Operating Zeus
The Zeus system communicates with the user by using menus and dialogs.
Settings menu
The system includes one Settings menu, accessed by pressing the ‘MENU’
key twice. It provides access to system settings, advanced settings for each
function and for vessel specific settings.
x2
MENU
WIN
Context menus
A context menu contains items that are relevant to the current
selection and is accessed by pressing the ‘MENU’ key.
MENU
WIN
Each panel has its own context menu which gives access to basic
functions for that panel.
Plot menu
Used for creating new waypoints, routes and tracks, and for
accessing the waypoints, routes and tracks library.
PLOT
MARK
GO TO
VESSEL
The menu can be accessed independently of the panel that is active.
When the ‘PLOT’ key is pressed any other menu action will be
interrupted.
Goto menu
Used to start the navigation function.
When the vessel is navigating the menu will be expanded to include options
to stop or change navigation.
PLOT
MARK
GO TO
VESSEL
The menu can be accessed independently of the panel that is active. When
the ‘GOTO’ key is pressed any other menu action will be interrupted.
9
Dialogs
Dialogs are used for entering user input or for presenting
information to the user.
A dialog may be presented in full-screen, or as a popup
dialog in the centre of the screen.
Dependent upon the type of information or entry, different
keys are used to confirm, cancel and close the dialog.
Alarm messages
The Zeus system will continually check for dangerous situations
and system faults while the system is running. These are both user
definable.
When an alarm situation occurs, the Alarm window will popup.
If you have enabled the siren, an audible alarm will be activated when
any alarm situation occurs.
Refer to The alarm system section for further information.
10
2. Basic Operation
Turning the Unit On/Off
POWER ON
STAND BY
POWER OFF
3s
PWR
PWR
PWR
If you turn the unit ON when no external equipment is connected you will be asked to
run in simulator mode.
When you turn ON the system after the first-time initialization, the system will start with
the same page and settings that were activated when the system was turned OFF.
If the radar is running you can turn it to standby mode from
within the Light dialog.
PWR
Positioning a Man Over Board Mark
If an emergency situation should occur, you can position a Man Over Board waypoint at
the vessel’s current position by pressing and holding the number ‘1’ key.
When you activate the MOB function the following actions are automatically performed:
-
a MOB waypoint is positioned at the vessel’s position
-
the display switches to a zoomed Chart panel, centered on vessel position
-
Zeus starts navigating towards the MOB waypoint
3s
1MOB
Zeus will continue navigating towards the MOB point until
the waypoint is reached or until you select to stop this
navigation.
PLOT
MARK
GO TO
VESSEL
11
Adjusting the Backlight
The backlight for LCD and keys can be adjusted at any time independent of what is on
the screen.
+
or
PWR
10
1
PWR
MENU
WIN
6
3
A night mode is included and optimized for low light conditions.
Details on the chart may be less visible when the Night mode is selected!
Operating the Menu System
Selecting menu item and confirming selection
You operate a menu by using the rotary knob to select menu item, and then pressing the
knob to confirm your selection.
You can also operate the menu by using the arrow keypad to select an item, and then
the Tick key to confirm a selection.
MENU
WIN
MENU
WIN
The illustrations for menu operation throughout this manual will refer to the rotary knob!
12
Exiting the Menu
By pressing the X key the menu will return to previous menu level, and then exit.
MENU
WIN
Using the Cursor
When you use one of the arrow keys on a Chart, Radar or
Echosounder panel the cursor will become visible. The cursor
information window will show position coordinates at the
cursor position, and range and bearing to the vessel.
On an Echosounder panel the cursor information window will
include the depth at cursor position.
Further use of the cursor is described in the Chart, Radar
and Echosounder sections.
To remove the cursor and cursor elements from the panel, press the X key.
Adding Entries in Dialog Boxes
Selecting entry fieldS
You switch between the entry fields and keys in a dialog box by using the rotary knob or
the arrow keys.
You can enter information by pressing the rotary knob or the Tick key when a field is
highlighted.
Adjusting values
You adjust a numeric value in a field by using the keypad, cursor Up/Down
or the rotary knob.
You need to press the rotary knob first to change the function from
selecting fields to editing the slider.
Entering text
1MOB
2 ABC
3 DEF
4 GHI
5 JKL
6 MNO
7 PQRS 8 TUV
9WXYZ
STBY
AUTO
0
IN
The alpha numeric keypad is used for entering digits and text in dialog boxes.
If digit entries are required the keyboard will input digits only.
If both digits and letters are accepted in a dialog repeated short presses on the key will
cycle through the letters for that key, while a long press will enter the respective digit.
PWR
OUT
KEY
1st press
2nd press
3rd press
4th press/or press
and hold
2 ABC
A
B
C
2
Press the IN key for uppercase letters and the OUT key for lowercase.
Depending on the type of information or entry, you can use different keys to confirm the
entries. When confirmed or cancelled the dialog box will close.
Context help in the dialog boxes
When you select an input field, context
help for that field will be shown.
13
Working with Pages and Panels
Selecting pages
You access a page group by pressing the corresponding ‘DAK’ (Direct Access Key).
CHART
RADAR
ECHO
NAV
INFO
PAGES
The Active ‘DAK’ is indicated with a green symbol right above the
key.
When you press a ‘DAK’ for the first time, the default page for
that group is displayed. When you later switch between the page
groups, the last active page in each group will be displayed.
CHART
RADAR
ECHO
A second press of a Direct Access Key will display a list of available pages for that group.
Selecting active panel
In a split screen you can have multiple panels, but only one panel can be active
at a time. You will only be able to access the context menu of the active panel.
The active panel is outlined with a green border.
MENU
You can switch between active panels by pressing the ‘WIN’ key.
Maximizing active panel
Press and hold the ‘WIN’ key to maximize the selected panel. By pressing the ‘WIN’ key
again the panel will return to the previous split screen view.
3s
MENU
WIN
MENU
WIN
Editing a page
You can edit any page in a page group except the first page. You can also define your
own pages for each ‘DAK’ as described in the Customizing your system section.
14
WIN
3. Using the Simulator
x2
MENU
WIN
Simulator Mode
The simulation mode simulates main data sources, so you can see how the unit works
without being connected to echosounder, radar, GPS etc.
You can use the simulator to help you become familiar with your unit before using it out
on the water.
When the simulator is toggled on, this is indicated in the lower part of
the display.
Demonstration Mode
In this mode the unit automatically runs through the main features of
the product; it changes pages automatically, adjusts settings, opens
menus etc.
If you press a key when demo mode is running, the demonstration will
pause. After a time-out period, demo mode will resume again.
Selecting simulator source files
You can select which data files that should be used by the
simulator.
A set of source files is included in your system, and you can
import files by using a USB stick or a memory card. Refer
to the utilities pages section. You can also use your own
recorded echosounder files in the simulator. For how to record
echosounder files, refer to the Using the echosounder section.
Advanced Simulator Settings
The advanced simulator settings allow you to define how to run the
simulator. When the settings are saved these will be used as default
when starting the simulator mode.
Source files
Selects data to be used.
A set of source files is included in your system, and you
can import files by using a USB stick or a memory card.
Refer to The utilities pages section.
You can also use your own recorded echosounder files in
the simulator.
For how to record echosounder files, refer to the Using
the echosounder section.
GPS source
Selects which source file the GPS data is delivered from.
Speed, Course and Route
Used for manually entering values when GPS source is set to Simulated course or
Simulated route. Otherwise, GPS data including speed and course comes from the
selected echosounder or radar files.
Set start position
Moves the vessel to current cursor position.
15
16
4. Using Charts
The Chart Panel
On the chart panel you can determine your vessel’s position in relation to land. You can
use the chart display for planning routes and sailing along a predefined route.
The chart function can also display your vessel’s position relative to other chart objects,
plan and navigate routes, create waypoints, overlay a radar image and display AIS
targets and weather information.
GRID LINES *
EXTENSION
LINE *
ROUTE *
NORTH
INDICATOR
RANGE
RINGS *
WAYPOINT *
VESSEL
TRACK *
CHART RANGE
RANGE
SCALE
x2
MENU
WIN
* Optional chart image items
You turn the optional images on/off individually.
17
The Vessel Symbol
When a GPS and a suitable compass sensor is connected to the system, the vessel
symbol indicates vessel position and heading. Without a heading sensor fitted, the vessel
icon will orientate itself using COG (Course over Ground).
If no GPS is available the vessel symbol will include a question mark.
Using the Cursor on Chart Panel
When you press one of the arrow keys the cursor will become
visible, and the cursor position window will be activated.
When you are in cursor mode, the chart will not pan or
rotate to follow the vessel.
Pressing the ‘X’ key will toggle the chart position between the
vessel and the previous cursor position.
To remove the cursor and cursor elements from the panel, press the ‘X’ key.
Selecting objects
When you rest the cursor over a chart item, a
waypoint, a route or a target, basic information for
the selected item will be displayed.
By pressing the rotary knob or the tick key when
a chart item is selected, all available information
about that item will be shown.
Popup information has to be enabled.
Creating waypoints and routes
You can use the cursor to position waypoints and routes as described in the Waypoints,
Routes and Tracks section.
Extension Lines
x2
MENU
WIN
The vessel’s extension lines can be activated to show course over ground (COG), heading
or both. The length of the line indicates either the distance selected or the distance that
the vessel will travel at the current speed in selected time period.
Selecting Infinite length will project a continuous extension line.
COG
HEADING
Laylines
When navigating to a waypoint you can configure laylines on the chart to aid navigation.
These lines can be set from the vessel, waypoint or both.
x2
MENU
WIN
To configure the laylines go to the laylines menu.
Layline Options
Boat:
Layline from vessel. The length can be set to 1, 10 or 100
miles.
Mark:
Layline from mark/waypoint. The length can be set at 1, 10 or
100 miles.
If Boat & Mark are selected you cannot set the length as the
laylines join at the tack/gybe point where the laylines meet.
Tidal Flow Correction:
Tidal flow correction will calculate the tidal flow and offset the
laylines accordingly.
Overlapped:
When selected the laylines will extend beyond the tack/gybe
intersection.
True Wind Angle:
There are 3 sources available for true wind angle (TWA). You
can choose between Polar, Actual or Manual.
Polar:
Takes the target TWA from your polar table* (*Polar table is
available in Hercules Performance and Hercules Performance
Motion only).
Actual:
Takes the current value of true wind angle (TWA).
Manual:
Manually input the upwind and downwind numbers into the dialogue boxes.
Limits:
When selected will show a dotted line indicating the minimum
and maximum tack/gybe time period either side of the layline.
This can be set from 5 to 30 minutes.
19
Measuring distance
MENU
WIN
The cursor can be used to measure the distance between your vessel and a position or
between 2 points on the chart panel.
Use the following process to measure a distance.
1
Start the Measure function
2
Move the cursor towards the second measuring
point
-
A line will be drawn from the vessel center to
the cursor position, and the distance will be
listed in the Cursor Information window
You can reset the measurement and start measuring
from the cursor position by pressing the Tick key.
You terminate the measuring function by pressing the ‘X’ key.
Chart Scale
You zoom in and out of the chart by using the ‘IN/OUT’ keys or by
using the rotary knob.
Chart scale will be shown in the lower right corner of the chart
panel.
Searching for Chart Objects
The chart context menu includes a search function used to find and display chart
objects.
This function is also available from the Utilities pages.
Displaying Chart Information
You can display available information for the chart and chart items in cursor or vessel
position.
You can select further details about a selected item by pressing the rotary knob or the
Tick key.
20
Positioning the Chart on the Panel
Selecting chart center
When the cursor is active on the panel, the chart will be centered around the cursor
position (cursor mode).
Pressing ‘X’ key will remove the cursor, and the chart center will be positioned at the
vessel (vessel mode).
You can toggle between cursor mode and vessel mode by pressing the ‘X’ key .
Panning
MENU
WIN
By moving the cursor to the edge of the panel, the chart will be panned in the cursor’s
direction.
Look ahead
This option centres the chart slightly forward of your vessel so that
you can maximise your view ahead.
Setting the chart orientation
Several options are available for how the chart is rotated in the
panel. The chart orientation symbol in the panel’s upper right corner
indicates the north direction.
North up
Displays the chart with the north direction upward. This
corresponds to the usual orientation of nautical charts.
Heading up
Displays the chart with the vessel’s heading directly up
on the chart image.
Heading information is received from a compass. If
heading is not available, then the COG from the GPS
will be used.
Course up
Rotates the chart in the direction of the next waypoint
when in navigation mode.
This option works only when there’s an active route.
If no route is active the heading up orientation will be
used until a route is made active.
Selecting Chart Details Level
Low
This is the basic level of information that cannot be removed, and
includes information that is required in all geographic areas. It is not
intended to be sufficient for safe navigation.
Medium
This is the minimum information sufficient for navigation.
21
Full
This is all available information for the chart in use.
Chart Categories
This option enables you to select which chart categories you want to display on your
chart.
Chart Imagery Style
The charts can be displayed in two different imagery styles.
2D presents chart information in a basic mapping mode, while the shaded relief option
presents chart including terrain information.
2D
MENU
Shaded relief
WIN
Chart Overlay
Radar and weather information can be displayed as overlay on your chart panel.
When one of the overlay options are selected in the chart context menu it will be
expanded to include basic function for the selected overlay.
Radar, GRIB Weather and Sirius weather functions are described in separate sections in
this manual.
Chart Data
x2
The Zeus system can use Insight and Navionics chart databases.
MENU
22
WIN
The Navionics chart includes options that are not available in the
Insight database. Navionics options are described in the following
sections.
Chart Options in Navionics Chart Database
MENU
WIN
Chart view
The Navionics Platinum and Platinum Plus chart databases
provide you with 2D and 3D view options.
2D presents chart information in a basic mapping mode,
3D provides a three dimensional graphical view of land and sea
contours.
3D Zooming
You zoom in and out of the 3D chart by using the ‘IN/OUT’ keys.
Viewing the chart in 3D
There are two modes available for moving the camera in 3D views; Vessel mode and
Cursor mode. You switch between these two modes by pressing the ‘X’ key.
Vessel mode
In this mode the camera follows the vessel. The vessel’s position will be in center if not
Look ahead option is selected. The camera angle is by default as seen from above and
behind the vessel, looking forward. You can tilt the camera by using the up/down arrow
keys, but you cannot rotate the camera horizontally.
Cursor mode
This mode includes two different options for moving the camera; Camera Pan and
Camera Rotate. You switch between these two camera modes by pressing the rotary
knob or the √ key. Active camera mode is shown on top of the panel.
Camera Pan
In this mode you move the camera away from the vessel position and
around in the chart by using the arrow keys. You can rotate horizontally
by using the rotating knob.
You can return to vessel position (vessel mode) by pressing the ‘X’ key.
Camera Rotate
In this mode the camera position is fixed, and the camera can only be
rotated. You rotate the camera horizontally by using the left/right arrow
keys or the rotating knob. You tilt the camera vertically by pressing the
up/down arrow keys.
Photo Overlay
This option enables you to view satellite photo images of an area
as an overlay on the chart.
The availability of such photos is limited to certain regions.
You can view photo overlays in either 2D or 3D modes.
23
The Photo overlay function is disabled as you zoom out beyond a certain level.
Photo transparency
The transparency sets the opaqueness of the photo overlay.
MENU
WIN
Optional settings for Navionics charts
Annotation
Determines what area information is displayed, such as names of locations and notes of
areas.
Presentation type
Provides marine charting information such as symbols, colors of the navigation chart and
wording for either International or US presentation types.
Chart details
Provides you with different levels of geographical layer information.
Safety depth
The Navionics charts use different shades of blue to distinguish between shallow and
deep water.
The safety depth sets the limit for which depths that shall be drawn without this blue
shading.
24
Contours depth
Determines which contours you see on the chart down to the selected contours depth
value.
Navionics Fish’n Chip
MENU
WIN
Zeus supports Navionics Fish’n Chip (US only). Fish’n Chip provides high resolution
bathymetric data.
If enabled, you may notice some other chart features disappear and it may clutter the
screen.
Fish’n Chip data is standard on Navionics Platinum Plus cards.
25
5. Waypoints, Routes & Tracks
Waypoints
A waypoint is a user generated mark positioned on a chart, on a radar image or on an
echosounder image. Each waypoint has an exact position with latitude and longitude
coordinates. A waypoint positioned on an echosounder image will in addition to position
information have a depth value.
A waypoint is used to mark a position you may later want to return to. Two or more
waypoints can also be combined to create a route.
Placing Waypoints
You can place a waypoint at the vessel position from any panel by pressing the ‘PLOT’
key:
PLOT
MARK
-
Short press: activates the Plot menu from which you can select the ‘New Waypoint
at Vessel’ option. The ‘Edit Waypoint’ dialog is opened allowing the entry of specific
details.
-
Press and hold: plots a waypoint at the vessel’s current position.
GO TO
VESSEL
You can position a waypoint at the cursor position on a chart, radar and echosounder
panel by moving the cursor to selected position and then pressing the ‘PLOT’ key.
The waypoint dialogs
You can enter details for a waypoint in the waypoint dialog, activated by pressing the
rotary knob or the Tick key when a waypoint is selected.
The waypoints dialog can also be activated from the Waypoint list. Refer The
Waypoints, Route and Tracks library later in this section.
26
Moving Waypoints
MENU
WIN
A waypoint can be edited in the Waypoint dialog. You can also move the waypoint
manually by using the cursor;
1
Select the waypoint by resting the cursor over it
2
Press the ‘MENU’ key and select the move option
3
Use the arrow keys to move the cursor to a new position
4
Confirm the new position by pressing the rotary knob or the tick key
The moving waypoint mode is indicated on top of the panel.
The waypoints can also be edited from the Waypoint list as
described later in this section.
Waypoint alarm settings
You can set an alarm radius for each individual waypoint you
create.
When the waypoint alarm is toggled ON in the alarm panel, an
alarm message will be activated when your vessel comes within
the defined radius.
If you want to set an alarm radius for a route point, it must first
be converted to a waypoint.
Tracks
A track is a graphical presentation of the historical path
of the vessel, allowing you to retrace your travel. A track
can later be converted to a route in the Tracks dialog
described later in this section.
x2
MENU
WIN
From the factory, the system is set to automatically
track the vessel’s movement. The system will continue
to record the track until the track length reaches the
maximum trail point setting, and will then automatically
begin overwriting the oldest track points.
The automatic tracking function can be turned off from the Tracks library as described
later in this section.
Track Settings
The track is made up of a series of track points connected by line
segments whose length depends on the frequency of track recording.
You can select to position track points based on time settings,
distance, or by letting the Zeus system place track points
automatically when a course change is registered.
The Tracks option must also be turned ON in the chart settings to be visible! Refer the
Chart section.
PLOT
MARK
GO TO
VESSEL
Creating a New Track
You define the track settings and start the
new track from the Plot menu.
A new track can also be started from the
Tracks library described later in this chapter.
27
Routes
A route consists of a series of route points waypoints or
entered in the order that you want to navigate them.
When you rest the cursor over a route, it will turn blue
and the route name will be displayed.
Creating new routes by using the cursor
You can create a new route on the Chart panel as follows:
PLOT
MARK
GO TO
VESSEL
1
Press the ‘PLOT’ key and select the new route option
2
Use the arrow keys to move the cursor to the position for the first route point
3
Confirm the position by pressing the tick key or rotary knob
4
Move the cursor to the position for the next waypoints, and confirm the position by
pressing the tick key or rotary knob again
5
Repeat moving the cursor and pressing the rotary knob until all
waypoints in the route are created
6
Press the ‘MENU’ key to save the route
The Edit route mode and route information is indicated on top of the panel until the route
is saved.
The route can also be created from the Routes list as described later in this section.
Editing a route by using the cursor
MENU
WIN
You can edit a route on a chart panel by using the cursor;
1
Select the route by resting the cursor over it
-
2
Press the ‘MENU’ key and select the edit option
-
3
The Edit route mode and route information is indicated on top of the panel
Move the cursor to where you want to make the edit; a waypoint or a
leg, and press the ‘MENU’ key again to select edit options
-
28
The route will be highlighted
The options available in the Edit route menu depend on if the cursor is
rested over a waypoint or over a leg
4
Use the cursor to add, move or remove any item
5
Press the ‘MENU’ key again and save your edits
The Waypoints, Routes and Tracks Page
The Utilities pages includes a Waypoints, Routes and Tracks page. This gives access to
advanced edit functions and settings for all these items available on your system.
There are several ways to access the library. A couple of them are illustrated below.
You move between the tabs in the library by using the left/right arrow keys.
The edit and settings options are accessed by pressing the ‘MENU’ key when one of the
items is selected.
PLOT
MARK
GO TO
VESSEL
PAGES
29
6. Using the Radar
The radar panel can be set up as a full screen view or combined with other panels.
The radar image can also be displayed as an overlay to existing 2D chart views and 3D
for Navionics. Refer to the Chart section.
The Radar Panel
HEADING
LINE
NE *
NORTH
INDICATOR
IND ATO
OR *
ROTARY
CONTROLS
CON
ORIENTATION
N
COMPASS *
RANGE
ANGE RINGS *
x2
MENU
RANGE
NGE
GE MARKERS
MARK
*
* Optional radar symbology
WIN
You can turn the optional
symbology on/off individually.
The active symbology can be
turned on/off collectively.
30
DATA BAR*
MENU
WIN
The Radar Operational Modes
MENU
WIN
The radar’s operational modes are controlled from the Zeus unit. The following modes
are available:
Off
The power to the radar scanner is turned off
Standby
The power to the radar scanner in on, but the radar is not
transmitting.
The radar can also be turned to standby mode by pressing the
‘PWR’ key.
PWR
Transmit
The scanner is on and transmitting to detect surrounding targets. When transmitting
detects a target it will be drawn on the radar PPI of the Zeus system.
Setting up the Radar Image
Positioning the radar center
You can move the radar PPI center to different positions within the radar panel.
MENU
WIN
The following options are available:
Center
Default setting. The radar PPI center is centered on the radar panel.
Look Ahead
Moves the radar center to the bottom of the panel to give maximum view ahead.
Offset
Allows you to move the PPI center to any location on the radar panel.
1
Select the offset option
2
Use the arrow keys to position the radar center
3
Confirm the settings with the Tick key
Center
Look ahead
Custom
31
Setting the radar orientation
x2
Heading up
MENU
WIN
Rotates the radar image to display the current heading directly up on
the radar image.
North up
Rotates the radar image with North upwards.
Course up
Rotates the radar image to display the current navigation course
directly up.
This option works only when the vessel is navigating. If the vessel
not is navigating the heading up orientation will be used until the
navigation function is started.
Setting the radar motion
You can select how your vessel symbol moves on the radar image.
The radar motion can only be changed when the radar is transmitting.
If there’s no heading data or COG, only Relative Motion mode is
available.
True motion
Your vessel, and moving targets, move across the Radar screen as
you travel. All stationary objects remain in a fixed position.
Relative motion
Your vessel remains in a fixed location on the Radar screen and all
other objects move relative to your position. You can choose the
position of the fixed location, refer as described in Positioning the
radar center.
Relative motion is the default setting.
Changing the image color
Different colors (palettes) can be used to represent detail on your
radar panel.
Using the Cursor on the Radar Panel
The cursor is by default not shown on the radar image.
When you press one of the arrow keys the cursor will be
visible, the cursor position window will be activated.
The cursor can be used to measure a distance to a target,
and to select targets as described later in this section.
To remove the cursor and cursor elements from the panel,
press the ‘X’ key.
32
Optimizing the Radar Image
You may be able to improve the
radar image by adjusting the radar
sensitivity, and by filtering the signals
from effect of random echoes from sea
and weather conditions.
The parameters are adjusted by using
the rotary knob. You select between
the control images by pressing the
rotary knob. Active control will expand
and display its name in full. You can
then adjust the value by turning the
knob
Gain
The gain controls the sensitivity of the radar receiver.
A higher gain makes the radar more sensitive to radar returns, allowing it to display
weaker targets. If the gain is set too high, the image might be cluttered with background
noise.
Gain has 2 modes; Auto and Manual. You cycle through the modes by pressing and
holding the rotary knob. You can only adjust the gain value by turning the rotary knob
when it is in manual mode.
Sea clutter
Sea clutter is used to filter the effect of random echo returns from waves or rough water
near the vessel.
When you increase Sea Clutter filtering the on-screen clutter caused by the echoes of
waves will be reduced.
Sea clutter has 3 modes: auto harbor, auto offshore and manual. A long-press on the
rotary knob will cycle through the modes. You can only adjust the clutter value by
turning the rotary knob when it is in manual mode.
Rain Clutter
The Rain clutter is used to reduce the effect of rain, snow or other weather conditions on
the radar image.
The value should not be increased too much as this may filter out real targets.
MENU
WIN
Rejecting radar interference
Interference could be caused by radar signals from other radar units operating in the
same frequency band.
A high setting will reduce the interference from other radars.
In order to not miss weak targets, the interference rejection should be set low when no
interference exists.
Target boost
This feature increases the size of radar targets, making them easier to see on the radar
panel.
Setting the radar threshold
The threshold sets required signal strength for the lowest radar signals. Radar returns
below this limit will be filtered and not displayed.
Default value: 30%.
33
Dual Radar
With dual radar capability in Zeus it is possible for two radar sources to be displayed
simultaneously. Connect either two Broadband Radars or two Pulse Radars and see both
radar images at the same time.
Selecting Dual Radar Mode
Set the radar screen to show two radar panels.
MENU
WIN
Highlight a radar panel and select which radar you require from the source select option.
You can check which radars are available for selection and set them up by going to Radar
Installation. Here you can select each radar and adjust installation settings accordingly.
x2
MENU
34
WIN
Target Tracking on Radar and Chart Panels
MENU
WIN
Zeus enables you to activate MAPA target tracking through the radar overlay on the
chart page.
Target tracking on chart panel
Target tracking on radar panel
True Motion
If true motion is selected you will be able to view your vessel moving on the radar
screen while the land and it’s environment is stationary. This represents a more ‘real’
representation of the movement of your vessel in relation to surrounding targets.
True Motion radar mode, showing trails and MARPA targets
Fast Scan Mode
If you have a BR24 radar installed on your vessel, you will be able to activate Fast scan.
It works by increasing the speed of the BR24 radar scanner when the range is set to
2nm or less. When activated, this option aids in collision avoidance by giving you more
updates on target movements within your vicinity.
35
Setting a Guard Zone Around Your Vessel
MENU
WIN
A guard zone is a region (either circular or a sector) that you can define on the radar
image. You can also define it if an alarm is activated when a radar target enters or exits
the zone.
Defining a circular zone
1
Activate one of the guard zones
2
Select circular shape
-
3
A circular guard zone will now be positioned on the radar
image
Select the menu option used for adjusting the zone
4
The menu will be removed from the display, and the rotary
symbol for range will be enlarged
Use the rotary knob to adjust the range and
depth.
5
You switch between the range and depth
settings by pressing the rotary knob
Press the ‘MENU’ key to save the guard zone
settings
Defining a sector zone
1
Activate one of the guard zones
2
Select a sector shape
-
3
Select the menu option used for adjusting the zone
-
36
A sector guard zone will now be positioned on the radar
image
The menu will be removed from the display, and the rotary
symbol for range will be enlarged.
4
Use the rotary knob to adjust the range,
depth, bearing and width. You switch
between the adjustable settings by pressing
the rotary knob
5
Press the ‘MENU’ key to save the guard zone
settings
Other Vessels on the Radar Image
MENU
WIN
If MARPA radar(s) or AIS devices are connected to the Zeus system, any targets
detected by these devices will be displayed as an overlay on the chart and on the radar
image. You can also see messages and position for DSC transmitting devices within
range.
For more information refer to the Other vessels on chart and radar image section.
Target tracking
Any target detected by the radar may be tracked using MARPA.
MENU
WIN
1
Select Acquire targets from the menu
2
Position the cursor over the target, and press the ‘tick’ key to confirm
3
Repeat process for more targets
4
Press ‘X’ once you have finished acquiring targets
Once your targets are identified, it may take up to 10 radar sweeps to acquire and then
track the target.
Target setup
Target trails
You can define how long time the trail that each target leaves should
remain on your radar panel. You can also turn OFF target trails.
Clearing target trails from the panel
MENU
WIN
You can clear target trails from your radar panel temporarily. The target trails will start
to appear again unless you switch them off as described above.
Target expansion
You can select to increase the size for all thin targets on the radar panels.
Measuring Range and Bearing to a Target
Using the cursor
When you move the cursor on a radar panel the cursor information
window will be activated.
The cursor window shows range and bearing from your vessel to
cursor position.
Range rings
The range rings are displayed at preset distances from the vessel based on the radar
range.
You can use the range ring to estimate the distance between a radar echo and your
vessel.
37
EBL/VRM
MENU
WIN
The electronic bearing line (EBL) is a line from the center of the vessel. The line’s bearing
remains constant as the vessel moves. The variable range marker (VRM) is a usercontrolled range ring that surrounds the vessel.
The EBL/ VRM function is used to measure the distance and bearing from the vessel’s
position to a target. Two different EBL/VRMs can be placed on the radar image.
Positioning an EBL/VRM
1
Move the cursor to a selected object
2
Press the ‘MENU’ key
3
Select one of the EBL/VRM options
-
-
The menu will be removed from the display,
and the EBL line and the VRM circle will be
drawn on the radar
image.
The EBL/VRM information window will display range and bearing from the vessel to
the marker
4
If required, use the arrow keys to reposition the marker
5
Press the ‘MENU’ key again to save the position
You can reposition a fixed EBL/VRM, turn Off the EBL/VRM info window and
remove the marker from the same menu.
When you reposition the EBL/VRM marker you use the cursor and save the
position as described above.
Radar overlay
You can overlay the Radar image on the Chart. This can help you to easily interpret the
radar image by correlating the radar targets with charted objects.
When the radar overlay is selected, basic radar operational functions are available from
the Chart page’s context menu.
More information on Radar Overlay is available in the Using chart section of this
manual.
38
7.
Other Vessels on Chart and Radar Image
If MARPA radar(s) or AIS devices are connected to the Zeus system, any targets
detected by these devices can be displayed as an overlay on the chart. You can also see
messages and position for DSC transmitting devices within range.
You can define alarms to notify you if a target gets too close or if the target is lost.
AIS vessels on a chart panel
AIS vessels on a radar panel
Target Symbols
The Zeus system use the target symbols shown below:
Symbol
Description
Sleeping AIS target (not moving or at anchor).
Moving and safe AIS target with course extension line.
Acquiring MARPA target. Typically it takes up to 10 full rotations of
scanner
Tracking MARPA target, not moving or at anchor.
Tracking and safe MARPA target with extension lines.
Dangerous AIS target,
illustrated with bold line.
Dangerous MARPA target
Lost AIS target.
Lost MARPA target
Selected AIS target, activated
by positioning the cursor over a
target symbol.
Selected MARPA target
A target is defined as dangerous
based on the CPA, TCPA and AIS
Range settings. Refer Defining
alarm limits later in this
section.
When no signals have been
received within a time limit a
target will be defined as lost.
The target symbol represents
the last valid position of the
target before the reception of
data was lost.
The target will return to default
target symbol when the cursor
is moved.
39
How to Display Other Vessels
x2
MENU
WIN
Icon Filters
Select which targets to display.
Extension Lines
Sets the length of the extension lines for your
vessel and for other vessels.
Heading information is read from active
heading sensor, and COG information is as
received from an active positioning system.
The length of the extension line is either a
set distance e.g. 1 mile, OR the distance the
vessel will move in the selected time period.
COG
HEADING
COG (Course Over Ground) - Dark Red Line
HEADING - Blue Line
Speed & Course
Selects how to use the extension line to
indicate speed and course for targets; either
as true motion in the chart or relative to your
vessel.
AIS Icon Orientation
Sets the orientation of the AIS icon; either
based on heading or COG information.
Receiving MMSI Messages
You need to have your own MMSI number entered in the Zeus
system to be able to receive addressed messages from AIS and
DSC vessels. this prevents your own vessel from being displayed
as a dangerous AIS target, if fitted with an AIS transponder.
The Vessel message option in the alarm settings must be toggled
on if any MMSI message shall be displayed, refer to next page.
40
Defining a Guard Zone Around Your Vessel
You can define an invisible guard zone around your vessel. When a target comes within
this distance from your vessel, the symbol will change to the “dangerous” target symbol.
An alarm will be triggered if activated in the Alarm settings panel.
You can also display information about other vessels from the Vessels page as
described in the Utilities pages section.
MENU
WIN
Finding Other AIS Vessels
You can search for other vessels equipped with suitable AIS devices from your chart
menu or from the Find or Vessels feature in the utilities pages (refer to the Utilities
pages section).
41
8. Echosounder
The Echosounder function provides a view of the water and bottom beneath your vessel,
allowing you to detect fish and examine the structure of the sea floor.
The Echosounder Image
The echosounder displays the water column moving from right to left on the panel.
You can select between single panel view and several split views as described later in
this chapter.
DEPTH
FISH ARCHES
UPPER RANGE
TEMP
GRAPH *
TEMPERATURE
FREQUENCY
ZOOM
GAIN/
COLOR
INDICATORS
RANGE
SCALE
ZOOM BARS
*
DEPTH LINE
*
SEA BED
MENU
WIN
LOWER RANGE
A-SCOPE
*
* Optional echosounder image items
You turn the optional echosounder images on/off individually.
Pausing the Sounder Image
It is possible to turn OFF the sounder transmission from the Zeus unit. When the
echosounder is connected and configured the sounder information will be transferred to
the Zeus system as long as the echosounder is running.
You can freeze the sounder image, allowing you to examine the sounder echoes.
This function is useful when you need to position a waypoint exactly on the echosounder
panel, and if you are using the cursor to measure a distance between 2 elements on the
image.
When the image is paused the echosounder will continue to run and the depth indication
on the panel will be updated.
42
Setting Up the Sounder Display
MENU
WIN
The echosounder panel can be setup as a single view, or with split view where the left
and the right side presents different images.
Split screen options
Zoom
The Zoom mode presents a magnified view of the sounder image on the left side of the
panel. By default the zoom level is set to 2x.
The range zoom bars on the right side of the display shows the range that is magnified.
If you increase the zooming factor the range will be reduced. You will see this as reduced
distance between the zoom bars.
ZOOM
LEVEL
ZOOM
BARS
When Zoom mode is selected, the context menu will expand to include a drop down
menu from where you can select the zoom factor.
Bottom lock
The bottom lock mode is useful when you want to view echoes close to the bottom.
In this mode the left side of the panel shows an image where the bottom is flattened.
The range scale is changed to measure from the seabed (0) and upwards. The bottom
and the zero line will always be shown on the left image, independent on range scale.
ZERO LINE
The scaling factor for the image on the left side of the panel is adjusted as described for
Zoom mode.
43
Setting the Echosounder Range
The range setting determines the depth shown on the display.
MENU
WIN
Auto
If you select Auto, the system will automatically display the whole range from the water
surface to the bottom.
Auto range will automatically be turned off once you adjust the range manually.
Manually changing the range
You can increase or decrease the range by pressing the zoom keys.
IN
OUT
Pressing and holding one of the zoom keys will toggle between auto
and manual range. Autorange is resumed by pressing the “0” key.
When manually change the range the lower depth line will be moved upwards or
downwards. The upper depth line will always be at the water surface.
This options allows you to focus on echoes at the upper part of the water column.
The echosounder frequency
This Zeus unit supports several transducer frequencies. Available frequencies depend on
what transducer that is connected.
You can view two frequencies at the same time by setting up a echosounder split screen.
Selecting the ping speed
The Ping Speed controls the rate the transducer uses to send echosounder waves into
the water. A higher ping speed will yield the best results when you are moving across the
water at a high rate of speed or fishing from a dock. The reverberation of too much ping
speed can cause interference on the screen.
The fish echoes
You can select how you want the echoes to appear on the echosounder image.
TRADITIONAL
FISH ECHOES
Using Colors
x2
MENU
FISH SYMBOLS AND
DEPTH INDICATION
WIN
Color palette
Several display color templates with varying degrees of color and
brightness are available.
Bottom coloring
The bottom coloring option colors the entire bottom area in one
brown shade. This will clearly separate fish and structure from the
bottom.
44
Using the Cursor on the Echosounder Panel
The cursor is by default not shown on the sounder image.
When you press one of the arrow keys the cursor will be
visible, the depth at the cursor position will be shown, the
information window and the history bar will be activated.
You use the arrow keys to move the cursor in any direction
on the display.
To remove the cursor and cursor elements from the panel, press the ‘X’ key.
Using the cursor to position a waypoint
You can position a waypoint at the cursor position by
pressing the ‘PLOT’ key as described in the Waypoints,
routes and tracks section.
When the key is pressed the waypoint symbol and ID are
positioned at the cursor position.
Viewing sounder history
Whenever the cursor is shown on a sounder panel, the green scroll bar is also shown.
The scroll bar shows the image you are currently viewing in relation to the total
echosounder image history stored.
When the scroll bar is on the far right side it indicates that you are viewing the latest
soundings. If you move the cursor to the left side of the screen the history bar will start
scrolling towards left, and the automatic scrolling as new soundings are received will be
turned off.
To resume echosounder scrolling, move the cursor to the right until the green history bar
reaches the right side of the image, or press the ‘X’ key.
Measuring distance
MENU
WIN
The cursor can be used to measure the distance between the position of two
observations on the sounder image. It is easier to use the measure function when the
sounder image is paused.
Use the following process to measure a distance:
1
Move the cursor to the first
measuring point
2
Start the Measure function
3
Move the cursor towards the second
measuring point
-
A line will be drawn from the first
point to the cursor, and the distance
will be listed in the Information
window
You can reset the measurement by pressing the Tick key.
When you press the ‘X’ key the echosounder will resume to normal scrolling.
45
Optimizing the Echosounder Image
Several parameters can be adjusted to
optimize the sounder image.
Gain
The gain controls the sensitivity of the
echosounder.
The more you increase the gain, the
more details will be shown on the
image. However, a higher gain setting
may introduce more background clutter
on the image. Conversely, if the gain
is set too low weak echoes may not be
displayed.
Auto gain
The Auto gain option will keep the sensitivity at a level that works well under most
conditions.
With the gain in auto mode, you can set a positive or negative offset that gets applied to
the auto gain. This is indicated as A-40 - A40.
Color
The strength of the echo is symbolized by colors. A strong return will be shown with
reddish-brown color, while a weak signal will be light blue (depending on which palette
you select).
The more you increase the Color, the more echoes will be displayed as reddish-brown.
Adjusting the Gain and Color gain settings
Gain and Color are adjustable by using the rotary knob.
You select between Gain and Color by pressing the rotary knob. The active control will
expand and display it’s name in full. You can then adjust the value by turning the knob.
If you press and hold the rotary knob when Gain is selected, you switch between Auto
and Manual gain option.
PLOT
MARK
GO TO
VESSEL
If no adjustments are made within 3 seconds the controls will return to default size.
Noise rejection
Echosounder signal interference from bilge pumps, engine vibration and air bubbles can
clutter the sounder image.
The noise rejection option filters the impact of echosounder signal interference by
reducing the on-screen clutter.
46
Clarity
MENU
WIN
Wave action, boat wakes and temperature inversion can cause on-screen clutter near the
surface.
The surface clarity option reduces surface clutter by decreasing the sensitivity of the
receiver near the surface.
Recording the Echosounder Data
You can record echosounder data and save the file internally in the Zeus unit.
You can select how many bytes per seconds that is to be used when saving the log file.
More bytes yields better resolution, but will cause the record file to increase in size
compared to using lower byte settings.
When the echosounder image is being recorded, there will be a flashing red symbol and
a logging message will appear periodically at the bottom of the screen.
The sounder recording is stopped by repressing the ‘MENU’ key.
47
Viewing the recorded sounder data
The recorded sounder images are stored internally in the Zeus unit, and can be reviewed
when selected.
The log file is displayed as a paused image, and you get access to the replay and echo
options by pressing the ‘MENU’ key.
You exit the replay mode by pressing the ‘X’ key.
48
9. StructureScan
StructureScan provides underwater panoramic views from your vessel that are not
available in normal echosounder functionality.
StructureScan must be activated in Advanced setup in the System Settings menu before
the StructureScan display and menu items are available on the Zeus unit.
StructureScan has two functional views: Sidescan and DownScan; both views can be
used in conjunction with your Zeus echosounder to provide more sonar imaging options.
StructureScan can save waypoints, review history and create sounder logs.
StructureScan Panel
StructureScan is accessed via the ECHO key.
x2
ECHO
StructureScan can also be set up in one of the other page groups accessed by the ‘DAK’
keys. It can be set up as a single panel or as one of the panels in a mult-panel page.
The StructureScan Image
StructureScan enables you to view under your vessel; it provides extra views on the
panel, either moving from right to left on the panel (SideScan mode), or from top to
bottom (DownScan mode).
SIDESCAN
(LEFT ONLY)
DOWNSCAN
(DOWN)
Pausing StructureScan
MENU
WIN
It is not possible to turn OFF the StructureScan transmission from the Zeus unit. When
the StructureScan is connected and configured the StructureScan information will be
transferred to the Zeus system as long as structureScan is running and connected.
You can freeze the StructureScan image, allowing you to examine the structures and
other images in more depth and detail.
This function is useful when you need to position a waypoint exactly on the
Structurescan SideScan or DownScan views, and if you are using the cursor to measure
a distance between 2 elements on the image.
When the image is paused, it will continue to run and the depth reading on the panel will
be updated.
49
Setting Up the StructureScan Display
The StructureScan panel can be setup with different views; either as a single view (Left
Only, Right Only or Down), or double view (Left + Right) this view presents the left and
right side of your vessel underwater.
MENU
WIN
SideScan
Enables you to view the structure and terrain without having to navigate your vessel over
the top of your destined course. It has high-resolution detail with 152 m side-to-side
underwater views. It is designed to cover more water in less time; and provide views
in both the left and right sides under your vessel, using the water column in centre of
display.
DownScan
Broadcasts a beam downwards that displays a high-detail sonar image scanning focused
down below your vessel. It provides you with the same high resolution that is displayed
from right to left of display panel.
Zoom
You can select different zooming levels on the StructureScan image.
SELECTED
ZOOM
LEVEL
By default the zoom level is set to Off.
Setting StructureScan range
The range setting determines the depth shown on the display.
Auto
If you select Auto, the system will automatically display the whole range from the water
surface to the bottom. Auto range will automatically be turned off once you adjust the
range manually.
Manually changing the range
You can increase or decrease the range by pressing the zoom keys.
IN
OUT
Pressing and holding one of the zoom keys will toggle between auto and manual range.
Autorange is resumed by pressing the “0” key.
When manually changing the range the lower depth line will be moved upwards or
downwards. The upper depth line will always be at the water surface.
This options allows you to focus on echoes at the upper part of the water column.
The StructureScan frequency
Structurescan supports transducer two frequencies. 455kHZ is ideal for greater depth
and distance and 800kHZ provides better definition.
50
Using Structure Palettes
Several display structure templates with varying degrees of
color and brightness are available.
x2
MENU
WIN
Using the Cursor on the StructureScan
Panel
When you press one of the arrow keys the cursor will be
visible, the depth at the cursor position will be shown, the
information window and the history bar will be activated.
You use the arrow keys to move the cursor in any direction
on the display.
To remove the cursor and cursor elements from the panel, press the
‘X’ key.
Using the cursor to position a waypoint
You can position a waypoint at the cursor position by pressing the
PLOT key as described in the Waypoints, routes and tracks
section.
When the key is pressed the waypoint symbol and ID are
positioned at the cursor position.
Viewing StructureScan history
Whenever the cursor is shown on a StructureScan panel, the
green scroll bar is also shown. The scroll bar shows the image you
are currently viewing in relation to the total StructureScan image
history stored.
Depending of the view selected either DownScan or SideScan modes— when the scroll
bar is on the far right side (DownScan) or at the bottom of the screen (SideScan)— all
indicates that you are viewing the latest soundings.
Therefore, if you move the cursor to the left side of the screen (DownScan mode) the
history bar will start scrolling towards left, and the automatic scrolling as new soundings
are received will be turned off. Conversely, if you move the cursor upwards (in SideScan
mode) the history bar will start scrolling upwards, and the automatic scrolling as new
soundings are received will be turned off.
To resume StructureScan scrolling, move the cursor until the green history bar reaches
either the right side of the image (DownScan) or bottom of the image (SidenScan), or
press the ‘X’ key.
Measuring distance
MENU
WIN
The cursor can be used to measure the distance between the position of two
observations on the StructureScan image. It is easier to use the measure function when
the sounder image is paused.
Use the following process to measure a distance:
1
Move the cursor to the first measuring point
2
Start the Measure function
3
Move the cursor towards the second measuring
point
-
A line will be drawn from the first point to the
cursor, and the distance will be listed in the
Information window
You can reset the measurement by pressing the Tick key.
When you press the ‘X’ key the echosounder will resume
to normal scrolling.
51
Optimizing the StructureScan Image
Several parameters can be adjusted to optimize the StructureScan image.
Color
The strength of the echo is symbolized by colors. A strong
return will be shown with a reddish-brown color, while a weak
signal will be light blue (depending on which palette you select).
The more you increase the color, the more echoes will be
displayed as reddish-brown.
Adjusting the color settings
Color is adjustable by using the rotary knob.
The active control will expand and display it’s name in full. You can then adjust the value
by turning the knob. If no adjustments are made within 3 seconds the controls will return
to default size.
Noise rejection
StructureScan signal interference from bilge pumps, engine vibration
and air bubbles can clutter the StructureScan image.
The noise rejection option filters the impact of StructureScan signal
interference by reducing the on-screen clutter.
Flip left/Right function
This function controls the orientation of both StructureScan functions:
SideScan and DownScan.
If your transducer is installed with the cable end pointing away from
the back of your vessel; the Flip left/right function will ensure that
what is on the left or right side of your vessel matches what is on your
display.
MENU
WIN
Clarity
Wave action, boat wakes and temperature inversion can cause on-screen clutter near the
surface.
The surface clarity option reduces surface clutter by decreasing the sensitivity of the
receiver near the surface.
52
Recording the StructureScan Data
You can record structurescan data and save the file internally in the Zeus unit.
x2
MENU
WIN
You can select how many bytes per seconds that are to be used when saving the log
file. More bytes yield better resolution, but will cause the record file to increase in size
compared to using lower byte settings.
When the StructureScan image is being recorded, there will be a flashing red symbol and
a logging message will appear periodically at the bottom of the screen.
Recording Symbol
Logging Message
The sounder recording is stopped by repressing the ‘MENU’ key.
53
Viewing the recorded sounder data
The recorded sounder images are stored internally in the Zeus unit, and can be reviewed
when selected
The log file is displayed as a paused image, and you get access to the replay and echo
options by pressing the ‘MENU’ key.
You exit the replay mode by pressing the ‘X’ key.
54
10. Navigating
The navigation function included in the Zeus allows you to navigate towards the cursor
position, a position defined by latitude and longitude values, a waypoint or along a
predefined route.
For information about positioning waypoints and creating routes, refer the Waypoints,
Tracks and Routes section.
PLOT
MARK
GO TO
VESSEL
Start Navigating
Using the GOTO key
You can start navigation from any panel by pressing the ‘GOTO’ key. The ‘GOTO’ cursor
option will only be available when the cursor is active on a Chart, Radar or Echosounder
panel.
Using the cursor
You can start navigating a route on a chart panel by moving the cursor over the route
and then pressing the ‘MENU’ key.
MENU
WIN
Selecting start point
You can navigate a route starting from any waypoint by positioning the cursor over the
selected waypoint and pressing the ‘MENU’ key.
MENU
WIN
Cancel Navigation
You cancel navigation by pressing the ‘GOTO’ key and
selecting ‘Cancel navigation’.
PLOT
MARK
GO TO
VESSEL
55
Navigation Parameters
x2
MENU
WIN
Navigation method
Different methods are available for calculating the distance and
bearing between any two points on a chart.
The great-circle route is the shortest path between two points.
However, if you are to travel along such a route, it would be
difficult to steer manually as the heading would constantly be
changing (except in the case of due north, south, or along the
equator).
Rhumb lines are tracks of constant bearing. It is possible to
travel between two locations using Rhumb line computation, but
the distance would usually be greater than if Great circle is used.
Steering alarm limits
Arrival radius
Sets an invisible radius around the destination waypoint.
When the arrival alarm is activated, an alarm will appear when the
vessel is within this radius.
Off course limit
This parameter defines the vessel’s accepted offset distance from the
leg. If the vessel goes beyond this limit an alarm will be activated.
Off course alarm must be enabled/disabled in the alarm panel.
Magnetic variation
Converts magnetic North data to true North.
Auto automatically converts magnetic north to true north. When using manual mode,
you will have to input the local magnetic variance.
Datum
Most paper charts are based on the WGS84 datum, Zeus also uses WGS84.
If your paper charts are based on a different datum you can change the setting in the
Zeus system to match your paper charts.
Coordinate system
Controls the format of lat/lon coordinates displayed on the panels.
Phantom Loran
Enables phantom loran, for waypoint entry, vessel and cursor position display.
Loran settings
Allows setting of GRI and preferred TD pairs for vessel and cursor position display.
56
Navigation Panels
The Steer and Position panels can be used to display information when you are
navigating.
The Steer panel
DATA
FIELDS
USE LEFT/
RIGHT
ARROW TO
TOGGLE
VESSEL
SYMBOL
COURSE
LINE
OFF COURSE
LIMIT
Data fields
The Steer panel offers the following information:
DTD
Distance to destination
BTW
Bearing to waypoint
SOG
Speed over ground
COG
Course over ground
TTD:
Time to destination
ETA:
Estimated time of arrival at next waypoint
VMG:
Velocity Made Good towards next waypoint.
STEER:
Course to steer towards next waypoint
The course line
When travelling on a route the course line shows the intended course from one waypoint
towards the next.
When navigating towards a waypoint (cursor position, MOB or an entered lat/
lon position), the course line will show the intended course from the point at which
navigation was started towards the next waypoint.
Vessel symbol
The vessel symbol indicates distance and
bearing relative to the intended course.
Off course limit
If the XTE exceeds the defined off course
limit (refer below), this will be indicated
with a red arrow including the distance
from the track line
If the off course alarm is enabled, the alarm will activate if the XTE exceeds the defined
off course limit.
57
Position panel
Data fields
• Position in Latitude/Longitude
• Time
• Date
• SOG
• COG
Data History
Data history, wind and time plots can be accessed via the info page.
x2
INFO
Heading
Apparent
Wind
Angle
True
Wind
Speed
True
Wind
Speed
True
Wind
Direction
Above is an example of the history data page. There are 2 standard layouts. Layout 1
displays 4 Time Plots alongside the Wind Plot, layout 2 displays 3 Time Plots alongside
the Wind Plot. You can change between layout 1 and 2 via the info menu.”
58
Editing the Time Plot / Wind Plot Info Page
All of the data windows can be configured to show the data you require via the edit
menu.
MENU
WIN
Select the data field you wish to change.
MENU
WIN
Select the required information.
MENU
WIN
Saving the changes will return you to the wind and time plot screen, displaying the
new configuration. You can cancel the changes at anytime before you save by selecting
cancel.
59
Missing Data
If instrument data is unavailable the time plot will turn into a dashed line and flatten out
at the point data was lost.
When data becomes available again a dashed line will join up the two points showing an
average trend line where the missing data is.
Barometric Pressure data is stored on the unit even if power is switched off. This enables
the unit to display data from a previous day. Data is not recorded whilst the unit is off.
60
11. Information Panels
Instrument Panels
The instrument panel consists of multiple gauges — analog, digital and bar — that can be
customized to display selected data. The instrument panel displays data on dashboards,
and you can define up to ten dashboards within the instrument panel.
MENU
WIN
Switching Between Dashboards
You switch between a panel’s dashboards by using the left and right arrow
keys or by selecting the dashboard from the menu.
MENU
WIN
Dashboard Styles
Four dashboard layouts are predefined to display gauges showing relevant information
for sail, navigation, cruise and race environments.
1. Sail dashboard
2. Navigation dashboard
3. Cruise dashboard
4. Race dashboard
Adding dashboards
MENU
WIN
There can be up to 10 dashboards within each instrument panel. In addition to the 4
predefined dashboards you can design your own based on the predefined dashboard
styles.
61
Customizing a Dashboard
You can customize a dashboard by changing the dashboard style, and by changing the
data for each of the gauges in the dashboard. You can also set limits of analog gauges.
MENU
WIN
Available editing options will depend on type of gauge and which data sources that are
connected to your system.
When a dashboard is in editing mode, this will be indicated in the upper
right corner
Select the data field you wish to change.
MENU
WIN
Select the required information.
MENU
WIN
Saving the changes will return you to the dashboard screen, displaying the new
configuration. You can cancel the changes at anytime before you save by selecting
cancel.
62
12. H3000 Performance Functions
When connected to H3000 instruments via H-Link and H-Link Comms switched on you
can access the H3000 Calibration menu. In H3000 Calibration you can edit the true wind
angle correction and true wind speed correction tables.
You can also load and edit polar tables via this menu (Hercules Performance & Hercules
Motion Only).
Polar Tables
The H3000 instrument system has the ability to store a polar table in its memory.
Multiple polar tables can be saved on your Zeus unit and can be loaded from there onto
your H3000 CPU. Note: Only one table can be used at any one time.
Loading a Polar Table to Zeus Memory
Insert a USB stick or Memory card that contains a polar table into the USB/Card port on
the front of the Zeus unit. To view the contents go to Files menu.
Ensure ‘Memory Card - USB Front’ is highlighted and press the right arrow key to enter.
Use the arrow keys to highlight the required polar file.
MENU
MENU
WIN
WIN
63
Press ‘Menu’ Select ‘Copy” and press enter.
Once you have selected the file from your portable memory, highlight the polar directory
on the Zeus unit using the arrow keys.
Press enter to copy the polar file to the polar directory. It will now appear in the polar
directory.
Loading a Polar Table from Zeus into H3000
Go to H3000 Calibration in the ‘Pages’ menu. Select ‘Polars’.
The file entitled ‘H3000 Polar Data’ will always be your current file loaded on H3000.
Highlight the polar file you want to load onto your H3000 system. Select ‘Menu” Highlight
‘Load into H3000” and press ‘Enter’.
This action will overwrite the polar stored in H3000. We recommend you backup your
polar files. (See next page).
64
Editing a Polar Table
It is possible to edit a polar table via Zeus to match the performance of your boat to
improve the consistency of the data and performance of your instrument system.
You can edit the polar numbers by row or by cell.
To edit a polar table select the table you wish to edit via the H3000 Calibration menu.
Press ‘Menu’ ‘Edit’
Use the arrow keys to navigate the cells of the polar table. Highlight the cell you wish to
edit and use the rotary knob to adjust the number up or down as desired.
Alternatively pressing menu on the highlighted number will open an edit dialogue box
and the number can be adjusted via that.
To edit an entire row by the same percentage highlight the cell to the far left of the row
under the TWS header. Press ‘Menu’ adjust the percentage with the rotary knob. Press
‘Enter’ to complete.
Backup a Polar Table
To backup the current polar data being used by H3000, highlight ‘H3000 Polar Data’ in
the polars menu. Press ‘Menu’ Select ‘Backup’ Name the file accordingly.
65
TWA Correction Table
The TWA Correction table receives its information from the H3000 instrument data and
does not store this information on the Zeus unit.
Any changes made to this table via Zeus will automatically change the H3000
instruments and be stored on H3000.
Editing the TWA Correction Table
Select the field you wish to edit using the arrow keys. Turn the rotary knob to adjust the
number. Change all cells accordingly. When complete press ‘Menu’ and select save to
save your changes.
TWS Correction Table
The TWS Correction table receives its information from the H3000 instrument data and
does not store this information on the Zeus unit.
Any changes made to this table via Zeus will automatically change the H3000
instruments and be stored on H3000.
Editing the TWS Correction Table
Select the field you wish to edit using the arrow keys. Turn the rotary knob to adjust the
number. Change all cells accordingly. When complete press ‘Menu’ and select save to
save your changes.
66
13. The Utilities Pages
The utilities pages include options and tools that are not specific to any panel.
These pages act different to the chart, radar, echo etc. They are always full screen, and
you cannot use them in a split page with any other panels.
A utility page will open on top of your previous page. When you close a dialog in one of
the utilities pages the utilities function will close and the display will return to last active
page.
The utilities pages are accessed and operated as for normal menu operation.
You switch between different tabs in a page by using the arrow keys. You can also access
a page by using the numeric key as indicated on each icon.
Any listing in the utilities pages has a context menu, giving access to available options
for the selected item. The context menu is displayed by pressing the ‘MENU’ key.
Vessels
Status listing
List of all AIS, MARPA, and DSC vessels with available
information.
Message listing
List of all messages received from other AIS vessels
with time stamp.
Alarms
Active alarms
List of active alarms.
Alarm history
List of all alarms with time stamp.
Alarm settings
List of all available alarm options in the system, with
current settings.
67
H3000 Calibration
Polars
Select, edit or backup polar data
TWA Correction
True Wind Angle correction table
TWS
True Wind Speed correction table
Satellites
When selected you will see the status page for active
satellites.
When H-Link is disabled the H3000 Calibration icon is
replaced with Satellites icon.
Find
Search function for several chart items.
By pressing the MENU key you get access to available
options for the selected item.
Waypoints/routes/tracks
List of waypoints, routes and tracks with details.
68
Trip Log
Trip 1 / Trip 2
Displays voyage and engine information, with reset
option for all data fields.
Today
Displays voyage and engine information for current
date. All data fields will be automatically reset when the
date changes.
Sun/Moon
Displays sunrise, sunset, moonrise and moonset for a
position based on entered date.
Tides
Displays tide information for the tide station nearest to
your vessel.
You can use the arrow keys to page to selected date.
Available tide stations can be selected by using the
MENU key.
Files
File management system for files, waypoints, routes,
tracks and settings.
By pressing the MENU key you get access to available
options for the different file types.
69
14. Customizing Your System
Page Setup
Your Zeus system includes a set of predefined pages for each page group accessed by
the Direct Access Key (DAK). The list of available pages is displayed when you press the
‘DAK’ for the active page.
Each page group can have up to 5 pages, organized as single panels or as a combination
of panels. The first item in each page list will always be a full size page for the panel
related to that page group.
There can be up to 4 panels on each page, and the layout can be arranged as illustrated
below. The numbers indicated on each page shows the order in which the panels will be
added.
1
1
2
1
2
1
2
3
4
3
The graphics on the next page illustrates how a page is added and panels defined for the
RADAR page group. The process is identical for each page group.
You can add, remove and replace panels from the same menu.
The illustration does not indicate how you use the rotary knob to maneuver in the menu
and confirm a selection. This is described in the Basic Operation section.
70
RADAR
MENU
WIN
MENU
WIN
71
Adjusting Panel Size
You can adjust the size of the panels in a multi panel’s page by pressing the page group’s
‘DAK’.
The illustration below shows how you change the size of a 3-panels Chart page.
CHART
MENU
WIN
x2
INFO
Setting the Appearance of the Instrument Bar
Data sources connected to the system can be viewed in an instrument bar
on top of your screen.
You can choose to turn the instrument bar off; display either one or two
rows, or set it to alternate the rows automatically.
You can also select to show it on a specific page only, or on all pages.
Selecting data sources
72
1
Turn the rotary knob to highlight the instrument bar on top of the dialog
2
Press the rotary knob to highlight the first instrument field
3
Rotate the knob to select data source, and press the knob to confirm
4
Use the rotary knob to move to next data field
5
Continue using the rotary knob until all data fields are defined
6
Press the ‘X’ key to return to normal operation
Changing System Settings
x2
MENU
WIN
The system settings menu provides access to advanced settings for
your Zeus unit and determines the way your Zeus unit displays various
user interface information on the display.
Selecting language
When you select your desired language; all panels, menus and dialogs
will change accordingly.
Text size
Used for adjusting the size of the text on the menus.
Default setting: Normal
Key beeps
A tone (key beep) will sound when any key is pressed on your Zeus unit.
Default settings: On
Time
Allows you to select time format, date format and account for differences in time zone
when using the Zeus unit in a different time zone (Local Offset).
Sirius Audio
Used for activating the Sirius satellite radio function (US only).
Screen capture
If screen capture is selected it allows you to save images of your screen by pressing the
‘PWR’ key.
The image files can be moved or copied to USB or memory card. Refer to the Utilities
pages section
While Screen Capture is enabled it is not possible to change the lighting level. Screen
Capture is disabled if the unit is powered off.
Restore defaults
Allows you to restore all settings back to factory default.
Power control
Defines how power is controlled on Zeus units in a networked system.
Advanced
Contains advanced setup features.
About
Displays your Zeus unit’s current software version.
73
15. Weather
GRIB Weather
GRIB is the format used by the meteorological institutes of the world to transport and
manipulate weather data. You can import GRIB files via a memory card or USB key onto
the Zeus unit and overlay the information onto your charts.
GRIB Symbols explained
Zero knots / Indeterminate wind direction
Wind direction
Small Barb value = 5 knots
Wind Direction
Large Barb value = 10 knots
Wind direction
Arrow Barb value = 50 knots
Wind Direction
2 x Large Barbs 1 x Small Barb = 25 knots
The wind tail indicates the relative wind direction from 0 to 359º. Wind speed is indicated
by a combination of small and large barbs at the end of the wind tail. If a combination
of 5 and 10 knot barbs are shown on a tail then these will need to be added together to
give you the total wind speed. The example below left shows 3 x large barb + 1 x small
barb = 35 knots. Below right shows 60 knots in a different direction, 1 x 50kn arrow + 1
x Large barb.
Large Barbs
Direction
Small Barb
50kn Arrow
Large Barb
Loading a GRIB File to Zeus Memory
Note: Zeus does not come pre loaded with any GRIB files.
To load a GRIB file onto your Zeus unit, insert a USB stick or Memory card that contains
a GRIB file into the USB/Card port on the front of the Zeus unit. To view the contents go
to Files menu.
MENU
74
WIN
Ensure ‘Memory Card - USB Front’ is highlighted and press the right arrow key to enter.
Use the arrow keys to highlight the required GRIB file.
Press ‘Menu’ Select ‘Copy’ and press ‘Enter’.
MENU
WIN
Once you have selected the file from your portable memory, highlight the Gribs directory
on the Zeus unit using the arrow keys.
Press ‘Enter’ to copy the GRIB file to the Gribs directory. It will now appear in the Gribs
directory.
Importing a GRIB File
To import a GRIB file into the active memory of the Zeus unit, highlight the required
GRIB file previously loaded into the Gribs directory, press ‘Menu’, highlight Import and
press ‘Enter’. If a GRIB file has been loaded previously a warning box will appear and ask
if you wish to overwrite.
Alternatively you can import the GRIB file direct from your portable memory device.
Highlight the GRIB file, press ‘Menu’ select Import, press ‘Enter’.
Note: GRIB files that are imported direct from portable memory will not be saved to the
Gribs directory and will be lost when a new GRIB file is imported.
MENU
WIN
Switching GRIB Overlay On
Once a GRIB file is imported to Zeus then that GRIB data can be switched on and will
overlay GRIB information on the relevant area of the chart.
75
MENU
WIN
Selecting GRIB Forecast Time
The GRIB file contains forecast information for a set number of days. It is possible to
animate the weather data and move forward in time to see the predicted forecast for a
specific time and date. These time scales vary depending on the file you are using.
Once animate is selected, time and speed dials will appear on the right hand side of the
screen and a data panel will appear in the bottom left corner.
Animation
Time & Speed Dials
Data Panel
Press the rotary knob to change between the time and speed dials. Press the enter key
to close animation and return to the chart.
Time Dial
The time dial enables you to manually change the time and date of the GRIB overlay
and see the predicted forecast for that specific time. The time increments may vary
depending on the GRIB file.
Once animate has been selected turn the rotary knob to adjust the time dial which will
change the time and date of the overlay. As you move the dial it is likely that you will see
the GRIB symbols change on screen reflecting the shift in wind speed and direction.
The time shift shown in the time dial will be relative to the current time as provided by a
GPS unit connected to Zeus or via H-Link.
As a GRIB file ages it will be possible to see the historic data represented in minus hours
until the file becomes outdated. Once it is outdated it reverts to the time frame being
relative to the earliest forecast in the file.
If no current time is provided via GPS then the GRIB file time is only relative to the
earliest forecast in the file and will not show a real time weather representation
76
Speed Dial
MENU
The speed dial enables you to turn on animation and view the progression
of the forecast over time, without manual adjustment. The speed dial has 3
animation speeds low, medium and high. The default position of the dial is off.
WIN
Select the speed you wish to view the animation by turning the rotary knob.
The GRIB overlay will change incrementally until it has shown all of the
available GRIB information on that file then it will return to the present time
and start over again. The animation will continue on loop until it is switched
off or cancelled by pressing ‘Enter’.
GRIB Disclaimer
GRIB weather files contain weather forecast data, by their nature weather forecasts are
not 100% accurate or reliable and should be used only as a guide. Wind data in the GRIB
files displayed on Zeus are the mean ground wind speed and direction at 10m altitude,
various factors such as mast height, tides/currents and gusts will affect the actual
True Wind experienced when sailing. Note: data becomes less accurate as the file gets
older (i.e. day 3 on the 20th sept forecast is not as accurate as day 2 on the 21st sept
forecast).
Sirius Weather (North America Only)
When connected to a Navico Weather Module MKII, you can subscribe and include Sirius
audio and Sirius Marine Weather Service on your Zeus system.
Sirius audio and weather service covers inland US waters and coastal areas into the
Atlantic and Pacific oceans, Gulf of Mexico and the Caribbean Sea.
The audio and weather products received vary depending on your selected subscription
package. For more information refer to www.sirius.com.
The Sirius weather option can be displayed as overlay to your chart panel.
When activated, weather options become available in the Chart menu.
SST
COLORED
BAR *
PRECIPITATION *
FORECAST WIND
BARBS *
* Optional weather image items
You turn the optional weather graphics on/off
individually.
Setting up the weather image
Weather icons
The Zeus system use different icons to present
weather conditions. The weather icons can be turned
on/off individually.
77
Weather overlay transparency
The transparency sets the opaqueness of the weather overlay.
Color Codes
The system uses shades of color on the weather image
to indicate sea surface temperature (SST), and also for
indicating wave height.
By adjusting these limits you can select how the system
uses the color scheme to separate between warm/cool water
and minimum/maximum wave height.
Weather Forecast
Selecting a marine forecast zone
You can setup the system to read the forecast for a selected area.
The context help in the dialog shows how to use the keys to select marine zone.
If no area is selected the system will read the forecast for your current vessel position.
Tropical statements
You can read tropical statements including information about tropical weather conditions.
These statements are available only for specific areas.
Weather Alarm Settings
You can define several alarms to warn you when severe
weather forecast is received within the specified range
of your vessel, within your selected marine zone or
within a specific range from your vessel (watch box).
78
16. Audio
Sonic Hub
The SonicHub is a high-quality marine audio server that allows you to use your unit
to control audio playback from a variety of sources, including iPod, iPhone, USB mass
storage device (mp3), satellite (SIRIUS™) and AM/FM radio.
Connect a video-capable iPod or iPhone to the dock and you can watch video on your
Zeus unit.
Sirius Audio
MENU
WIN
When connected to a Navico Weather Module MKII, you can subscribe and include Sirius
audio and Sirius Marine Weather Service on your Zeus system.
Sirius audio and weather service covers inland US waters and coastal areas
into the Atlantic and Pacific oceans, Gulf of Mexico and the Caribbean Sea.
The audio and weather products received vary depending on your selected
subscription package. For more information refer to www.sirius.com. When
the Sirius audio is turned on, a scrolling media bar will appear at the bottom
of the active panel.
The media bar acts as a panel, and you switch focus between other panels
and the media bar by pressing the ‘WIN’ key.
ACTIVE
ACT
CTI
IV
CHANNEL
MED
MEDIA
EDI
BAR
SIGNAL
IG
GNA
STRENGTH
Operating the Sirius Audio
When the media bar is active on your screen, you can operate the audio by using the
following keys:
IN
OUT
Increase/decrease volume
Up/down arrow keys to page to next/previous radio channel
MENU
WIN
The audio can be muted and the volume adjusted from the
Sirius Radio menu.
MENU
WIN
79
The radio channels list
MENU
WIN
The channels list displays all available Sirius channels, whether or not you have a
subscription for the channel.
Adding channels to favorites list
You can create of list of your favorite channels from within the channels list.
When a favorite list is available, you page through this list when you use arrow keys; not
through the entire list of subscribed channels.
Locking channels
You can lock selected channels from being broadcast unless an
unlock code is entered.
When the function is activated, the lock code dialog will be
displayed and a 4 digit code must be entered before the locking is
activated.
The same dialog will be displayed and correct code must be entered
before a locked channel can be released.
80
17. Using Video
The video function allows you to connect optional cameras to your Zeus system.
The video images will not be shared with other Zeus units via the network!
The Video Panel
The video panel is accessed via the INFO key.
x2
INFO
The video panel can also be set up in one of the other page groups accessed by the ‘DAK’
keys. It can be set up as single panel or as one of the panels in a multi-panel page.
The video image will be proportionally scaled to fit into the video panel. Area not covered
by the image will be colored black.
If a multi-panel page layout is selected for the video image, it is recommended to
adjust the panel size to fit the image size. For how to adjust panel size, refer to the
Customizing your Zeus system section.
The graphics below show images from a thermal imaging camera.
Customizing Your Video Settings
MENU
WIN
Selecting video source
Zeus supports two video input channels. You can select to view one channel only, or to
cycle the image between available video cameras.
The cycle period can be set from 5 to 120 seconds.
Mirroring the video image
Video input can be set to display a mirror image. This setting can be helpful for rearfacing cameras used to back-down the vessel.
81
Optimizing the Video Image
You can optimize the video display by adjusting the video image settings.
Default for all settings: 50%.
Selecting Video Standard
Zeus supports NTSC and PAL video. The two channels are set up individually. Check the
local video standard or the standard of your cameras.
82
18. The Alarm System
Alarms can be set via the Zeus display to indicate warning messages when set
parameters are exceeded, data is unavailable or other general warnings that you wish to
be notified about. When an alarm situation occurs, an alarm message will pop up on the
screen.
Zeus does not relay alarm messages from the H3000 system. Alarms will need to be
setup in Zeus & H3000 with identical parameters if you require both systems to flag
alarm warnings at the same time. It is recommended that core instrument alarms are set
on H3000.
If you have enabled the siren, the alarm message will be followed by an audible alarm.
The alarm is recorded in the alarm listing so that you can see the details and take the
appropriate corrective action.
Type of Messages
The messages are classified according to how the reported situation will affect your
vessel. The following color codes are used:
COLOR
IMPORTANCE
Red
Vital
Orange
Important
Yellow
Standard
Blue
Warning
Green
Light warning
Single alarms
A single alarm is displayed with the name of the alarm as the title, and
with details for the alarm.
Multiple alarms
If more than one alarm is activated simultaneously, the alarm message
will display a list of up to 3 alarms. The alarms are listed in the order
they occur with the alarm activated first at the top. The remaining
alarms are available in the Alarm listing. Refer to The utilities pages
section.
Acknowledging a Message
The following options are available in the alarm dialog for acknowledging a message:
OPTION
OK
RESULT
Sets the alarm state to acknowledged, meaning that you are aware
of the alarm condition. The siren / buzzer will stop and the alarm
dialog will be removed.
The alarm will however remain active in the alarm listing until the
reason for the alarm has been removed.
Disable
Disables the current alarm setting. The alarm will not show again
unless you turn it back on in the Alarm settings dialog.
There is no time-out on the alarm message or siren. These remain until you acknowledge
it or until the reason for the alarm is removed.
83
Customizing the Alarm Settings
x2
MENU
WIN
The alarms can be setup in Settings tab in the Alarms page. This page also includes
information about active alarms and alarm history.
The Alarms page can also be activated from the Utilities pages.
MENU
WIN
The alarms are described in the chapter describing the corresponding feature. E.g.
vessel alarms are described in the Tracking other vessel’s movement section.
84
19. Using BEP CZone
The BEP CZone icon will only show if enabled in Advanced setup of the Systems Settings
menu.
BEP CZone is a NMEA 2000 compliant (SimNet) system that controls and monitors circuit
information on your vessel. It also contains onboard diagnostics, multifunction timer
capabilities, dimmer circuits and uses multi-voltages (9-32V DC). If the BEP CZone
system is connected to your Zeus unit, you can access various functions.
Typical electrical layout configuration
Problems with typical electrical layout configuration:
-
Conductor sizes are large due to long distances between loads and control/
protection devices.
-
Long cable runs, multiple conductors and complex inter-helm switching of common
circuits.
-
Switch panel wiring is complicated and time consuming to install.
Contour Zone system layout configuration
85
BEP CZone provides:
-
A single data cable connection replacing complex switch panel wiring.
-
The grouping of multiple loads into common areas (Zones) with Output Interface
(OI) modules.
-
Heavy duty battery mains cable replaced by smaller multiple conductors.
The BEP CZone Panel
The CZone panel provides monitoring and control functions for the BEP CZone system.
PAGES
The BEP CZone panel can also be set up in one of the other page groups accessed by the
‘DAK’ keys. It can be set up as single panel or as one of the panels in a multi-panel page.
You can also use the INFO page to access additional display information on BEP CZone;
it provides an added Dashboard on your INFO page. For more information refer to the
instrument panel section of the Zeus Operation Manual.
Initial configuration can be only done by the BEP CZone display interface (DI), or a laptop
configuration utility.
86
Operating the Modes Function
These modes allow one press activation of circuits simplifying control. For example, you
could activate the Cruise mode, turning on all the circuits that are needed to operate
your vessel while cruising. However, when you leave the vessel you can select Systems
Off mode which will shut down all non 24h circuits.
These modes provide a one press functionality that also allows multiple circuits to be
controlled efficiently. Modes are configured at the time of installation. All available
modes will be displayed on the CZone panel.
If there are more than 5 modes configured on screen the rest of the modes will move to
the More Modes option.
MODE FUNCTIONS
MORE
MODES
SYSTEM OVERVIEW
OPTIONS
(7,8,9)
System Overview Options
Systems In Operation
This mode enables you to monitor all on board parameters including tank levels
displayed in graphical, percentage and volume remaining formats.
Control, Monitoring
The left side of the display shows control options while the right side shows monitoring
information.
Alarms
The Alarm displays visual and audible alarms that can be set for high and low levels.
87
The BEP CZone Dashboard
Zeus provides 4 standard dashboards. BEP CZone information is displayed on an
additional dashboard.
POWER
SOURCES
AC POWER
DISPLAY
BATTERY POWER
DISPLAY
FUEL BAR
Editing the CZone Dashboard
You can customize BEP CZone dashboard by changing the data for each of the gauges.
Available editing options will depend on the type of gauge and which data sources are
connected to your system. To find out how to customize a dashboard, refer to the Using
instrument panel section.
88
20. Maintenance
Preventive Maintenance
The Zeus unit does not contain any field serviceable components, therefore the operator
is required to perform only a very limited amount of preventative maintenance.
It is recommended that you always fit the supplied protective sun cover when the unit
not is in use.
Simple Maintenance Procedures
Cleaning the display unit
Clean the housing and the front glass of the Z8/12 unit with a damp cloth and mild
detergent only.
Checking the keys
Make sure that no keys are stuck in the down position. However, if one is stuck, wiggle
the key to free it back to normal.
Checking the connectors
The connectors should be checked by visual inspection only.
Push the connector plugs into the connector, if the connector plugs are equipped with a
lock; ensure that this is in the correct position.
Software upgrades
The latest software forZeus will be available for download from our website;
www.bandg.com
Detailed instructions for how to install the software will follow the upgrade files.
For more details about software upgrades, refer to the separate Installation manual.
Backing Up Your System Data
Waypoints, routes, tracks that you create on your system are filed on your system. It is
recommended to regularly export these files and your settings file as part of your backup routine.
The files are exported to a memory stick or SD card inserted in the card slot on the front
of your unit.
An illustration on the next page shows the process when exporting waypoints, routes
and tracks. Other files are exported by the same process.
89
MENU
90
WIN
21. Menu Overview
Settings Menus
System
Fuel
Tracks
Chart
Alarms
x2
MENU
Units
WIN
Echo
Network
Radar
Vessels
Navigation
Simulator
91
Context Menus
Goto Menu
Chart
PLOT
MARK
MENU
WIN
Radar
Echo
Info
Plot Menu
PLOT
MARK
92
GO TO
VESSEL
GO TO
VESSEL
*988-0186-00A*
www.bandg.com