1
Tradecision
Unique Software for Thinking Traders
User Manual
Version 4.7
© 2001 - 2009 Alyuda Research. All rights reserved.
No part of this publication may be reproduced, stored in a retrieval system or transmitted in any form by
any means, electronic, magnetic tape, mechanical, photocopying, recording, or otherwise, without permission
in writing from Alyuda.
This document is provided for informational purposes only, and the content of this document is subject to
change without notice. Alyuda assumes no liability or responsibility for any errors or inaccuracies that
may appear in this document.
2
Contents
Contents ...........................................................................................................................................3
Chapter 1 ........................................................................................................................................17
Introduction....................................................................................................................................17
What’s New to Tradecision v4.7................................................................................................ 18
Chapter 2 ........................................................................................................................................19
Getting Started...............................................................................................................................19
Functionality Overview .............................................................................................................. 19
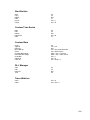
System Requirements............................................................................................................... 21
Recommended: ..................................................................................................................... 21
Minimum: ............................................................................................................................... 21
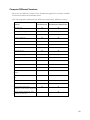
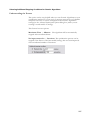
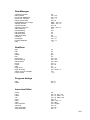
Compare Different Versions...................................................................................................... 22
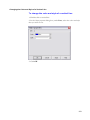
Installing and Removing the Tradecision Software ................................................................... 24
Chapter 3 ........................................................................................................................................25
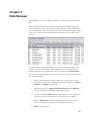
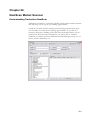
Data Manager .................................................................................................................................25
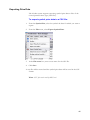
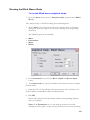
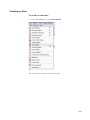
Opening and Closing Data Manager......................................................................................... 27
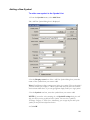
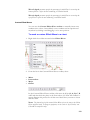
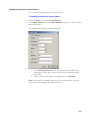
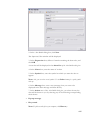
Adding a New Symbol............................................................................................................... 28
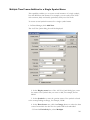
Multiple Time Frame Addition for a Single Symbol Name......................................................... 31
Adding a Group of Symbols ...................................................................................................... 33
Updating Symbol Data .............................................................................................................. 34
Importing Data from a Text File................................................................................................. 35
Importing MetaStock Database................................................................................................. 37
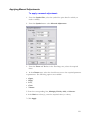
Updating Symbols Using the Batch Update Capability ............................................................. 38
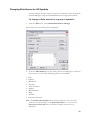
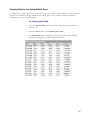
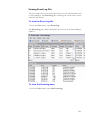
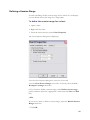
Changing Data Source for All Symbols..................................................................................... 40
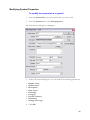
Modifying Symbol Properties .................................................................................................... 42
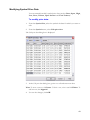
Modifying Symbol Price Data .................................................................................................... 43
Deleting a Symbol ..................................................................................................................... 44
Deleting Price Data ................................................................................................................... 45
Exporting Price Data ................................................................................................................. 46
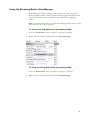
Using the Streaming Mode in Data Manager ............................................................................ 47
Splits and Distributions.............................................................................................................. 48
Understanding the Splits and Distributions concepts...................................................................... 48
Splits ....................................................................................................................................... 48
Distributions ............................................................................................................................ 48
Adjusting Prices for Split or Distribution .................................................................................... 49
Making Manual Adjustments ..................................................................................................... 50
Applying Manual Adjustments................................................................................................... 51
Viewing Data in the Symbol Data Pane .................................................................................. 52
Viewing Event Log File.............................................................................................................. 53
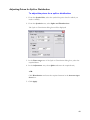
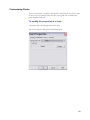
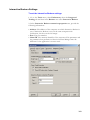
Changing Yahoo and Interactive Brokers Settings ................................................................... 54
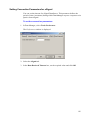
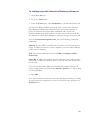
Setting Connection Parameters for eSignal .............................................................................. 55
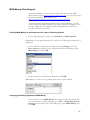
MSN Money Data Support ........................................................................................................ 57
Defining MSN Money as the Datasource for a New or Existing Symbol ............................... 57
Changing All Existing Symbols to MSN Money ..................................................................... 57
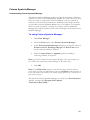
Futures Symbols Manager ........................................................................................................ 58
Understanding Futures Symbols Manager ............................................................................ 58
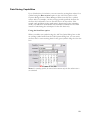
Data Storing Capabilities........................................................................................................... 59
Using the Start Date option ........................................................................................................ 59
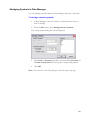
Abridging Symbols in Data Manager......................................................................................... 60
Limiting the Symbol Data Size .................................................................................................. 61
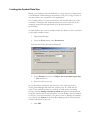
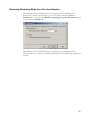
Restoring Streaming Mode from Previous Session .................................................................. 62
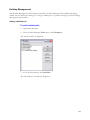
Exchange Management ............................................................................................................ 63
3
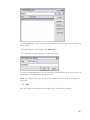
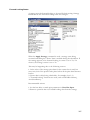
Holiday Management ................................................................................................................ 64
Holiday Management ................................................................................................................ 64
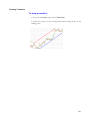
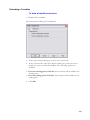
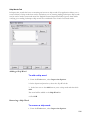
Adding a Holiday List............................................................................................................. 64
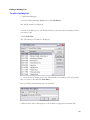
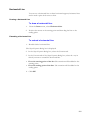
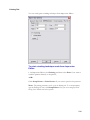
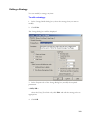
Editing a Holiday List To edit a holiday list: .......................................................................... 66
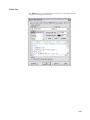
Deleting a Holiday List........................................................................................................... 67
Chapter 4 ........................................................................................................................................68
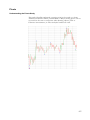
Charting ..........................................................................................................................................68
Charts overview ........................................................................................................................ 68
What are charts?................................................................................................................ 68
What is technical analysis?................................................................................................ 68
Chart types ............................................................................................................................ 69
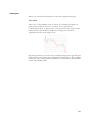
Line Chart .......................................................................................................................... 69
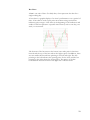
Bar Chart ........................................................................................................................... 70
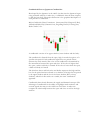
Candlestick Chart or Japanese Candlesticks .................................................................... 71
Working with Charts .................................................................................................................. 72
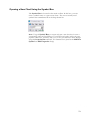
Opening a New Chart Using the Symbol Box ........................................................................... 73
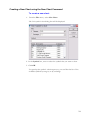
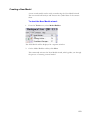
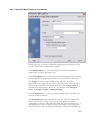
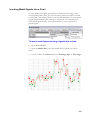
Creating a New Chart using the New Chart Command ............................................................ 74
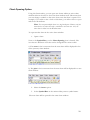
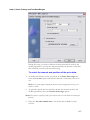
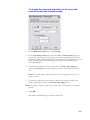
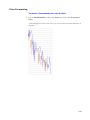
Chart-Opening Option ............................................................................................................... 76
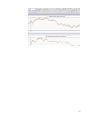
Scrolling a Chart........................................................................................................................ 78
Using Chart Time Frames ......................................................................................................... 79
Customizing Charts................................................................................................................... 80
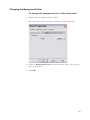
Changing the Background Color ............................................................................................... 81
Changing the Font .................................................................................................................... 82
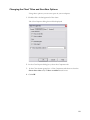
Changing the Chart Titles and Scrollbar Options...................................................................... 83
Enabling and Disabling the Chart Grid...................................................................................... 84
Displaying Day Break Markers.................................................................................................. 85
Axes and Scaling ...................................................................................................................... 86
Choosing the Vertical Axis Scale Type.................................................................................. 86
Using the Logarithmic Scale.................................................................................................. 88
Defining a Session Range......................................................................................................... 89
Zooming in on or out of Parts of a Chart ................................................................................... 90
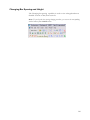
Changing Bar Spacing and Height............................................................................................ 91
Increasing Bar Spacing ......................................................................................................... 92
Decreasing the Bar Spacing.................................................................................................. 93
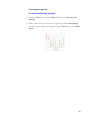
Increasing the Bar Height ...................................................................................................... 93
Decreasing the bar height: .................................................................................................... 93
Custom Bars ............................................................................................................................. 94
Understanding Custom Bars ................................................................................................. 94
Chapter 5 ........................................................................................................................................96
Drawing Objects ............................................................................................................................96
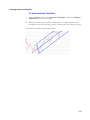
Trendlines ................................................................................................................................. 97
Understanding trendlines ................................................................................................... 97
Up Trendline ...................................................................................................................... 97
Down Trendline.................................................................................................................. 97
Using Trendlines ................................................................................................................... 98
Drawing Trendlines................................................................................................................ 99
Extending a Trendline.......................................................................................................... 100
Horizontal Line ........................................................................................................................ 101
Drawing a Horizontal Line ................................................................................................... 101
Extending a Horizontal Line................................................................................................. 101
Vertical Line ............................................................................................................................ 102
Drawing a Vertical Line ....................................................................................................... 102
Changing the Color and Style of a Vertical Line.................................................................. 103
Rectangle ................................................................................................................................ 104
4
Drawing a Rectangle ........................................................................................................... 104
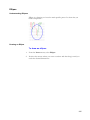
Ellipse ..................................................................................................................................... 105
Understanding Ellipses........................................................................................................ 105
Drawing an Ellipse............................................................................................................... 105
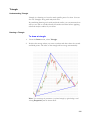
Triangle ................................................................................................................................... 106
Understanding Triangle ....................................................................................................... 106
Drawing a Triangle .............................................................................................................. 106
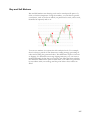
Buy and Sell Markers .............................................................................................................. 107
Text Label ............................................................................................................................... 109
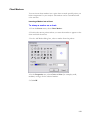
Chart Markers ......................................................................................................................... 110
Inserting a Marker into a Chart ............................................................................................ 110
Fibonacci Numbers ................................................................................................................. 111
Understanding Fibonacci Numbers ..................................................................................... 111
Managing Fibonacci Levels ................................................................................................. 112
Fibonacci Retracements ......................................................................................................... 113
Drawing Fibonacci Retracements........................................................................................ 114
Fibonacci Extension ................................................................................................................ 116
Drawing a Fibonacci Extension ........................................................................................... 117
Fibonacci Circles..................................................................................................................... 118
Drawing Fibonacci Circles ................................................................................................... 119
Fibonacci Fans........................................................................................................................ 120
Understanding Fibonacci Fans............................................................................................ 120
Drawing Fibonacci Fans ...................................................................................................... 121
Fibonacci Time........................................................................................................................ 122
Understanding Fibonacci Time............................................................................................ 122
Drawing Fibonacci Time ...................................................................................................... 122
Fibonacci Time Retracements ................................................................................................ 123
Drawing Fibonacci Time Retracements............................................................................... 124
Andrews’ Pitchforks................................................................................................................. 125
Understanding Andrews’ Pitchforks..................................................................................... 125
Drawing Andrews’ Pitchfork................................................................................................. 126
Gann Analytical Tools ............................................................................................................. 127
Understanding Gann techniques............................................................................................. 127
Gann Angles........................................................................................................................ 128
Gann Fan ............................................................................................................................ 129
Drawing a Gann Fan ........................................................................................................... 130
Changing the Properties of a Gann Fan.............................................................................. 131
Changing the Color and Style of Gann fan.......................................................................... 132
Gann Cardinal Squares ....................................................................................................... 133
Drawing Gann Cardinal Squares......................................................................................... 134
Changing Gann Cardinal Squares properties...................................................................... 135
Changing the Color and Style of Gann Cardinal Squares ................................................... 136
Gann Grid ............................................................................................................................ 137
Drawing Gann Grid .......................................................................................................... 137
Changing the Properties of a Gann Grid.......................................................................... 138
Changing the color and style of a Gann Grid................................................................... 139
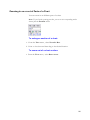
Moving Objects ....................................................................................................................... 140
Deleting Objects...................................................................................................................... 140
Removing Groups of Objects from a Chart ............................................................................. 140
Changing the Color and Style of an Object............................................................................. 140
Sub-charts............................................................................................................................... 141
Volume Sub-Chart................................................................................................................... 142
Changing the Order of Sub-Charts...................................................................................... 143
Deleting Sub-Chart.................................................................................................................. 144
Exporting Chart Data............................................................................................................... 145
5
Chapter 6 ......................................................................................................................................146
Templates .....................................................................................................................................146
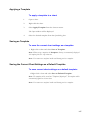
Understanding Templates ....................................................................................................... 146
Applying a Template ............................................................................................................... 147
Saving as Template ................................................................................................................ 147
Saving the Current Chart Settings as a Default Template ...................................................... 147
Chapter 7 ......................................................................................................................................148
Workspaces .................................................................................................................................148
Understanding Workspaces .................................................................................................... 148
Creating and Saving a Workspace.......................................................................................... 149
Opening Workspaces.............................................................................................................. 150
Closing a Workspace .............................................................................................................. 151
Deleting Workspace ................................................................................................................ 152
Chapter 8 ......................................................................................................................................153
Technical Indicators ....................................................................................................................153
About Technical Indicators...................................................................................................... 153
Adding an Indicator ................................................................................................................. 154
Customizing Indicator.............................................................................................................. 155
Indicator Thresholds................................................................................................................ 156
Deleting Indicator .................................................................................................................... 157
Indicator Descriptions.............................................................................................................. 158
Acceleration Indicator ............................................................................................................. 158
Accumulation/Distribution ...................................................................................................... 158
Adaptive Moving Average ........................................................................................................ 158
ADX – Directional Movement Indicator .................................................................................... 158
ADX Classic (rounded)............................................................................................................ 158
ADXR (signal line) .................................................................................................................. 158
Auto Trend Inter Indicator....................................................................................................... 159
Auto Trend Major Indicator ..................................................................................................... 159
AutoTrend Minor Indicator...................................................................................................... 159
Average Price ......................................................................................................................... 159
Average True Range ................................................................................................................ 159
Bollinger Band %B (Middle Line).............................................................................................. 159
Bollinger Band High................................................................................................................ 160
Bollinger Band Low ................................................................................................................ 160
Bollinger Band Width (High-Low)............................................................................................. 160
CCI – Commodity Channel Index ............................................................................................. 160
Chaikin A/D Oscillator ........................................................................................................... 161
Change .................................................................................................................................. 161
Correlation (directional) ........................................................................................................... 161
Detrended Price Oscillator ....................................................................................................... 161
Directional Movement Index .................................................................................................... 161
DMI Minus ............................................................................................................................ 161
DMI Plus............................................................................................................................... 162
Ease of Movement .................................................................................................................. 162
Ease Of Movement (smoothed) ................................................................................................ 162
Elliott Waves Inter Indicator .................................................................................................... 162
Elliott Waves Major Indicator ................................................................................................... 162
Elliott Waves Minor Indicator .................................................................................................. 162
Efficiency .............................................................................................................................. 162
EMA – Exponential Moving Average ........................................................................................ 162
Envelope High ....................................................................................................................... 163
Envelope Low ........................................................................................................................ 163
6
Forecasted Price ..................................................................................................................... 163
Linear Regression Line ............................................................................................................ 164
N-ATR.................................................................................................................................. 164
MACD – Moving Average Convergence Divergence ................................................................... 164
Market Facilitation Index ......................................................................................................... 164
Mass Index ............................................................................................................................ 164
Median Price .......................................................................................................................... 164
MFI – Money Flow Index ........................................................................................................ 164
Momentum Indicator .............................................................................................................. 165
Money Flow ........................................................................................................................... 165
OBV – On Balance Volume ..................................................................................................... 165
Outside Bar............................................................................................................................ 165
Parabolic SAR ........................................................................................................................ 165
Percent Change ...................................................................................................................... 165
Percent R ............................................................................................................................... 165
Price High.............................................................................................................................. 166
Price Low .............................................................................................................................. 166
Price Oscillator ....................................................................................................................... 166
Price Range ............................................................................................................................ 166
Price Range Midpoint .............................................................................................................. 166
Price Volume Trend ................................................................................................................ 166
Rate of Change ....................................................................................................................... 166
RSI – Relative Strength Index ................................................................................................... 166
R-squared .............................................................................................................................. 167
SMA - Simple Moving Average ................................................................................................. 167
Standard Deviation ................................................................................................................. 167
Stochastic Relative Strength Index ............................................................................................. 167
Statistical Volatility .................................................................................................................. 167
Stochastic %D ........................................................................................................................ 167
Stochastic %K ........................................................................................................................ 167
Stochastic Slow %D ................................................................................................................ 168
Stochastic Slow %K ................................................................................................................ 168
Swiss Army Knife Indicator...................................................................................................... 168
Time-series forecast ................................................................................................................ 168
TMA - Triangular Moving Average............................................................................................ 168
TRIX - Triple Exponential Average ........................................................................................... 168
TrueHigh ............................................................................................................................... 169
TrueLow................................................................................................................................ 169
TrueRange ............................................................................................................................. 169
Typical price........................................................................................................................... 169
Ulcer Index ............................................................................................................................ 169
Ultimate Oscillator .................................................................................................................. 169
Velocity (slope)....................................................................................................................... 169
Volatility Indicator .................................................................................................................. 169
Volatility Standard Deviation .................................................................................................... 170
Volume Average ..................................................................................................................... 170
Volume Oscillator ................................................................................................................... 170
Volume Rate of Change ........................................................................................................... 170
Weighted Close Indicator ......................................................................................................... 170
Weighted Moving Average ....................................................................................................... 170
Williams’ Accumulation/Distribution ........................................................................................ 171
WTop Inter Indicator .............................................................................................................. 171
WTop Major Indicator............................................................................................................. 171
WTop Minor Indicator ............................................................................................................ 171
7
Chapter 9 ......................................................................................................................................172
Analytical Studies........................................................................................................................172
Auto-Trends ............................................................................................................................ 173
Understanding the Auto-trends study .................................................................................. 173
Auto-trend types............................................................................................................... 173
Running the Auto-trends Study ........................................................................................... 174
Tuning the Auto-trends Algorithm........................................................................................ 176
Bars Back............................................................................................................................... 176
Pivots ...................................................................................................................................... 177
Understanding the Pivots Study .......................................................................................... 177
Running the Pivots Study .................................................................................................... 178
Single-Bar Patterns ................................................................................................................. 179
Understanding the Single-Bar Patterns Study..................................................................... 179
Gap .................................................................................................................................. 179
Thrust Days...................................................................................................................... 179
Run days.......................................................................................................................... 179
Wide-Ranging days.......................................................................................................... 179
Running the Single-Bar Patterns Study .................................................................................. 181
Reversal Patterns.................................................................................................................... 182
Understanding the Reversal Patterns Study ....................................................................... 182
Head and Shoulders............................................................................................................ 183
Running the Reversal Patterns Study ................................................................................. 184
Elliott Waves ........................................................................................................................... 185
Understanding the Elliott Waves Theory ............................................................................. 185
A Brief Overview of the Elliott Waves Theory...................................................................... 186
Types of Impulse Waves ..................................................................................................... 187
Other Elliott Concepts.......................................................................................................... 187
Running the Elliott Waves Study............................................................................................. 188
Custom Elliott Waves .......................................................................................................... 189
Fibonacci Clusters................................................................................................................... 190
Understanding the Fibonacci Clusters Study ...................................................................... 190
Running the Fibonacci Clusters........................................................................................... 191
Noise Removal........................................................................................................................ 193
Using the Noise Removal Functionality............................................................................... 194
Cancelling Noise Removal .................................................................................................. 195
Chapter 10 ....................................................................................................................................196
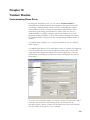
Tandem Studies ...........................................................................................................................196
Understanding Phase Rover ................................................................................................... 196
Understanding Tandem Studies.............................................................................................. 197
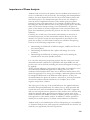
Importance of Phase Analysis................................................................................................. 198
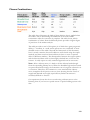
Phases Combinations ............................................................................................................. 199
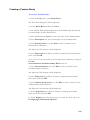
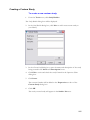
Creating a Tandem Study ....................................................................................................... 200
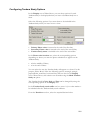
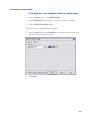
Configuring Tandem Study Options ........................................................................................ 201
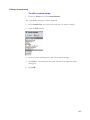
Inserting a Tandem Study into a Chart ................................................................................... 202
Accessing Tandem Studies from Toolbar ............................................................................... 203
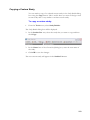
Copying a Tandem Study........................................................................................................ 203
Deleting a Tandem Study........................................................................................................ 203
Import/Export........................................................................................................................... 204
Importing Tandem Studies .................................................................................................. 204
Exporting Tandem Studies .................................................................................................. 204
Tandem Studies Descriptions ................................................................................................. 206
Area Ratio Bull .................................................................................................................... 206
Area Ratio Bear ................................................................................................................... 206
AvgTrueRng Ratio ............................................................................................................... 206
AvgTrueRng Differenc ......................................................................................................... 206
8
Bars Difference.................................................................................................................... 206
Bars Ratio............................................................................................................................ 206
MaximumMomentumRatio................................................................................................... 207
Money Flow Ratio................................................................................................................ 207
OBV Ratio ........................................................................................................................... 207
Ranges Difference............................................................................................................... 207
Range Difference ................................................................................................................ 207
Ranges Ratio....................................................................................................................... 207
Retracement ........................................................................................................................ 208
Percent Volume Differenc ................................................................................................... 208
STDev Difference ................................................................................................................ 208
STDev Ratio ........................................................................................................................ 208
Velocity Difference .............................................................................................................. 208
Velocity Ratio ...................................................................................................................... 208
Volatility Difference.............................................................................................................. 209
Volatility Ratio...................................................................................................................... 209
Volume Differenc ................................................................................................................. 209
Volume Ratio ....................................................................................................................... 209
WAccDist Ratio ................................................................................................................... 209
Chapter 11 ....................................................................................................................................210
Improvian Language....................................................................................................................210
Introduction ............................................................................................................................. 210
What is Improvian? ................................................................................................................. 210
What can you create? ............................................................................................................. 210
Understanding the Language.................................................................................................. 212
Basic Elements of the Language ............................................................................................ 213
Combinations, allowed in an expression ............................................................................. 213
Syntax Characteristic in Builders......................................................................................... 213
Trading Technique .................................................................................................................. 213
Characteristic ......................................................................................................................... 213
User Function ........................................................................................................................ 213
Strategies ............................................................................................................................... 213
Indicators .............................................................................................................................. 213
Studies................................................................................................................................... 213
Models .................................................................................................................................. 213
InputExp ............................................................................................................................... 213
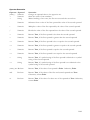
Operator Semantics ............................................................................................................ 214
Operator Precedence .......................................................................................................... 215
Function............................................................................................................................... 216
Variables ............................................................................................................................. 217
Arrays .................................................................................................................................. 218
Inputs................................................................................................................................... 219
Reserved Words.................................................................................................................. 220
Value ................................................................................................................................... 221
Using Improvian Editor............................................................................................................ 222
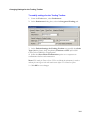
Creating Trading Techniques using Built-in Functions ........................................................ 225
Viewing the Details of a Function ........................................................................................ 226
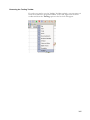
Using AutoComplete ........................................................................................................... 226
Using Variables ................................................................................................................... 226
Using Upper and Lower cases ............................................................................................ 226
Using Comments ................................................................................................................. 226
Using Spacing ..................................................................................................................... 226
Using Clipboard Commands................................................................................................ 226
Customizing the View .......................................................................................................... 227
9
Printing ................................................................................................................................ 228
Font, Background and Foreground...................................................................................... 228
Referencing Price Data of Other Symbols........................................................................... 229
Technique Interdependencies................................................................................................. 230
Reviewing Technique Interdependencies............................................................................ 230
Improvian: Glossary of Terms ............................................................................................. 231
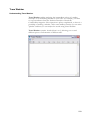
Trace Watcher......................................................................................................................... 233
Understanding Trace Watcher............................................................................................. 233
Using Trace Watcher........................................................................................................... 234
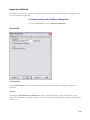
Improvian Options ................................................................................................................... 235
General Tab ........................................................................................................................ 235
Calculations ..................................................................................................................... 235
Traces .............................................................................................................................. 235
Skip Words Tab ................................................................................................................... 236
Adding a Skip Word ......................................................................................................... 236
Removing a Skip Word .................................................................................................... 236
Printing Tab ......................................................................................................................... 238
Editor Tab ............................................................................................................................ 239
Code Templates Tab ........................................................................................................... 240
Predefined Variables Tab .................................................................................................... 241
Adding a Predefined Variable .......................................................................................... 241
Editing a Predefined Variable .......................................................................................... 243
Deeleting a Predefind Variable ........................................................................................ 244
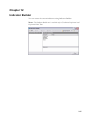
Chapter 12 ....................................................................................................................................245
Indicator Builder ..........................................................................................................................245
Understanding Custom Indicators........................................................................................... 246
Creating a Custom Indicator ................................................................................................... 247
Modifying a Custom Indicator.................................................................................................. 248
Copying a Custom Indicator.................................................................................................... 249
Deleting a Custom Indicator.................................................................................................... 250
Import/Export........................................................................................................................... 251
Importing Indicators ............................................................................................................. 251
Exporting Indicators............................................................................................................. 252
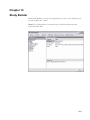
Chapter 13 ....................................................................................................................................253
Study Builder ...............................................................................................................................253
Understanding Study Builder .................................................................................................. 254
Creating a Custom Study ........................................................................................................ 255
Customizing a Custom Study .............................................................................................. 256
Editing a Custom Study ....................................................................................................... 257
Copying a Custom Study ........................................................................................................ 258
Deleting a Custom Study ........................................................................................................ 259
Inserting a Custom Study into a Chart .................................................................................... 260
Import/Export........................................................................................................................... 262
Importing Custom Studies ................................................................................................... 262
Exporting Custom Studies ................................................................................................... 263
Chapter 14 ....................................................................................................................................264
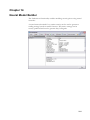
Neural Model Builder...................................................................................................................264
Understanding Neural Models................................................................................................. 265
Introduction to Genetic Algorithms .......................................................................................... 266
Introduction to Neural Networks.............................................................................................. 267
General Information............................................................................................................. 267
What Are Neural Networks? ................................................................................................ 268
Biological Prototype............................................................................................................. 269
10
Preparing Data for Neural Networks.................................................................................... 270
Using a Neural Network....................................................................................................... 271
Creating a New Model............................................................................................................. 272
New Model Wizard .............................................................................................................. 273
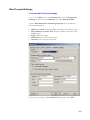
Step 1: Select the Model Target and Lookahead ................................................................ 274
Selecting Target............................................................................................................... 276
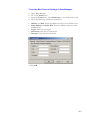
Step 2: Select Training and Test Data Ranges ................................................................... 277
Selecting Model Test Period ............................................................................................ 280
Step 3: Select Model Inputs ................................................................................................ 281
Writing Model Inputs ........................................................................................................ 284
Optimizing Model Inputs ...................................................................................................... 285
Selecting the Right Amount of Input Data........................................................................ 287
Selecting Input Columns .................................................................................................. 287
Step 4: Defining Model-Based Strategy for Performance Report........................................ 288
Optimizing Variables............................................................................................................ 292
Specifying the Range of the Selected Optimization Variable........................................... 292
Specifying the Optimization Algorithm and its Properties ................................................ 294
Using the Advanced Optimization Criterion......................................................................... 296
Selecting Additional Stopping Conditions for Genetic Algorithms ....................................... 297
Understanding the Feature .............................................................................................. 297
Training a Model ..................................................................................................................... 299
Editing a Model ....................................................................................................................... 300
Deleting a Model ..................................................................................................................... 301
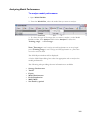
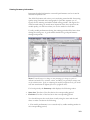
Analyzing Model Performance ................................................................................................ 302
Viewing Summary Information............................................................................................. 303
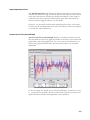
Input Importance Chart........................................................................................................ 306
Actual versus Forecasted Graph ......................................................................................... 306
Understanding Model-Based Strategies ................................................................................. 307
Preventing Curve-Fitting ......................................................................................................... 308
Inserting Model Signals into a Chart ....................................................................................... 309
Price Forecasting .................................................................................................................... 310
Inserting the Model Output into a Strategy.............................................................................. 311
Saving a Model Output as.csv file........................................................................................... 312
Import/Export........................................................................................................................... 313
Importing a Neural Model .................................................................................................... 313
Exporting a Neural Model .................................................................................................... 314
Chapter 15 ....................................................................................................................................315
Strategy Builder ...........................................................................................................................315
Understanding Trading Strategies .......................................................................................... 315
Using Strategy Builder ............................................................................................................ 316
Creating a New Strategy ..................................................................................................... 317
Creating a New Neural Strategy.......................................................................................... 319
Understanding Order Types of Trading Strategies.............................................................. 322
Selecting an Order for a Strategy .................................................................................... 323
Inserting a Strategy into a Chart.......................................................................................... 325
Forward Looking Status....................................................................................................... 327
Editing a Strategy.................................................................................................................... 328
Copying a Strategy.................................................................................................................. 329
Deleting a Strategy.................................................................................................................. 330
Importing and Exporting a Strategy......................................................................................... 331
Importing Strategies ............................................................................................................ 331
Exporting Strategies ............................................................................................................ 331
Money Management ............................................................................................................... 332
Understanding Money Management ................................................................................... 332
Money Management Editor ................................................................................................. 333
11
General................................................................................................................................ 334
Commission ..................................................................................................................... 335
Slippage ........................................................................................................................... 336
Position Size........................................................................................................................ 337
Using Custom Formula for Position Size............................................................................. 339
Stop Loss ............................................................................................................................ 340
Trailing Stop ........................................................................................................................ 341
Profit Target......................................................................................................................... 342
Strategy optimization (Professional Editions).......................................................................... 343
Understanding Strategy Optimization.................................................................................. 343
Understanding Optimization Algorithms .............................................................................. 344
Walk-Forward Testing (Strategy Builder)......................................................................... 345
Understanding Walk-Forward Testing ............................................................................. 345
Strategy Optimization Wizard.................................................................................................. 347
Starting the Strategy Optimization wizard ........................................................................... 347
Step 1: Selecting Symbol .................................................................................................... 348
Step 2: Parameters to be Optimized ................................................................................... 349
Step 3: Optimization Algorithm ............................................................................................ 350
Genetic Algorithm Parameters ............................................................................................ 352
Selecting Additional Stopping Conditions for Genetic Algorithms ....................................... 353
Step 4: Optimization Data Ranges ...................................................................................... 355
Step 5: Optimization Results ............................................................................................... 357
Chapter 16 ....................................................................................................................................359
Integrated Trading .......................................................................................................................359
Direct Trade Execution (DTE) ................................................................................................. 359
How DTE Works .................................................................................................................. 359
DTE Mode for Several Symbols and Several Strategies..................................................... 359
Activating the DTE Mode..................................................................................................... 360
DTE Mode Settings ............................................................................................................. 362
Trading Toolbar....................................................................................................................... 363
Placing Orders using the Trading Toolbar........................................................................... 363
Selecting Parameters for an Order on the Trading Toolbar ................................................ 363
Connecting to a Broker Using the Trading Toolbar ............................................................. 363
Changing Settings for the Trading Toolbar.......................................................................... 364
Removing the Trading Toolbar ............................................................................................ 365
Trading History .................................................................................................................... 366
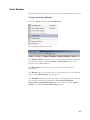
Order Window ......................................................................................................................... 367
Modifying Properties of Open Orders .................................................................................. 368
Interactive Brokers Settings................................................................................................. 369
Man Financial Settings ........................................................................................................ 370
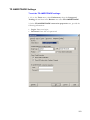
TD AMERITRADE Settings ................................................................................................. 372
Chapter 17 ....................................................................................................................................373
Simulation Manager.....................................................................................................................373
Understanding Simulations ..................................................................................................... 373
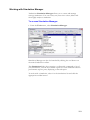
Working with Simulation Manager........................................................................................... 374
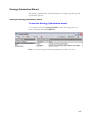
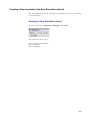
Creating a New simulation (the New Simulation wizard) ........................................................ 375
Step 1: General Information ................................................................................................ 376
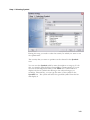
Step 2: Symbols .................................................................................................................. 377
12
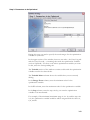
Step 3: Strategies ................................................................................................................ 378
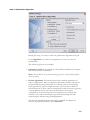
Analyzing a Simulation ........................................................................................................ 379
Summary Report ................................................................................................................. 380
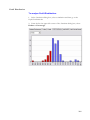
Profit Distribution.............................................................................................................. 381
MAE/MFE......................................................................................................................... 382
Analyzing MFE and MAE ................................................................................................. 383
Analyzing Net Profit by Period............................................................................................. 384
Inserting Simulation Signals into a Chart ................................................................................ 386
Grouping and Filtering Simulations ......................................................................................... 387
Viewing simulation Information ............................................................................................... 388
Running Simulation ................................................................................................................. 389
Deleting a Simulation .............................................................................................................. 389
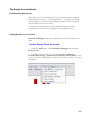
Saving Simulation Reports in the CSV (Excel) format. ........................................................... 390
Saving Strategy Signals in the CSV (Excel) Format ............................................................... 391
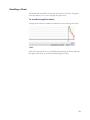
The Equity Curve Indicator...................................................................................................... 392
Understanding Equity Curve ............................................................................................... 392
Plotting Equity Curve on a Chart ......................................................................................... 392
Analyzing Strategy Performance............................................................................................. 393
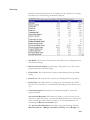
Strategy Performance Report.............................................................................................. 393
Summary.......................................................................................................................... 394
Trades.............................................................................................................................. 396
Return .............................................................................................................................. 397
Risk .................................................................................................................................. 398
Drawdown and Run-up .................................................................................................... 399
Outlier Trades .................................................................................................................. 400
Time Analysis................................................................................................................... 401
Trades Report ..................................................................................................................... 402
Equity and Drawdown Curves ............................................................................................. 404
Chapter 18 ....................................................................................................................................405
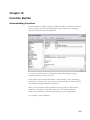
Function Builder ..........................................................................................................................405
Understanding Functions ........................................................................................................ 405
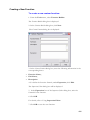
Creating a New Function......................................................................................................... 406
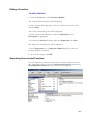
Editing a Function ................................................................................................................... 407
Separating User-created Functions ........................................................................................ 407
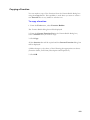
Copying a Function ................................................................................................................. 408
Deleting a Function ................................................................................................................. 409
Importing a Function ............................................................................................................... 409
Exporting a Function ............................................................................................................... 410
Importing a Function from TradeStation.................................................................................. 411
Importing a Function from TradeStation.................................................................................. 411
Chapter 19 ....................................................................................................................................413
Alert Builder .................................................................................................................................413
Understanding Alerts............................................................................................................... 413
Creating an Alert ..................................................................................................................... 414
Deleting an Alert...................................................................................................................... 417
Copying an Alert...................................................................................................................... 418
Import/Export........................................................................................................................... 419
Importing Alerts ................................................................................................................... 419
Exporting Alerts ................................................................................................................... 420
13
Chapter 20 ....................................................................................................................................421
NeatScan Market Scanner...........................................................................................................421
Understanding Tradecision NeatScan .................................................................................... 421
Using Built-In Library of Scans................................................................................................ 423
Defining Custom Columns ...................................................................................................... 423
Choosing a Time Frame.......................................................................................................... 423
Filtering by Price and Volume ................................................................................................. 423
Opening the Scanner .............................................................................................................. 424
Running a Scan ...................................................................................................................... 425
Creating a New Scan .............................................................................................................. 426
Editing a Scan ......................................................................................................................... 427
Deleting a Scan....................................................................................................................... 427
Creating a New Scan Group ................................................................................................... 427
Deleting a Scan Group............................................................................................................ 427
Import/Export........................................................................................................................... 428
Importing Scans................................................................................................................... 428
Exporting Scans .................................................................................................................. 428
Using the Filtering Functionality for Scanning ..................................................................... 429
Using Additional Options for Scanning ................................................................................ 430
Displaying Scanning Results in Charts................................................................................ 431
Selecting Columns............................................................................................................... 432
Exporting scanning Results into a Text File ........................................................................ 433
Chapter 21 ....................................................................................................................................434
DLL Manager ................................................................................................................................434
Understanding DLL Manager .................................................................................................. 434
Registering a New Function .................................................................................................... 435
Editing a Function ................................................................................................................... 437
Removing a Function .............................................................................................................. 438
Chapter 22 ....................................................................................................................................439
Custom Time Series ....................................................................................................................439
Adding New Custom Time Series ........................................................................................... 440
Reloading All the Existing Time Series ................................................................................... 442
Defining Advanced Text Import Parameters ........................................................................... 443
Modifying the Custom Time Series ......................................................................................... 445
Deleting Custom Time Series ................................................................................................. 446
Chapter 23 ....................................................................................................................................447
Preferences Functionality...........................................................................................................447
General tab ............................................................................................................................. 447
Objects tab .............................................................................................................................. 450
Alerts tab ................................................................................................................................. 451
Strategy Alerts Customization ............................................................................................. 452
Outputting Alerts into a Text File ......................................................................................... 454
Real Time tab (for Real Time edition only).............................................................................. 456
Integrated Trading Tab............................................................................................................ 457
Interactive Brokers................................................................... Error! Bookmark not defined.
Man Financial ...................................................................................................................... 459
TD AMERITRADE ............................................................................................................... 460
14
Chapter 24 ....................................................................................................................................461
Real Time Edition.........................................................................................................................461
Locating Opportunities in Real-Time....................................................................................... 461
Upgrades ................................................................................................................................ 461
Receiving Real Time Data ...................................................................................................... 461
Key Features........................................................................................................................... 462
Data Manipulations ................................................................................................................. 463
Strategy Execution .................................................................................................................. 464
Real Time Advanced Charting ................................................................................................ 464
Setting Up the IQfeed Real-Time Mode .................................................................................. 465
Configuring Data Manager ...................................................................................................... 466
Configuring Interactive Brokers............................................................................................... 467
Futures Symbols .............................................................................................................. 469
Exchange Management ................................................................................................... 470
Switching on the Streaming Mode .......................................................................................... 472
Switching on the Streaming Mode .......................................................................................... 472
Selecting Time Frames ........................................................................................................... 473
Selecting Day Session Range................................................................................................. 474
Allowing Trades Across Day Breaks ....................................................................................... 475
Chapter 25 ....................................................................................................................................476
FAQ - Frequently Asked Questions ...........................................................................................476
Q. How can I try the software before I buy it? ......................................................................... 477
Q. What is a "30-Day Money Back Guarantee"? .................................................................... 477
Q. How can I determine that the software is right for me? ...................................................... 477
Q. What are the strengths of your software? .......................................................................... 477
Q. Which would be better for me to purchase - Standard or Professional Edition? ................ 478
Q. Can you guarantee I will become rich after buying your software? .................................... 479
Q. Is it really so easy to make a profit? ................................................................................... 479
Q. What makes Tradecision different from other trading software in the market? .................. 479
Q. Is Tradecision easy to use?................................................................................................ 479
Q. Can I install Tradecision on multiple computers?............................................................... 480
Q. Has Tradecision any help materials? ................................................................................. 480
Q. What about support? How long does your technical support last and how much does it cost?
................................................................................................................................................ 480
Q. Will I pay for the products just once or monthly/annually? ................................................. 480
Q. Which markets can I trade using Tradecision? .................................................................. 480
Q. Why are you selling the software instead of making $$$ using it?..................................... 481
Q. I would like to get more info about Alyuda.......................................................................... 481
Q. I am a beginner trader. Couldn’t you please recommend a resource for traders where I can
find some valuable information? ............................................................................................. 481
Q. Can I work with Candlestick Chart? ................................................................................... 483
Q. Can I work with Point & Figure Chart? ............................................................................... 483
Q. Can I work with weekly/monthly charts? ............................................................................ 483
Q. Can I display the charts of two or more different stocks at the same time? ....................... 483
Q. What should I mark with buy/sell markers? ........................................................................ 483
Q. What are Fibonacci Retracements? ................................................................................... 484
Q. How many sub-charts can I open?..................................................................................... 484
Q. Can I save my charts with modifications the way I like? .................................................... 484
Q. Could you tell me what the Elliott Waves Theory is about? ............................................... 486
Q. How does Tradecision Elliott Waves? ................................................................................ 486
Q. Where I can read about the description of indicators? ....................................................... 486
Q. What is Fibonacci Clusters?............................................................................................... 486
Q. Can I build my own indicator? ............................................................................................ 487
Q. Can I use data and indicators from 2 stocks in one neural study? I think qqv will be helpful
while predicting qqq. ............................................................................................................... 487
15
Q. Is it really so easy to build a profitable strategy based on neural forecasting? .................. 488
Q. Why can neural networks be better than other technical analysis techniques? ................. 488
Q. What are neural networks? ................................................................................................ 489
Q. Do I need the knowledge in neural networks / programming / statistics / artificial intelligence to
effectively use your software?............................................................................................. 489
Q. What level of accuracy should I expect while making predictions about out-of-sample stock
data? ....................................................................................................................................... 489
Q. What information should I feed into a neural model to achieve good forecasting results? 489
Q. What types of neural networks are used in Tradecision?................................................... 490
Q. What is the target column?................................................................................................. 490
Q. What is a trading system and what is it for?....................................................................... 491
Q. Can I use back-testing in Tradecision? .............................................................................. 491
Q. What is the Strategy Performance Report?........................................................................ 492
Q. What is strategy simulation? .............................................................................................. 492
Q. What is a strategy optimization? ........................................................................................ 493
Q. How can I manage my trading strategies? ......................................................................... 493
Q. What is the Improvian Language?...................................................................................... 493
Q. Its pretty hard to learn using the Improvian Language, isn’t it? .......................................... 493
Q. Why using money management rules is important for me? ............................................... 494
Q. What kind of money management rules can I use with Tradecision? ................................ 494
Q. What are the Optimal F, Kelly, Fixed Fractional Trades and Williams formulas? .............. 494
Q. What is a Trailing Stop? ..................................................................................................... 495
Q. What kinds of data feeds does Tradecision support? ........................................................ 496
Q. How can I import MetaStock data? .................................................................................... 496
Q. I have problems with importing data from ASCII files. What am I doing wrong?................ 496
Q. How to import data from ASCII files? ................................................................................. 496
Q. What are the key capabilities provided by Tradecision Real Time? ................................... 498
Q. How can I select the streaming mode? .............................................................................. 498
Q. Where my real-time data will be saved? ............................................................................ 498
Q. What real-time data feeds will be supported in the future versions? .................................. 498
Q. Can I import intra-day data from a text files? ..................................................................... 498
Keyboard Shortcuts ....................................................................................................................499
Disclaimer ....................................................................................................................................505
Support .........................................................................................................................................506
16
Chapter 1
Introduction
Tradecision is a professional-level trading software application for
charting, technical analysis and building trading systems.
As well as employing the best of the commonly used techniques,
Tradecision uses neural networks and genetic algorithms, providing several
exclusive technical analysis capabilities.
Uisng proven techniques and Alyuda’s proprietary built-in algorithms,
Tradecision users can analyze markets, test their ideas and maximize their
profits while keeping their risks low and rewards high.
Whether you are purely a chartist, non-linear analysis adept, money
management expert, or Elliott follower; whether you trade stocks, futures,
currencies, or indices, Tradecision is capable of giving you the tools that
will enable you to perfom outstanding-quality market analysis.
Tradecision offers traders carefully selected, cream-of-the-crop analytical
techniques, responsive support service and a seasoned development team
that is always ready to assist them in their pursuits.
The Tradecision application provides functionality for performing the
following trading tasks:
• Charting with easy-to-use drawing tools;
• Analyzing price data using indicators and analytical studies;
• Developing and testing trading systems that are based on neural
networks and technical indicators;
• Strategy back-testing with Simulation Manager;
• Using genetic algorithms for fast and efficient trading system
optimization.
• Forecasting market moves and turning points.
17
What’s New to Tradecision v4.7
The key all-new features and enchantments of Tradecision 4.7 are the following:
• TD Ameritrade data feed is now supported
• Order types (market, stop, limit, stop-limit) can now be set for additional strategy
stop rules
• Connection to Interactive Brokers can now be kept alive for some time if IB server
goes down
• New functions for reversal patterns: VTop and WTopEx
• Various usability improvements
18
Chapter 2
Getting Started
Functionality Overview
The Tradecision application provides the following functionality:
Trading Systems
•
•
•
•
•
•
•
•
Strategy Builder;
Integrated Trading;
Simulation Manager;
Improvian Language;
Function Builder;
DLL Manager;
Portfolio testing;
Comprehensive reports and graphs.
Money Management
•
•
•
•
Point-and-click money management editor;
Stop-loss, trailing stop and profit target rules;
Optimal F, Kelly, Fixed Fractional Trades and Williams formulas;
Custom Formula for Position Size.
Artificial Intelligence
• Wizard-based creation of neural models;
• Neural network-based predictions and strategies;
• Fast optimization with Genetic Algorithms.
Charting
•
•
•
•
Charts in the line, bar or candlestick styles;
Trend-lines, Fibonacci, Gann, Pitchforks, figures and other drawing tools;
Up to 6 visible sub-charts;
Templates.
19
Analytical Studies and Indicators
• Tandem Studies;
• More than 10 analytical studies, including Noise Removal, Ingenious Moving Average, trends
analysis, patterns, Fibonacci clusters;
• Hurst Exponent;
• The most popular indicators including RSI, %R, MACD, OBV, Stochastics and more;
• Custom Indicators and Custom Studies;
• Jurik Research's tools;
• Custom Time Series.
Elliott Wave Analysis
• Automatic wave identification;
• Automatic corrections identification;
• Custom wave definition for experts.
Data Management
•
•
•
•
Data Manager with free end-of-day data downloader (Yahoo & MSN);
Streaming data: eSignal, DTN IQfeed, Man Financial, Interactive Brokers;
User-configurable ASCII import wizard;
Built-in Metastock® and CSI database importer.
Intraday Trading
•
•
•
•
All techniques in real-time;
Custom minute charts;
eSignal, DTN IQfeed, Man Financial, Interactive Brokers data support;
Import MetaStock® and ASCII intraday databases.
NeatScan Market Scanner
• Built-in library of scans;
• Custom scan criteria;
• Advanced filtering.
20
System Requirements
Before installing Tradecision, make sure that the following system
requirements are met:
Recommended:
Processor: 3.0 GHz Pentium 4 or compatible. But the faster the better;
RAM: As much as possible. We recommend that you upgrade your
computer or laptop to the maximum memory supported by your machine,
starting from 2 Gb RAM;
Hard Drive: Tradecision uses approximately 40MB of hard drive space.
However, it is better to have more space to store your studies, models and
trading systems;
Monitor: 19" monitor with 1600x1200 resolution;
Operating System: Windows XP (Home or Professional);
Internet Connection: Direct (ISDN, Cable Modem, DSL) connection to
the Internet;
Power Supply: Uninterruptible Power Supply (UPS), for securing your
equipment against any possible power outages. Your computer, monitor
and modem must all be connected to UPS.
Minimum:
Processor: 1.5 GHz Pentium III or compatible
RAM:1 Gb
Hard Drive: 40 MB free space
Monitor: 800x600 monitor resolution or higher
Operating System: Windows 2000, XP or Vista
Software: Microsoft Internet Explorer 5.0
Attention eSignal Users!
In case of using eSignal please make sure you have eSignal v. 7.9 or higher
installed on your PC.
In order to start using eSignal data in the Tradecision Data Manager, you
need to run and then shut down eSignal several times to get the new .tab
files from the eSignal data feed. It usually takes 2 (occasionally 3-5) restarts
of eSignal. Normally, the process does not take more than a few minutes.
21
Compare Different Versions
There are two different versions of the Tradecision application currently available:
Professional and Professional Real Time.
The following table summarizes the differences between the different versions.
Feature
Professional
Professional Real-Time
Data Manager
X
X
Charting & Drawing tools
X
X
Tandem Studies
X
X
Technical Indicators
X
X
Analytical Studies
X
X
Custom Time Series
X
X
Elliott Wave Analysis
X
X
Neural Networks
X
X
Improvian Language
X
X
Strategy Builder & System Backtesting
X
X
Function Builder
X
X
DLL Manager
X
X
Money Management Editor
X
X
Free daily data from MSN and Yahoo
Finance
X
X
Reads MetaStock, CSI, and ASCII
files
X
X
Custom Indicators & Custom Studies
X
X
Alert Builder
X
X
Neural models and strategy
optimization with Genetic Algorithms
X
X
Streams IQfeed, eSignal, IB, Man
Financial real time data
X
22
Tradecision Professional Edition is designed for professional traders
who use their own indicators and used to build multi-input/multiparameter trading systems, requiring fast and efficient optimization with
genetic algorithms.
Tradecision Professional Real Time Edition is aimed to give intraday
traders the real-time analytics needed to make profitable trading decisions.
23
Installing and Removing the Tradecision Software
To install Tradecision:
1. Run the exe file that contains the Tradecision installation;
2. Follow the instructions provided by the installion screens to complete the
installation.
3. Copy the license.dat file to C\Programs File\Alyuda Tradecision.
For the Tradecision application to work properly, the Tradecision program
folder (typically, C:\Program Files\Alyuda Tradecision) must contain the
license.dat file. This file was sent to you soon after you had purchased the
software.
The installation wizard will create Tradecision folder with program files, help
and examples, and register DLLs.
To remove Tradecision:
1. Open the Windows Control Panel.
2. Double-click Add/Remove Programs.
3. From the list of the installed programs, select Tradecision and click the
Add/Remove button.
4. Follow the instructions contained in the InstallShield Wizard.
24
Chapter 3
Data Manager
Data Manager is a tool, designed to help you collect and maintain market
data.
Before using Tradecision for technical analysis and strategy testing, you
must collect price data to be used using Data Manager. Price data allows
you to build charts and view price quotes. Price data includes Open, High,
Low, Close, Volume, and Open Interest information for a specific time
period.
To start working with Data Manager, you need to add the symbols for
which you want to collect data. Data Manager will not download and
manage data for those symbols that are not included in its Symbol List.
The following Data Manager subsystems allow you to input price data into
the internal database:
•
Built-in downloader provides a quick way of getting free end-ofday quotes from major US and international exchanges via Yahoo
Finance and MSN data provider.
•
Streaming data from eSignal, IB, Man Financial and IQFeed
data (for Tradecision Pro Real Time edition only).
•
User-configurable ASCII import wizard allows you to read quotes
stored on your local hard drive in the format you can define.
•
Built-in MetaStock database importer reads all stocks directly
from your MetaStock databases, including intraday data.
• CSI database support.
25
Once the data is loaded or downloaded, it can be used with Tradecision
for technical analysis, development of strategies and their testing.
26
Opening and Closing Data Manager
To open Data Manager:
1. From the Tools menu of Tradecison, select Data Manager.
The Data Manager window will be displayed.
To close Data Manager:
1. From the Data Manager File menu, select Exit.
The application will be closed.
27
Adding a New Symbol
To add a new symbol to the Symbol List:
1. From the Symbol menu, select Add New.
The Add New Symbol dialog box is displayed.
2. In the Display name box of the Add New Symbol dialog box, enter the
name of the symbol that you want to add.
Note: Data Manager allows creating several aliases for a symbol. This can be useful if
you want to make, for example, a YHOO symbol with end-of-day data and YHOO
with real-time minute data. So you can type different display names for a single symbol.
3. In the Symbol text box, enter the symbol that you want to add.
NOTE: If you need to select something else, the Symbol Lookup dialog box will
help you choose your way to find and add a symbol. You can select a symbol by
Exchange, Category, or Ticker List. Alternatively, you can type the first letter of the
symbol you need from the drop-down list box.
4. Click OK.
28
5. In the Data Source sub-group, click the Change button to select a data
source from which you need to download data.
The Data Source dialog box is displayed.
6. In the Data Source dialog box, select CSI, IQfeed, IB, eSignal,
TC2005, MetaStock, Man Financial, Text File, MSN Money or
Yahoo Finance and define the appropriate parameters and click OK.
7. Enter the following information in the corresponding boxes:
• Description – enter a description of the symbol.
• Comment – enter a comment, if required.
8. From the Category list, select the appropriate symbol category.
9. If you need to select a futures contract, do the following:
•
Click Lookup next to the Futures Contract box;
The Futures Symbols Manager window will display information on the
available future contracts.
•
Select the required futures contract and click OK ,
–OR–
If you do not need to select a futures contract, skip to Step 10 of this
procedure.
Note: The point value and margin for the selected futures contract are taken by the
system automatically from Futures Symbols Manager.
10. From the Periodicity list, select Daily, Weekly, Monthly, Intraday
or Multiple (RT edition only) time frame.
11. In the Start date box, select the symbol’s staring date.
12. In the Precision text box, enter the required decimal value.
Note: With the Precision option, you can specify what level of digital precision the
price data for the selected symbol should have. For example, if you set 4, the price will
be 23.3045, and if you set 2 (default value), it will be 23.30. If you select FOREX as
the symbol category, the precision will automatically be set to 4. The precision level affects
both Data Manager (price data grids) and Tradecision (chart Y axis).
13. From the Status list, select Active or Inactive.
Note: The Inactive status allows you to skip price data downloading for a symbol
when you click the Batch Update button.
29
14. If you want to download the symbol data immediately, select the
Update price data check box.
15. Click Add.
The new symbol will be added to the Symbol List. Now you can
download or import price data for this symbol and use this data in
Tradecision.
Note: If you want the newly created set of parameters to be applied to all symbols
created by you, click Set as Default.
30
Multiple Time Frame Addition for a Single Symbol Name
This capability enables you to create several instances of a single symbol,
but with different time frames. For example, you can easily create AXP
with a minute, daily and weekly periodicity with just a few clicks.
To create several symbol instances for a single symbol name:
1. In Data Manager, click Add New.
The Add New Symbol dialog box will be displayed.
2. In the Display name box of the Add New Symbol dialog box, enter
the name of the symbol that you want to add, for example, Exxon
Mobil.
3. In the Symbol box, enter the genuine name of the symbol as listed
at the corresponding exchange, for example, XOM.
4. In the Data Source area, click the Change button to select the data
source from which the data for the symbol will be downloaded.
5. From the Periodicity list, select Multiple.
31
The Multiple Periodicity dialog box will be displayed.
6. From the Periodicity area, select the time frame(s) you need to create
the new symbol instances. For example, if you would like to create the
XOM symbols with 1 min, hourly and daily periodicity, you need to select
the corresponding check boxes.
Note: you can use the Select all or Clear all options to speed up the selection
procedure.
7. In the Start Date area, select the starting points for Intraday and endof-day symbols.
8. Click OK.
You will see the new symbol periodicity parameters of the in the Add New
Symbol dialog box.
9. Click OK.
The new symbols will appear on the Symbol List:
EXXON MOBIL, 1MIN
EXXON MOBIL, DAILY
EXXON MOBIL, HOUR
32
Adding a Group of Symbols
The system enables adding a group of symbols.. It allows you to select
symbols from the in-built ticker lists.
To add a group of symbols in Data Manager:
1. From the Symbol menu, select Add from a Ticker List.
The Add from a Ticker List dialog box is displayed.
2. From the Ticker List in the Add From a Ticker List ialog box, select the
ticker list you need.
The Symbols group box will display the symbols that the selected ticker
list contains.
Note: You can clear a check box next to a symbol you do not need to use. To facilitate
the selection process, the Select All and Clear All buttons can be used, if appropriate.
3. Select the Update added symbols check box to start updating data
for the selected symbols.
4. Click OK.
The selected symbols will be added to the Symbol List of Data Manager.
Note: Data Manager downloads data with parameters you set as default. That is why in
Data Manager go to Add New or Edit Properties, select configurations you need (Data
Source, Periodicity, etc) and click Set as Default button. So, any new data that you want to
add or update with the help of Add from a Ticker List command will be proceeding
ONLY with these settings. For example, when you add S&P 500 from Data Manager by
selecting Symbol > Add from a Ticker List > select S&P 500, ALL these symbols
will be added with the parameters you indicated when click Set as Default button in the
Add New or Edit Properties. However, settings for different symbols can be defined
without clicking the Set as Default button.
33
Updating Symbol Data
To update data for a symbol on the Symbol List:
1. From the Symbol List, select the symbol the data for which you want to
update.
2. From the File menu, select Update.
3. Select the Receive new data or Refresh all stored data check box.
4. Click OK.
Note: Yahoo Finance uses suffixes for non-US stocks. Thus, in order to get quotes
for non-US symbol you would need to add the corresponding suffix to the ticker symbol.
The suffixes in alphabetical order are:.AS - Amsterdam,.AX - Australia
(ASX),.BC - Barcelona,.BE - Berlin,.BO - Bombay,.BM - Breman,.BR Brussels,.BA - Buenos Aires,.CL - Calcuta,.CR - Caracas,.V - CDNX,.CO Copenhagen,.D - Dusseldorf,.F - Frankfurt,.H - Hamburg,.HA - Hanover,.HK Hong Kong,.I - Ireland,.JK - Jakarta,.KA - Karachi,.KQ - Kosdaq,.KS - KSE,.KL Kuala Lumpur,.L - London,.LM - Lima,.LS - Lisbon,.MA - Madrid,.MX Mexico,.MI - Milan,.MU - Munich,.NS - NSE,.NZ - New Zeland,.OL Oslo,.PA - Paris,.SN - Santiago,.SS - Shanghai,.SZ Shenzhen,.ST - Stockholm,.SG
- Stutgart,.TW - Taiwan,.TA - Tel Aviv,.TO - Toronto,.VA - Valencia,.VI Viena,.DE - XETRA,.S - Zurich.
Find out more information on Yahoo! Finance Quotes – Exchanges at
http://finance.yahoo.com/sd
34
Importing Data from a Text File
To import price data for a symbol selected from a text
database stored on your hard drive:
1. From the Symbol List, select a symbol that you want to update using data
from the text database.
2. From the File menu, select the Import text files.
The Import from folder dialog box is displayed.
3. In the Import from folder dialog box, click Browse to browse for the
folder containing the database.
You can define some additional parameters for the file being retrieved,
such as Columns and Order, Data start & Formatting, Conversion
Factor, Date format, Time Format and Separators.
4. Select any of the following additional parameters, if required, or skip to
step 5 of this procedure:
35
• The Comma, Semicolon, Space character or Tab character from the
Item separator list.
• The Point or Comma depending on what is used in your text file, from
the Decimal separator list.
• The None, Comma, Quote or Space character depending on what is
used in your text file, from the Thousand separator list.
• None, Double quote or Quote depending on the way the strings are
separated in your text file, from the String delimiter list.
5. Click Import.
36
Importing MetaStock Database
Tradecision allows importing a MetaStock database.
To import a Metastock database:
1. From the File menu, select Import MetaStock database.
The Folder’s view dialog box is displayed.
2. In the Folders' view dialog box, select the folder containing your
MetaStock database.
3. Click Import.
37
Updating Symbols Using the Batch Update Capability
From the Batch Update dialog box, you can easily and quickly update any
symbols to be updated.
To update the symbols:
1. Open Data Manager.
2. From the File menu, select Batch Update.
The Batch Update dialog box will be displayed.
3. In the Symbol selection filter, in the Status box, click Change.
4. Select the status by selecting the corresponding check box. The following
options are available:
• Active
• Inactive
Note: The Inactive status enables you to skip price data download for a symbol or
group of symbols. To facilitate the selection process, you can use the Select All or
Clear All buttons, if appropriate.
5.
Click OK.
6. In the Exchange box, click Change to select the exchange(s) you
need.
7.
Click OK.
38
8. In the Categories box, click Change to select Stocks, Futures,
Indices, Mutual Funds or FOREX.
9. Click OK.
10. In the Datasources box, click Change to select the data source. The
following options are available:
CSI; IQfeed;
MetaStock;
Text file (.csv);
Yahoo Finance;
MSN;
IB;
TC2005;
eSignal.
11. Click OK.
12. If you want to obtain new data, select Receive new data check box,
–OR–
If you want to update the currently stored data, select the Refresh all
stored data check box.
13. Click Update.
The Update Progress dialog box will be displayed.
Note: If any of the symbols have not been updated, the Tradecision-Data Manager
dialog box will display information on the possible causes of the error.
39
Changing Data Source for All Symbols
You can change the data source for a group of symbols or for all symbols
in Data Manager, using the Global Data Source Change functionality.
To change a Data source for a group of symbols:
1. From the File menu, select Global Data Source Change.
The Change Data Source dialog box is displayed.
2. From the Data Source list in the Change Data Source dialog box, select the
data source you need. The following options are available:
•
•
•
•
•
•
•
•
•
•
CSI;
IQfeed;
MetaStock;
Text file;
Yahoo Finance;
eSignal;
Man Financial;
MSN;
TC2005;
Interactive Brokers.
Note: The Symbol selection filter allows selecting symbols for a data source. The
symbols you selected will appear in the Selected symbols box. You can use the
Select All and Clear All buttons to facilitate the symbol selection process, if
appropriate.
40
3. In the Status box, click Change to select the status. The following
options are available:
• Active
• Inactive
Note: To facilitate the selection process, you can use the Select All button, if appropriate.
4. Click OK.
5. In the Exchange box, click Change to select the exchange(s) you need.
Note: To facilitate the selection process, you can use the Select All button, if appropriate.
6. Click OK.
7. In the Category box, click Change to select the category. The following
options are available:
•
•
•
•
•
Stock;
Futures;
Indices;
Mutual Funds;
FOREX.
8. In the Categories dialog, click OK..
9. In the Change Data Source dialog box, click OK to save the changes.
41
Modifying Symbol Properties
To modify the properties of a symbol:
1. From the Symbol List, select the symbol that you want to edit.
2. From the Symbol menu, select Edit properties.
The Edit Properties dialog box is displayed.
3. In the Edit properties dialog box, you can modify the following parameters:
•
•
•
•
•
•
•
•
•
Display name;
Symbol name;
Description;
Data source;
Exchange;
Category;
Futures Contract;
Periodicity;
Storing data range.
4. Click OK.
42
Modifying Symbol Price Data
You can manually modify symbol price data (such as Data, Open, High,
Low, Close, Volume, Open Interest and Total Volume).
To modify price data:
1. From the Symbol List, select the symbol the data for which you want to
edit.
2. From the Symbol menu, select Edit price data.
The Edit price data dialog box is displayed.
3. In the Edit price data dialog box, point to a cell and enter new data.
Note: To insert a new row, click Insert. To delete a row, select it and click Delete. To
add new rows, click Append.
4. To save the changes, click OK.
43
Deleting a Symbol
To delete a symbol from the Symbol List:
1. From the Symbol List, select the symbol that you want to delete.
2. From the Symbol menu, click Delete.
The selected symbol will be deleted from the Symbol List.
44
Deleting Price Data
You can delete price data for a symbol without removing the symbol from
the internal database.
To delete price data for a symbol without removing the
symbol from the database:
1. From the Symbol List, select the symbol the data for which you want to
delete.
2. From the Symbol menu, select Clear price data.
The price data for the selected will be deleted.
45
Exporting Price Data
The Alyuda system supports exporting symbol price data to files of the
coma separated values type (CSV files).
To export symbol price data to a CSV file:
1. From the Symbol List, select the symbol the data for which you want to
export.
2. From the File menu, select Export Symbol Data.
3. In the File name box, enter a new name for the CSV file.
4. Click Save.
A new file will be created and the symbol price data will be saved in the CSV
format.
Note: CSV files can be read by MS Excel.
46
Using the Streaming Mode in Data Manager
Data Manager provides streaming mode functionality. The streaming
mode capability enables receiving market data through Data Manager into
Tradecision charts as soon as the data is provided by the supplying
vendor.
Note: The feature only applicable for symbols with intraday periodicity and for symbols
which have CSV files as their datasource.
To start receiving data in the streaming mode:
1. From the Symbol List, select a symbol or a group of symbols.
2. Right-click the selected symbol and select Start Streaming.
To stop receiving data in the streaming mode:
1. From the Symbol List, select a symbol or a group of symbols.
2. Right-click the selected symbol and select End Streaming.
47
Splits and Distributions
Understanding the Splits and Distributions concepts
Splits
The Splits command is used to adjust the price data and volume for a
stock split.
The Splits lets you make an accurate comparison between a company's
current price and its historical prices. Usually, splits occur when a publicly
held company distributes more stock to holders of existing stock.
Stock splits
A stock split is an upgrowth in the number of outstanding company
shares. For example, in a 2-for-1 stock split, every shareholder with one
stock is given a supplementary share. In this way, if a company had 1
million shares outstanding before the split, it would have 2 million shares
outstanding after a 2-for-1 split. Since each shareholder's equity cannot be
affected by the split, the market price per share is adjusted.
Another type of split, much less common, is a reverse split. In a reverse
split, a company takes shares from investors and then increases their price
to retain market value.
Companies commonly declare stock splits to cut down the price of their
stock to make it more attractive for investors and provide an indicator of
company health.
Distributions
The Distributions command adjusts the price data for the selected
symbol for a distribution. Distribution is a company's payment of cash,
stock, or physical products to their shareholders. Distribution may include
dividends from earnings, capital gains from sale of portfolio holdings and
return of capital.
Investment management companies (i.e., mutual funds) at regular intervals
distribute money that they made by trading in the shares they hold to their
shareholders. These are called distributions or dividends, and a
shareholder has to pay taxes on these payments. Fund distributions can be
made by check or by investing in additional shares.
48
Adjusting Prices for Split or Distribution
To adjust the prices for a split or distribution:
1. From the Symbol List, select the symbol the price data for which you
need to modify.
2. From the Symbol menu, select Splits and Distributions.
The Splits & Distributions dialog box will be displayed.
3. In the Date range area of the Splits & Distributions dialog box, select the
required dates.
4. In the Adjustment area, select Splits and enter the required ratio,
-ORClick Distribution and enter the required amount in the Amount $ per
share box.
5. Click Apply.
49
Making Manual Adjustments
In the event that you use multiple data vendors and have to switch
between those from time to time, you will have to adjust the price data
manually. For example, you may need to divide the Volume into or
multiply it by 100. In Tradecision, this can be done using the Manual
Adjustment. Each price data field can be adjusted within a selected data
range. You can select the adjustment operator (Multiply, Divide, Add, or
Subtract) and edit the adjustment factor (ratio).
From the Manual Adjustment dialog box, the values of the following data
parameters can be adjusted:
Date range. The period of time for which the relevant data must be
adjusted .
Column. The column containing the data to be adjusted. You can select
Open, High, Low, Close and Volume.
Operation. Select the desired operator (Multiply, Divide, Add, or
Subtract) to be used for adjusting the data.
Ratio. The value for which the data in a box will be adjusted.
Note: Be careful when using the Manual Adjustment tool. Once adjustments are
made, it may be difficult to reverse the changes.
50
Applying Manual Adjustments
To apply a manual adjustment:
1. From the Symbol List, select the symbol the price data for which you
need to modify.
2. From the Symbol menu. select Manual Adjustment.
3. From the From and To lists in the Date Range area, select the required
dates.
4. In the Column area, select the check boxes next to the required parameter
or parameters. The following options are available:
•
•
•
•
•
Open,
High,
Low,
Close
Volume.
5. From the corresponding lists, Multiply, Divide, Add, or Subtract.
6. In the Ratio text box(es), enter the required value (or values).
7. Click Apply.
51
Viewing Data in the Symbol Data Pane
In Tradecision, symbol data can be viewed in the right pane of the main window. The price data the
Alyuda system enables viewing includes Open, High, Low, Close, Volume, and Open Interest
information for a specific time period.
To view symbol data:
1. From the Symbol List, select the symbol the price data for which you
want to view.
2. From the View menu, select Symbol price data.
The Symbol Data pane will display the relevant data for the selected
symbol in the right part of Data Manager’s window.
52
Viewing Event Log File
The most important actions performed by the user are automatically saved
by Data Manager. The Event Log file containing the saved actions can be
retrieved and viewed.
To view the Event Log file:
1. From the View menu, select Event Log.
The Event Log pane will be displayed at the bottom of the Data Manager
window.
To clear the Event log pane:
1. From the View menu, select Clear event log.
53
Changing Yahoo and Interactive Brokers Settings
To configure settings used by the in-built Yahoo
downloader:
1. From the Tools menu, select Preferences > Yahoo Finance.
The Yahoo Finance tab is displayed.
2. If you would like to use proxy server, do the following:
a). Select the Use proxy server check box;
b). Enter the IP address and port parameters in their corresponding boxes;
–OR–
If you do not want to use the proxy server, skip to Step 3 of this
procedure.
Note: If you want prices for splits and distributions to be automatically adjusted while
being downloaded from Yahoo Finance, select the Adjust downloaded price check
box.
3. Click OK.
54
Setting Connection Parameters for eSignal
You can set the timeout for eSignal DataSource. This parameter defines the
period of time (in minutes) during which DataManager expects a response to its
queries from eSignal.
To set the connection parameters:
1. In Data Manager, select Tools>Preferences.
The Preferences window is displayed.
2. Select the eSignal tab.
3. In the Data Retrieval Timeout box, set the required value and click OK
55
To configure specific Interactive Brokers preferences:
1. Open Data Manager.
2. Go to the Tools menu.
3. From the Tools menu, select Preferences > the Interactive Brokers tab.
The Interactive Brokers enables viewing the state of connection between
Data Manager and Interactive Brokers. If the connection indicator is
green, the connection has been duly established and you can start
collecting market data. If the indicator is red, an error has occurred. If is
the indicator is yellow, Data Manager is currently trying to connect to IB.
4. In the Connection Properties area, enter the following connection
parameters:
Address. In case TWS is started from a local PC, you can leave the box
empty. If TWS is located on a remote machine, you enter the IP address
of this remote computer.
Port. The port should be the same as in TWS > Configure >API >
Socket Port.
Client ID. If TWS is accessed by several concurrent users, each of these
users needs a unique Client ID. If there is only one user, the default value
can be used.
5. If you want data from TWS to be automatically collected and saved,
select an appropriate period from the Autosave period list or skip to Step
6 of this procedure.
6. Click OK.
Note: If you would like to monitor your interaction with Interactive Brokers by viewing
messages provided by the application, you can use the Show Messages capability in the
Preferences tab.
56
MSN Money Data Support
Tradecision enables you get free end-of-day stock quotes from MSN
Money data provider (http://moneycentral.msn.com). To find a list of the
symbols provided by MSN Money, visit
http://moneycentral.msn.com/investor/common/find.asp
To receive market data from this data source in Data Manager, you will
need to indicate the MSN Money in the selected symbol’s properties. You
can also change all your symbols stored in Data Manager to this data
provider with just a few clicks.
Defining MSN Money as the Datasource for a New or Existing Symbol
• On the Data Manager’s toolbar, click Add New or Edit Properties.
Depending on the option selected, the Add New or Edit Properties dialog box is
displayed.
• In the Add New or Edit Properties dialog box, click Change next to the
Data source box and then, in the appeared Data Sources window, select
MSN Money and click OK.
• In the Add New or Edit Properties dialog box, click OK.
MSN Money is now set as the primary data source for the symbol.
Changing All Existing Symbols to MSN Money
If you need to set the MSN Money data source for all the symbols that
you currently have in Data Manager, go to File > Global Data Source
Change. In the Change Data Source dialog box, select MSN Money and
click OK.
57
Futures Symbols Manager
Understanding Futures Symbols Manager
The Futures Symbols Manager enables you specify the settings of futures’
symbols you have on the Data Manager Symbol List. This tool can be used
when you need to assign Point Value and Margin to futures symbols in
relation to their contract specifications. Tradecision will use the data that
you provide in Futures Symbols Manager for of its builders. For example,
when you need to backtest a strategy on a futures symbol, Simulation
Manager will read the symbol’s point value and margin value from Futures
Symbols Manager.
To using Futures Symbols Manager:
1. Open Data Manager.
2. From the Tools menu, select Futures Symbols Manager.
3. In the Future Symbols Manager dialog box, change the values of
Futures Contract, Exchange, Margin and Point Value boxes
for the selected symbol, if required.
4. Select the Insert, Delete or Append options for adding /
removing columns, if required.
Note: If you add a column in Future Symbols Manager, it does not mean that you
have added a new symbol entry in Data Manager (to the Symbol List).
5. Click OK.
Note: In the Point value column, you can only enter integer numbers which are
greater than zero. Keep it in mind that the values in the Symbol column should not to
be the same. Point Value stands for the amount of profit generated by 1 contract for a 1
point increase in price.
The data from Futures Symbols Manager is stored in the FutureContract
.csv file, located in C:\Program Files\Alyuda
Tradecision\Data\DM\.
58
Data Storing Capabilities
Up to Tradecision 2.1 inclusive, one can enter the storing data values for a
symbol using the Bars to store option in the Add New Symbol or Edit
Properties dialogs boxes of Data Manager. When new data for a symbol
arrives with, for example, a 10-day storage period specified, the data for
the first day is deleted as soon as the data for 11-th day arrives. This
caused some problems in the application’s functioning in the streaming
mode, as Tradecision recalculates each technique inserted into the chart
instead of calculating the techniques for the new bars only.
Using the Start Date option
When you add a new symbol using the Add New Symbol dialog box or edit
an existing symbol with from the Edit Properties dialog box, you can enter
the first date to start receiving data for the given symbol using the Start date
box.
Note: For intraday symbols, the entered value contains only the date and the time is
not calculated.
59
Abridging Symbols in Data Manager
You can abridge selected symbols in Data Manager with just a few clicks.
To abridge selected symbols:
1. In Data Manager, select the symbol or symbols whose data you
want to abridge.
2. From the File menu, select Abridge selected symbols.
The Abridge Symbols dialog box will be displayed.
3. Select Daily or Intraday periodicity and then define Start date or
Number of days/bars by selecting the corresponding options.
4. Click OK.
Note: You will need to restart Data Manager to allow the changes take effect.
60
Limiting the Symbol Data Size
During your trading work with Tradecision, a large amount of market data
is accumulated in Data Manager. Sometimes, using such a large volume of
data may lead to slow operation of the application.
For example, when you open several charts with 100,000 bars each, insert
a number of strategies and analytical studies and receive new data in the
streaming mode that will significantly slow down Tradecision’s
performance.
To limit the data size of those symbols which you believe to have exceeded
a reasonable number of bars:
1. Open Data Manager.
2. From the Tools menu, select Preferences.
The Preferences dialog box will be displayed.
3. In the General tab, select the Report about symbols larger than
… bars check box.
4. Enter the value you need.
If you selected the check box and entered a value, each time before
closing, Data Manager will check the symbols’ size. If it finds that for
some of the symbols the limit is exceeded, you will receive a warning
message and the Abridge selected symbols dialog box will be displayed.
Using the functionality in the dialog box, you can abridge selected symbols
to the size you need. Otherwise, if you do not want to abridge the symbols,
you need to click Cancel. After that, Data Manager will be closed and the
symbols will remain as they are.
5. Click OK.
61
Restoring Streaming Mode from Previous Session
Data Manager can automatically activate streaming when the application is
launched. To activate this function, go to the Preferences window (Tools ->
Preferences…) and select the Restore streaming from previous session option
in the window’s General tab.
Data Manager will automatically activate streaming when the application is
launched for those symbols, for which streaming was activated during the previous
session.
62
Exchange Management
If the exchange you need is not included in the Exchange list of Data Manager, you can add
it manually using the Tools menu.
To add an exchange manually:
1. From the Tools menu of Data Manager, select Exchanges.
In the Exchange Management dialog will be displayed.
2. Click Add.
The Add Exchange dialog will be displayed.
3. Fill in the corresponding fields and click OK.
4. In the Exchange Management dialog, click OK.
Note: The exchange you use must contain a Session Time for Data Manager to be able to receive market
data.
63
Holiday Management
The Holiday Management functionality provided by the Data Manager allows adding and editing
holiday lists for different exchanges. To assign a holiday list to a specific exchange, use the Exchange
Management functionality.
Adding a Holiday List
To add a holiday list:
1. Open Data Manager.
2. From the Data Manager Tools menu, select Holidays...
The Holiday window is displayed.
3. In the Holiday window, click Add List...
The Add Holiday List window is displayed.
64
4. In the Name box of the Add Holiday List window, enter the name of the holiday list
being added.
5. To add the date of the holiday, click Add date….
The Add holiday description dialog box will be displayed.
6. In the corresponding boxes of the Add holiday description dialog box, enter the date of
the holiday to be added and a description for it.
Note: In a similar manner, enter the data for all the holidays that are to make up the holiday list
being added.
7. Click OK.
The new holiday will be added to the hoilday lists’ in the Hoilday window.
65
Editing a Holiday List
To edit a holiday list:
1. Open Data Manager.
2. From the Data Manager Tools menu, select Holidays...
The Holiday window is displayed.
3. From the holiday lists in the Holiday window, select and click the holiday list that
you want to edit.
4. Click Edit List…
The Edit Holiday List window is displayed.
5. From the list of holiday lists in the Edit Holiday List window, select the holiday
that you want to edit and click Edit Date…
The Edit holiday description dialog box is displayed.
6. Edit the date and/or description of the holiday as appropriate and click OK.
66
Deleting a Holiday List
To delete a holiday list:
1. Open Data Manager.
2. From the Data Manager Tools menu, select
Holidays...
The Holiday window is displayed.
3. From the holiday lists in the Holiday window, select
the holiday list that you want to delete.
4. Click Delete List…
67
Chapter 4
Charting
Charting being the basis of technical analysis, Tradecision provides a
powerful set of essential tools to organize and analyze your charts in way
you like.
Charts overview
What are charts?
A chart is a graphical image of a security. The word "security" applies to
any tradable financial implement or quantifiable index e.g. stocks,
commodities, bonds, futures or market indices. Any security with price
data over a period of time can be used to build a chart.
A price chart is a series of prices plotted over a specific time interval. On
the chart, the y-axis (vertical axis) represents the price scale and the x-axis
(horizontal axis) depicts the time scale. Prices are plotted from left to right
across the x-axis with the most up-to-date plot being the furthest right.
Each chart can be customized with studies, lines, indicators, text, colors,
bar spacing, and time frames. In Tradesicion chart data can be readily
analyzed, edited, deleted, zoomed and saved to ASCII files.
Technical analysts employ charts to analyze a wide set of securities and
forecast future price movements.
What is technical analysis?
Technical analysis researches past price changes to predict future price
movements. For analysis purposes technical analysts rely almost solely on
charts. Technical analysis is applicable to stocks, commodities, indices,
futures, or any tradable instrument where the price is influenced by supply
and demand. Price concerns to any combination of the open, high, low or
close for a given security over a specific timeframe. The time frame can be
based on intraday (tick, 5-minute, 15-minute or hourly), daily, weekly or
monthly price data and last a few hours or many years. Besides, some
technical analysts include volume or open interest figures with their study
of price action.
The use of charts is not bounded by just technical analysis. Because charts
provide an easy-to-read graphical representation of security price
movement over a specific time period, they can also be of great use for
fundamental analysts.
The chart is the basis of technical analysis, and over the years, many
various types of charts have been developed.
There are four most popular ways of displaying price data: line chart, bar
chart, candlestick chart and point & figure chart.
68
Chart types
Below you can find the description of the most popular chart types:
Line Chart
This is one of the simplest sorts of charts. It is formed by plotting one
price point, usually the close, of a security, over a time interval.
Connecting the dots, or price points, over a period of time, creates a line.
Some investors and traders consider the closing level to be more
significant than the open, high or low.
By paying attention to only the close, intraday swings can be ignored. Line
charts are also used when open, high and low data points are not available.
Sometimes only closing data are available for certain indices, thinly traded
stocks and intraday prices.
69
Bar Chart
A bar is one unit of data. For daily data, a bar represents the data for a
single trading day.
A bar chart is a graphic display of an issue's performance over a period of
time. A bar chart is used to plot price movements using vertical bars
indicatory price ranges. A bar chart is the beginning for all indicators and
studies. Each bar represents a specific time interval, such as one day, one
week, or one month.
The bottom of the bar starts at the lowest issue trade price in that time
interval and the top of the bar ends at the highest price. In addition, there
are two smaller horizontal bars pointing to the left and right. The bar
pointing to the left indicates the opening price for the issue and the bar
pointing to the right shows the closing price. The prices of the bar
coincide with the scale found on the right side of the bar chart.
70
Candlestick Chart or Japanese Candlesticks
Developed by the Japanese in the 1600's (in that time the Japanese began
using technical analysis to trade rice), a candlestick chart in many respects
is alike the bar chart. The major distinction is the graphical description of
each period in a candlestick.
Major Candlestick Chart Formations: Gravestone Doji, Dragon-fly Doji,
Abandoned Baby Doji, Harami Cross, Engulfing Pattern, Evening Star,
Dark Cloud Cover.
A candlestick consists of an upper shadow, lower shadow and the body.
The candlestick is formed from the open, high, low and close prices of a
specific time period. Each candlestick represents one period of data
(minute-day-week-month).The color of the candlestick is determined by
the interrelation between the open and close. If the close is higher than
the open, a white real body is formed. If the close is lower than the open,
a black real body is formed.
The thin lines above and below the real bodies represent the high and the
low for the period and are referred to as shadows. The high for the period
is the upper shadow and the low is the lower shadow. Due to these
shadows, which look like wicks on a candle, the term "candlestick"
appeared.
Candlestick charts clearly illustrate the supply and demand concepts. The
advantage of candlesticks is the ability to highlight trend weakness and
reversal signals that may not be visible on a bar chart. A trader can
compare the relationship between the open and close as well as the high
and low.
71
Working with Charts
There are several ways to create a new chart in Tradecision. You can use
the Symbol Box or the New Chart command.
72
Opening a New Chart Using the Symbol Box
The Symbol Box is located on the main toolbar. In this box, you can
enter a symbol name to open a new chart. The most recently used
symbols are remembered in in the drop-down list.
Note: Using the Symbol Box you can not only open a new chart but also create a
corresponding symbol in Data Manager. The new chart and symbol will use the same
properties (data source, periodicity, and so on.) as those you indicated in Data Manager
using the Save As Default command. This command can be found in the Add New
Symbol and Edit Properties dialogs.
73
Creating a New Chart using the New Chart Command
To create a new chart:
1. From the File menu, select New Chart.
The Select symbol to chart dialog box will be displayed.
2. In the Symbol box, enter or select the symbol that you want to chart.
3. Click OK.
To speed up the symbol selection process, you can filter the list of the
available symbols by category or by exchange.
74
To use the category filter:
1. Under Filter, select the Category check box.
2. From the list, select stocks, futures, index, options or mutual funds.
3. Enter or select from the list a symbol in the Symbol box.
4. Click OK.
To use the exchange filter:
1. Under Filter, select the Exchange check box.
2. From the list, select the exchange you need.
3. Enter or select from the list a symbol in the Symbol box.
4. Click OK.
75
Chart-Opening Option
Using this functionality, you can open new charts within an active chart
window without the need to close the chart window itself. This means that
you can change a symbol on the active chart once the chart is opened. For
example, if you want to take a look at 100 charts, you will not have to open
and close 100 windows.
Note: You can open multiple charts in a single workspace. However, only the
chart that has an active chart title is considered as the active one. Also, the
active chart is ticked at in the Window menu.
To open another chart in the active chart window:
1. Open a chart.
Next to the Symbol Box, you the Chart Opening icon is located. The
icon has two different views that can be changed with a mouse-click:
a) The arrow in the icon means that the new chart will be displayed in the
active (current) chart window.
b) The plus in the icon means that the new chart will be displayed in a new
chart window.
2. Select the Arrow option.
3. In the Symbol Box on the main toolbar, enter a symbol name.
The new chart will be opened in the same chart window.
76
77
Scrolling a Chart
The horizontal scroll bar is situated at the bottom of a chart. Using this
scroll bar allows you to move through the price chart.
To scroll through the chart:
1. Drag the scroll box forward or backward to move through the chart.
–OR–
Click the left scroll arrow to scroll backward through the chart, and click
the right scroll arrow to scroll forward through the chart.
78
Using Chart Time Frames
To change the chart time frame:
1. From the View menu, point to Time Frame and then select the time
frame.
The following options are available:
•
•
•
•
Minute;
Daily;
Weekly;
Monthly.
79
Customizing Charts
You can customize a number of properties and elements in a chart, such
as the color of its background, the font, chart grid, title, scrollbar, day
break markers and axes.
To modify the properties of a chart:
1. Double-click the background of the chart.
The Chart Properties dialog box will be displayed.
80
Changing the Background Color
To change the background color of the entire chart:
1. Double-click the background of the chart.
The Format tab of the Chart Properties dialog box will be displayed.
2. From the Background Color list in the Format tab, select the color you
that you want to use.
3. Click OK.
81
Changing the Font
To change the font of the text of the chart’s heading
and y-axis numbers:
1. Double-click the background of the chart.
The Format tab of the Chart Properties dialog box will be displayed.
2. Under Text Font group box in the Format tab, click Change and then
select the text font that you want to use.
3. Click OK.
82
Changing the Chart Titles and Scrollbar Options
Using these options you can save space in your workspace.
1. Double-click the background of the chart.
The Chart Properties dialog box will be displayed.
2. In the Chart Proprties dialog box, select the Components tab.
3. In the Chart elements group box of the Components tab select or clear the
Show chart titles and/or Show scrollbar check boxes.
4. Click OK.
83
Enabling and Disabling the Chart Grid
The Grid feature is a method of visually distinguishing between different
prices and dates in a chart. The Grid feature is not an indicator or study.
To enable the Grid capability:
1. Double-click the background of the chart.
The Chart Properties dialog box will be displayed.
2. In the Grid area of the Components tab, select the Horizontal Grid and/or
Vertical Grid check box.
3. Click OK.
84
Displaying Day Break Markers
To display day break markers:
1. Double-click the background of the chart.
2. The Chart Properties dialog box will be displayed.
3. In the Chart Properties dialog box, select the Components tab;
4. In the Components tab, select the Show day break markers check box and
select the line that you prefer;
5. Click OK.
85
Axes and Scaling
Choosing the Vertical Axis Scale Type
You can select from three different vertical axis scaling options. The Axes
tab of the Chart Preferences dialog enables selecting a scaling type which
suits your trading style.
To choose a price axis:
1. Double-click the chart.
The Chart Properties dialog box will be displayed.
2. In the Chart Properties dialog box, select the Axis tab.
3. In the Price Axis area of the Axes tab, select the check box next to the
axis option that you want to use. You can select from the following
options:
• Screen. Shows the minimum and maximum chart points of the visible
chart area.
• Entire. The minimum and maximum of price values agreed with
minimum and maximum chart points even if the chart points are out of
the visible area.
• User defined. You can define the minimum and maximum values for the
price axis using the Min and Max boxes
Note: You can define the minimum and maximum values of the price axis using the
Min and Max boxes. The default option used by Tradecision is Screen.
86
4. Select a position for the Vertical Axis by selecting the Left or the Right
option.
Note: If the Right option is selected, you can select Show price for the last bar
check box to choose Close, Open, High or Low.
5. Click OK.
87
Using the Logarithmic Scale
The Logarithmic scale is a scale on which the actual distances from the
origin are proportional to the logarithms of the corresponding scale
numbers. Using the Logarithmic scale, you can display prices with a wide
variation range (several degrees) on a price chart. The Logarithmic Vertical
Axis can be used only for the main chart. The Logarithm base can be 10,
'e' or another user-defined value.
Note: Any value defined by the user must fall within the range of 2..100.
To use the Logarithmic Vertical Axis:
1. Double-click the chart.
The Chart Properties dialog box will be displayed.
2. In the Chart Properties dialog box, select the Axes tab.
3. In the Axes tab, select the Logarithmic Vertical Axis for Main Chart
check box.
4. In the lower section of the Chart Properties dialog box, select one of the
following Logarithmic Vertical Axis value:
Decimal. Select the corresponding option (default).
Natural (e). Select the corresponding option.
Custom. Select the corresponding option and enter the required value.
Note: Tradecision does not use Logarithmic scale by default.
5. Click OK.
88
Defining a Session Range
As well as defining the day session range for the whole of a workspace,
you can define the session range for a single chart.
To define the session range for a chart:
1. Open a chart.
2. Right-click the chart.
3. From the shortcut menu, select Chart Properties.
The Chart Properties dialog box is displayed.
4. In the Chart Properties dialog box, select the Session tab.
5. In the Chart Session Range area of the Session tab, select the Use
Workspace settings check box.
6. If you want to define a custom range, select Define custom range
option, and then select the appropriate values from the Start and End
lists,
–OR–
If you do not want to define a custom range, select the Disable Session
Range check box.
7. Click OK.
89
Zooming in on or out of Parts of a Chart
You can zoom in on different parts of a chart.
Note: To speed up the zooming procedure, you can use the corresponding toolbar
buttons from the Standard toolbar.
To enlarge a section of a chart:
1. From the View menu, select Zoom In Box.
2. Point to the chart and then drag to the desired location.
To zoom out of a chart section:
1. From the View menu, select Reset zoom.
90
Changing Bar Spacing and Height
The Changing bar spacing capability is used to view enlarged and more
detailed versions of bar/chart sections.
Note: To speed up the bar spacing changing procedure, you can use the corresponding
toolbar buttons from the Bars toolbar.
91
Increasing Bar Spacing
To increase the bar spacing:
1. From the View menu, point to Bars, and then select Increase bar
spacing.
2. Click as many times as is necessary for getting the desired bar spacing.
3. To return to the original bar spacing, from the View menu, select Reset
Zoom.
92
Decreasing the Bar Spacing
To decrease the bar spacing:
1. From the View menu, point to Bars, and then select Decrease bar
spacing.
2. Click as many times as is necessary for getting the desired bar spacing.
3. To return to the original bar spacing, from the View menu, select Reset
Zoom.
Increasing the Bar Height
To increase the bar height:
1. From the View menu, point to Bars, and then select Increase bar
height.
2. Click as many times as is necessary for getting the desired bar spacing.
3. To return to the original bar spacing, from the View menu, select Reset
Zoom.
Decreasing the bar height:
To decrease the bar height:
1. From the View menu, point to Bars, and then select Decrease bar
height.
2. Click as many times as is necessary for getting the desired bar spacing.
3. To return to the original bar spacing, from the View menu, select Reset
Zoom.
93
Custom Bars
Understanding Custom Bars
The Custom Bars capability enables the trader to prepare for different,
unexpected market scenarios by visualizing and analyzing in detail the
various possible market developments.
Using the Custom Bars functionality you can modify the price data in the
current price chart. For example, you can add manually new bars using the
Date, Time, Open, High, Low, Close, Open Interest and Volume
options. Custom Bars can also be useful if you need to add new bars to
test a trading strategy while modeling future market behaviors.
To add custom bars into an open chart:
1. From the Tools menu, select Custom Bars.
The Custom Bars window will be displayed.
The following options can be used from the Custom Bars toolbar:
a.
b.
c.
d.
e.
f.
g.
h.
Append – for adding a new row to the end of the list;
Remove – for deleting a row from the list;
Insert – for inserting a new row after a selected row;
Increase – for increasing the selected custom bars;
Decrease – for decreasing of the selected custom bars;
Up – for moving up the selected custom bar;
Down – for moving down the selected custom bar;
Invert – for switching around the open and close data of
the selected custom bar;
i. 3Up – for adding 3 bullish custom bars in a row;
94
j. 3Down – for adding 3 bearish custom bars in a row;
k. 3Side – for adding 3 sideway custom bars in a row.
2. To add a new row at the end of the list, click Append.
Note: You can add the Date, Time, Open, High, Low, Close, Open
Interest and Volume values manually, or you can use the corresponding boxes in the
right part of the Custom Bars dialog box.
Note: At the bottom of the Custom Bars dialog box, you can see a duplicate of the
opened chart to see how the bars will be added to the actual chart.
3. Use the options from the Custom Bars toolbar, if required.
4. Click Close.
The Custom bars will be added to the current chart.
Note: In the streaming mode, the custom bars start being updated with the actual
market information. Those custom bars whose date coincides with the date of the bars
reflecting the actual market information are replaced by the latter.
95
Chapter 5
Drawing Objects
The Tradecision functionality enables marking your price charts using a set
of accurate drawing tools. You can click and drag your mouse to draw,
modify and customize the trendlines, figures, Pitchforks, Gann tools,
Fibonacci tools and many other technical analysis objects in your chart in
an easy and simple manner.
96
Trendlines
Understanding trendlines
A trendline is a straight line that connects two or more price points and
then extends into the future to act as a line of support or resistance. The
breaking of a trendline usually signals a trend reversal. Trendlines illustrate
the course of the market movement and give a basic consideration in any
analysis.
Up Trendline
An up trendline has a positive incline and is formed by connecting two of
lower points. The second low must be higher than the first for the line to
have a positive incline. Up trendlines act as support and indicate that netdemand (demand less supply) is increasing even as the price increases.
A rising price combined with growing demand is very bullish and shows a
strong buyer determination. As long as prices remain above the trendline,
the uptrend is considered solid and intact. A break below the up trendline
indicates that net-demand has weakened and a change in trend could be
imminent.
Down Trendline
A down trendline has a negative incline and is formed by connecting two
or more high points. The second high must be lower than the first for the
line to have a negative slope. Down trendlines act as resistance and
indicate that net-supply (supply less demand) is increasing even as the
price declines.
A declining price combined with increasing supply is very bearish and
shows a strong resolve of the sellers. As long as prices remain below the
down trendline, the downtrend is considered solid and intact. A break
above the down trendline indicates that net-supply is decreasing and a
change of trend could be imminent.
97
Using Trendlines
Validation
It takes two or more points to draw a trendline. The more points are used
to draw a trendline, the more validity is attached to the support or
resistance level represented by the trendline. It can sometimes be difficult
to find more than 2 points to build a trendline. Even though trendlines
constitute an important aspect of technical analysis, it is not always
possible to draw trendlines on any price chart. Sometimes, the lows or
highs cannot be matched. The general rule in technical analysis is that it
takes two points to draw a trendline and the third point confirms the
validity.
Support and Resistance
An important concept in the use of trendlines is that of support and
resistance. A continued trend is based on underlying support for prices in
the market, for whatever reason. Similarly, there's resistance to higher
prices built into the market. The trendline is one way to capture and
illustrate these areas of support and resistance.
As long as the market stays within these areas of support and resistance, as
shown by a trendline, the trend is sustained. Any penetration through a
trendline warns of a possible change in trend. We may not know the
reason behind such a change, but we do know that for some reason the
support or resistance for a market is changing.
Signals
It is accepted by some technical analysts that signals are generated
primarily when trendlines are broken. A particularly strong signal is
generated any time a long term trendline is broken.
Some traders also use the price "bouncing" off a trendline as a signal. If an
upward trendline holds, for instance, you may have a buying opportunity
at a relatively low price. If the price is in a well-established channel, the
other side of the channel can give you an approximate price target.
98
Drawing Trendlines
To draw a trendline:
1. From the the Insert menu, select Trend line.
2. Position the mouse at the starting point and then drag the line to the
ending point.
99
Extending a Trendline
To draw a trendline extension:
1. Double-click a trendline.
The Object properties dialog box is displayed.
2. In the Object Properties dialog box, select the Extension tab.
3. In the Extension tab of the Object Properties dialog box, select the way in
which you want to extend the trendline. The following options are
available:
• From the starting point of the line. The extension will be added to the
starting point.
• From the ending point of the line. The extension will be added to the
ending point.
4. Click OK.
100
Horizontal Line
You can use a horizontal line to draw horizontal support/resistance lines
and to mark a price level across a chart.
Drawing a Horizontal Line
To draw a horizontal line:
1.
From the Insert menu, select Horizontal line.
2. Position the mouse at the starting point and then drag the line to the
ending point.
Extending a Horizontal Line
To extend a horizontal line:
1. Double-click a horizontal line.
The Object Properties dialog box is displayed.
2. In the Object Properties dialog box, select the Extension tab.
3. In the Extension tab of the Object Properties dialog box, select the way in
which you want to extend the horizontal line.
• From the starting point of the line The extension will be added to the
starting point.
• From the ending point of the line. The extension will be added to the
ending point.
4. Click OK.
101
Vertical Line
A vertical line is a useful chart analysis tool. When depicted, it spreads
across the entire workspace, including the main chart and sub-charts.
Drawing a Vertical Line
To draw a vertical line:
1. From the Insert menu, select Vertical Line.
2. Position the mouse at the point in your chart from which you want the
line to be drawn.
102
Changing the Color and Style of a Vertical Line
To change the color and style of a vertical line:
1. Double-click a vertical line.
2. In the Object properties dialog box, under Line, select the color and style
that you want to use.
3. Click OK.
103
Rectangle
A Rectangle is a drawing tool used for marking specific parts of a chart.
For example, Rectangles can mark a group of bars showing an upward- or
downward-trending market. Rectangles can also be used along with
analytical tools.
By combining drawing tools with analytical studies, you can measure how
well you are able to visually identify the market situation before applying
technical analysis studies in your chart.
Drawing a Rectangle
To draw a rectangle:
1. From the Insert menu, select Rectangle.
2. Position the mouse where you want to anchor and then drag it until you
reach the desired dimensions.
Note: You can change the parameters of a plotted rectangle by right-clicking it and
selecting Properties from the shortcut menu.
104
Ellipse
Understanding Ellipses
Ellipse is a drawing tool used to mark specific parts of a chart that you
believe important.
Drawing an Ellipse
To draw an ellipse:
1. From the Insert menu, select Ellipse.
2. Position the mouse where you want to anchor and then drag it until you
reach the desired dimensions..
105
Triangle
Understanding Triangle
Triangle is a drawing tool used to mark specific parts of a chart. You can
also use Triangles along with analytical tools.
By combining drawing tools with analytical studies, you can measure how
well you are able to visually identify the market situation before applying
technical analysis studies in your chart.
Drawing a Triangle
To draw a triangle:
1.
From the Insert menu, select Triangle.
2. Position the mouse where you want to anchor and then select the second
and third points. The sides of the triangle will converge automatically.
Note: You can change the parameters of a plotted triangle by right-clicking it and
selecting Properties from the shortcut menu.
106
Buy and Sell Markers
Buy and Sell markers are drawing tools used to mark specific parts of a
chart you believe important. Using the markers, you can denote specific
occurrences, such as the bar at which you purchased a stock, sold a stock,
identified an uptrend, and so on.
You can use markers in conjunction with analytical tools. For example,
there is always a period of time between a trading strategy generating an
order and it filling the generated order. This difference in price is known
as slippage. To determine an average slippage amount, you can insert a
marker indicating the bar that your position was filled and then calculate
the difference between the point in time when your orders are generated
in accordance with your strategy and the point when these orders are
filled
107
To insert Buy or Sell marker into a chart:
1. From the Insert menu, click Buy marker or Sell marker.
2. Position the mouse pointer where you want the marker to be located on
the chart.
3. Click the mouse to insert the marker into the chart.
To change the color of a Buy/Sell marker:
1. From the Tools menu, select Preferences.
The Preferences dialog box is displayed.
2. From the Long color and Short color lists in the Objects tab of the
Preferences dialog box, select the colors that you want to use.
3. Click OK.
Note: The colors that you have selected will be set as the default ones for all newly
created markers.
108
Text Label
The great flexibility of the text drawing tool enables you to enter your
trading ideas, customized notations and specific chart activities directly
into your chart. This allows you to save placing text notes over a
chartmuch faster.
To include notes in a chart:
1. From the Insert menu, select Text Label.
2. Click the place on the chart where you want to insert the text note.
The Text Label dialog box will be displayed.
3. In the Text Label dialog box, enter the text you want to be placed on a
chart.
4. Click OK.
109
Chart Markers
You can insert chart markers into a price chart to mark specific points you
believe important for your analysis. The makers can be customized with
color and size.
Inserting a Marker into a Chart
To stamp a marker on a chart:
1. From the Insert menu, select Chart Marker.
2. Position the mouse pointer where you want the marker to appear on the
chart and click the mouse.
3. In the Add Marker dialog box, select a marker from the palette.
4. In the Properties area, select Color and Size (for example, small,
medium, or large) for the selected marker.
5. Click OK.
110
Fibonacci Numbers
Understanding Fibonacci Numbers
It is believed that in the 12th century Italian mathematician Leonardo Fibonacci
discovered a connection between what is now referred to as Fibonacci Numbers
while studying the Great Pyramid of Gizeh in Egypt.
Fibonacci Numbers are a sequence of numbers in which each subsequent number
is the sum of the two previous numbers, for example, 1, 1, 2, 3, 5, 8, 13, 21, 34, 55,
89, 144, and so on.
The ratio between any number and the next larger number is equal to 0.618 after
the first four calculations. The ratio between any number and the next lower
number is approximately 1.618 (the inverse of 0.618).
The well-known Elliott Wave Principle is also based on the application of
Fibonacci numbers to the waves seen in a price chart
111
Managing Fibonacci Levels
Tradecision enables adding and removing Fibonacci levels.
To add or remove Fibonacci Levels:
1. Double-click the Fibonacci Retracements, Extension and Circles line.
The Object Properties dialog box is displayed.
2.
3.
4.
5.
In the Object Properties dialog box, select the Fibonacci Levels tab.
Click the Add button to add a new level.
To delete a level, select it from the list and click the Remove button.
Click OK.
112
Fibonacci Retracements
Fibonacci Retracements help anticipate support and resistance levels along
with price targets. Fibonacci Retracements indicate possible support and
resistance levels from important highs and lows. The distance between the
start and end points is divided into Fibonacci Retracements, which suggest
possible support and resistance points.
The Fibonacci Retracement tool is used to measure the amount the
market has retraced compared to the overall market movement. When use
together with Elliott waves, Fibonacci Retracements are commonly drawn
from the beginning of Wave 1 (the Zero point) to the top of Wave 3 to
find the target price area for the Wave 4 retracement.
Watch for the completion of a trend or correction at the Fibonacci
Levels. Horizontal lines are drawn at the common Fibonacci levels of
38.2%, 50% and 61.8%. As the price retraces, support and resistance often
occur at or near the Fibonacci Retracement levels.
113
Drawing Fibonacci Retracements
Fibonacci Retracements are based on a trendline drawn between a
significant trough and peak. If the trendline is rising, the retracement lines
will project downward. If the trendline is falling, the retracement lines will
project upward.
A start and end point are neeeded to draw a Fibonacci Retracement on a
chart. All the level can be changed as appropriate.
To draw Fibonacci Retracement in a chart:
1. From the Insert menu, select Fibonacci Retracement.
2. Move the cursor on the chart to the starting point.
Note: The starting point is generally an important high or low on the chart.
3. Then drag the mouse to the ending point.
Notes:
• The ending point is usually the end of an important trend or correction following the
starting point.
• The number of Fibonacci Retracement levels appearing on the chart can be changed in
the object properties.
114
To change the Fibonacci Retracement levels:
1. Double-click the Fibonacci Retracement.
The Object properties dialog box is displayed.
2. In the Object properties dialog box, select the Fibonacci Level tab.
3. Select the check boxes next to the required numbers.
4. Click OK.
115
Fibonacci Extension
The Fibonacci Extension tool is used to measure the amount the market
has extended compared to the overall market movement. Fibonacci
Extensions give you general target price areas.
116
Drawing a Fibonacci Extension
To draw a Fibonacci Extension on a chart:
1. From the Insert menu, select Fibonacci Extension.
2. Move the cursor on the chart to the starting point.
Note: The starting point is generally an important high or low on the chart.
4. Then drag the mouse to the ending point.
Note: The ending point is usually the end of an important trend or correction following
the starting point.
To change the Fibonacci Extension levels:
1. Double-click the Fibonacci Extension.
The Object properties dialog box is displayed.
2. In the Object properties dialog box, select the Fibonacci Level tab.
3. Select the check boxes next to the required numbers.
4. Click OK.
117
Fibonacci Circles
The Fibonacci Circles tool is used to find support and resistance areas in
both price and time. The circles are drawn centered on the last peak or
trough, crossing the original trendline at the points where the retracement
linesconverge. The price will tend to "react" to both the circles and the
retracement levels, as they provide support and resistance.
Fibonacci Circles are plotted by first drawing a trendline between two
extreme points, for instance, a trough and the opposing peak. Three
circles are then drawn, centered on the second extreme point and
traversing the trendline at the Fibonacci levels of 38.2%, 50.0%, and
61.8%.
Fibonacci Circles are believed to signal support and resistance if prices
approach them. A common technique is to display both Fibonacci Circles
and Fibonacci Fan to anticipate support and resistance at the points where
the Fibonacci studies cross.
Note: The points where the circles cross the price data will not change depending on the
scaling of the chart.
118
Drawing Fibonacci Circles
Fibonacci Circles ratios are usually drawn using a recent pivot as the
center of the circle and then stretching it to the latest pivot point.
Fibonacci Circles are based on a trendline that you draw between a
significant trough and peak.
To draw Fibonacci Circles on a chart:
1. From the Insert menu, select Fibonacci Circles.
2. Move the cursor on the chart to the starting point. Then drag the mouse
to the endingpoint.
To change the levels of Fibonacci Circles:
1. Double-click on the Fibonacci Circles.
2. In the Object properties dialog box, click the Fibonacci Level tab.
3. Select the necessary numbers check boxes.
4. Click OK.
119
Fibonacci Fans
Understanding Fibonacci Fans
The Fibonacci Fan is a three-line guide originated from the Fibonacci
number series that some traders believe assist in identifying the following
areas of support and resistance. The zones indicated by the fan may
forecast areas of retraction in market trends.
Fibonacci Fan is displayed by drawing a trendline between two references
or extreme points on the chart, generally a trough and opposing peak.
Then, an invisible vertical line is drawn through the second extreme point.
Three trendlines are then drawn from the first extreme point and so they
pass through the invisible vertical line at the Fibonacci levels of 38.2%,
50.0%, and 61.8%.
120
Drawing Fibonacci Fans
Fibonacci fans are drawn by extending a trend line between two significant
extremes on the chart, forexample, from a trough to the opposing peak or
vice versa.
To draw Fibonacci Fan lines on a chart:
1. From the Insert menu, select Fibonacci Fans or click the Fibonacci
Fans button on the toolbar.
2. Click and hold on the important low or high where the Fibonacci Fans
should start.
3. Drag the line to the important high or low.
121
Fibonacci Time
Understanding Fibonacci Time
Fibonacci Times Zones give you a general change in trend areas in relation
to time.
Fibonacci Time Zones are a series of vertical lines that are spaced at the
Fibonacci intervals of 1, 2, 3, 5, 8, 13, 21, 34, etc. The first line is placed at
an extreme point on the chart and the lines that follow are spaced at
increasingly broader intervals in accordance with the Fibonacci sequence.
Time Zones are most appropriate to a long-dated analysis of price
variation and are very likely of limited value when studying short-dated
charts.
Users unpracticed with Fibonacci Studies should apply this type of analysis
only when viewing charts that include multiple years.
The explanation of Fibonacci Time Zones involves looking for significant
changes in price near the vertical lines.
Drawing Fibonacci Time
To draw Fibonacci Time on a chart:
1. From the Insert menu, select Fibonacci Time or click the Fibonacci
Time button on the toolbar.
2. Click at the point in time on the price chart where you want the Time lines
to begin.
.
The Fibonacci Time lines (shown as vertical lines) will be automatically
drawn. The following lines are drawn in sequence from left to right to
define the Fibonacci Time. You can move the Fibonacci Time lines in any
direction across the chart.
122
Fibonacci Time Retracements
Fibonacci Time Retracements can be used to predict when a change in a
trend may occur. Using the tool, you can take two historical points, for
example, two major highs, and project how the distance between these
two points will change. The change will be expressed as percentage (say
161.8%).
The Fibonacci drawing tools enable adding levels and displaying dates
(time).
123
Drawing Fibonacci Time Retracements
To draw Fibonacci Time Retracements:
1. From the Insert menu, select Fibonacci Time Retracements.
2. Click and hold on the important low or high where the Fibonacci Time
Retracements should start.
3. Drag the line to the important high or low.
4. Double-click the Fibonacci Time Retracements.
5. In the Object Properties dialog box, select the Fibonacci Levels tab.
6. If you need to add a new level, click the Add button,
-ORSkip to step 7 of this procedure.
7. Click OK. A new level will be added to the Fibonacci Time Retracements.
124
Andrews’ Pitchforks
Understanding Andrews’ Pitchforks
Andrews' Pitchfork is a line study composed of three parallel trendlines
based on three points you choose.
Dr. Alan Andrews (an investment analyst and educator with an
engineering degree from MIT) developed this method of drawing a
Pitchfork based upon a Median Line. Dr. Andrews' rules say that the
market will do one of the two things as it approaches the Median Line:
The market will reverse at the Median Line.
The market will trade through the Median Line and head for the Upper
Parallel Line and then reverse.
You can use Andrews' Pitchfork to predict market turning points, and it
can be used as a channeling tool for support and resistance modeling.
Dr. Alan Andrews says in his course that there is a high probability
that:
1.
2.
3.
4.
Prices will reach the latest ML;
Prices will either reverse on meeting the ML or gap through it;
When prices pass through the ML they will pull back to it;
When prices reverse before reaching the ML, leaving a 'space', they will
move more in the opposite direction than when prices were rising toward
the ML.
5. Prices reverse at any ML or extension of a prior ML.
(Andrews, A. H., Action-Reaction Course.)
125
Drawing Andrews’ Pitchfork
To draw Andrews' Pitchfork:
1. From the Insert menu, select Andrews' Pitchfork or click the Andrews'
Pitchfork button on the toolbar.
2. Select the left-most point (either a major peak or trough) and then click
starting from the two right-most points (a major peak and a major trough).
The Pitchfork will be automatically drawn.
126
Gann Analytical Tools
Understanding Gann techniques
William D. Gann (1878-1955) is a trading legend. He created and
developed several powerful techniques for studying market action. These
include Gann Angles, Gann Fans, Gann Grids and Cardinal Squares.
W. D. Gann believed that specific geometric patterns and angles had
unique factors that could be used to forecast future price action. The main
aspects of Gann's techniques were geometric angles in connection with
price and time. Gann identified the most significant 1 x 1 angle (equal to a
45 degree angle) and eight other important angles.
Gann said that the ideal equilibrium between time and price exists when
prices rise or fall at a 45 degree angle relative to the time axis. This
phenomenon is also refered to a 1 x 1 angle (i.e., prices rise one price unit
for each time unit).
All of Gann's methods require that equal time and price periods be used
on the charts.
127
Gann Angles
These are the angles available for the Gann Angles tool. You have the
ability to enable each angle separately, or all of them at once.
1x8 1 price unit for every 8 time units.
1x4 1 price unit for every 4 time units.
1x3 1 price unit for every 3 time units.
1x2 1 price unit for every 2 time units.
1x1 1 price unit for every 1 time unit.
2x1 2 price units for every 1 time unit.
3x1 3 price units for every 1 time unit.
4x1 4 price units for every 1 time unit.
8x1 8 price units for every 1 time unit.
128
Gann Fan
The Gann Fan is a tool that uses the squaring of time and price. This
feature is capable of showing very good support and resistance levels and
enabling a trader to forecast market turns.
Gann indicated nine main angles, where 1 x 1 were the most significant
1x8
1x4
1x3
1x2
1x1
2x1
3x1
4x1
8x1
- 82.5 degrees
- 75 degrees
- 71.25 degrees
- 63.75 degrees
- 45 degrees
- 26.25 degrees
- 18.75 degrees
- 15 degrees
- 7.5 degrees
129
Drawing a Gann Fan
To draw a Gann Fan on a chart:
1. From the Insert menu, select Gann Fan.
2. Click a point in time (usually, a high or a low) on a chart.
A Gann fan will be drawn automatically.
130
Changing the Properties of a Gann Fan
Some traders believe that Gann’s 1 x 1 angle (45 degrees) should be
adjusted for each stock using scaling. Some of them use 1 x 0,1 angle
(where “1” is the number of the time units and “0,1” is the number of the
price points).
With the help of Scale point per bar box, you can set and further finetune the value that as you believe is the most correct.
To change the properties of a Gann fan:
1. Right-click the Gann Fan on a chart.
2. From the short-cut menu, select Properties.
The Object Properties dialog box is displayed.
3. In the Object Properties dialog box, select the Gann Fan tab.
4. In the Gann Fan tab, change any or all of the nine significant angles as
appropriate by selecting the corresponding check boxes.
5. Change the Drawing direction by selecting the Draw up or Drawn down
check box.
6. You can set another value in the Scale point per bar text box.
Note: Any of Steps 4-6 of this procedure is optional.
7. Click OK.
131
Changing the Color and Style of Gann fan
Tradecision supports customizing the color and/or style of a Gann Fan.
To change the color and style of a Gann Fan:
1. Select the color and style you need on the Color and Style toolbar.
Note: If you do not see the Drawing object properties toolbar,right-click the
toolbar area and select the Color and Style toolbar from the shortcut menu.
132
Gann Cardinal Squares
Gann square is a tool for anticipating future support or resistance levels
using the all-time low or high price of an instrument. The all-time low or
high price serves as the basic point.
Each higher price increase is entered in a grid managed in a clockwise
manner around the basic point, starting from one place left of the origin.
The resulting formation looks like a square, where the x and y axes are
known as the cardinal-cross. Higher price increments that fall within the
cardinal-cross are, according to Gann, the most likely future support or
resistance levels.
When you insert Gann Squares into a chart, the geometric formations can
indicate important support and resistance levels.
133
Drawing Gann Cardinal Squares
To draw Gann Cardinal Squares:
1. From the Insert menu, select Gann Cardinal Squares.
2. Click a point in your chart.
Gann Cardinal Squares will be drawn automatically.
134
Changing Gann Cardinal Squares properties
To change the properties of Gann Cardinal Squares:
1. Right-click the Gann Cardinal Squares in a chart.
2. From the short-cut menu, select Properties.
The Object Properties dialog box wil be displayed.
3. In the Object Properties dialog box, select the Cardinal Squares tab.
4. In the Cardinal Squares tab of the Object Properties dialog box, choose the
required angles by selecting the corresponding check boxes.
5. To change the Drawing direction, select the Draw up or Drawn down
check box.
6. To display the angles and/or prices, select the Show Angels and/or
Show prices check boxes.
Note: Any of Steps 4-6 of this procedure are optional.
7. Click OK.
135
Changing the Color and Style of Gann Cardinal Squares
To change the color and style of Gann Cardinal
Squares:
You can change the color and/or style of Gann Cardinal Squares by
selecting the required color and/or style on the Color and Style toolbar.
Note: If you do not see Drawing object properties toolbar, right-click the toolbar
area and select the Color and Style toolbar from the shortcut menu.
136
Gann Grid
Gann Grid is used to divide the space of price and time into the most
important Gann angle (1x1).
Drawing Gann Grid
1. From the Insert menu, select Gann Grid.
2. Move the cursor to the starting point in the chart . Then drag the mouse to
the ending point of the Gann Grid.
137
Changing the Properties of a Gann Grid
To change the properties of a Gann Grid:
1. Right-click the Gann Grid in a chart.
2. From the short-cut menu, select Properties.
The Object Properties dialog box is displayed.
3. In the Object Properties dialog box, select the Gann Grid tab.
4. Enter the required values in the Time bars and Price points boxes in the
Grid Cell area of the Gann Grid tab.
5. Click OK.
138
Changing the color and style of a Gann Grid
To change the color and style of a Gann Grid:
You can change the color and/or style of a Gann Grid by selecting the
required color and/or style on the Color and Style toolbar.
Note: If you do not see Drawing object properties toolbar, right-click the toolbar
area and select the Color and Style toolbar from the shortcut menu.
139
Moving Objects
You can move any of the drawing objects in a chart.
To move an object:
1. Click the object that you want to move.
2. Drag the object to its new location.
Deleting Objects
To delete an object:
1. Click the object that you want to delete.
2. From the Edit menu, select Delete.
Removing Groups of Objects from a Chart
When you have multilple drawing objects in your chart, it can be too
cumbersome to remove them manually. Using the Remove charts
objects tool, you can delete all instances of one or more objects.
To remove an object from a chart:
1. To remove multiple instances of one object, from the Edit menu, point to
Remove From Chart, select Chart Objects.
2. Select or clear the corresponding check boxes.
3. Click OK.
Changing the Color and Style of an Object
To change the color and style of an object:
1. Double-click the object.
2. In the Object properties dialog box, under Line, select the color and style
that you want to use.
3. Click OK.
140
Sub-charts
In Tradecision, sub-charts are used to display indicators.
You can insert any drawing object into a sub-chart area. For example, you
can draw trend lines to analyze the divergences between an indicator and
the main price chart.
Each sub-chart has its own value axis (y-axis). All sub-charts share a
common date axis (x-axis). In other words, all of the sub-charts show their
data during the same date range.
The value axis (y-axis) of each sub-chart displays the range of values
included in that sub-chart. By default, the range of values adjusts
automatically to include all of the values in the current date range for the
data fields in the sub-chart. It can also be set to a constant value range.
The date axis (x-axis) displays the range of dates currently displayed in
sub-charts. The date range can be changed to any range of dates for which
there is data. The values used in the date axis adjust automatically to
display as much detail about the date range as possible.
The Horizontal scroll bar at the bottom of the Chart/Sub-chart can be
used to quickly move the date range while keeping the same number of
samples displayed.
141
Volume Sub-Chart
The Volume sub-chart is automatically added when you create a new
chart. It can quickly be removed using a special toolbar button on the
main toolbar. The Volume sub-chart can also be added using the Insert
Indicator dialog box.
Volume is simply a number of shares (or contracts) purchased and sold
during a specified time period (e.g., hour, day, week, month, year). On a
chart, volume is usually represented as a histogram (vertical bars) below
the price chart. The analysis of volume is a basic yet very important
element of technical analysis.
142
Changing the Order of Sub-Charts
To change the order of the sub-charts:
1. From the View menu, click Manage Subcharts.
2. In the Subcharts dialog box, click the sub-chart that you want to move. You
can use the Up or Down button to change the position of the selected
sub-chart.
3. Click Apply.
143
Deleting Sub-Chart
To remove a sub-chart:
1. Right-click the sub-chart that you want to delete.
2. Select Remove Subchart.
The sub-chart will be deleted.
144
Exporting Chart Data
The system allows exporting the data in a chart. The export controls are
located in the chart’s context menu. .
The Export Buy/Sell Markers option of the context menu is
responsible for exporting the buy/sell marker data into a csv file. The
resulting file contains two columns.
The first column contains the date and time and the second one contains
the check box of the buy/sell marker’s availability: 1 – the current bar
has the buy marker;
-1 – the current bar has the sell marker; 0 – the current bar has neither
the buy nor the sell marker.
To export buy/sell markers into a csv file:
1. Right-click the chart that you want to export from and select Export
Buy/Sell Markers.
2. In the file-loading window, select the path for storage of the .csv file.
The Export Subgraph Data option is responsible for exporting the
current value of the current indicator into a csv file. The resulting file
contains two columns: the date /time and the value of the indicator.
To export subgraph data:
1. Right-click the chart that you want to export from and select Export
Subgraph Data.
2. In the file-loading window, select the path for storage of the .csv file.
The Export All Subgraph Data option is responsible for exporting the
values of all the indicators in the chart into a csv file. The resulting file
contains the column date/time and columns with the values of the
indicators.
To export all subgraph data:
1. Right-click the chart that you want to export from and select Export All
Subgraph Data.
In the file-loading window, select the path for storage of the.csv file.
145
Chapter 6
Templates
Understanding Templates
Using templates you can quickly create charts applying specific visual
settings, such as color, line style/type and technical indicators. For
example, if you want to analyze your securities with an SMA, CCI, and
MACD, you can save this information in a template and apply it to any
new chart very quickly.
To do so, you just need to create a chart with the features you need, save
your work as a template and then open another price chart and click
Apply Template. You can also create a default template, which will be
used every time a new chart is created. A default template is automatically
applied to a security when a new price chart is opened.
You can have several templates, each containing some specific settings.
Each template is saved as a file with a *.tpl extension.
146
Applying a Template
To apply a template to a chart:
1.
Open a chart.
2.
Right-click the chart.
3.
Select Apply Template from the shortcut menu.
The Open window will be displayed.
4.
Select the desired template from the Open dialog box.
Saving as Template
To save the current chart settings as a template:
1. Right-click a chart and select Save as Template.
Note: When saving a template, the Templates directory is automatically displayed.
All template files have *.tpl extension.
Note: You cannot save analytical studies and drawing tools in a template.
Saving the Current Chart Settings as a Default Template
To save current chart settings as a default template:
1. Right-click a chart and select Save as Default Template.
Note: The template will be saved into "Templates\default.tpl". The template will be
automatically applied to all new charts.
Note: You cannot save analytical studies and drawing tools in a template.
147
Chapter 7
Workspaces
Workspaces provide a convenient way to manage charts and organize your
investment ideas.
Understanding Workspaces
With Tradecision's workspaces you can organize your charts the way you
like.
Workspace is a single file that contains all the charts with their drawing
objects, indicators and studies. When a workspace is opened, each chart is
opened and displayed on the screen exactly the way it appeared when the
workspace was saved, including all the chart elements. When you save a
workspace, you save all your changes and modifications in all active charts.
You can create a separate workspace for your favorite stock, a group of
stocks, an industry or anything you need to work with. For example, you
may want to analyze QQQ and Dow along with four of your favorite
indicators. Or you may want to save the current positions of windows
with all their elements. The best way to save your time and manage groups
of charts/sub-charts/objects is using workspaces.
Once you have created a workspace, you can add new chart windows to
the workspace, manage charts, indicators, sub-charts, analytical studies, as
well as many other trading ideas, and then save them on your local hard
drive.
You can work with one workspace at a time.
Tradecision saves a workspace in a file with extension Tradecision
Workspace (*.tws).
148
Creating and Saving a Workspace
A blank workspace is automatically created when you start Tradecision.
To save a workspace:
1. From the File menu, select Save workspace.
2. In the Save as dialog box, select the folder where you want to save a
workspace and then enter the name of the new file.
3. Click Save.
Note: We advise that you save your workspaces often when making extensive changes
so that you elude losing your work due to power outages or other unplanned occurrences.
149
Opening Workspaces
To open any of the previously saved workspaces:
1.
From the File menu, click Open workspace.
2. In the Open dialog box, select the folder containing the file with the
workspace that you want to open.
3. Open the file with the workspace.
4. Click Open.
Note: If a workspace meets the following criteria, the signals of the strategies may differ
from those of the previous session:
1. The workspace contains strategy signals, Analytical Studies;
2. Data update of the symbol, contained in the workspace, was made using Data Manager
or in the streaming mode;
3. The Load only…bars option is selected in the Number of bars to be loaded
area of the Preferences> General tab.
To avoid any possible differences, you will be offered to increase the number of the bars being
loaded. The value in the Number of bars to be loaded area will then be set to
Automatically.
In case of reject, the number of the bars, set in the Load only list, will be loaded into the
chart.
In this case, it cannot be guaranteed that the signals of the strategies will be the same.
150
Closing a Workspace
To close a workspace:
1. From the File menu, select Close workspace.
If you have made any changes to the workspace since it was last saved, the
Save As dialog box prompts you to save or discard the changes.
2. Click Yes to save the current workspace before closing it,
–OR–
Click No to discard any changes that may have been made.
151
Deleting Workspace
If you decide to remove a workspace from your local hard drive, you need
to manually delete the appropriate file with.tws extension using the
Windows Explorer or some other file manager.
152
Chapter 8
Technical Indicators
High expertise level in using technical indicators is the absolute "must
have" for a long-term success in trading.
About Technical Indicators
Tradecision enables using the 100+ most popular technical indicators.
An indicator is a mathematical calculation that can be applied to a stock's
price, volume or even to another indicator. The result is a value that is
used to anticipate future changes in prices.
Indicators can inform you about the various aspects of the market, such as
trend, volatility, momentum, market strength, cycle, and so on.
There are many different classes of indicators:
Trend indicators are used to provide information on price trends. Trends
measure the persistence of a price to move in a certain direction during a
certain period of time. Trend indicators are moving averages, MACD,
DMI, Linear Regression, and so on.
Volatility indicators, such as Bollinger Bands, Average True Range,
Standard Deviation, should be used if you want to inform a model about
price volatility. Volatility measures the magnitude of day-to-day
fluctuations in prices (irrespective of the direction in which they move).
Price momentum indicators such as RSI, Stochastic, PercentR and CCI
measure the speed at which prices move during a certain time period. Very
often this kind of indicators is very useful.
There are also market strength indicators, such as OBV, Chaikin
Oscillator, Ease of Movement, MFI, and different volume indicators.
153
Adding an Indicator
To add an indicator to a chart:
1. From the Insert menu, select Indicator.
The Insert Indicator dialog box will be displayed.
A description of the selected indicator will appear in the Description box.
2. In the Indicator List tab of the Insert Indicator dialog box, under
Indicators, enter or select the indicator that you want to insert into a
chart or sub-chart.
3. In the Indicator Parameters area change the parameter value of the
selected indicator.
4. Select the Style tab and choose the color and style of the indicator.
5. In the Style tab, indicate where the indicator should be plotted by selecting
the corresponding check-box. The following options are available:
• A new sub-chart.
• The main chart.
• An existing sub-chart.
6. Click Insert.
The selected indicator will be added to the selected location.
154
Customizing Indicator
1. Right-click the indicator and select Properties.
The Edit Indicator dialog box will be displayed.
2. If required, in the Properties tab of the Edit Indicator dialog box, under
Indicator Properties, change the Parameter and Value of the selected
indicator.
3. Click OK.
You can customize the color and style of the lines that make up the
selected indicator.
To customize the color and style of indicator lines:
1. Right-click the indicator and select Properties.
The Edit Indicator dialog box will be displayed.
2. In the Edit Indicator dialog box, select the Style tab.
3. In the Indicator Style area of the Style tab, select the color and style of
the indicator lines.
Note: You can also select the Display Style.
4. Click OK.
155
Indicator Thresholds
There are indicators that require specific values for their interpretation.
For example, the Relative Strength Index is generally considered to be at
an overbought level above 70 and an oversold one below 30.
Tradecision uses thresholds to mark these important levels. The
Thresholds are horizontal lines usually placed at different levels of a chart
to help in the interpretation of a certain indicator. Every time the indicator
is plotted, the specified thresholds will be drawn automatically.
For each indicator, you can enter up to 10 threshold values and select a
different color and style for each of them.
To define or change the indicator thresholds:
1. Right-click the indicator and select Properties.
The Edit Indicator dialog box will be displayed.
2. In the Edit Indicator dialog box, select the Style tab.
3. In the Thresholds area of the Style tab, enter a threshold value in the
Value box.
4. Click Add or Remove to add or remove new value parameters.
5. Select the Color and Style you want to be used to display the threshold.
6. Click Add. The newly created threshold value will be added to the
thresholds list.
Note: The threshold can be deleted by selecting it and clicking Delete.
7. Click OK.
156
Deleting Indicator
To remove an indicator along with a sub-chart:
1. Right-click the indicator.
2. Select Remove Subchart.
The sub-chart and its indicators will be deleted.
To remove an indicator from the main chart:
1. Right-click the indicator line.
3. Select Remove Object.
The selected indicator will be deleted from the main chart.
157
Indicator Descriptions
An indicator is a mathematical calculation that can be applied to a stock's
price, volume or even to another indicator. The result is a value that is
used to anticipate future changes in prices.
The following technical indicators are available through the Insert Indicator
dialog box:
Acceleration Indicator
Acceleration is the slope of the line fitted between the current price series
slope and the price series slope of a specified number of bars ago.
Accumulation/Distribution
Accumulation/Distribution uses the closing price's proximity to the high
or low to determine if accumulation or distribution have occured in the
market. The proximity value is multiplied by volume to give more weight
to moves with higher volume.
A divergence between the price and Accumulation Distribution may
indicate a trend reversal.
Adaptive Moving Average
Adaptive Moving Average differs from other moving averages in that it
uses changes in volatility to transform the lengths used to calculate two
moving averages. The two moving averages are referred to as the fast
average (shorter length) and the slow average (longer length). The adaptive
moving average that was discussed in the interview with Perry Kaufman in
the 1998 STOCKS & COMMODITIES Bonus Issue (the article originally
appeared in March, 1995) is an excellent alternative to the standard
moving average calculations.
ADX – Directional Movement Indicator
ADX attempts to measure the strength of a trend. A low ADX value
(generally, less than 20-30) can indicate a non-trending market with low
volatility whereas a cross above 20-30 may signal the start of a trend
(either upward or downward).
This indicator can also be used to identify non-trending markets, or a
deterioration of an ongoing trend.
ADX Classic (rounded)
ADX Classic is calculated in much the same way as ADX, except that the
ADX indicator includes decimal values in its results while the ADX
Classic Indicator returns only the integer portion of the ADX value. This
rounding process will cause differences in the value of ADX and ADX
Classic over time. The ADX Classic calculation resembles more closely
Welles Wilder’s original interpretation of ADX.
ADXR (signal line)
The ADXR component is simply a special type of moving average
(WilderMA) applied to the ADX indicator. ADXR is sometimes used as a
signal line. A buy signal occurs when ADX crosses above ADXR, and a
sell occurs when ADX crosses below ADXR. The ADXR differs from
158
ADX in that the ADXR is less sensitive to short, quick reversals because
the ADXR results in a "smoother" calculation.
AKF
Adaptive Kalman Filter returns filtered (smoothed) data, transferred in the
Price parameter. The Length parameter, defining the filtering period, is
similar to the Length parameter in the moving averages, for example, in
EMA. The sharpness influences the smoothness and its value is set as a
value within the range from 1 to 10. The greater this parameter is, the
higher will be the smoothness of the resulting data. The recommended
value is 2,3.
Auto Trend Inter Indicator
This indicator shows that one of the current current bars belongs to the
bullish, beararish or side-way trend. The indicator is calculated using the
same algorithms as those used for calculating the Auto-Trends study. For
a bullish trend, the value of the indicator is > 0. For a bearish trend, the
indicator is < 0. For a sideway trend, the indicator is 0.
Auto Trend Major Indicator
This indicator shows that one of the current bars belongs to the bullish,
beararish or side-way trend. The indicator is calculated using the same
algorithms as those used for calculating the Auto-Trends study. For a bull
trend the value of the indicator is > 0. For bear trend the indicator is < 0.
For sideway trend the indicator is 0.
AutoTrend Minor Indicator
This indicator shows that one of the current bars belongs to the bullish,
beararish or side-way trend. The indicator is calculated using the same
algorithms as those used for calculating the Auto-Trends study. For a bull
trend, the value of the indicator is > 0. For bear trend the indicator is < 0.
For sideway trend the indicator is 0.
Note: Each of the Auto-Trend indicators has a real-tme version. The difference in
calculating the real-time version of any indicator is that no future time values are used,
whereas for calculating the regular offline versions future values are used along with
present and past values.
Average Price
This function returns the average price of a bar.
Average True Range
The Average True Range is the average of the True Ranges over a
specified Period. True Range measures the conventional range of a bar,
but checks the previous bar’s closing price to determine if it is outside the
current bar’s range. If it is, this closing price is used instead of the high or
low. This helps account for gaps between bars. An expanding ATR
indicates increased volatility in the market.
Bollinger Band %B (Middle Line)
Bollinger Bands are moving average envelopes that are plotted at a
standard deviation level above and below price. As the distance of the
159
bands is based on standard deviation, they adjust themselves to volatility
swings in the underlying price.
Bollinger Bands tighten as volatility decreases, and expand sharply as it
increases. Prices normally have a tendency to bounce within the bands’
envelope. However, prices can exceed a band envelope for extended
periods of time during strong trends.
Bollinger Band High
Upper Bollinger Band. Bollinger Bands are moving average envelopes,
plotted at a standard deviation level above and below the price. As the
distance of the bands is based on standard deviation, they adjust
themselves to volatility swings in the underlying price.
Bollinger Bands tighten as volatility decreases, and expand sharply as it
increases. Prices normally have a tendency to bounce within the band
envelope. However, prices can exceed a band envelope for extended
periods of time during strong trends.
Bollinger Band Low
Lower Bollinger Band. Bollinger Bands are moving average envelopes,
plotted at a standard deviation level above and below the price. As the
dimension of the bands is based on standard deviation, they adjust
themselves to volatility swings in the underlying price.
Bollinger Bands tighten as volatility decreases, and expand sharply as it
increases. Prices normally have a tendency to bounce within the band
envelope. However, prices can exceed a band envelope for extended
periods of time during strong trends.
Bollinger Band Width (High-Low)
Bollinger Bands are moving average envelopes, plotted at a standard
deviation level above and below the price. As the dimension of the bands
is based on standard deviation, they adjust to volatility swings in the
underlying price.
Bollinger Bands tighten as volatility decreases, and expand sharply as it
increases. Prices normally have a tendency to bounce within the band
envelope. However, prices can exceed a band envelope for extended
periods of timeduring strong trends.
CCI – Commodity Channel Index
Commodity Channel Index is calculated by determining the difference
between the mean price of a security and the average of the means for the
selected period. This difference is compared with the average difference
for the period of time. The result is multiplied by a constant to ensure that
most of the values fall within the standard range of +/- 100.
It is recommended that one look for divergences between the indicator
and the price. Also, look for extreme readings above 100 and below -100,
indicating overbought and oversold levels.
160
Chaikin A/D Oscillator
The Chaikin Oscillator is created by subtracting a 10-period EMA of
Accumulation/Distribution from a 3-period EMA of
Accumulation/Distribution. This allows analyzing accumulation and
distribution in the convenient form of an oscillator.
It is recommended that one look for divergences between the oscillator
value and price. Another way to use the oscillator is to look for a change
of direction as a buy or sell signal.
Change
The difference between the current and previous price values.
Correlation (directional)
The Correlation indicator calculates the frequency of price movement in
the same direction and in the opposite directions for two price series
during for a specified number of bars. This frequency is indexed as a value
between 1 and –1. It is used as a measure of the tendency of two price
series to move in the same direction.
A positive Correlation value indicates that the two price series tend to
move in the same direction. A negative Correlation value indicates a
strong tendency for these two price series to move in the opposite
directions. A Correlation value close to 0 indicates that there is very little
correlation between the two price series.
Note: The indicator should not be confused with Pearson correlation.
Detrended Price Oscillator
The Detrend Price Oscillator is similar to a moving average in that it filters
price trends to more easily identify cycles. The indicator is an attempt to
define cycles in a trend by drawing a moving average as a horizontal
straight line and placing prices along the line according to their relation to
a moving average. The indicator provides a means of identifying the
underlying cycles that are not apparent when the moving average is
viewed within a price chart. Cycles whose duration exceeds the number of
bars used to calculate the Detrend Price Oscillator are effectively filtered
or removed by the oscillator.
Directional Movement Index
The Directional Movement Index is used for distinguishing between a
significantly trending market and a market with only a sideways
movement. The DMI values range between 0 and 100. The closer to 100
the value is, the stronger the trending characteristics of the market. The
closer to 0 the value is, the stronger the sideways characteristics of the
market.
DMI Minus
DIMinus measures a market's negative directional movement. If DIMinus
is greater than DIPlus, the prices have a stronger negative directional
movement.
161
DMI Plus
DIPlus measures a market's positive directional movement. If DIPlus is
greater than DIMinus, the prices have a stronger positive directional
movement.
Ease of Movement
The Ease of Movement indicator calculates and plots a measure of
relationship between the price and the volume. For instance, a market that
rises on low volume shows a high Ease of Movement, generating positive
values for the indicator. Negative values are generated when prices are
moving down with light volume. When the indicator’s value is close to0,
the prices are not moving or a heavy volume is required to move them.
Ease Of Movement (smoothed)
Calculates a length moving average of the Ease of Movement value using a
calculation method. Valid methods are SIMPLE, EXPONENTIAL,
TRIANGULAR, and VARIABLE ( can be abbreviated as S, E, W, T,
TRI, and VARI.)
Elliott Waves Inter Indicator
Shows the number of a current Elliott wave. The indicator is calculated
using the same algorithms as the Elliott Waves study. For upward waves
1,2,3,4, and 5 the indicator is equal to 1,2,3,4,5correspondingly. For waves
A,B,C , the indicator is equal to 6,7,8. For downward waves, the indicator
takes the same values, but with the minus sign.
Elliott Waves Major Indicator
Shows a number of the current Elliott wave. The indicator is calculated
using the same algorithms as those used by the Elliott Waves study. For
upward waves 1,2,3,4,5 the indicator is equal to1,2,3,4,5,correspondingly.
For A,B,C waves, the indicator is equal to 6,7,8. For downward waves, the
indicator takes the same values, but with the minus sign.
Elliott Waves Minor Indicator
Shows the number of the current Elliott wave. The indicator is calculated
using the same algorithms as those used by the Elliott Waves study. For
upward waves 1,2,3,4,5 the indicator is equal to 1,2,3,4,5 correspondingly.
For A,B,C waves, the indicator is equal to 6,7,8. For downward waves, the
indicator takes the same values, but with the minus sign.
Efficiency
Efficiency is used to calculate the Adaptive Moving Average.
EMA – Exponential Moving Average
EMA returns the Exponential Moving Average of a specified period.
EMA is similar to Simple Moving Average (SMA) in that it averages the
data over a period of time. However, whereas SMA just calculates a
straight average of the data, EMA applies more weight to the data that is
morerecent. The most weight is placed on the most recent data point.
Because of the way it's calculated, EMA will follow prices more closely
than its corresponding SMA.
162
Envelope High
Envelope High indicator is calculated by increasing a moving average by
specified percentage. Moving averages are recognized for their value in
identifying trends. Using moving averages of highs and lows, and adjusting
them to a fixed percentage, can be helpful in finding extreme conditions
of the overbought or oversold levels and in identifying the trading ranges.
Envelope High and Envelope Low are calculated using price data from
the same number of bars.
Envelope Low
The Envelope Low indicator is calculated by reducing a moving average
by specified percentage.
Moving averages are recognized for their value in identifying trends. Using
moving averages of highs and lows, and adjusting them for a fixed
percentage, can be helpful in finding extreme conditions of the
overbought or oversold levels and in identifying the trading ranges.
Envelope High and Envelope Low are calculated using price data from
the same number of bars.
Forecasted Price
The indicator returns the forecasted price of a neural model. The name of
the model must be in the "<name>@<symbol>" format. For example,
for a model with the name 'My_Model_1' trained for the symbol 'CAT',
the parameter value will be "My_Model_1@CAT".
Note: this function does not work if the model output is a custom indicator.
IMA
Ingenious Moving Average (IMA) is a moving average that is based on the
Kalman Adaptive Filter. IMA has extremely low lag and noise
characteristics.
IMACD
Moving Average Convergence Divergence indicator is a momentum
oscillator that is constructed by subtracting the value of a long MA from a
short MA. MACD crossing above zero is considered bullish, and crossing
below zero bearish. Secondly, when MACD turns up from below zero it is
considered bullish. When it turns down from above zero this is considered
bearish.As the MA, IngeniousMA is used
KBABot
Kirshenbaum Bands measures market volatility using standard error of
linear regression lines of the close. The effect is that they gauge the
volatility around the current trend.
KBATop
Kirshenbaum Bands measures market volatility using standard error of
linear regression lines of the close. The effect is that they gauge the
volatility around the current trend.
163
Linear Regression Line
The Linear Regression Line indicator calculates the Regression Line of the
period that you have specified. The function returns the predicted value at
the end of the period. Since the Linear Regression indicator displays the
statistically predicted price value, you can look for cases where the prices
vary sharply from the predicted value.
N-ATR
N-ATR (Normalized Average True Range) is a good tool for improving
your trading and/or market analysis by making a historical and multiple
security comparison. For detailed information, refer to “Cross-Market
Evaluations with Normalized Average True Range” article by John
Forman (TASC magazine, May 2006).
MACD – Moving Average Convergence Divergence
Moving Average Convergence Divergence indicator is a momentum
oscillator that is constructed by subtracting the value of a 26 day
Exponential Moving Average (EMA) from a 12 period EMA. The shorter
EMA is constantly converging toward, and diverging away from, the
longer EMA. This causes MACD to oscillate around the zero level.
There are two classic interpretations of MACD. MACD rising above zero
is considered bullish, and it falling below zero is considered bearish.In the
second case, when MACD returns from below zero it is considered
bullish. When it returns from above zero, MACD is considered bearish.
Another common technique it to time trades according to the MACD
rising above or falling below its "signal line." The signal line is typically a 9
period EMA of the MACD.
Market Facilitation Index
The MFI indicator calculates the measure of price movement’s efficiency
of by gauging the correlation of the range of a bar relative with its
volume. A market is considered efficient when a wide price range is
accompanied by low volume. Conversely, a market is considered less
efficient when a narrow price range is accompanied by high volume.
Mass Index
Mass index identifies trend reversals by measuring the narrowing and
widening of the range between the high and low prices. For details, refer
to Stocks & Commodities, V. 10:6 (265-267): The Mass Index by Donald
Dorsey.
Median Price
Calculates the Median Price indicator: (high + low) / 2
MFI – Money Flow Index
Money Flow Index measures the flow of money into and out of a security.
It is similar to Relative Strength Index (RSI), but takes volume into
account in its calculation. The indicator is calculated by accumulating the
positive and negative Money Flow values, and then creating a Money
Ratio. The Money Ratio is then normalized into the MFI oscillator form.
164
MFI values above 80 typically indicate overbought levels, and values
below 20 – oversold ones. You can also look for divergences between the
MFI and the price as signs of potential trend reversals.
Momentum Indicator
Momentum is the current price of a security, subtracted from the price it
had a specified number of bars ago. A Momentum value above zero
indicates that the price is are moving up, and below zero that they are
moving down.
Momentum can help pinpoint the end of a decline or advance. When
Momentum turns up or turns down, it is a sign that the current move may
be running out of steam.
Money Flow
Money Flow is equal to the average price ((high + low + close) / 3)
multiplied by volume.
Money Flow is the core component of the Money Flow Index (MFI)
indicator.
OBV – On Balance Volume
On Balance Volume measures the strength of volume moving into and
out of a security. If prices close up, the current bar's volume is added to
OBV, and if prices close down, it is subtracted. The result is an indicator
that depicts the flow of volume into and out of a security.
You can often spot divergences between price action and the OBV
indicator. For example, if prices make a new high but the move is not
accompanied by sufficient volume, OBV will fail to make a new high.
Such divergences can be a sign that a trend is nearing completion.
Outside Bar
Marks bars whose High is lower than the High of the previous bar, and
whose Low is higher than the Low of the previous bar.
Parabolic SAR
Developed by Welles Wilder, creator of RSI and DMI, the Parabolic SAR
sets trailing price stops for long or short positions. Also referred to as the
stop-and-reversal indicator (SAR stands for "stop and reversal"), Parabolic
SAR is more popular for setting stops than for establishing a direction or
trend. Wilder recommended establishing the trend first, and then trading
with Parabolic SAR in the direction of the trend.
Percent Change
Returns the percent change between the current time series value and the
time series value n periods ago.
Percent R
PercentR is a momentum indicator used to gauge overbought and
oversold levels, and ranges between 0 and 100. However, unlike most
other momentum oscillators, the low end of the scale represents an
overbought area, and the high end – an oversold condition.
165
A reading of above 80 indicates oversold levels, and a reading below 20
indicates overbought ones. Williams %R has a tendency to peak ahead of
price, so it can be a good tool for identifying trend reversals.
Price High
Price High is the highest value for a specified number of bars.
Price Low
Price Low is the lowest value for a specified number of bars.
Price Oscillator
The Price Oscillator indicator shows the difference between two moving
averages of a stock's price. The difference between the moving averages
can be expressed in either points or percentages
Price Range
The range value of the current bar: High – Low.
Price Range Midpoint
The mid price value of the current bar: (High + Low)/2.
Price Volume Trend
The Price Volume Trend indicator calculates the percentage difference
between the price of the previous bar’s closusre and that of the the
current bar’s closure. The volume is multiplied by this percentage and
added to a running total. The Price Volume Trend indicator is used to
help confirm the strength of a trend by identifying the divergences
between the price and volume.
This indicator can signal possible reversals if an increase in price is not
accompanied by a similar increase in volume. Generally speaking, if there
exists a divergence between a trend’s volume and its price, the momentum
may be slowing down and a price reversal may occur. As the Price Volume
Trend starts accumulating values from the left of the chart, the numeric
value of the Price Volume Trend will depend on the data available in the
chart. Therefore, the relative value, or trend direction, of the Price Volume
Trend is more important than its numeric value.
Rate of Change
The Rate of Change indicator is calculated by dividing the price change
during the specified period into the closing price at the beginning of the
period. The result is the percentage for which the security's price has
changed within the specified period.
When ROC begins to reverse its direction, it is a sign that the current
trend is losing momentum.
RSI – Relative Strength Index
RSI measures a market's internal strength, by dividing the sum of up day
closing prices into the sum of down day closing prices for a specific period
of time. The indicator returns a value within the range from 0 to 100. RSI
is one of the classic momentum indicators developed by Wells Wilder. The
classic way to interpret RSI is to look for oversold levels below 30 and
overbought levels above 70. RSI also often forms chart patterns such as
double tops and bottoms and trendlines. Finally, if the underlying prices
166
make a new high or low unconfirmed by the RSI, such a divergence may
signal a price reversal.
R-squared
R-squared is a statistical measure used to determine how much of the price
action over the specified period can be explained by the regression line,
and how much should be attributed to random noise. R-squared ranges
from 0 to 1. The closer R-squared is to 1, the closer the prices have
approached the linear regression line. During strong trends, R-squared will
remain above 0.5 for an extended period of time.
SMA - Simple Moving Average
Simple moving average is calculated by adding up the prices for the
specified number of bars and then dividing the total into the period used.
The result is the simple moving average for the current bar.
Long term SMAs are typically used to indicate the trend direction. Prices
moving above and below SMA are often used as buy/sell signals. Another
common method of obtaining signals is to use two SMAs of different
periods and looking for crossovers.
Standard Deviation
Standard Deviation is the statistical measure of market volatility. Standard
deviation rises as prices become more volatile. As price action calms down,
standard deviation goes down.
Standard Error
The technique is designed for measuring of the standardized variation
around the regression line which is based on the price and length
parameters. This calculation gives an approximation of the precision of the
regression line.
Stochastic Relative Strength Index
For details, refer to "The New Technical Trader" by Tushar Chande.
Statistical Volatility
Statistical volatility is calculated using a standard deviation of the
underlying asset price changes from close to close during the past month
(normally, 21 days of historical data). This is the most common volatility
model currently used.
Stochastic %D
The Stochastic Oscillator measures at how much a price tends to close in
the upper or lower areas of its trading range. Stochastic %D is a smoothed
version of the Stochastic %K. Stochastic D% is used as a signal line for
Stochastic K%. A buy is triggered when Stochastic K% crosses above
Stochastic D% from a level, typically, below 30. A sell is triggered when
Stochastic K% crosses below Stochastic D%, typically from above 70.
Stochastic %K
The Stochastic Oscillator measures at how much a price tends to close in
the upper or lower areas of its trading range. The indicator can range from
0 to 100. Those values that are close to 0 indicate that most of the recent
167
price action has closed near the day’s low, and readings close to 100
indicate that the prices are closing near the upper range.
The classic way to interpret the Stochastic is to wait for Stochastic %K to
reach an extreme level. Usually, a level above 70 indicates an overbought
condition, while a level below 30 indicates an oversold level. While these
penetrations of extreme levels indicate a warning, the actual buy/sell
signals occur when %K crosses %D.
Stochastic Slow %D
The Stochastic Oscillator measures at how much a price tends to close in
the upper or lower areas of its trading range. The indicator can range from
0 to 100. Those values that are close to 0 indicate that most of the recent
price action has closed near the day’s lows, and readings near 100 indicate
that prices are closing near the upper range.
The Stochastic Slow %D is a doubly smoothed version of the Stochastic
%D.
Stochastic Slow %K
The Stochastic Oscillator measures at how much a price tends to close in
the upper or lower areas of its trading range. The indicator can range from
0 to 100. Those values that are close to 0 indicate that most of the recent
price action has closed near the day’s low, and readings close to 100
indicate that the prices are closing near the upper range.
The Stochastic Slow %K is a doubly smoothed version of the Stochastic
%K.
Swiss Army Knife Indicator
In his "Swiss Army Knife Indicator" article, John F. Ehlers illustrates the
digital filtering concepts.
Please refer to the January 2006 issue of Technical Analysis of STOCKS &
COMMODITIES magazine.
Time-series forecast
The Time Series Forecast is used to "predict" the future value of a market
by determining the upward or downward bias of a trend and extending
that calculation into the future. When the market price is above the
indicator, the trend is considered as an upward one. When the market
price is below the indicator, the trend is considered as a downward one.
Additionally, many analysts believe that when prices rise above or fall
below the indicator line, they are likely to pull back to the line. The TSF
indicator also monitors the current trend to determine if there has
occurred any change in its direction.
TMA - Triangular Moving Average
The Triangular Moving Average is simply a doubly smoothed simple
moving average, where the middle portion of the data has more weight.
TRIX - Triple Exponential Average
The Triple Exponential Average (TRIX) is an oscillator used to identify
oversold and overbought markets. It can also be used as a momentum
168
indicator. When the Triple Exponential Average is used as an oscillator, a
positive value indicates an overbought market, while a negative one
indicates an oversold market. As a momentum indicator, a positive value
suggests that the momentum is increasing while a negative one suggests
that the momentum is decreasing.Additionally, divergences between price
and TRIX may indicate significant turning points in the market.
Two main advantages of TRIX compared to other trend-following
indicators are its excellent ability to filter out market noise, as well as its
tendency to be a leading rather than a lagging indicator.
TrueHigh
TrueHigh is a numeric value, containing the High of the current bar or the
Close of the previous bar, if the latter value is higher.
TrueLow
TrueLow returns a numeric value containing the Low of the current bar or
the Close of the previous bar, if the latter value is lower.
TrueRange
TrueRange returns a numeric value containing the difference between the
TrueHigh and TrueLow for the current bar.
Typical price
The Typical Price for each bar is calculated as an average of the three
following values: high, low and close. Using the Typical Price instead of
the close in calculating, say, a moving average weights the high and low
into the calculation. Typical Price is known to some traders as the pivot
point.
Ulcer Index
The Ulcer Index is a measure of the stress level related to an investment’s
market behavior. It uses price retracements to measure the "stressfulness."
This is done by comparing recent price action with past price action.
Ultimate Oscillator
Williams Ultimate Oscillator uses weighted sums of three oscillators, each
using a different time period. These periods represent short-, medium-,
and long-term market trends. The Ultimate Oscillator moves within the
range from 0 to 100.
It is recommended that one look for divergences between the indicator’s
value and the price.
Velocity (slope)
Velocity is the slope of the line fitted between the current bar value and
the value a specified number of bars ago.
Volatility Indicator
The Volatility indicator calculates and plots a smoothed average of the
True Range. True Range measures the conventional range of a bar, but
checks the previous bar’s closing price to see if it is outside the current
bar’s range. If it is, this closing price is used instead of the high or
169
low.Thus, the previous bar’s close is considered part of the current bar’s
range. This helps account for gaps between bars.
This indicator can be used as a tool for measuring the volatility of a market
using the price range concept. Often, extremes in Volatility are associated
with a change in the market behavior, from trending to the trading range,
and vice versa.
Volatility Standard Deviation
The Volatility Standard Deviation indicator calculates the volatility using
prices from a specified number of bars. The value returned is one annual
standard deviation in price in the form of market price percentage. This
indicator is designed to be used with daily bars only.
Volume Average
The Volume Average indicator calculates a 50-bar average of the volume
overlaid on the current volume.
Volume Oscillator
The Volume Oscillator indicator calculates the difference between fast and
slow volume moving averages. Volume can provide some useful
information on the strength or weakness of a price trend. A positive value
suggests that there is enough market support to continue the price activity
in the direction of the current trend. A negative value suggests that there is
a lack of support and prices may start becoming stagnant or reverse.
Volume Rate of Change
The Volume ROC indicator compares the most current bar’s volume to
that of a bar in the past. The difference is calculated as a percentage and
fluctuates around the zero line. Volume can provide an insight into the
strength or weakness of a price trend. A positive value suggests that there
is enough market support to continue the price activity in the direction of
the current trend. A negative value suggests that there is a lack of support
and prices may start becoming stagnant or reverse.
Weighted Close Indicator
The Weighted Close is calculated as an average of the high, low and close,
with the close getting twice the weight of the high and low. Using the
Weighted Close instead of the close in calculating, say, a moving average,
weighs the high and low into the calculation.
Weighted Moving Average
Weighted Moving Average is calculated by multiplying the first data point
by 1, the second by 2, the third by 3, and so on. The final result is then
divided into the total of the weights. More recent data is thus more heavily
weighted, and contributes more to the final WMA value.
The rule for interpreting WMA is slightly different from that for SMA,
because it is a more sensitive indicator. When WMA changes its direction,
it signals a change in the trend.
170
Williams’ Accumulation/Distribution
Unlike the classic Accumulation Distribution, the Williams’ Acc-Dis
indicator does not include the volume in its calculation. Typically, the
Williams Acc-Dis indicator is used to identify divergences between the
price activity and the indicator itself. Just like with any other kinds of
divergences, if the market reaches new highs while the indicator is stagnant
or falling, the current trend may be weakening, thus suggesting a possible
reversal. Conversely, if the market reaches new lows while the indicator is
stagnant or rising, the trend may be weakening, thus signaling a possible
reversal.
WTop Inter Indicator
The WTop Inter Indicator shows that a current bar belongs to a double
top/button figure. The indicator is calculated using the same algorithms as
those used for calculating the Reversal Patterns study. For those bars that
form a double top, the indicator is 1. For those bars that form a double
bottom, the indicator is -1.
WTop Major Indicator
The WTop Major Indicator shows that a current bar belongs to a double
top/button figure The indicator is calculated using the same algorithms as
those used for calculating the Reversal Patterns study. For those bars that
form a double top, the indicator is 1. For those bars that form a double
bottom, the indicator is -1.
WTop Minor Indicator
The WTop Minor Indicator shows that a current bar belongs to a double
top/button figure. The indicator is calculated using the same algorithms as
those used for calculating the Reversal Patterns study. For those bars that
form a double top, the indicator is 1. For those bars that form a double
bottom, the indicator is -1.
171
Chapter 9
Analytical Studies
The following analytical studies are available with a single-click:
Auto-trends
The Auto-trends tool is used to automatically draw trends lines over the
chart. The tool provides automatic trend lines identification for minor,
intermediate and major trends.
Pivots
This study identifies and marks a turning point in the trend on a chart.
Tradecision identifies Minor, Intermediate or Major turning points. Pivots
are useful as the start or end points when drawing objects (such as
Fibonacci retracements) or other analytical studies are used..
Single Day Patterns
This kind of patterns is used for the identification of single-bar patterns,
such as runaway and thrust days.
Reversal Patterns
Automatic identification of reversal patterns, such as V-top, double-top,
head and shoulders.
Elliott Wave analysis
An exceptional tool for those traders who have used counting Elliott
waves to make trading decisions. The tool includes automatic identification
of a-b-c corrections.
Fibonacci Clusters
The tool is used for calculating price levels using pivots and Fibonacci
retracements. It allows you to determine the probability of a trend reversal
for the each price level.
Noise Removal
The Noise Removal tool allows you to create and analyze the smoothed
curve of a price chart.
172
Auto-Trends
Understanding the Auto-trends study
The Auto-trends study is used to automatically draw trend lines over a
chart. Usually, the break of an auto-trend (similar to trendlines) shows an
entry or exit signal.
Auto-trend types
There are the following three types of auto-trends in Tradecision:
Minor duration trend, lasting less than a week. Over the long haul, this
trend has very little potential.
Intermediate duration trend, occurring within a period of time that
exceeds one week but is within 1-2 months.
Major duration trend, lasting longer than one or two months. Long-term
trends indicate stability. This is the trend to trade with in most cases.
The study also identifies sideway trends, or, in other words, those periods
when the trend direction is not clear. Sideway trends are marked with
horizontal lines.
173
Running the Auto-trends Study
To run the Auto-trend analytical study:
1. From the Insert menu, point to Analytical study, and then click AutoTrends.
2. In the General tab of the Analytical study – Auto-Trends dialog box, select the
type of the analytical study that you want to run by selecting the
corresponding check box.
The following options are available:
• Minor,
• Intermediate
• Major.
3. In the Parameters area, change the algorithm parameters, if required.
4. Click OK.
174
To change the color of the auto-trends:
1. From in the Color & Style tab or Sideway Color & Style tab of the Analytical
study – Auto-Trends dialog box, select the color for support, resistance and
inner lines.
Note: You can choose different colors for Minor, Intermediate and Major lines, as well
as a separate color for sideway trends.
2. Click OK.
175
Tuning the Auto-trends Algorithm
Advanced users can use the following parameters to fine-tune the autotrends algorithm:
Bars Back
Using this parameter, you can select an area where you want to run the
analytical study.
Generally, one bar means one trading day. Nevertheless, you can also use
weekly or monthly bars.
Bars to confirm a pivot (left/right)
This parameter defines the number of bars to the left/right from the pivot
point that should be lower or higher than the pivot bar. Decrease this
parameter to increase the algorithm sensitivity and identify smaller trends.
Sideway Sensitivity
This parameter defines the level of sensitivity of trend categorization. The
higher the parameter, the fewer price fluctuations will be identified as
upward/downward and not sideway trends.
176
Pivots
Understanding the Pivots Study
This study identifies and marks a turning point in the trend on a chart.
Tradecision identifies Minor, Intermediate or Major turning points. Pivots
are useful as the start or end points when drawing objects (such as
Fibonacci retracements) or other analytical studies are used.
177
Running the Pivots Study
To run the pivots analytical study on a chart:
1. From the Insert menu, point to Analytical study, and then click Pivots.
2. From the General tab of the Analytical study - Pivots dialog box, select the
check box next to the type of the study that you want to run. The
following options are available:
• Minor,
• Intermediate
• Major
3. In the Bars back box enter the number of bars that you want to analyze
with the study.
4. From the Sensitivity area, you can modify the sensitivity ratio for the
Minor, Intermediate and Major pivots.
Note: With the sensitivity ratio, you can fine-tune the proprietary algorithm used to
identify pivots. The smaller the sensitivity parameter you define the less demanding
algorithm will be and even tiny trend reversals will be identified as pivots.
Correspondingly, a bigger sensitivity ratio will filter out "insignificant" pivots.
5. If you do not want to have several pivots in the same direction, select the
Consecutive one-way pivots not allowed check box.
6. Select the Color & Style tab and customize the pivot labels.
Note: You can change the text used to mark pivots as well as color and font for this text.
7. Click OK.
178
Single-Bar Patterns
Understanding the Single-Bar Patterns Study
Single-Par Patterns indicate those changes in a price that occur in a single
trading day or bar if your use a minute time frame. The study identifies the
following patterns: Gaps, Thrust days, Run days, Wide-Ranging days.
Gap
A gap forms when opening price movements create a blank spot on the
chart. This happens when the high of the day is below the low of the
previous day, or when the low of the day is above the high of the previous
day.
Gaps are especially significant when accompanied by an increase in
volume.
Thrust Days
An Upper Thrust day is a day when the market is closed higher than the
maximum of the previous day.
A Lower Thrust day is a day when the close price is formed lower than
the minimum of the previous day.
Run days
Run days are the days with a pronounced trend.
Wide-Ranging days
Wide-ranging days have a true range that is far larger than the days on
either side and are especially meaningful after a strong trend.
After a sharp down-trend, followed by a wide-ranging day with a strong
close is a signal that the trend will reverse.
179
After a strong advance, a wide-ranging day with a weak close signals a
downside reversal.
Extreme wide-ranging days often precede a major trend reversal.
180
Running the Single-Bar Patterns Study
To run the Single-Bar patterns analytical study:
1. From the Insert menu, point to Analytical study, and then click Singlebar patterns.
2. From the General tab of the Analytical study – Single-bar patterns dialog box,
select Gaps, Run Days, Thrust Days or Wide-ranging days check
boxes.
3. In the Bars back box, enter the number of bars that you want to analyze
with the study.
4. Select the Color & Style tab, and select the color for each pattern.
5. Click OK.
Patterns will be marked with colored triangles.
You can use the following parameters to customize the pattern
identification algorithm:
• Run day length. The number of days to the right and to the left used to
confirm the run day pattern.
• Thrust day ratio. Used to filter week thrust days. The ratio is a percentage
amount that specifies for how much the thrust day close should be higher
or lower than the High or low of the previous day.
• Wide-ranging day ratio. Defines the volatility threshold used to identify
wide-ranging days. The volatility threshold is equal to the average true
range of the day divided to the average true range of the previous X
(Wide-ranging day length) bars. If the volatility threshold is equal to or
greater than the wide range ratio, the day will be identified as a wideranging day.
• Wide-ranging day length. The number of the previous bars relatively to
current bar.
181
Reversal Patterns
Understanding the Reversal Patterns Study
Reversal patterns, or tops and bottoms, indicate a radical change in a longterm trend.
Tops are usually less stable and shorter than bottoms. Bottoms usually
have smaller price variations and are slower to set up.
A breakout through a trend line is used together with a reversal pattern for
monitoring price level- and timing-related signals.
The longer the time required for the formation of a pattern and the greater
the price fluctuations within it are, the more substantial the forthcoming
price movement is likely to be. The time frame is, normally, from several
days to several months. Intraday patterns are much less reliable.
Reversal patterns offer some of the most important opportunities for
entering a market with a good profit potential. They usually represent
fundamental changes in the underlying character of a particular market,
and often go on to yield big moves.
However, a market top or bottom is often difficult to identify. It is even
more difficult to choose the appropriate entry and exit points. One of the
related problems is distinguishing between the actual change in a trend and
a mere congestive phase in the middle of a move. In most cases, it is
advisable to wait for prices to actually confirm a trend reversal by
developing one of these well-tested and reliable reversal patterns. The
actual buy or sell signals are based on a breakout in the direction of the
new trend.
The most popular Reversal Patterns include: head and shoulders, double
tops and bottoms, and V-Top.
182
Head and Shoulders
The head and shoulders pattern is formed by three peaks. The center peak,
or head, is somewhat higher than its two lower, and not necessarily
symmetrical, shoulders. The line connecting the bottoms of the two
shoulders is called the neckline. Due to unsteadiness, the neckline is
seldom symmetric or precisely horizontal.
The pattern is not complete until the neckline is broken. It is advisable to
wait for confirmation.
Volume should be assessed to confirm the validity of reversal patterns.
Volume is, normally, the heaviest during the formation of the left
shoulder. It also tends to be quite heavy when a price is approaching the
peak. The real confirmation of a developing Head and Shoulders pattern
comes with the formation of the right shoulder, which is invariably
accompanied by a distinctly lower volume.
Double Top
This pattern consists of two tops of almost equal height. A line is drawn
below and parallel to the resistance line which connects the two tops. The
neckline is a strong support for price level but eventually fails.
As with a Head and Shoulders, after the two rallies and their respective
reversals are completed, the double tops is confirmed only when the
neckline is broken. The support line then becomes a resistance line, which
often holds a market rebound.
A Double Bottom pattern is a mirror image of a double top pattern: the
average height of the bottoms gives a good indication of the price
objective.
V- Top
The V-Top pattern is an unusual pattern in that a sharp trend switches
from one direction to the other without warning and a high volume at or
just after the turnaround.
183
Running the Reversal Patterns Study
To run the Reversal Patterns analytical study:
1. From the Insert menu, point to Analytical Study, and then select
Reversal Patterns.
2. From the General tab of the Analytical Study - Reversal Patterns dialog box, you
can select the Reversal Patterns you need by selecting the corresponding
check box. The following options are available:
• Head'n'Shoulders
• Double Top / Bottom
• V-Top / Bottom
3. Select the corresponding check boxes next to the patterns. The following
options are available:
• Minor
• Inter
• Major
4. In the Bars back box enter the number of bars that you want to analyze
with the study.
5. From the Peaks height difference list, select the desired distance
between the peak heights.
6. Click the Color & Style tab and select the necessary color for each
pattern. You can also change the line style in the corresponding dropdown list boxes.
7. Click OK.
184
Elliott Waves
Understanding the Elliott Waves Theory
Many traders use Elliott’s ideas to analyze changes in trends. Tradecision
offers a special study that identifies Elliott waves and corrections. Even
though some professional traders do not agree with some of Elliott’s
findings, he should definitely be admired for his ideas, many of which are
useful in analyzing the market moves. The Elliott wave study is designed
specifically for devoted Elliott Waves analysts.
The study uses a simplified version of the Elliott Wave theory which holds
that a price usually makes a 5-wave pattern in one direction, followed (in
most cases) by a corrective pattern, and then a new 5-wave pattern in the
opposite direction.
185
A Brief Overview of the Elliott Waves Theory
In 1939, Ralph Nelson Elliott published a pattern-recognition technique,
which holds that the stock market follows a rhythm or pattern of five
upward waves and three downward waves to form a complete cycle of
eight waves. The three downward waves are referred to as a "correction"
of the preceding five upward waves.
Wave is a movement in the market, either upwards or downwards. The
size of the wave depends on the period of time that is being analyzed.
Impulse Wave is a wave that moves in the direction of the main market
trend. It subdivides into 5 smaller waves (1-2-3-4-5). Waves 1, 3, and 5
move in the direction of the main market trend. Waves 2 and 4 move
against the main market trend.
Corrective Wave is a wave that moves in the direction opposite to the
direction of the main market trend. It subdivides into 3 smaller waves (a-bc). Waves a and c move against the main market trend. Wave b moves in
the direction of the main market trend.
186
Types of Impulse Waves
The basic 5-Wave Structure (1-2-3-4-5) is the following: if the main trend
is upward, wave 3 is higher than wave 1..., wave 5 is higher than wave 3...,
and wave 4 does not correct below the top of wave 1. If the main trend of
the market is downward, wave 3 is lower than wave 1..., wave 5 is lower
than wave 3..., and wave 4 does not correct above the bottom of wave 1.
Extended Wave - a complex impulse wave where one of the subwaves
(either 1, 3, or 5) further subdivides into 5 waves.
Failure - when the 5th subwave of an impulse wave fails to move beyond
the end of the 3rd subwave...indicating a strong and/or prolonged move in
the counter direction.
Diagonal Triangle - a terminal wave (often called a wedge), either a 5th
wave or c wave, where the 5 subwaves subdivide into three (a-b-c). Upon
completion, there is usually a strong move in the opposite direction.
Other Elliott Concepts
Wave Degree - every 5-wave and 3-wave cycle can subdivide into waves
of a smaller size and/or be found to comprise part of a wave of a larger
size. Waves can be labeled in degrees, which last only a matter of minutes
or as long as centuries.
Parallel Trendlines - waves tend to channel between parallel trendlines.
Depending on the time period analyzed, the market may channel between
parallel trendlines on an arithmetic scale chart or on a semi-log scale chart.
Extent of Corrective Wave - commonly, a corrective wave will take the
market to the area of the 4-th wave whose degree is one point lower,
especially when the corrective wave itself is the 4-th wave. In other cases,
the market will often find support at the top of wave 1 of one lesser
degree.
Rule of Equality - two of the subwaves of an impulse wave (1, 3, or 5)
are often related equally in terms of price advance and time.
Rule of Alternation - waves, and corrective waves in particular, tend to
vary in complexity and/or type from one to the next.
187
Running the Elliott Waves Study
To run the Elliott waves analytical study:
1. From the Insert menu, point to Analytical study, and then select Elliott
Waves.
The Analytical study - Elliott Waves dialog box will be displayed.
2. In the Types area of the General tab of the Analytical study - Elliott waves
dialog box, select the options you need by selecting the corresponding
check box.
The following options are available:
•
•
•
•
Minor
Intermediate
Major
Global
3. In the Parameters area, enter the Wave 2 depth and Wave 4 depth
values.
4. In the Bars back box, enter the number of bars that you want to analyze
with the study.
5. Click the Colors & Style tab and select the necessary color and font to be
used for Minor, Intermediate, Major and Global waves.
6. Click OK.
Waves and corrections will be marked with the corresponding numbers
and a-b-c symbols.
Notes: In the Parameters area, you can change two parameters that allow
identifying occasional spikes or outliers that may deteriorate the correct wave numbering.
188
Wave 2 depth parameter specifies the percentage for which Wave 2 can overlap the
bottom of Wave 1 before the wave numbering is considered invalid.
Wave 4 depth parameter specifies the percentage for which Wave 4 can overlap the
top of Wave 1 before the wave numbering is considered invalid.
Custom Elliott Waves
You can use the Custom Elliott Wave toolbar to manually insert wave
numbers into a chart. Once added, a wave number can be repositioned
anywhere by clicking it and dragging it to its new position.
To mark a custom Elliott Wave in a chart:
1. Right-click the toolbar area and select Elliott Waves.
2. From the list in the Custom Elliott Waves toolbar, select
•
•
•
•
Minor
Intermediate
Major
Global
In the Custom Elliott Waves toolbar, click wave 1, 2, 3, 4, 5, A, B, C, D
or E and then click the place in the chart where you want the number to
appear. Repeat this process for all the wave labels that you want to insert
into the chart.
Note: The font and style of the custom Elliott Wave tool are the same as the Elliott
Wave analytical study. To change its properties, see the Color & Style Toolbar, and
Elliott Wave analytical study.
189
Fibonacci Clusters
Understanding the Fibonacci Clusters Study
Using Fibonacci Clusters you can determine the probability of a trend
reversal for each price level. Fibonacci Clusters indicate the price level on
which a potential change in the trend may occur. The stronger the cluster,
the greater the likelihood that the price level is a support or resistance level
for the current trend.
Fibonacci Clusters were not designed to be used alone. They should be
used as a confirming indicator or to determine where a change in a trend
may potentially happen.
Fibonacci Clusters are calculated using the following procedure: the price
range of a security is divided into a specified number of sub-ranges
(clusters). After that, Tradecision uses all pivots (minor, intermediate and
major) to form all possible Fibonacci Levels (Retracements and
Extensions). The more Fibonacci Levels are assigned to a cluster, the
stronger the cluster is.
190
Running the Fibonacci Clusters
To run the Fibonacci Clusters analytical study on a
chart:
1. From the Insert menu, point to Analytical study, and then select
Fibonacci Clusters.
The Analytical study - Fibonacci Clusters dialog box will be displayed.
2. In the Clusters box of the Parameters area, enter the number of clusters
you that want to form.
3. In the Bars back box, enter the number of bars that you want to analyze
with the study.
4. If you want the pivot points found at the end of the price data massive to
have greater weight than that of the pivot points found at the massive’s
beginning, select the Exponential Calculations box,.
5. From the Color list, select the color that you want to use to draw the
study.
6. In the Weights area, enter the importance ratio for each Fibonacci level.
Note: The bigger the ratio, the stronger will be the level’s influence on the cluster
strength.
191
7. Click OK.
The study will be drawn at the end of the price chart. Stronger clusters will
be marked with stronger color, weak clusters will be marked with white
color.
192
Noise Removal
Understanding the Noise Removal Technique
Noise removal is an important task in many technical analysis techniques.
With the help of the analytical study, you can avoid any untimely reactions
to frustrated trends and occasional short-term price changes within a
trend. The Remove Noise capability allows evaluating the market’s current
state and, consequently, making more effective trading decisions.
The Remove Noise functionality enables creating and analyzing a
smoothed curve of a price chart . There are 3 levels of smoothing that
enable you to manage different degrees of noise removal. You can try
different levels of noise reduction to find out which one suits you the best.
193
Using the Noise Removal Functionality
To remove noise from a price chart:
1. From the Insert menu, select Analytical Study, go to Noise Removal,
and select a level of smoothing (iteration) you need. You can select
Iteration 1, Iteration 2 or Iteration 3.
Note: After applying the Noise Removal study, you can see which level of noise
reduction is currently applied to the chart by looking at the Status Bar. The Status
Bar is an area that displays state information for the content placed at the bottom of a
window.
Note: If you use Noise Removal study, only smoothed price data will be used by
simulations, models, and so on, and not the original market data of the security.
194
Cancelling Noise Removal
To cancel the application of the Noise Removal study to
a price chart:
1. From the Insert menu, select Analytical Study, go to Revert Noise
Removal and then select an iteration that you want to cancel.
195
Chapter 10
Tandem Studies
Understanding Phase Rover
By using the Phase Rove tool, you can create Tandem Studies to
determine when different market developments taking place and trade
accordingly. Tandem Studies can be used for anticipating the market
developments and thus, locating new profitable opportunities. This is
achieved by performing visual analysis on charts. One can also use
Tandem Studies in trading strategies and custom indicators to create
advanced trading techniques. For the latter option, in Improvian Editor,
the Tandem Studies category with the corresponding Tandem Studies is
created.
A Tandem Study enables you to compare calculations for two adjacent
market phases.
A Tandem Study allows you to mark three points on a chart: the beginning
of the first phase, the end of the first phase, and the end of the second
stage which also displays the study’s final result (calculation). After the
second click, a mark figure is placed on a chart and displays the primary
phase limits.
To create a new Tandem Studies you need to define the study name and 3
formulas: the formula for the Primary phase, the formula for the
Secondary phase, and the formula for the final result. The result formula
uses the results of the previous two formulas.
196
Understanding Tandem Studies
Tandem study is an utterly novel way of looking at the market and
anticipating the market developments that can take place in the immediate
future. It’s a tool whose main purpose is analysis of the structure of the
market. The essence of Tandem study is an in-depth juxtaposition of two
adjacent market phases, – the Primary phase and the Secondary phase.
For each phase, the medium, extreme or accumulated value of the phase
parameter is calculated. The value can reflect the momentum, energy,
acceleration/deceleration, buying/selling pressure, volume or volatility.
The formulas for the Primary and Secondary phases can be different. The
values, derived for each of the phases, are compared or otherwise used in
the calculation of the result for a specific Tandem study.
A typical problem Tandem study is designed to solve is answering the
question how strong a new market phase will be after the completion of
the current phase and what the duration of the new phase will be. For
example, one can use Tandem study to determine whether a bullish trend
will continue after a strung-out, convoluted correction and whether the
continuation will be strong enough to profit from it. Similarly, when a
sideway move is over, it’s possible to determine whether its breakthrough
will be significant enough to profit from it by applying Tandem study to
the two previous phases. The phases can include the sideway move and
preceding bullish or bearish trend.
197
Importance of Phase Analysis
Tandem study is based on the premise that for medium-term analysis of a
stock or commodity in the present-day, fast-changing and interdependent
markets, the most important are the two most recent market phases and
later history plays a very unimportant part. Given this, the attempts to
trace the more complicated structure of the market (price movement
pattern) by using such approaches as, for example, the Elliott Waves, are
becoming less and less efficient. Due to the psychological aspects and time
limits for the arrival and processing of new information, the previous
phase of the market is the most important for the current moment. The
phase that immediately precedes the previous one also has a considerable
influence.
Certainly, the overall state of the market and industry on the whole is
extremely important, just like inter-market analysis. However, for the
analysis of a specific security the most important is the analysis of the
phase the security is in. This kind of analysis we call Phase Prospecting
consists of the following components or stages:
•
•
•
Determining the likelihood of different lengths, stability and force for
the current phase;
Determining the likelihood that a phase will change for several
scenarios;
Determining the likelihood of making a profit and evaluating the
related risk for the more feasible scenarios.
It is only after this phase-prospecting analysis that the entry point can be
determined and the conditions for profitable and unprofitable exit and
position size can be defined (including the money management strategy to
be applied).
All the existing indicators, chart patterns and studies are intended to serve
the traditional, standardized approach to trading. They are often
understood and interpreted the same way in different market phases. We
deem this approach to be wrong. For example, candlestick patterns should
be interpreted differently in the different market phases. At first, one
should determine the phase the market is currently in, and only then make
the relevant indicator-based calculations, for example, those of the
negative and positive volumes.
The same goes for the use of the trend indicators: the applied indicators
should be interpreted differently for sideway moves, sharp uptrends and
trends that move with the minimum momentum. This kind of approach
will not only help increase the precision of the analysis, but it will also help
divide the applied trading approaches according to certain areas of the
market. The latter will enable the trader to identify phases with a higher or
lower precision of the market analysis. In addition, it will be possible to
identify those market phases, for which certain indicators work better.
Tandem study as a formalized part of Phase Prospecting is a new addition
to Technical Analysis that, when properly combined with the classical TA
methods, can significantly increase its precision.
198
Phases Combinations
The table above illustrates the kind of phase division that is applied when
the trader’s task is determining the likelihood of the main trend’s
continuation after the correction is complete. The table shows, which
combination of values from the different phases provides a higher degree
of precision of the market analysis.
The table provides a total of 24 options, 6 of which have great prognostic
ability, 6 – medium, 8 – small, and 4 options are not considered. A more
detailed version of the table is beyond the framework of this document,
but it’s worth a mention that such tables are at first built using the expert
method, and then tested on historical data (its best to create a separate
table for different markets). The discrepancies between the expert opinion
and the historical data value are thoroughly checked into to find out the
reasons. A solely expert or solely statistical approach can be erroneous.
Note: After a sideway move, it’s hard to tell the sideway breakthrough
from the expanding sideway move. When the breakthrough and new trend
are pronounced well enough, the formation can no longer be referred to as
a correction. Therefore, the formation is a new trend and the sideway
move completes all the previous moves, thus showing that the forces of
supply and demand are roughly equal and any further movement is
extremely difficult to forecast.
Our experience shows that it’s not worth using a sideway move as the
Primary phase if you have no special reason or special trading system to do
that.
199
Creating a Tandem Study
To create a Tandem Study:
1. From the Tools menu, select Phase Rover.
The Phase Rover dialog box will be displayed.
2. On the Phase Rover toolbar, click New.
A new Tandem Study will be displayed on the Tandem Study list and will
be automatically saved by Phase Rover.
3. In the Tandem Study name box, enter the name of the Tandem Study.
4. In the Description box, enter a description of the Tandem Study.
5. In the Primary Phase area, click Edit to write a formula for the
Primary Phase calculation.
The Improvian Editor window will be displayed.
6. In the Expression box, define a formula, containing the Primary Phase
rules, and click OK.
Note: You can use the same formula for the Secondary Phase calculation by selecting the
Use the
same calculation for the Secondary Phase check box.
7. In the Secondary Phase area, click Edit to write a formula for the
Secondary Phase calculation.
The Improvian Editor window will be displayed.
8. In the Expression box, define a formula, containing the Secondary
Phase rules, and click OK.
9. In the Tandem Study result area, click Edit to write a formula for the
Tandem Study result calculation.
The Improvian Editor window will be displayed.
10. In the Expression box, define a formula, containing the Tandem
Study result rules and click OK.
11. In the Display area, select the options you need. For details, refer to the
Configuring Tandem Study Options.
200
Configuring Tandem Study Options
In the Display area of Phase Rover, you can select options for each
Tandem Study to be displayed when you insert a Tandem Study into a
chart.
Select the following options if you want them to be included in the
Tandem Study when you insert it into a chart.
• Primary Phase value is inserted at the end of the first line;
• Secondary Phase value is inserted at the end of the second line;
• Tandem Study name is included at the end of the second line.
In the Phase value location area, select the corresponding options
depending on where you want the phase calculations to appear on the
Tandem Study.
• ▪ In the middle of Phase;
• ▪ At the end of Phase.
You can select the way the Tandem Study will appear on a chart. For this
purpose, Phase Rover offers the following options: rectangle, triangle,
perpendicular, trend line, horizontal line, and two dots. In the Display
area of Phase Rover, this selection can be made using the Mark Tandem
Study as option.
The Tandem Study’s Color, Style and Font can be changed by using the
corresponding options in the Display area.
In the Tandem Study result suffix text box, enter %, $ or other marks to
be included after the Tandem Study result numbers.
From the Precision text box, select the required decimal value.
201
Inserting a Tandem Study into a Chart
1. Open the chart in Tradecision into which you want to insert a Tandem
Study.
2. From the Tools menu, select Phase Rover.
3. In Phase Rover, select the Tandem Study you need and click Insert.
Phase Rover will be closed.
4. On the opened chart, click and hold the point where the Tandem
Study should start.
5. Drag the line to the important high or low to complete the Primary
Phase line. While you are dragging the mouse, you can see the number is
calculated on the fly (using the Primary Phase formula for each
new/previous bar).
6. Click and hold the point where the Primary Phase should end.
Note: You will see a number representing the Primary Phase final calculation.
7. Drag the second line to the important high or low to complete the
Secondary Phase. While you are dragging the mouse, you can see the
number is calculated on the fly (using the Primary Phase formula for each
new/previous bar).
8. Click and hold the point where the Secondary Phase should end. You
will see a number, representing the Secondary Phase final calculation. The
Tandem Study result calculation, containing the Tandem Study’s name and
figure labels (if these options are selected; refer to Configuring Tandem
Study Options for more information) is placed on the chart.
202
Accessing Tandem Studies from Toolbar
You can speed up the process of inserting a Tandem Study into a chart by
using the Phase Rover icon on Tradecision’s main toolbar. The icon
contains an option, allowing you to select the latest Tandem Studies you
inserted into the chart earlier.
Copying a Tandem Study
You can make a copy of the selected Tandem Study in the Phase Rover
dialog box using the Copy button. This capability is used when you want
to create a new Tandem Study that is supposed to be the same as another
one.
To copy a Tandem Study:
1. From the Tools menu, select Phase Rover.
The Phase Rover dialog box will be displayed.
2. In the Tandem Study list, select the Tandem Study that you want to
copy and then click Copy.
The new Tandem Study will be added to the Tandem Study list.
3. In the Phase Rover dialog box, you can enter new properties for the
Tandem Study.
Deleting a Tandem Study
To delete a Tandem Study
1. From the Tools menu, select Phase Rover.
The Phase Rover dialog box will be displayed.
2. In the Tandem Study list of the Phase Rover dialog box, select the
Tandem Study that you want to delete.
3. Click Delete.
The Tandem Study will be deleted from Phase Rover.
203
Import/Export
Tradecision’s easy-to-use Import/Export tool you can exchange any of
your trading ideas with your friends. To do this, you have to save Tandem
Studies on your local hard drive and after that you will able to share the
Tandem Studies with your friends and partners.
Importing Tandem Studies
To import Tandem Studies:
1. In the Phase Rover dialog box, click Import/Export, and then select
Import.
The Import - Tandem Study(ies) dialog box will be displayed.
2. In the Import - Tandem Study(ies) dialog box, click the button to browse
for the folder on your local hard drive from which you want to import the
Tandem Studies.
3. Choose the Tandem Studies that you want to import by selecting the
corresponding check boxes.
4. Click Import.
All the imported Tandem Studies will be added to your Tandem Studies
list.
5. In the Import - Tandem Study(ies) dialog box, click Close.
Exporting Tandem Studies
To export Tandem Studies:
1. In the Phase Rover r dialog box, click Import/Export, and then select
Export.
The Export - Tandem Study(ies) dialog box will be displayed.
2. In the Export - Tandem Study(ies) dialog box, click the button to browse
for the folder on your local hard drive to which you want to export the
Tandem Studies.
3. Choose the Tandem Studies that you want to export by selecting the
corresponding check boxes.
4. Click Export.
The Tandem Studies will be saved in the folder, specified by you, with the
extension .tdst. Now you can send the studies by email to your friends or
partners. The recipient will need to use the Import command to work
with the Tandem Studies.
204
5. In the Export - Tandem Study(ies) dialog box, click Close.
205
Tandem Studies Descriptions
Area Ratio Bull
Area Ratio Bull can only be used during corrections, preceded by regular
trends. Area Ratio Bull shows the ratio between the territory, covered by a
stock’s trend in the first phase, and that covered by it in the second phase.
The size of the territory is determined by totaling up the difference
between the price value on each bar and at the bottom of the phase. The
bottom of the phase is the low of the first bar. Due to the Area Ratio Bull
value, it’s possible to forecast whether the trend will continue or a reversal
should be expected.
Area Ratio Bear
Area Ratio Bear can be used only during correction phases, preceded by a
bearish trend. Area Ratio Bear shows the ratio between the territory,
covered by a stock’s trend in the first phase, and that covered by it in the
second phase. The size of the territory is determined by totaling up the
difference between the price value at the upper level of the phase and the
price value on each bar. The upper level of the phase is the high of the
first bar. Due to the Area Ratio Bear value, it’s possible to forecast
whether the trend will continue or a reversal should be expected.
AvgTrueRng Ratio
The AvgTrueRng Ratio shows the ratio of the Average True Range in the
first phase to the Average True Range in the second phase. This ratio
shows the difference in the intensity of a stock’s movement in the first and
second phases. The AvgTrueRng Ratio can be used as a tool for the
calculation of the Average True Range for any selected market segment.
AvgTrueRng Differenc
The AvgTrueRng Difference shows the difference between the Average
True Range in the first and second phases. This value shows the difference
in the intensity of a stock’s movement in the first and second phases. The
AvgTrueRng Difference can be used as tool for the calculation of the
Average True Range for any selected market segment.
Bars Difference
The Bars Difference shows the difference between the number of bars in
the first phase and that in the second phase. This ratio allows you to
evaluate for how much the duration of the first phase exceeded the
duration of the second phase. The Bars Ratio can be used as a tool for the
calculation of the number of bars for any selected market segment.
Bars Ratio
Bars Ratio shows the ratio in the number of bars during the first phase and
that in the second phase. This ratio will allow you to evaluate for how
many times the duration of the first phase exceeded the duration of the
second phase. The Bars Ratio can be used as tool for the calculation of the
number of bars for any selected market segment.
206
MaximumMomentumRatio
The MaximumMomentumRatio shows the ratio of the maximum value of
the Momentum indicator in the first phase toward the maximum value of
the Momentum indicator in the second phase. This ratio shows for how
much a stock was more active in the first phase compared with the second
one.
Money Flow Ratio
This kind of a Tandem Study calculates the value, accumulated
(distributed) by the market during the first phase and compares it with the
value, distributed (accumulated) by the market during the second phase,
determining the ratio between the two values. The smaller is the
MoneyFlowRatio value during the corrections, the lower is the probability
that the trend will continue after the correction. To calculate the
accumulation and distribution values, the methodology used to calculate
MFI is used.
OBV Ratio
The OBV Ratio shows the ratio of the On Balance Volume in the first
phase toward the On Balance Volume in the second phase. In particular,
when the phases of the corrections are selected (i.e. the first phase is the
trend and the second one is the correction), the OBV Ratio shows for how
many times the On Balance Volume value during the trend exceeded the
On Balance Volume during the correction. The greater is the value of the
OBV Ratio the greater is the probability of the trend continuing and the
fewer traders want to close their positions, opened during the trend.
Ranges Difference
The Ranges Difference is the difference between the amount of all the
Ranges of the first phase and the amount of all the Ranges of the second
phase. This ratio shows the difference between the intensity of a stock’s
movement in the first and second phases. The Ranges Difference can be
used as a tool for the calculation of the Ranges amount for any selected
segment of the market.
Range Difference
The Range Difference shows the difference between the range of price
changes during the first and second phases. The greater is the Range
Difference value, the more active the stock was during the first phase
compared with the second one. The Range Difference can be used as a
tool for the calculation of the range of the price changes for a stock for
any selected market segment.
Ranges Ratio
The Ranges Ratio is a ration between the amount of all the Ranges of the
first phase, divided into the length of the phase, and the amount of all the
Ranges of the second phase, divided into the length of the phase. This
correlation shows how different the movements of a security were during
the first and second phases. The Ranges Ratio can be used as a tool for the
calculation of the Ranges amount for any selected segment of the market.
207
Retracement
Retracement shows the ratio between the range of the price changes and
the price changes in the second phase. The greater is the Retracement
value, the more active a stock was during the first phase compared with
the second phase. Retracement can be used as tool for determining the size
of the corrections, as well as for determining the range of price changes of
a stock for any selected market segment.
Percent Volume Differenc
The Percent Volume Difference shows in percentage the growth or
reduction in the volume of the traded amount of a stock during the second
phase compared with the first phase. This ratio will allow you to monitor
the changes in the investors’ activity in the different phases.
STDev Difference
STDev Difference is the ratio of the first deviation of the first phase to the
standard deviation of the second phase. The greater is the STDev
Difference during the corrections, the more calmly the traders have
reacted to the end of the trend. This means that the trend was more
regular than speculative. Unlike with the volatility calculation using the
Volatility Ratio and Volatility Difference, in calculating the standard
deviation all the bars play an equal role. The STDev Difference affects the
investor behavior at the end of the second phase
STDev Ratio
STDev Ratio is the ratio of the standard deviation of the first phase toward
the standard deviation of the second phase. The greater is the STDev
Ratio during the corrections, the more calmly the traders have reacted to
the end of the trend. This means that the trend was more regular than
speculative. Unlike with the volatility calculation using the Volatility Ratio
and Volatility Difference, all the bars play an equal role. The STDev Ratio
value affects the investor behavior at the end of the second phase.
Velocity Difference
Velocity Difference shows how fast or slowly a stock moved during the
first and second phases and determines the difference between the phases.
The velocity during a phase constitutes the difference between the
maximum and minimum price during the whole of the phase, divided into
the duration of the phase, i.e. the number of the bars in it The Velocity
Difference value affects the investor behavior at the end of the second
phase.
Velocity Ratio
Velocity Ratio shows how fast or slowly a stock moved during the first and
second phases, and determines the correlation between the two phases.
The velocity of a phase constitutes the difference between the maximum
and minimum price during the whole of the phase, divided into the
duration of the phase, i.e. the number of the bars in it. The Velocity Ratio
value affects the investor behavior at the end of the second phase.
208
Volatility Difference
Volatility Difference is the difference in the volatility between the first and
second phases. The greater is the Volatility Difference during the
corrections, the more calmly the traders have reacted to the end of the
trend. This means that the trend was more regular than speculative. In
calculating the volatility, a bigger role is played by those bars that are
located toward the end of the phase. The Volatility Difference value
affects the investor behavior at the end of the second phase.
Volatility Ratio
Volatility Ratio is the ratio of the volatility of the first phase toward the
volatility of the second phase. The greater is the Volatility Ratio during the
corrections, the more calmly the traders have reacted to the end of the
trend. This means that the trend was more regular than speculative. In
calculating the volatility a bigger role is played by those bars that are
located toward the end of the phase. The Volatility Ratio value affects the
investor behavior at the end of the second phase.
Volume Differenc
The Volume Difference shows the difference between the stocks sold and
bought in the first phase compared with the second one. In particular,
when the phases of the corrections are selected (i.e. the first phase is the
trend and the second one is the correction), the Volume Difference shows
how many stocks are currently with the investors who opened positions
during the trend after the correction.
Volume Ratio
The Volume Ratio is a ratio between the stocks sold and bought during
the first and second phases. In particular, when the phases of the
corrections are selected (i.e. the first phase is the trend and the second one
is the correction), the Volume Ratio shows for how many times fewer
stocks were bought by traders willing to close their positions at the signs of
the slightest danger ( i.e. by traders oriented toward short-term profit)
compared with the total volume of stocks in the first phase.
WAccDist Ratio
The WAccDist Ratio shows the ratio between the value of the indicator
Williams Accumulation/Distribution during the first phase and the value
of this indicator during the second phase. By using the WAccDist Ratio
you will be able to forecast the market’s further movement during
corrections. The smaller is the WAccDist Ratio value, the more probable is
a trend reversal.
209
Chapter 11
Improvian Language
Introduction
Oftentimes, reacting too emotionally causes traders to make hasty
decisions. This results in their losing part of their funds or even the whole
of the balance in their accounts. That is why, many successful traders
believe that using system-based trading or rules is the competitive
advantage they need.
To get familiar with the capabilities of the language and its structure, refer
to the Tradecision Improvian Guide.
What is Improvian?
Improvian is a full-featured programming language. It gives you a variety
of opportunities to implement your own trading ideas. For example, you
can design a trading system or improve an existing study or indicator.
Tradecision makes it easy to limit losses by coding the trading rules using
the powerful features of Improvian. It is possible to create custom
functions, call DLL functions, and import trading techniques from
EasyLanguage and MetaStock. For creating advanced trading techniques,
the new language allows traders to use variables, inputs and skip words.
What can you create?
With Improvian, you can create analysis techniques that can help you
make a profitable trading decision. Inventing your own techniques isn't
easy. First of all, you need an idea. Then you need to write that idea down.
Improvian will allow you to write down any kind of idea you can only
come up with, and Tradecision will inform you about how well your
trading idea performs.
With Improvian you can create:
•
Trading system rules (using the Strategy Builder capability);
•
Inputs for Neural Models;
•
Indicators (using the Indicator Builder capability);
•
Custom Functions;
•
Alerts (using the Alert Builder capability);
•
Studies (using the Study Builder capability);
•
Custom scans (using NeatScan market scanner).
In addition, you can copy and modify any of the built-in trading strategies,
studies, indicators, and functions provided by Tradecision.
210
Using Improvian, you can create analysis techniques which you believe can
help you to make a profitable trading decision. It is not easy to invent your
own techniques. First, you need an idea. With Improvian you can write it
down. Tradecision software will show you how the ideas perform as new
bars appear.
You can analyze hundreds of thousands of data entries to locate patterns
and opportunities. For example, with NeatScan market scanner, you can
scan the whole database in Data Manager for buy/sell signals defined by
you. In Strategy Builder, you can back-test and optimize large amounts of
historical data to find the best possible parameters for your trading system.
In addition, Tradecision offers advanced simulation capabilities
(Simulation Manager) to help you easily identify the advantages and
disadvantages of a strategy.
Moreover, you can test your own money management rules defining them
with Improvian. As traders know, money management is the most
important part of successful trading. And Tradecision provides you with a
powerful Money Management Editor. For your convenience, the most
popular money management rules are predefined and easily accessible.
Tradecision can store an unlimited number of technical analysis
techniques.
For specific tutorials on each of the formula-based tools (Indicator
Builder, Strategy Builder etc), refer to specific chapters dealing with them.
211
Understanding the Language
Improvian can be accessed from Improvian Editor, a special word
processor that allows you to write down your trading ideas in the form of a
strategy, indicator, study, and so on, using specific syntax.
Improvian is comprised of a combination of reserved words, operators,
functions, parameters and punctuation.
Tradecision's Improvian Dictionary includes a collection of built-in
functions, covering many of the most popular trading techniques. These
include all types of Moving Averages, Volatility, Momentum, chart
patterns, to name but a few.
All language constructions are not case sensitive, for example, "IBM" is
equivalent to "ibm".
212
Basic Elements of the Language
Combinations, allowed in an expression
Operations
+,-,*,/
+
<, >, =,>=,<=,<>
=,<>
not, and, or
Operand
Numeric
String
Numeric
String
Boolean
Operations Value
Numeric
String
Boolean
Boolean
Boolean
Syntax Characteristic in Builders
Trading Technique
User Function
Strategies
Indicators
Studies
Models
InputExp
Characteristic
Inputs and optimized variables are prohibited
Inputs are prohibited
Optimized variables are prohibited
Optimized variables are prohibited
Inputs are prohibited
Single expression is allowed
213
Operator Semantics
Operator
(unary) +
+
Operand
Numeric
Numeric
String
Semantics
Changes an operand value to the opposite one.
Sums the values of two numbers.
Makes bonding of two rows; the first row succeeds the second one.
-
Numeric
Subtracts from a value of the first operand the value of the second operand.
*
Numeric
Multiplies a value of the first operand by the value of the second operand.
/
Numeric
Divides the value of the first operand into the value of the second operand.
<
Numeric
Returns True, if the first operand is less than the second operand.
>
Numeric
Returns True, if the first operand is greater than the second operand.
<=
Numeric
Returns True, if the first operand is less or equal to the second operand.
>=
Numeric
Returns True, if the first operand is greater or equal to the second operand.
=
Numeric
Returns True, if the first operand is equal to the second operand.
<>
Numeric
Returns True, if the first operand is not equal to the second operand.
=
String
Returns True, if a symbol string of the first operand is identical to a symbol
string of the second operand.
<>
String
Returns True, if a symbol string of the first operand is not identical to the
symbol string of the second operand.
(unary) not Boolean
Returns True, if the value of an operand is False. Otherwise, False.
and
Boolean
Returns True, if the values of the first and second operands are True.
Otherwise, returns False.
or
Boolean
Returns True, if the value of at laest one of the operands is True. Otherwise,
returns False.
214
Operator Precedence
All operations should be executed in accordance with the rules of the
operator precedence. Equal precedence operations must be made from left
to right. For example: 2+3+4 = (2+3) + 4. The parentheses () create the
maximum precedence of a sub-expression.
The following is the Operator Precedence table:
Operator
Not,/,*
+,<=,>=,>,<,=,<>
And
or
215
Function
Function – is a command to perform a specific mathematic calculation.
Each function has a name and returns a value based on some underlying
calculation. Improvian includes a large number of built-in functions.
Functions can be accessed from Improvian Editor.
For example: Average True Range function.
function (Length:numeric):Numeric;
return SMA(TrueRange(), Length);
For a complete list of all built-in functions, refer to Tradecision’s
Improvian Guide.
Many functions require parameters that provide the information needed to
calculate the function value. Even if a function does not require any
parameters, it must be followed by a pair of parentheses.
For example, AutoTrendMinor()
A function can be nested into another function. Functions can be
combined using mathematical operators.
216
Variables
Variables are placeholders that hold a value. Once you assign a value to a
variable, you can reference the value throughout the trading technique or
function by using the name of the variable. You can also recalculate the
value of the variable within the procedure.
Using variables instead of frequently-used expressions speeds up the
procedure and uses less memory. You can declare variables, assign values
to them, and reference their values.
The value stored by the variables can change any number of times
throughout the procedure, even from bar to bar. The main purpose of a
variable is to store the result of a calculation or comparison to enable
further referring to the result of this operation later without having to
repeat the formula or expression.
For example,
var
opt1:=#;
opt2:=#;
end_var
217
Arrays
Arrays are variables that store multiple values concurrently. Like variables,
arrays are place holders that can hold values, although instead of being able
to hold only one value, they can hold as many values as the number of
elements they have available.
Arrays are used for many reasons, the most common being to store
information about relevant market conditions during the analysis of price
data—to store information about what happened during previous bars.
Arrays can store either numeric, true/false, or text string expressions, but
they can only store one type of expression at a time. Also, the values in all
elements of the array are carried forward from bar to bar.
When working with arrays, you declare an array, assign values to the
elements of the array, and reference the values of the elements within an
array.
For example, sorting of PriceArray arrays in the ascending order:
Var
Array: PriceArray[10]:=0; {declaring array}
I:=0;j:=0;tmp:=0;{declaring indexes}
End_var
{sorting array}
for i:=1 to 9 do
for j:=I+1 to 10 do
if PriceArray[i]<PriceArray[j] then
begin
tmp := PriceArray[i];
PriceArray[i] := PriceArray[j];
PriceArray[j] := tmp;
end;
218
Inputs
Inputs are parameters or replaceable values used in the calculation of a
trading technique. Instead of using fixed values for an indicator or strategy,
you can modify these values as you apply a trading strategy to a chart.
The Input statement allows you to declare a named value that can be
changed when you apply the strategy or analysis technique to a chart. You
can use Inputs in the strategy you just created to allow the number of days
for the fast and slow moving average to be changed by the user instead of
using the fixed values of 9 and 18.
Similar to when you declare a variable, you declare the name of each input
along with its initial value (in parentheses). You can use the named values
in your calculations just as you would the number.
Example:
Inputs
priceData:"price data",close;
l:"Length",10;
End_inputs
219
Reserved Words
Reserved words (skip words) each have a specific meaning or purpose. For
example, to display values or create objects in a window, perform a trading
action, or evaluate and manipulate data.
if a>2 then a:=2;
if, then - are reserved words
The following keywords are reserved to identify price fields:
· Open
· High
· Low
· Close
· Volume
· OI
The following keywords are reserved to be used in Boolean expressions:
· True
· False
· AND
· OR
· NOT
In the Improvian’s Function Reference, you will see if a function is used
as a reserved word.
For example,
Name: Low
Full name: Low
Syntax: Low
Description: Returns Low value specified number of bars ago.
Returns: A numeric value
Example: Low
Reserved Word: Yes
-ORName: TIMESERIES
Description: Reserved word used as a function parameter for identification
of TIMESERIES smoothing method.
You can create your own reserved (skip) words. See Improvian tab
chapter.
220
Value
Value - the value can be:
•
•
•
•
Numeric;
Boolean (also called logical or true/false);
String (text);
Array.
Numeric expressions can be literal. In other words, they can be a
number or they can be a reserved word that represents a numeric value,
for example, Open.
A string (text) expression is any symbols (no more than 1000) within
quotation marks. The following is an example of a string expression:
"This is a string expression".
Boolean or True/false expressions can be either the value True or
False, or an expression that evaluates to True or False. True/False
expressions invariably involve a comparison. The following is
a true/false expression, it evaluates to a value of True or False:
Open > Close
Arrays are variables that store multiple values concurrently. Like variables,
arrays are place holders that can hold values, although instead of being able
to hold only one value, they can hold as many values as the number of
elements they have available.
The Improvian language supports operations with infinite values.
1). Numerical operations: the result of any numerical operation with an
indefinite value will be an indefinite value.
2). Logical operations: an indefinite value will be equal to 0, for example,
INF < 0, INF >0, whereby INF, – the function returning the indefinite
value, – will have the value FALSE, and INF=0 will be TRUE.
3). String arithmetic: an indefinite string is equivalent to an empty string.
221
Using Improvian Editor
Improvian Editor is a special word processor, allowing you to write your
own formulas in the Improvian language. Improvian Editor is
automatically displayed in a separate window when you are creating or
editing a function, strategy, indicator, study, alert, or when you are
scanning or inputting data into a neural model.
To write correctly in Improvian, you need to learn the principles of the
language’s syntax. The Editor contains syntax checker that ensures that
your formula contains only correct expressions, function names and
parameters. Therefore, if you make a mistake in an expression you will
receive a message telling you what kind of mistake you have made. You
can only save an expression containing correct syntax. This means that if a
trading technique has any incorrect language rules and/or spelling written
in Improvian, they will not validate and you will not be able to insert it into
a chart.
Improvian Editor:
• Provides all the functionality of a text editor;
• Has the ability to highlight lexical and syntax constructions & syntax
errors.
• Provides auto-expansion of a word from the dictionary after only a few
letters are entered;
• Includes a list of errors;
• Allows Undo & Redo, Cut & Paste.
222
Note: The following must needs to be used: 1) RETURN at the beginning of the oneformula expressions and at the end of complex scripts; 2) ; at the end of expressions.
223
To enter an expression:
1. Type the expression in the Expression box.
2. Click Check to verify the syntax and grammar.
If an error has occurred, a message explaining the error will be displayed in
the Messages box.
3. Correct the errors, if any.
4. If the trading technique is correct, click OK to save it.
224
Creating Trading Techniques using Built-in Functions
To create a trading technique:
1. In the Categories area, select the appropriate category.
2. In the Functions area, select the function you need, or just type the
required function under Functions.
You can read the description of the selected function in the Description box.
3. Select the highlighted function and click Insert (or double-click it).
The selected function will appear in the Expression text box.
4. If the trading technique is correct, click OK to save it.
225
Viewing the Details of a Function
To view the function details:
1. To see the details of a function, click the Details button
Using AutoComplete
To turn on AutoComplete:
1. In the Expression box, enter the first letter of the built-in function and
press Ctrl-Space or right-click to select AutoComplete from the list.
The capability provides auto-expansion of a word from the Dictionary
when only a few letters are entered.
Using Variables
To speed up the calculation of formulas, variables can be used. Rather
than repeating an expression or formula again and again, you can assign it
to a variable and then reference the variable.
Using Upper and Lower cases
It does not matter which case is used for entering formulas (for example,
"A" and "a" are treated the same way).
Using Comments
Comments are any text enclosed in braces, for example, {}.Using
comments makes expressions easier to read.
Using Spacing
Blank spaces within expressions are optional. However, the prudent use of
spaces can make expressions in the Editor easier to read.
Using Clipboard Commands
You can use the standard clipboard commands while editing expressions.
To copy the highlighted text, press CTRL+C; to cut, press CTRL+X. To
paste, press CTRL+V.
From the Edit menu you can access Undo & Redo, Cut & Paste, Clear,
Select All commands.
226
Customizing the View
You can select whether or not to use the Dictionary and Messages sections
in Improvian Editor.
To display/close the Dictionary and Messages sections:
1. To do this, on the toolbar, click View and select/clear Dictionary
and/or Messages.
227
Printing
You can easily print a trading technique from Improvian Editor.
To print a trading technique:
1. In Improvian Editor, you can click Printing.
2. Click the Setup Printer to display the Printing tab.
3. Set margins, Word Wrap, Line Number and select a printer, as
appropriate.
Note: The Print Preview tab allows you to preview the print area.
To configure, go to Tools>Improvian options>Printing.
Font, Background and Foreground
In the Editor tab of the Preferences dialog box, you can select a font style and
size, background and foreground for the Improvian Editor.
228
Referencing Price Data of Other Symbols
The External Function capability allows obtaining the value of an
expression (first parameter) based on the price data of another stock
(second parameter). A special function enables a formula to obtain the
price data of another symbol. The symbol(s) are referenced with a symbol
defined in Data Manager.
For example, to obtain IBM's Close, you need to use the following syntax:
Return
External("Close", "IBM");
Additionally, you can calculate any indicator and even any numerical
expression using the price data of a specified symbol.
Note: The External function does not work with weekly data.
229
Technique Interdependencies
Technique Interdependencies is a special dialog box for reviewing all trading
techniques available in Tradecision. It enables analyzing dependencies
between techniques and editing them.
Reviewing Technique Interdependencies
To review technique dependencies:
1. From the Tools menu, select Technique Interdependencies.
2. In the Technique Interdependencies dialog box, select the Model, Strategy, or
any other required technique.
3. Review the dependencies that are of interest to you by selecting the
Depends On and Used In tabs.
You can also use the following toolbar buttons:
• Locate in the list – to locate the required technique on the list.
• Select previous techniques – to select a previous technique or
techniques.
• Show only invalid techniques – to display invalid techniques.
230
Improvian: Glossary of Terms
Builders – special program modules that allow you to create and manage
trading techniques in Tradecision. All these modules have separate dialog
boxes. It means that you cannot access a strategy or indicator, say, from
Study Builder.
Comments –text blocks that can contain some explanatory information
for a specific trading technique. Syntax: {explanatory information}.
Dimension list – a list of dimensionality used by an array. Syntax: a[3,3]
Expression – an expression is any combination of reserved words and
operators that represent a value.
Formula – is a logical arrangement of one or more functions, operators,
data arrays, and so on.
For example: Average True Range strategy:
return CLOSE\0\ > (OPEN\0\ + (0.5 * AVGTRUERNG(14)));
Function Builder – a special tool that allows creating and managing user
functions.
Function Parameter - a value (enclosed in parentheses) that can be given
to a function. Parameters provide the information required to calculate the
function value. The parameters that can be given to a function are
explained in the description of the function.
Name (Identifier) – the name of a function. It can be no longer than
1000 symbols, including letters of the Roman alphabet, numeric characters
and underscore. It is incorrect to start an identifier with a digit.
Previous values – Variable value of the previous step. Syntax: a\1\.
Reference – a reference to a variable or array used in a function
declaration.
Return statement – Instruction of return. It stops program execution and
returns a value.
Syntax - a set of rules, defining how to compose sentences using the
Improvian language and its words. Syntax allows determining how to write
formulas based on functions and operators.
Semantics - the branch of linguistics which studies meaning in human
language, including the relationship between the language, thought, and
behavior.
Statements - an Improvian statement represents a complete instruction.
Statements can contain reserved words, operators, and punctuation marks,
and they always end in a semicolon.
231
if Length >0 then
Average:=Sum_ / Length;
else
Average:=0;
Technique Validity – A trading technique can be valid or invalid. A
technique is valid if it can be executed correctly. A technique is invalid
when it uses another technique that cannot be called for one of the
following reasons:
-
absence of the technique (it was permanently deleted);
the parameters of the technique have been changed.
Trading Technique – a trading strategy, alert, scan, study or indicator
that you want to create and/or use in Tradecision.
232
Trace Watcher
Understanding Trace Watcher
Trace Watcher enables analyzing the intermediate values of a trading
technique to avoid making mistakes in your code. For example, you want
to copy an indicator from the Technical Analysis of Stocks &
Commodities magazine. The expression is pretty complicated, so there is a
possibility of making a mistake. After some midway function you can write
"println" and then you can analyze the results using Trace Watcher.
Trace Watcher contains 10 tabs (from 0 to 9), allowing you to send
different pieces of information to different tabs.
233
Using Trace Watcher
To analyze the intermediate values of a trading
technique in Trace Watcher:
1. Open Improvian Editor.
2. Insert "println" into your trading technique to indicate that you want to
send some information to Trace Watcher. For example,
println(1,SumXAvg);
3. Save the trading technique.
4. Insert the trading technique into a chart.
5. Open Trace Watcher to see the results.
6. Select a tab.
7. Click Clear to clear the tab.
8. Click Save to File if you want to save the data in a separate text file.
For example, writing the Mass Index function:
function (Length1:numeric, Length2:numeric):numeric;
var
SumXAvg:=0;
SmoothXAvg:=0;
em := EMA(Range, Length1);
end_var
SumXAvg := CumSum(em, Length2);
SmoothXAvg := EMA(em, Length2);
{Let's see intermediate values}
println(0,em);
println(1,SumXAvg);
println(2,SmoothXAvg);
If SmoothXAvg <> 0 Then
return SumXAvg / SmoothXAvg;
return 0;
234
Improvian Options
The Improvian Options is used for managing system settings related to the Improvian language, used
by the Tradecision application.
To open the Improvian Options dialog box:
1. From the Tools menu, click Improvian Options.
General Tab
Calculations
In the Calculations area, you can define how many bars backwards your trading techniques can
reference.
Traces
Selecting the Clear before run check-box enables automatic clearing of the information on the
results of the previous teachique’s work in the Trace Watcher window for all the techniques that will be
used by you.
235
Skip Words Tab
In Improvian, words that have no meaning are known as skip words. The application allows you to
create a library of skip words that can be used when you are creating trading techniques. Skip words
can be used to make syntax read more like English because Improvian Editor ignores them while
verifying your trading techniques. Skip words are considered to be a kind of reserved words.
Adding a Skip Word
To add a skip word:
1. From the Tools menu, select Improvian Options.
2. In the Improvian Options box, select the Skip Words tab.
3. In the box next to the Add button, enter a skip word and then click
Add.
The word will be added to the Skip Word list.
4. Click OK.
Removing a Skip Word
To remove a skip word:
1. From the Tools menu, select Improvian Options.
236
2. In the Improvian Options dialog box, select the Skip Words tab.
3. In the Skip Word list select the skip word that you want to delete.
4. Click Remove.
5. Click OK.
237
Printing Tab
You can easily print a trading technique from Improvian Editor.
To print a trading technique code from Improvian
Editor:
1. In Improvian Editor, click Printing and then select Print if you want to
send the printout directly to the printer,
–OR–
Click Setup Printer or Print Preview if you want to preview the printout.
Note: The printing parameters can be set in the Printing tab. To set the parameters,
open the Printing tab and e click Setup Printer. Here you can set margins, Word
Wrap, Line Number and select a printer.
238
Editor Tab
The Editor tab you can select the font style, size, background and
foreground for Improvian Editor.
239
Code Templates Tab
In the Code templates tab, you can define a template of Improvian code
for corresponding Builder. By default return |; is selected.
Note: Use the | character to specify where the cursor will appear in Improvian Editor.
To define a template for a trading technique:
1. From the Tools menu, select Improvian Options.
The Improvian Options dialog box will be displayed.
2. Select the Code templates tab.
3. In the technique list, select a technique (indicator, alert, and so on) to
which you want to apply the template.
4. Click OK.
240
Predefined Variables Tab
From the Tools menu, select Improvian Options and then select the Predefined Variables tab.
Adding a Predefined Variable
To add a predefined variable:
1. From the Tradecision Tools menu, select Improvian Options.
The Improvian Options window is displayed.
2. In the Improvian Options window, select the Predefined Variables tab.
The Predefined Variables tab is displayed.
3. In the Predefined Variables tab, click Add.
The Add Predefined Variable dialog box is displayed.
4. In the Add Predefined Variable dialog box, provide the following
information:
• Name. Enter the name of the variable being added.
• Type. The type of the variable being added. Select from the list.
• Init. Value. Enter an initial value.
241
5. Click OK.
The new variable will be added to the list of the existing predefined variables.
242
Editing a Predefined Variable
To editing a predefined variable:
1. From the Tradecision Tools menu, select Improvian Options.
The Improvian Options window is displayed.
2. In the Improvian Options window, select the Predefined Variables tab.
The Predefined Variables tab is displayed.
3. In the Predefined Variables tab, click Edit.
The Edit Predefined Variable dialog box is displayed.
4. In the Edit Predefined Variable dialog box, modify the following
information as appropriate:
o Name. Enter the name of the variable being added.
o Type. The type of the variable being added. Select from the
list. The following options are available:
e Numeric
e Boolean
e String
o Init. Value. Enter an initial value.
5. Click OK.
243
Deeleting a Predefind Variable
To delete a predefined variable:
1. From the Tradecision Tools menu, select Improvian Options.
The Improvian Options window is displayed.
2. In the Improvian Options window, select the Predefined Variables tab.
The Predefined Variables tab is displayed.
3. From the list of the predefined variables in the Predefined Variables section of the
tab, select the
variable that you want deleted and click Remove.
244
Chapter 12
Indicator Builder
You can create the custom indicators using Indicator Builder.
Note: This Indicator Builder tool is available only in Tradecision Professional and
Professional Real Time.
245
Understanding Custom Indicators
Along with a standard set of indicators, Tradecision provides functionality
for creating and improving your own custom indicators. Since the trading
technologies and technical analysis are constantly developing, it is very
helpful to use this tool for experimenting and creating up-to-date advanced
indicators.
A custom indicator can be a combination of other indicators. Some wellknown indicators are simply a combination of other indicators. For
instance, Chaikin Oscillator is a subtraction of a 10-period EMA of
Accumulation-Distribution from a 3-period EMA of AccumulationDistribution, and TRIX is a combination of 3 Exponential Moving
Averages.
You can create or edit your own custom indicators using Indicator
Builder.
All indicators are automatically stored by Tradesicion so that you do not
have to re-enter them every time you want to use the formula.
Formulas created using Indicator Builder, as well as formulas used to
calculate the built-in indicators (for example, Stochastics, RSI, and so on)
are completely independent of each other. Any changes made to the
custom indicators will not affect the predefined indicators.
246
Creating a Custom Indicator
To create a new custom indicator:
1. From the Tools menu, select Indicator Builder.
The Indicator Builder dialog window will be displayed
2. In the Indicator Builder dialog box, click New.
The Custom indicator dialog box will be displayed.
3. In the Custom indicator dialog box, enter the following data in the
corresponding boxes:
• Indicator Name;
• Full Name;
• Description.
4. To define the indicator formula, click the Edit button under the
Expression box.
Improvian Editor will be displayed.
5. In the Expression box of the Improvian Editor dialog box, you enter the
actual formula for your indicator and click OK..
6.
Click OK to save the newly created custom indicator.
247
Modifying a Custom Indicator
To edit a custom indicator:
1. From the Tools menu, select Indicator Builder.
The Indicator Builder dialog box will be displayed.
2. In the Indicator Builder dialog box, click the Edit button.
The Custom indicator dialog box will be displayed.
3. In the Custom indicator dialog box, edit the Full Name and/or Description
as appropriate.
4. To define the indicator formula, click the Edit button under the
Expression box.
The Improvian Editor window will be displayed.
5. In the Expression box of the Improvian Editor dialog box, you can edit
your indicator formula.
6. Click OK to save the changes.
248
Copying a Custom Indicator
You can make a copy of the selected custom indicator in the Custom
Indicator dialog box using the Copy button.
This feature is useful when you want to design a new custom indicator that
is very similar to another indicator.
To copy a custom indicator:
1. From the Tools menu, click Indicator Builder.
The Indicator Builder dialog box will be displayed
2. From the Custom Indicator List in the Indicator Builder dialog box, select
an indicator that you want to copy.
3. Click the Copy button.
All the indicator data will be copied and the Custom Indicator dialog box will be
displayed.
4. Make changes in the Indicator Name, Full Name, Description and
Expression boxes, as appropriate.
Note: Step 4 of this procedure is optional.
5. Click OK.
249
Deleting a Custom Indicator
You can delete custom indicators from the Indicator Builder dialog box using
the Delete button.
To delete a custom indicator:
1. From the Tools menu, select Indicator Builder.
2. From the Custom Indicator List of the Indicator Builder dialog box, select
the indicator that you want to delete.
3. Click Delete.
250
Import/Export
With the easy-to-use Import/Export tools, you can manage you trading
ideas more effectively.
Custom indicators, trading systems, studies and models that you created
and saved on your local hard drive can be easily imported, exported and
sent by email.
Importing Indicators
To import indicators:
1. In the Indicator Builder dialog box, click Import/Export and then select
Import Indicators.
2. From the Import – Indicators dialog box, click the button to browse for the
folder from which you want to import the indicators on your local hard
drive.
3. Select the indicators that you want to import by selecting the
corresponding check boxes.
4. Click Import.
All imported indicators will be added to your Indicator List.
5. Click Close to close the Import – Indicators dialog box.
251
Exporting Indicators
To export indicators:
1. From the Indicator Builder dialog box, click Import/Export and then select
Export Indicators.
2. In the Export – Indicators dialog box, click the Browse button to browse
for the folder to which you want to export the indicators on your local
hard drive.
3. Select the indicators that you want to export by selecting the
corresponding check boxes.
4. Click Export.
The indicators will be saved in a folder you indicated with the
extension.tnd. Now you can send them to your friends or partners by email. The receiver will need to use the Import command to be able to
work with the indicators
5. Click Close to close the Export – Indicator dialog box.
252
Chapter 13
Study Builder
With Study Builder, you have the opportunity to create, save and load your
custom studies into a chart.
Note: This Study Builder tool is available only in Tradecision Professional and
Professional Real Time.
253
Understanding Study Builder
Study Builder is an analysis tool that enables you to improve your trading
by creating a variety of custom studies.
With Study Builder, you have the opportunity to create custom studies
using your own trading ideas that can be easily stated and further
developed using the Improvian Language. Your custom studies can then
be saved and loaded into a chart.
With Study Builder you will be able to mark a particular market activity
and/or specific chart pattern with colored markers plotted over a chart.
This enables you to follow the recurrence and consequences of those
market conditions that you want to note.
As soon as it is added to the Studies List, a study becomes part of your
study collection, and you can easily edit it and apply it to any chart.
The number of diverse studies you can build is virtually unlimited, so you
can build as many as you can come up with.
254
Creating a Custom Study
To create a new custom study:
1. From the Tools menu, click Study Builder.
The Study Builder dialog box will be displayed.
2. In the Study Builder dialog box, click New to add a new custom study to
your library.
3. In the Custom Study dialog box, enter the name and description of the study
being created in the Name and Description boxes.
4. Click Edit to write and check the study formula in the Improvian Editor
dialog box.
5. Click Insert.
The custom formula will be added to the Expression text box of the
Custom Study dialog box.
6.
Click OK.
The newly created study will appear in the Studies List area.
255
Customizing a Custom Study
To change the color and bars back of a custom study:
1. From the Tools menu, select Study Builder.
2. In the Studies List area, select the study that you want to modify.
3. Click the Insert Into Chart button.
The Insert Custom Study dialog will be displated
4. Select the Style tab. In the Parameters area, change the bars back value
and select a new color from the list.
5. Click Insert.
256
Editing a Custom Study
To edit a custom study:
1. From the Tools menu, select Study Builder.
The Study Builder dialog box will be displayed.
2. In the Studies List area, select the study that you want to modify.
3. Click the Edit button.
4. In the Custom Study dialog box, make the required changes.
5. Click Edit to edit and check the study formula in the Improvian Editor
dialog box.
6. Click OK.
257
Copying a Custom Study
You can make a copy of a selected custom study in the Study Builder dialog
box using the Copy button. This is useful when you want to design a new
custom study that is very similar to another custom study.
To copy a custom study:
1. From the Tools menu, select Study Builder.
The Study Builder dialog box will be displayed.
2. In the Studies List area, select the study that you want to copy and then
click Copy.
3. In the Name box of the Custom Study dialog box, enter the new name of
the study.
4. Click OK to save the changes.
The new custom study will appear in the Studies List area.
258
Deleting a Custom Study
You can delete a selected custom study from the Custom Studies dialog box
using the Delete button.
To delete a custom study:
1. From the Tools menu, select Study Builder.
The Study Builder dialog box will be displayed.
2. In the Studies List area, select the study that you want to delete.
3. On the toolbar, click Delete.
259
Inserting a Custom Study into a Chart
You can display the signals generated by Study Builder in the
corresponding chart.
To insert a custom study into a chart:
1. From the Tools menu, select Study Builder.
The Study Builder dialog box will be displayed.
2. From the Studies List area, select the study that you want to insert into a
chart.
3. On the toolbar, click Insert Into chart.
4. From the Intert Custom Study dialog, select the study you want to insert.
5. Click Insert.
260
The selected custom study will be calculated and inserted into the
corresponding chart.
261
Import/Export
With Tradecision’s easy-to-use Import/Export tools, you can manage
your trading ideas more effectively. You can easily exchange any of your
trading ideas with your friends.
The custom indicators, trading systems, studies and models that you
created and saved on your local hard drive can be easily imported,
exported and sent by email.
Importing Custom Studies
To import Custom Studies:
1. In the Study Builder dialog box, click Import/Export, and then select
Import Studies.
The Import – Custom Studies dialog box will be displayed.
2. In the Import – Custom Studies dialog box, click the Browse button to select
the folder you want to import the studies from on your local hard drive.
3. Choose the studies that you want to import by selecting the corresponding
check boxes.
4. Click Import.
All the imported studies will be added to your Custom Studies List.
5. To close the Import – Custom Studies dialog box, click Close.
262
Exporting Custom Studies
To export custom studies:
1. In the Study Builder dialog box, click Import/Export, and then select
Export Studies.
2. In the Export – Studies dialog box, click the Browse button to select the
folder on your local hard drive where you want to export the studies.
3. Choose the studies that you want to export by selecting the corresponding
check boxes.
4. Click Export.
The studies will be saved in the selected folder with the extension .tdf.
Now you can send them by email to your friends or partners. The recipient
will need to use the Import command to work with the studies.
5. To close the Export – Studies dialog box, click Close.
263
Chapter 14
Neural Model Builder
The Tradecision functionality enables modeling security prices using neural
networks.
A neural network trained for a certain security can be used to generate a
trading strategy based on model forecasts. This neuro-strategy can be
tested, optimized and used to generate buy/sell signals.
264
Understanding Neural Models
Tradecision uses very adaptable and precise constructive neural networks
to create neural models. Constructive nets grow and train themselves
during iterative price movement analysis.
Network construction, training, testing and parameters selection are fully
automated. All the scientific details are hidden. You do not have to have
any knowledge of neural networks to successfully create and train a neural
network.
Tradecision requires a set of input columns and a target column to create
and train a model. A trained model can be used with the current values of
the inputs to forecast what the closing price (or some other
price/indicator) will be in the future. Model forecasts can then be used to
create a trading strategy, generate buy/sell signals, back- and forward-test
the model's performance.
Prevention of over-optimization is automatically maintained using
Alyuda’s special algorithms, which, just like many other algorithms used in
the application’s functionality, were developed as a result of years of AI
applications’ research in trading and financial forecasting.
265
Introduction to Genetic Algorithms
Genetic Algorithms are search algorithms based on the mechanics of
natural selection and natural genetics. They combine the survival of the
fittest rule with a structured yet randomized information exchange. The
method uses terms accepted in genetics, such as fitness, population,
generation, mutation, gene, and so on.
In contrast to random search methods (such as, for example, Monte Carlo)
genetic algorithms are not a simple random walk. These algorithms
efficiently use historical information to speculate on new search points
with expected improved performance. Their goal is forming or finding a
population of trading strategies that will have the best fitness level, or in
other words, the best optimization criteria values.
Genetic algorithms possess the best characteristics of the other
optimization methods, such as robustness and fast convergence, which
does not depend on any of the optimization criteria (for instance, on
smoothness).
Although genetic algorithms are much faster while searching a large
number of possible options, they are slower than exhaustive search as far
as a small search space is concerned.
266
Introduction to Neural Networks
Over recent decades, neural networks have become widely adopted for
financial analysis due to their ability to solve tasks that are difficult or
impossible to solve using other, conventional methods.
Neural networks are indispensable for those tasks, where problems are
difficult to solve using clear logic or mathematical dependencies.
Using neural networks you can expose and use hidden patterns of a high
degree of complexity by analyzing the actual historical data.
General Information
Neural networks have a number of properties that distinguish them from
other methods.
Firstly, being able to memorize information, they also have the ability to
generalize it. That means that a well-trained network is capable of working
successfully not only with the data it has memorized, but also with data
that was not used for training or is garbled.
Secondly, a neural network can train up, i.e. improve its characteristics
every time new data arrives.
In addition, the Neural Networks can very quickly obtain answers from a
previously trained network, which is highly important for real-time
analysis.
Good neural models, provided they had the right amount of data and
relevant inputs, forecast with 60-80% accuracy.
267
What Are Neural Networks?
Neural networks are data analysis methods and algorithms loosely based
on nervous systems of humans and animals.
An artificial neural network consists of a large number of simple
processing units linked with weighted connections. By analogy, the
processing units may be referred to as neurons. Each unit receives inputs
from many other units and generates a single output. The output acts as an
input for other processing units.
The power of a neural network stems from the combination of multiple
units in a network. A certain network can be tuned to solve a specific
problem by modyfing the connection topology and values of the
connecting weights between its units.
Artificial neural network is nonlinear in nature and, thus, is an
exceptionally powerful method of analyzing real-world data that allows
modeling extremely difficult dependencies.
Neural networks have proven to be among the best methods of detecting
hidden relations in stock market data. Once a neural network has analyzed
your dataset (i.e. “has received training”), it is able to make predictions
based on the hidden dependencies that have been found.
268
Biological Prototype
Artificial neural networks were created for conducting research into the
way the human brain functions. During this research there was made an
attempt to create a model that would incorporate the existing knowledge
of the structure of the human brain and the patterns based on it functions.
During the model research, a number of useful features were discovered.
As a result, there appeared a new direction in the development of neural
networks, Neural networks started being developed to be applied in a
variety of fields.
At the present time, it is exactly this direction that is developing most
rapidly and is considered to be the most promising.
Artificial neural networks model the functioning of the human brain very
simplistically. The basic ANN elements, called Artificial Neurons, model
the functioning of brain cells.
The structure of a neural network and the laws of operation of artificial
neurons are also similar to the original. However, the human brain
contains dozens of billions of neurons and has a structure so complex that
at this point it is impossible to understand, let alone to model it.
The structure of an artificial neuron is rather simple. It has a set of inputs,
a body and an output. The neuron receives a set of signals at the input and
transforms the signals by generating an output signal. The neuron inputs
and outputs are linked with each other. As a result you can receive a set of
signals at the output by sending a set of signals to the input. ANN training
is the correction of links between the neurons in such a way that a very
close similarity between the input and output data is achieved.
269
Preparing Data for Neural Networks
Data for feeding a network is usually presented in the tabular format. One
or several columns are output columns and the rest are input columns.
ANNs work with numeric data. However, problematic data is seldom
numeric. Often, dates and time, as well as textual data contained in the
final set of values, have to be processed. Therefore, additional processing
and transformation of such data are required before using the data as the
network input and after the data output.
Prior to being fed to the network input, numeric data must be scaled, as
artificial neurons have a limited range of operating values. Therefore, input
information should be processed to fall within this range and output
information should be received from network output by means of reverse
transformation.
270
Using a Neural Network
The task of data forecasting is one of the main neural network
applications. This process can be conditionally divided into two stages:
1. Preparing and training a network on source data;
2. Using a trained network to forecast new data.
The preparation of a neural network model is divided into several stages:
• input dataset analysis: data types definition (numerical,
categorical, text, data/time, and so on), missing values and outliers
handling, inputs selection and noise reduction;
• data preprocessing: transferring source data into a form suitable
for a neural network;
• network design: selection of a network architecture, training
method, training parameters;
• network training;
• performance test of the trained network;
• network improvement based on test results.
The network can be re-trained with other inputs, architecture, training
method or training parameters.
Using a ready network is a less complicated and time-consuming process
than its preparation. At the input, a set of data that was preprocessed
based on the same principles and using the same methods as those during
the first stage, is fed into the network and the output is unknown. After
getting the input signal the network generates an output signal, which is
the forecasting value after post-processing.
It should also be mentioned that, as a rule, network preparation and
training require a significant amount of time. The quality of the result
depends strongly on the training data selection, representation and
preprocessing, as well as on the architecture and tuning of the training
algorithm. In any case, the amount of training data must correspond to the
complexity of the problem to be solved.
271
Creating a New Model
A new neural model can be easily created using the New Model wizard.
The new model will analyze and forecast the symbol data of the current
chart.
To start the New Model wizard:
1. From the Tools menu, select Model Builder.
The Model Builder will be displayed in a separate window.
2. On the Model Builder toolbar, click New.
This command activates the New Model wizard, which guides you through
the process of creating a neural model.
272
New Model Wizard
The New Model wizard guides you through the process of creating a
neural network model used to forecast future price or indicator values.
The wizard comprises four steps:
Step 1: Select model target and lookahead;
Step 2: Select training and test data ranges;
Step 3: Select model inputs
Step 4: Define model-based strategy for performance report
273
Step 1: Select the Model Target and Lookahead
During this step, you need to define the model target and specify how far
into the future you want the model to predict.
In the Model name box, you can change the automatically generated
model name to a more descriptive one.
In the Description box, you can enter the model description that can help
you distinguish this model from similar ones created for the same stock.
The Target list can be used to define which indicator should be
considered as the target one. In other words, you need to define the data
that must be predicted by the model. By default, "% change in Close" is
selected as the model target. However, you can also select change in
Close, % change in Open or change in Open.
In the Lookahead box, you can enter the number of bars for which you
want the model to forecast.
The Lookahead parameter specifies how far into the future you would
like to forecast. For example, if you are trying to predict a value two
trading days in advance using daily price data, this value should be set to 2.
The further into future you want to forecast, the bigger forecasting error
you should expect. We recommend forecasting 1-10 bars ahead. However,
274
in many cases forecasting 4+ bars ahead could have a lower error than 1-3
bars ahead as natural noise is reduced as the time of the forecast increases.
You can select the Define data ranges automatically to skip Step 2. In
this case data ranges used for model training and testing will be selected
using the default settings. By default, 3000 bars will be used for model
preparation, the last 20% being allocated for walk-forward testing.
275
Selecting Target
While creating a model, you need to select a market parameter (data
column) which must be predicted by the model. This parameter is called
target. You can choose to forecast Close, Open or any available technical
indicator.
Tradecision always creates models that forecast change or percent change
in order to normalize similar price patterns at different price levels. This
simple approach can enhance the model performance several times. For
some indicators, normalization is not necessary. However, even in this
case, this approach can slightly improve the performance as, for example, a
10% model error converted into absolute values is less significant than a
direct 10% error in the absolute values.
Tradecision does not provide any High or Low-forecasting functionality,
as this data contains a great deal of noisy movements and outliers.
Therefore, a model targeted to forecast High or Low will be rather
inefficient.
Selecting an indicator as the target is helpful if you want to forecast market
volatility, typical price, moving averages, price momentum or market
strength. You can also create a composite indicator to use smoothed or detrended representation of the market.
Price data and most of the indicators contain noise in their values. This is
one of the reasons for models’ poor performance. To reduce the amount
of noise, you can use a moving average of Open, Close or an indicator as
the model target. When your target is a moving average of price or that of
an indicator, you should keep the Period parameter of the moving average
lower than the model’s Lookahead parameter.
276
Step 2: Select Training and Test Data Ranges
During this step, you need to define how much data will be used for the
model preparation. You can also allocate manually the portion of this data
that should be used for walk-forward testing.
To select the amount and position of the price data:
1. To define the duration of the test period, in the Price data range area,
select the Use last option and enter the amount of data that you want to
use.
Note: The system supports defining the duration of the testing period in bars, years,
months or weeks.
2. To precisely specify the start and the end date for the data used for the
model preparation, select the Custom date range option.
Note: This option is especially useful if you want to train or test the model on certain price
patterns.
3. Select the Use all available data to use all the data available for this
security.
277
The data that will be used for walk-forward testing will be allocated
automatically. The allocated range is displayed in the Walk-forward test
area.
Although it is not recommended, you can skip the walk-forward testing by
clearing the Walk-forward test check box.
278
To change the amount and position of the price data
used for model walk-forward testing:
1. In the Walk-forward test area, click Change.
2. In the Test Range dialog box, select the Use % of data from option to
specify the test period as a percentage of the data available for the model
preparation. The specified amount can be allocated in the beginning or end
of the available price data, depending on in which is selected by in the
corresponding list.
2. To define the duration of the test period, in the Price data range area,
select the Use last option and enter the amount of data that you want to
use.
Note: The system supports defining the duration of the testing period in bars, years,
months or weeks.
3. To precisely specify the start and the end date for the data used for the
model preparation, select the Custom date range option.
Note: This option is especially useful if you want to train or test the model on certain price
patterns.
4. Click OK.
The walk-forward data range will be re-allocated.
279
Selecting Model Test Period
The current model together with the current strategy should be tested on
out-of-sample data (walk-forward period). Out-of-sample walk-forward
testing will yield results that will be similar to those achieved during real
trading with this model. For more information, refer to Understanding
Model-Based Strategies.
Tradecision automatically tests the current model after each modification
of the training or model properties. You can select how much data should
be used for automatic walk-forward testing.
The more data you select for the testing, the more patterns are available to
test the model with and the more confident you can feel about the results
of the test.
However, at the same time, the more data you select for the testing the
fewer price patterns are available to train the model. With a smaller
amount of data, the training of the model will be less efficient.
It is recommended that one has at least 100 bars for testing.
280
Step 3: Select Model Inputs
During this step, you need to define the model inputs. You need to select
the indicators that as you believe contain valuable data to predict the
model target.
To add a model input:
1. Click Add.
The Improvian Editor window will be displayed.
2. Select a function that you want to use as an input and change its parameters,
if required.
3. Click OK.
For details, refer to Writing Model Inputs.
Note: If you would like to use your custom indicator as an input for neural models, you
need to create a corresponding custom function using the Function Builder (Tools menu).
Once you have created it, you can access the function in Improvian Editor, in the
Categories listing, in the <My Functions> group.
281
You can edit or delete the selected input using the Edit and Remove
buttons.
You can save your favorite combination of inputs as an input template.
The saved templates can be used with new models.
To save a combination of inputs as a template:
1. Click Save Template to save the current list of model inputs as a
template.
2. Click Load Template to load a built-in or previously saved template.
The New Model wizard will help you find the optimal parameters of
indicators that you use as inputs, or in other words, will run the
optimization algorithm that will exclude insignificant inputs from the
model
282
To optimize inputs:
1. To optimize the inputs, select the Search for best inputs check box.
Note: Clear this check box if you want to use all the inputs you defined and optimize
only the parameters.
You can use two optimization algorithms: Exhaustive Search and Genetic
Algorithms.
Exhaustive search verifies all possible combinations of optimized
parameters and, therefore, can definitely find the best possible solution.
However, the time required for exhaustive search increases rapidly when
the number of the parameters is incrased. Exhaustive search should be
used if you have only a few parameters and small limits set for them.
Genetic Algorithms are search algorithms based on the mechanics of
natural selection and natural genetics. They combine the survival of the
fittest rule with a structured yet randomized information exchange. The
method uses terms accepted in genetics, such as fitness, population,
generation, mutation, gene, and so on.
283
Writing Model Inputs
To write a model input:
1. During Step 3 of the New Model wizard, click Add.
The Improvian Editor dialog box will be displayed.
2. In the Categories area, select the required function or just enter it
manually in the Expression area, for example, SMA (Close, 9).
3. According to the Improvian syntax, you have to add "return" before the
SMA and ";" at the end of an expression. Therefore, the input must be
written as follows:
return
SMA(Close, 9) ;
4. In the Improvian Editor, click OK.
5. The input will be added to the inputs list with the following name:
SMA(Close, 9).
If you point to it, a message will be displayed, providing information on
the input expression.
You can easily rename an input using the Rename input command.
284
Optimizing Model Inputs
Optimization of input parameters can be done with the help of variables.
At the beginning of an expression, you have to declare that you want to
use optimization in this input. For example, you would like to have RSI
and EMA in one input and optimize their parameters. Your expression can
be written in the following way:
var
opt1:=#;
opt2:=#;
end_var
return RSI(Close,opt1) + EMA(Open,opt2);
Where 'opt1' and 'opt2' are optimized parameters.
285
To add an input with optimized parameters:
1. During step 3 of the New Model wizard, click Add.
The Improvian Editor dialog box will be displayed.
2. In the Categories area, select the required function or functions or
simply write it manually in the Expression dialog box.
3. With the help of "VAR", declare optimized parameters.
4. In the Improvian Editor dialog box, click OK.
The input will be added to the inputs list with a name comprised
according to the following name mask: < Complex input #1>. If you
move your pointer to this name, a message providing information on the
input expression will be displayed.
286
Selecting the Right Amount of Input Data
If your historical data has a small number of price patterns, the neural
network will not have enough information about your market to train
correctly. For daily bars it is recommended to have at least four (better 6+)
years of price data (1000-1500+ daily bars) for the network training, and at
least six (better 12+) months for walk-forward testing.
Too much data may increase the training time for a neural model, but will
not improve forecasting. Additionally, some old price patterns will not
simply be valid for the current market situation. Therefore, to reduce the
input dataset you need to remove the oldest data.
Selecting Input Columns
Selecting appropriate inputs is the most important task. Inputs are the only
knowledge about the market that will be available to the model to base its
forecasting activity on. All data that you believe to significantly affect the
value of the target or represent the market situation should be used as
inputs.
For example, to forecast what the closing price will be three days from
now, you can train the model using Open, High, Low, Volume, lags and
indicators as inputs and the previous closing prices as the target.
Irrelevant or insignificant inputs may deteriorate the model's performance.
Additionally, the more inputs you have the more historical data you need
to provide to train the model. With more historical data you will have to
spend more time on training your model and run a greater risk of curvefitting or over-optimization. Curve-fitting occurs when a model simply
memorizes the training data and, as a result of which the model’s
generalization ability is decreased and the level of its forecasting error is
raised. For details, refer to Preventing curve-fitting.
For example, you should not add Momentum if you are making a forecast
for a sideway market. In most cases, this will have a minute impact on your
model or will even worsen it. However, do not forget to include oscillators
(such as Stochastic or RSI), as they perform well on sideway markets.
287
Step 4: Defining Model-Based Strategy for Performance Report
To test a neural model, you need to define a strategy based on model
forecasts (model-based strategy).
Trading strategies produced by New Model wizard are based solely on the
model forecasts. These strategies produce buy/sell signals that depend
only on model forecasts and, therefore, allow testing the model
performance without taking into consideration money management and
indicator-based rules.
To define a model-based strategy, you need to specify entry and exit rules
for longs and shorts in the Model-based strategy area. To specify these
rules, you need to define thresholds for triggering buy/sell signals. The
thresholds depend on your stock volatility, model goal, minimum profit
you are interested it and your risk preferences. The thresholds are specified
as percentages (or dollar amounts).
The strategy enters a long position if the forecasted change in price is
greater than the threshold specified in the Long Entry box.
The strategy exits a long position if the forecasted change in price is less
than the threshold specified in the Long Exit box.
The strategy enters a short position if the forecasted change in price is less
than the threshold specified in the Short Entry box.
288
The strategy exits a short position if the forecasted change in price is
greater than the threshold specified in the Short Exit box.
The Position size box is used to determine what amount should be used
to calculate the profit/loss of each position generated by the model
strategy. It contains information on the amount traded during each
transaction. By default, this value is set to 10'000.
To achieve better results, the thresholds should be adjusted to your stock
and current market conditions. You can calculate standard deviation,
average true range, volatility, and other factors for your stock and base
your thresholds on these calculations. You can also simply define your
minimum profit target.
For example, if the purpose of your model is to forecast change of Open
price for two days ahead, you can trigger the buy signal only if:
• the forecasted change in price is bigger than the average daily price
change;
• the forecasted change in price is twice bigger than the average true
range;
• the forecasted change in price is simply 30 points bigger than the
current price (your minimum profit target).
The correctly selected strategy thresholds can significantly improve the
performance report generated for the model-based strategy. That is why
Tradecision features strategy thresholds optimization.
The thresholds can be adjusted automatically using the symbol data
volatility and selected target. To enable the feature, use the Adjust
automatically button.
289
To include thresholds optimization in the model
building process:
1. In the New Model dialog box, select the Optimize thresholds check
box.
2. From the Optimization goal list, select an optimization objective. You
can select from multiple options.
1.
2.
3.
4.
5.
6.
Maximize Net Profit
Minimize Max Drowdown
Maximize Ratio Net Profit / Max Drowdown
Maximize Ratio Gross Profit / Loss
Maximize Percent Profitable Trades
Maximize Sharpe Ratio by Trade
3. Click the Optimization Range button.
The Optimization Variables dialog box will be displayed.
290
4. In the Variables Optimization dialog box, select the limits and step for
the threshold optimization and then click OK.
Note: After the model is selected and trained, its thresholds will be optimized to
provide you with the best performance the model can offer.
After you click Finish, a new model will be created, trained and added to
the Model Builder database. In Model Builder you will be able to analyze
the model and insert its signals into the chart.
291
Optimizing Variables
Specifying the Range of the Selected Optimization Variable
The range of the selected optimization variable is specified in the
Optimization Variable dialog box.
To specify the range of the selected optimization
variable:
1. During step 3 of the New Model dialog box, select an input that contains
optimized parameters.
2. Click Optimization.
The Optimization Variable dialog box will be displayed. The Variable
Name column shows the variable that you are currently editing.
292
3. In the From column, enter the minimum value for the optimization
variable.
4. In the To column, enter the maximum value for the optimization
variable.
5. In the Step column, enter the step size by which to increment the
optimization variable.
For example, if the minimum/maximum range was from 4 to 10, and the
step size was 2, the optimization variable will be replaced with the values
of 4, 6, 8, and 10.
293
Specifying the Optimization Algorithm and its Properties
The optimization algorithm and its parameters are specified from the
Advanced Optimization Options dialog box.
To specify the optimization algorithm:
1. In the Optimization Method area of the Advanced Optimization Options
dialog box, select the type of the optimization algorithm
The following options are available:
• Exhaustive search. This method tests all possible combinations of inputs
and selects the best combination.
Note: The method may be too time-consuming if you have a large amount of inputs
and a big dataset.
• Genetic algorithms. The method starts with a random population of
input configurations. Input configuration determines which inputs are to
be ignored during the performance test. During each following step
(generation) input configuration uses a process similar to natural selection
to select superior configurations and generate a new population. Each step
successively produces a better input configuration. During the last step, the
best configuration is selected.
The Genetic algorithms method is very time-consuming but efficient for
determining mutually-required inputs and detecting interdependencies. For
details, refer to Introduction to Genetic Algorithms.
294
To modify the properties of the Genetic Algorithm:
1. To improve the algorithm’s efficiency, in the Genetic Algorithm
Properties area of the Advanced Optimization Options dialog box, enter the
following properties:
• Population Size. The number of potential configurations used during
each step of the algorithm. The larger the population, the bigger is the
probability of finding a good configuration and the more time is required
to find this solution.
• Number of Generations. The number of steps of the genetic algorithm.
Each generation is equal to the interval during which a new population is
created, using the combination of crossover and mutation. Each new
generation is produced by modifying the previous generation with a view
to selecting those inputs that produced the best results. The larger the
Number of Generations, the bigger is the probability of finding a good
solution and the more time is required to find this solution.
• Crossover Probability. This is the probability of crossover for each
configuration during any given generation. The higher is the crossover
rate, the stronger is the probability of convergence with a similar set of
children (configurations). A lower crossover rate requires a bigger number
of generations to explore the search space better.
Note: Crossover is the process of creating a new configuration using parts of its parent
configurations.
• Mutation Probability. Specifies the probability of mutation for each
configuration in each new generation. The higher the mutation rate, the
better the search possibilities of the algorithm are and the bigger the
destruction possibility for good configurations.
Note: Mutation is the process of altering one or more bits in the inputs configuration
(mask).
295
Using the Advanced Optimization Criterion
To use the optimization criterion:
1. During Step 3 of the New Model wizard, click Advanced.
The Advanced Optimization Options dialog box is displayed.
2. In the Advanced Optimization Options dialog box, select the Exhaustive
search or Genetic algorithms option.
3. From the Optimization criterion list in the Criterion area, select the criteria
for your neural model’s optimization.
The following options are available:
• Absolute Error on Test Range;
• MSE on Test Range;
• Directional Accuracy on Test Range;
• Tradability on Test Range;
• Complex Average Absolute Error (30% on Training Range and 70%
on Test Range);
• Complex Directional Accuracy (30% on Training Range and 70% on
Test Range);
• Complex MSE;
• Complex Tradability.
4. Click OK.
296
Selecting Additional Stopping Conditions for Genetic Algorithms
Understanding the Feature
The option can be very helpful when you use Genetic Algorithms as your
optimization method. You can use it to prevent excessive use of valuable
computer resources. It can be configured in the Genetic Algorithms
settings (in the Advanced Optimization Options dialog box) when you are
creating a neural model or strategy.
This feature has two options:
Maximum Time … Minutes. The algorithm will be automatically
stopped after an indicated time.
No improvement for … Iterations. The optimization process can be
stopped if the fitness of the best model/strategy has not been improved
after an indicated number of iterations.
297
To define the additional stopping conditions for Genetic
Algorithms in Model Builder:
1. During Step 3 of the New Model wizard, click Advanced.
2. In the Additional Stopping Conditions area of the Advanced
Optimization Options dialog box, select the Maximum Time … Minutes
and/or No improvement for … Iterations check boxes and enter the
appropriate numbers in the corresponding text boxes.
3. Click OK.
298
Training a Model
To start the training or re-training process for a model:
1. To train or re-train a model, select it in the Model List and click Train
on the Model Builder toolbar.
The training process will be started and the Model Training progress
progress bar will be displayed until the training is complete.
After the training is complete, the model will be automatically tested using
the walk-forward test period and you will be able to analyze the model’s
performance and insert its signals into the chart.
For details, refer to Model Performance Report.
299
Editing a Model
You can modify the properties of a model before re-training it.
To edit the properties of a model:
1. Open Model Builder.
2. From the Model List, select the model that you want to edit.
3. Click Edit.
The New Model Wizard will be displayed, providing information on the
currently set model properties.
4. Modify any of the available model properties during the corresponding
step and click Finish.
Following its modification, the model will be automatically retrained and
its performance figures will be automatically updated.
300
Deleting a Model
To delete a model:
1. Open Model Builder.
2. From the Model List, select the model that you want to delete.
3. On the Model Builder toolbar, click Delete.
A confirmation dialog box will be displayed.
4. In the confirmation dialog box, confirm the deletion by clicking OK.
After the confirmation, the model will be deleted from the internal
database.
301
Analyzing Model Performance
To analyze model performance:
1. Open Model Builder.
2. From the Model List, select the model that you want to analyze.
3. To select the type of the range that you want to analyze, on the Model
Builder toolbar, click Analyze and from the Analyze list select the
Training range… or Test range…
Note: Test range is used to analyze the model performance on an out-of-sample
period. Training range is used to analyze the model performance on a period that
was used to train the model.
The Model Report window will be displayed.
4. In the Model Report dialog box select the appropriate tab to analyze the
model performance.
The following tabs providing relevant information are available:
•
•
•
•
•
•
•
Strategy Performance
Trades
Equity
Model Performance
Profit Distribution
MAE/MFE
Net Profit by period
302
Viewing Summary Information
Important detailed information on model performance can be viewed in
the Model Performance tab.
The Model Performance tab assists you in analyzing neural model forecasting
quality using statistical ratios and graphs. It provides separate sets of
figures for the training and walk-forward testing periods. The figures for
walk-forward testing are much more important since they represent the
model quality you will have when you use the model on new data.
Usually, model performance during the training period will be better than
during the testing one. A good model should have good performance
during both periods.
Note: The model target is a change or some percentage of a change in a price or
indicator and model errors (absolute, relative, and MSE) are provided for changes and
not for absolute values. If you are comparing two models for different stocks, you should
take into consideration the different price levels of different stocks.
For both periods, the Summary table displays the following values:
• Start date. The date of the first bar in the corresponding period.
• End date. The date of the last bar in the corresponding period.
You should inspect the stock chart visually using the start and the end
dates to make sure about the following:
1. The model performance is not caused only by stable trending market in
the corresponding period;
303
2. The market behavior during the training period is not dramatically
different from that during the test period. For example, if your training
period has only small sideway moves but the test one represents the strong
bull market, your model will not be able to provide good signals during
walk-forward test period since it wasn't trained to respond correctly on
such market situations.
Number of bars. The number of bars in the corresponding period. A
small number of bars can be the reason for poor model performance. For
details, refer to Selecting the Right Amount of Input Data.
Tradability ratio. This kind of ratio compares the model forecasting
error with a stock’s volatility. If this ratio is below 1, the model should not
be used for trading, as it's forecasting error is bigger than or comparable
with stock volatility. Models with the tradability ratio within the range
from 1 to 2 should be considered moderately tradable and should rather be
improved before being used in real trading. Models with the tradability
ratio above 2 should be considered tradable, at least from this point of
view.
Directional accuracy. This ratio is the number of times the model
forecasts and the actual target values moved in the same direction,
expressed as percentage. This ratio concentrates only on direction, and not
on the size of changes. If your model has good directional accuracy you
will be able to make money as you will know the direction for the next
market move and even if the size of this move is predicted inaccurately,
you will have a profitable position.
Average absolute error. The average of the absolute value of the
differences between the forecasted and actual target values. If you are
forecasting a change in Close, the amount will represent the average error
for predicting change in dollars. If you are forecasting a change in an
indicator, the value will represent the average error for predicting a change
in indicator points.
Average relative error. The average of the relative value of the differences
between the forecasted and actual target values.
Mean Squared Error. The average of the squared value of the difference
between the forecasted and actual target values. This type of error is used
to indicate models with a lot of forecasting errors bigger than the average.
Correlation. Correlation is a statistical ratio also known as r coefficient or
Pearson's correlation coefficient. It measures the linear correlation
between the actual target values and model forecasts. The closer this ratio
is to 1, the stronger the positive correlation. The closer the ratio is to -1,
the stronger is the negative correlation. Small positive and negative values
close to zero indicate a poor model with no correlation between the model
forecasts and actual values.
r-squared. Squared Correlation.
304
Mean R-Squared. A statistical ratio that compares the model forecasting
accuracy with the accuracy of the simplest model that just use mean of all
target values as the forecast for all records. The closer this ratio is to 1, the
better the model is. Small positive values close to zero indicate a poor
model. Negative values indicate models that are worse than the simple
mean-based model.
Note: R-squared is not to be confused with r-squared which is only a squared
correlation.
Last R-Squared. A statistical ratio that compares model forecasting
accuracy with the accuracy of the model that uses the current values as
forecast for all records. The closer this ratio is to 1, the better the model is.
Small positive values close to zero indicate a poor model.
305
Input Importance Chart
The Input Importance tab displays the relative importance of each input
column. This chart can help you decide which of the input columns can be
safely removed without affecting the model performance. It also helps to
understand the most important model inputs (price data and indicators)
that have had the biggest influence on the model.
However, you should be careful while interpreting this chart, as the input
columns can be interdependent and some of them may work only together
or encode the same information.
Actual versus Forecasted Graph
Actual versus Forecasted Graph displays a correlation between the real
data and model output. The graph was made on the basis of the forecasted
graph (blue) and actual graph (red). You can zoom-in/out/hand-move to
analyze the graph and thresholds. The blue and red lines vary in similar
amplitudes.
In the test range, the Actual versus Forecasted Graphs should be as close
to one another as possible. The blue and red lines should at least have an
equalized direction while their magnitude can be different.
306
Understanding Model-Based Strategies
To test a model, Tradecision applies a simple model-based strategy to
historical data and determines whether you would have made a profit if
you had followed this strategy, or not. If the strategy turns out to have
been profitable, and if it fits your trading personality, you can be confident
in using the model to make future trading decisions.
A major advantage of model testing using a model-based trading strategy is
the possibility to rigorously test the model over different periods of time
and with different parameters. To help you thoroughly analyze a modelbased strategy, Tradecision creates the Strategy Performance Report.
The report provides detailed information about your strategy, including the
return on account, drawdowns, risk ratios, number of
profitable/losing/outlier trades, as well as timing analysis. To ensure that
the figures of the Strategy Performance Report are as close to reality as
possible, you can factor in broker's commissions and slippage.
In addition to the Strategy Performance Report, you can analyze equity
and drawdown curves for your account. For details, refer to Equity and
Drawdown curves.
Testing against data that was used to train and optimize neural model (or
develop the trading system) is referred to as in-sample testing. A trading
system SHOULDN NOT be tested only against in-sample data.
Testing using data that the system was not trained on or optimized against
is referred to as out-of-sample or walk-forward testing. The neural
network and other system parameters are frozen, and the system is then
given data it has not seen before. A system SHOULD be tested against
out-of-sample data.
When walk-forward testing is done, a portion of the available price data is
not used. This portion is used for testing after the model training and
optimization are complete. Walk-forward testing represents a truer
measure of system performance in real-time trading.
In-sample testing results can only outline that the trading system has the
potential to yield a profit in walk-forward testing and, consequently, yield a
profit in real-time trading.
A system must be profitable with both in-sample and out-of-sample data
to be used in real-time trading.
For trustworthy testing results, you should make sure your test (in-sample
or out-of-sample) results in at least 30 trades per signal. Another good
approach is to test your neural model and strategy on different periods of
data.
Inspect the stock chart visually to make sure that market behavior during
the training period is not dramatically different from that during the test
period. For example, if your training period has only small sideway moves
but the test one represents a strong bull market, your model will not be
307
able to provide good signals during the walk-forward test period as it
wasnot trained to respond correctly to such market situations.
To increase confidence in the system’s profitability, you should also test it
against other stocks of the same market type. Most likely, the system will
not perform as good as with the stock for which the neural model was
designed since neural network tends to learn patterns specific for the stock
it was trained against. However, in any case you should achieve tolerable
results with other similar symbols.
Preventing Curve-Fitting
Curve-fitting is a dangerous shortcoming caused by a neural network’s
over-training. When a network is over-trained, it doesn't "learn" price
patterns or develop the ability to generalize, but simply memorizes
historical price data or, in other words, fits its output to the price curve
without learning any internal dependencies.
An over-trained network can produce good results with a training set, but
performs unexpectedly badly when used with new data.
Tradecision employs a special algorithm to identify a clear trend of
over-training. It monitors the validation error dynamics and training
progress from different points of view.
308
Inserting Model Signals into a Chart
You can display the signals generated by a model-based strategy on the
corresponding chart. Thus, you can see exactly where the trades occurred,
at what price, with what profit/loss, run-up and drawdown. You can insert
signals generated during the training or test period. For analyzing realworld model performance, we recommend that you use only the test
period signals.
To insert model-based strategy signals into a chart:
1. Open Model Builder.
2. From the Model List, select the model whose signals you want to
insert.
3. On the toolbar, click Insert and select Training range or Test range.
309
Price Forecasting
To insert a forecasted price into a chart:
1. On the Model Builder toolbar, click Insert and then select Forecasted
Price.
A line will appear in the chart. Now you can see the forecasted direction of
the price.
310
Inserting the Model Output into a Strategy
To insert the model output into a strategy:
1. On the Model Builder toolbar, click Create Neuro Strategy.
The NeuroStrategy dialog box will be displayed, providing model output in
the form of the newly created strategy’s entry and exit rules.
311
Saving a Model Output as.csv file
You can save your Model Output (forecasts) as.csv file. You can use this
possibility to feed model output to other software for analysis or import it
into Tradecision as a Custom Time Series and use in Improvian Editor to
build indicators, systems, studies and neural models.
To save a Model Output as.csv file:
1. In the Model Builder dialog box, click Save Model Output to CSV
File.
2. Locate the folder into which you want to save the file on your hard
drive.
3. Click OK.
To view the Forecasted Price column in a CSV file:
1. On the Model Builder toolbar, click Save Model Output to CSV File.
2. View the Forecasted Price column in the saved file.
312
Import/Export
With the easy-to-use Import/Export tools, you can manage your ideas
more effectively. You can easily exchange any of your trading ideas with
your friends.
The custom indicators, trading systems, studies and models that you
created and saved on your local hard drive can be easily imported,
exported and sent by e-mail.
Importing a Neural Model
To import a Neuro-Model:
1. In the Model Builder dialog box, click Import/Export Selected Model
and then select Import Models.
The Import – Models dialog box is displayed.
2. In the Import – Models dialog box, click the button to browse for the
folder that you want to import the models from on your local hard drive.
3. Choose the models that you want to import by selecting the
appropriate check boxes.
4. Click Import.
All the imported models will be added to your Models List.
5. Click Close to close the Import – Models dialog box.
313
Exporting a Neural Model
To export a neural model:
1. In the Model Builder dialog box, click Import/Export Selected Model
select Export Models.
2. In the Export – Models dialog box, click the button to browse the folder
on your local hard drive where you want to export the models.
3. Choose the models that you want to export by selecting the
appropriate check-boxes.
4. Click Export.
The models will be saved in the folder you indicated with the extension
tml. Now you can send them by e-mail to your friends or partners.
He/she will need to use the Import command to work with them.
5. Click Close to close the Export – Models dialog box.
314
Chapter 15
Strategy Builder
Prior to helping you effectively use your trading account, Tradecision will
secure you against the perils of real trading by performing a precise and
realistic trading simulation. The application will inform you about the
future performance of your trading ideas, thus dramatically reducing the
risks involved. Tradecision introduces an entire rigorous and sound
methodology of evaluating the robustness of your trading system.
Understanding Trading Strategies
A trading strategy is an objective set of rules on when and how to enter
and exit positions. This set of rules should not vary subjectively from day
to day based on brokers’ recommendations, friends' tips or emotions, and,
therefore, can be tested using past data to understand objectively how
profitable, reliable and suitable to your trading style these rules are. First of
all, you need to formalize your own trading ideas or modify/improve wellknown ones. To do so, you need to define the conditions for your buy/sell
orders.
To define the entry/exit conditions, you can use the Improvian language,
offering more than 140 built-in functions, as well as the Improvian Editor,
designed to facilitate your rule creation process. If you are new to strategy
development, you can start with any of the 10 predefined strategies
supplied with Tradecision. All of them are based on well-known trading
ideas and can (or even should) be improved to suit your needs.
When your strategy is designed, you need to apply it to historical data to
find out whether or not you would have made money if you had traded
based on your strategy. The future behavior and profitability of your
strategy will be different from those used in the past, but the past
performance will give you a good idea about what is likely to occur in the
future.
Simulations Manager allows you to realistically simulate your strategy on
one or several stocks at once. Once the strategy is simulated, you can
analyze your strategy using the buy/sell signals placed on a chart. You can
also analyze the Strategy Performance Report that provides you with
detailed information on the strategy’s profitability, risk, time analysis and
more. Additionally, you can analyze the Trades report with over 10 ratios
for each your trade, as well as Equity and Drawdown curves.
Once you have determined the disadvantages of your trading system, you
can correct them and test the strategy again until you feel confident
enough about using the strategy to make future trading decisions.
315
Using Strategy Builder
Tradecision Strategy Builder allows designing, historically testing and
fine-tuning your trading strategies.
Strategy Builder is an easy-to-use tool for managing trading strategies. You
can create, edit, copy, and delete a strategy, insert a strategy into a chart,
and perform strategy simulations or optimization.
Strategy Builder contains a built-in point-and-click Money Management
Editor that enables easily creating stop-loss, trailing stop and profit target
rules, as well as allows you to use such sophisticated position sizing
techniques, as Optimal F, Kelly, Williams and Fixed Fractional Trades
approaches.
To launch Strategy Builder, from the Tools menu, select Strategy
Builder.
The Strategy Builder dialog box contains a toolbar with commands, a list of
your strategies and a pane that contains parameters for the selected
strategy.
To work with a strategy, you need to select it in the strategies list and click
the corresponding toolbar button. See the following chapters for detailed
instructions on using the Strategy Builder capabilities.
316
Creating a New Strategy
To create a new strategy:
1. In the Strategy Builder dialog box, click New...
The Properties tab of the Strategy dialog box will be displayed.
2. In the General Information area of the Properties tab, enter the
following information:
• Strategy name. Enter the name of the strategy(for example,
QQQ_Strategy);
• Description. Enter a description of the strategy being built.
3. In the Signals area, select your trading preferences by selecting the
corresponding option. The following options are available:
e Shorts and Longs;
e Only Shorts;
e Only Longs.
4. In the Stops area, select the Additional Rules Available option and
define manually your stop-loss and trailing stop rules.
317
5. Select the Only Money Management rules option to define your
stop-loss, trailing stop and profit target rules using the Tradecision pointand-click Money Management Editor.
6. In the Trade Price area, select the order execution price to enable
realistic trading simulation.
You can indicate that orders be executed at the Close of the current bar, at
the Open of the next bar or you can also define custom trade price and
delay separately for buy/cover and sell/short orders.
7. For Stop Loss and Trailing Stop orders to be executed immediately in
your stop rules, select the Execute stop orders without delay check box.
8.
Select the Allow Entry and Exit on the Same Bar, if required.
Note: This option should be selected if you want the strategy to check
whether its possible to exit the position on the same bar on which the
position was entered. In addition, the strategy will check whether it’s
possible to enter another, new position on the bar on which the previous
position was exited.
9. Click Money Management to define the position size and configure
its parameters.
10. Select the Entry/Exit Rules tab and define the rules for your trading
system.
Note: To define the rules, you need to click Edit in the Entry/Exit Rules tab and
use Improvian Editor and the Improvian language.
11. If you selected the Additional Rules Available option during Step 7
of his procedure, select the Stop Rules tab and define your stop-loss and
trailing stop rules.
12. Click OK.
A new strategy will be created and stored into Strategy Builder. Now you
can insert it into a chart, run a simulation for several securities or optimize
it.
318
Creating a New Neural Strategy
A neural strategy is a strategy whose rules are based on neural model
predictions. Neural strategy can be created only for one symbol.
Note: Before creating a new neural strategy, you need to create an appropriate neural
model for the symbol. A new neural model can be easily created using the New Model
wizard.
To create a new neural strategy:
1. In the Strategy Builder dialog box, click the New Strategy.
The Symbol List dialog box will be displayed.
2. From the Symbols list in the Symbol List dialog box, select a symbol.
Note: To perform a search for the required symbol, use the filtering functionality in the
Filter area of the box. The system enables searching for symbols by Category and
Exchange.
3. Click OK.
319
The NeuroStrategy dialog box will be displayed.
4. In the Parameters tab of the NeuroStrategy dialog box, select the strategy
name, description and parameters. For details, refer to Creating a New
Strategy.
6. To define each rule, select the Entry/Exit Rules tab and then click Edit.
7. Open Improvian Editor.
320
In the Categories list a new function category named Models will be
displayed. The category will contain all models created for the strategy
symbol.
8. Select the model that you want to use and click Insert.
The name of the model will be inserted into the Expression box and can
be used as a function name for the conditions that you want to define.
9. Click OK.
A new neural strategy will be created and stored into Strategy Builder.
Now you can insert it into a chart, run a simulation for the corresponding
symbol or optimize it.Selecting Order Type
321
Understanding Order Types of Trading Strategies
Tradecision enables you to control the way you enter or exit the market
when you are developing a trading strategy. Using orders you can back-test
your trading strategies with a high degree of approximation to real trading.
The Market Order
A buy or sell order in which the broker is to execute the order at the best
price currently available. The market order is the most frequently used
order. It is a good order to use after you have made a decision about
opening or closing a position. The market order is executed at the best
possible price obtainable at the time the order reaches the trading pit.
The Limit Order
An order to buy a particular quantity of a security at or below a specified
price or to sell it at or above a specified price (called the limit price) sent to
a broker. This ensures that the buyer will never pay more for the stock
than whatever price is set as his/her limit. This order is one of the two
most common types of orders, the other being a market order. It is
opposite to the no limit order.
Stop Orders
Stop orders can be used for the following purposes:
•
•
•
To decrease a loss on a long or short position;
To protect a profit on an existing long or short position;
To initiate a new long or short position.
A buy stop order is placed above the market and a sell stop order is placed
below the market. After the stop price is reached, the order is treated as a
market order and will be filled at the best possible price.
Stop Limit Orders
A stop limit order is a stop order that becomes a limit order if and when
the market reaches a designated price.
322
Selecting an Order for a Strategy
To select an order for a strategy:
1. In the Strategy Builder dialog box, click New...
The Properties tab of the Strategy dialog box will be displayed
2. From the Entry/Exit Rules tab of the Strategy dialog box, select the type
of order that you want to use in your trading strategy. The following
options are available:
•
•
•
•
Market;
Limit;
Stop;
Stop-Limit.
3. To define your Limit and Stop-Limit, from the Expiration list, select
the appropriate period. . The following options are available:
• Good Until Cancelled;
• Good For Day.
Note: A Good Until Cancelled order to expire at the end of a specified future date.
A "Day Only" order will expire at the end of the current trading day.
323
2. To specify the limit price and stop price, click Edit next to the Limit
Price and Stop Price boxes.
Limit price is the price specified in a limit order.
Stop price is the price specified in a stop order.
324
Inserting a Strategy into a Chart
In Tradecision, any strategy can be inserted into the active chart with one
click.
1. Open Strategy Builder.
2. In the Strategy Builder dialog box, select the strategy that you want to
insert.
3. On the Strategy Builder toolbar, click Apply Strategy and from the
Apply Strategy menu select the destination where you want the strategy
to be inserted. The following options are available:
e To Current Chart
e To Open Charts
e To Current Chart from Date
If you have selected To Current Chart from Date, the Apply Strategy From
Date dialog box is displayed.
4. In the Apply Strategy From Date dialog box, next to Form Date, select
the required date and time and click OK.
A strategy simulation will be automatically created and run. After the
simulation is completed, a notification message will be displayed. Click
OK.
5. In the Strategy Builder dialog box, click Close.
Now you see the strategy signals on the chart(s).
325
Note: If you switch from daily to weekly or monthly bars, strategy signals will be
regenerated automatically. Additionally, if you download or import any new price data
in Data Manager, your chart will be automatically updated and new signals will be
generated for the new data.
326
Forward Looking Status
A strategy must be forward-looking to be used for back testing. Strategy
Builder shows the Forward Looking status for strategies.
When the Apply Strategy command is used, a strategy starts being
executed and calling the “future” data is tracked during the calculation. If
the strategy appears to be forward-looking, its status is set to Yes, if it
doesn’t, the strategy’s status is set to No.
This may be happening due to the following reasons:
1. In the rules of the strategy price data for the current bar is used, but
entry into/exit of the position take place before all the price data becomes
known.
2. Future data is called using a backslash, for example, close\-1\
3. "Forward-looking" functions are used, such as ElliottWavesInter(),
AutoTrendInter().
Recommended actions:
1. Set the bars delay or trade price parameter in Next Bar Open.
2. Remove operators that use forward-looking data from the strategy.
327
Editing a Strategy
You can modify a strategy any time.
To edit a strategy:
1. In the Strategy Builder dialog box, select the strategy that you want to
modify.
2. Click Edit.
The Strategy dialog box will be displayed.
3. In the Properties tab of the Strategy dialog box, modify the required
parameters
–AND/OR –
select the Entry/Exit Rules tab, click Edit and edit the strategy rules as
appropriate.
4. Click OK.
328
Copying a Strategy
If you plan to create a strategy that is similar to an already existing one, you
can save your time using the Copy command.
To copy a strategy:
1. In the Strategy Builder dialog box, click Copy.
The Strategy dialog box will be displayed.
2. In the Name box of the Properties tab, change the name of the strategy.
3. Change other parameters and strategy rules as appropriate.
4. Click OK.
A new strategy will be created and added to the Strategy List.
Now you can insert it into a chart, run a simulation for several securities or
optimize it.
329
Deleting a Strategy
To delete a strategy from Strategy Builder:
1. In the Strategy Builder dialog box, select the strategy that you want to
delete.
2. Click Remove Strategy.
A confirmation dilog box will be displayed.
3. In the confirmation dialog box, click Yes.
The strategy will be deleted.
330
Importing and Exporting a Strategy
All the custom indicators, trading systems, studies and models that you
have created and saved on your local hard drive can be easily imported,
exported and sent by email.
Importing Strategies
To import strategies:
1. In the Strategy Builder dialog box, click Import/Export, and then
select Import Strategies.
The Import – Strategies dialog box will be displayed.
2. In the Import – Strategies dialog box, click the button to browse for the
folder on your local hard drive from which you want to import the
strategies.
3. Choose the strategies that you want to import by selecting the
corresponding check-boxes.
4. Click Import. All the imported strategies will be added to your
Strategy List.
5. Click Close to close the Import – Strategies dialog box.
Exporting Strategies
To export strategies:
• In the Strategy Builder dialog box, click Import/Export, and then
select Export Strategies.
The Export – Strategies dialog box will be displayed.
2. In the Export – Strategies dialog box, click the button to browse for the
folder on your local hard drive to which you want to export the strategies.
3. Choose the strategies that you want to export by selecting the
corresponding check-boxes.
4. Click Export.
The strategies will be saved to the selected folder with the extension.tsg.
Now you can send them by email to your friends or partners. The recipient
will need to use the Import command to work with them.
5. Click Close to close the Export – Strategies dialog box.
331
Money Management
Money management is the most important part of successful trading and
Tradecision gives it the topmost priority.
Understanding Money Management
When you are setting up a trade, it is essential to predetermine the amount
of risk you are incidentally willing to take.
This means that you have to be able to control your position size, stop loss
and profit target yet before you enter the market! That is why, the
conditions for closing out (exiting) a trade are a lot more important than
the entry conditions.
Taking the right approach to money management, never results in losing
one's account.
For your convenience, the most popular money management rules are
predefined and easily accessible through an advanced point-and-click
editor. The editor enables the following types of money-management
operations:
•
Automatic calculation of the position size using Optimal F, Kelly, Fixed
Fractional Trades and William formulas;
•
Easy application of several stop-loss rules which only requires a couple of
clicks;
•
Easy definition of the trailing stop rule as a combination of predefined
conditions;
•
The system also supports using a predefined Profit Target and defining a
custom Position size formula
To test your money management rules, you can define them in Improvian,
a full-featured programming language. The New Strategy dialog box
provides special features for entering and editing your stop-loss, trailing
stop, and profit target rules. The same rules can cover long and short
trades, or you can also create separate rules for this purpose.
332
Money Management Editor
Money Management Editor will allow you to use and customize the most
well-know stop-loss, trailing stop and profit target rules without the need
to encode them using the Improvian language. Money Management Editor
will enable you to define your position size and trade execution options,
such as position size, commission, slippage and margin.
333
General
In the Initial capital box, you can enter the amount of the starting capital
that has been selected for testing the current system.
Select the Increase account to meet position size requirements check
box, if you want to proceed with strategy simulation even if your initial
account is not sufficient to enter a position with the required position size.
Clear this check box to automatically decrease the position size according
to the amount of money left in the account.
In the Minimum lot size box, you can enter the minimum number of
contracts/shares that must comprise the transaction.
If you buy or sell on leverage, and you want the system to be tested taking
into consideration the margin requirements, you need to specify the
Margin parameter.
It is specified in USD per unit (contract) or as percentage per unit (the
same as % per transaction). When trading on margin, you must make a
good faith deposit called a margin, as well as have enough funds in your
account to pay off all equity drawdowns. The Margin is the dollar amount
that you pay as margin for each contract. The Margin can also be specified
as a percentage of the account amount that you need to deposit to
purchase securities on credit.
334
Select the Separate stop and profit target rules for longs and chorts
check box to define separate stop-loss, trailing stop and profit target rules
for longs and shorts.
Commission
Commission is the amount you pay your broker per unit (share/contract)
or transaction. You can specify commission as a dollar amount per unit, or
as percentage or dollar amount per transaction.
Tradecision charges the commission once per transaction (an entry/exit
combination).
You can define the commission as a dollar amount per unit only if your
position size is defined in units. In this case, Tradecision multiplies the
position size (in units) by the commission per unit to derive the
commission for a transaction.
For stocks, we recommend that you opt for the commission-pertransaction option and enter the total commission amount that your
broker charges for both entering and exiting the market. For futures, we
recommend that you use the commission-per-unit option and enter the
commission amount for a single futures contract.
335
Slippage
Slippage is the difference between the price specified by the criteria of your
strategy (the estimated price during a trading simulation) and the actual
trading price you pay. The difference can be caused by slowness of your
broker who may not be able to fill your order at the desired price.
Tradecision records all trades using the price specified by the criteria of
your trading strategy. To simulate the effect of negative slippage,
Tradecision can adjust the profit and loss figures using the slippage
parameter.
You can specify slippage as a dollar amount per unit, as percentage or as a
dollar amount per transaction. Tradecision charges the slippage amount
once fper transaction (an entry/exit combination).
You can define the slippage as a dollar amount per unit only if your
Position size is defined in units. In this case, Tradecision multiplies the
position size (in units) by the slippage amount per unit to derive the
slippage for a transaction.
336
Position Size
The Position size settings are used to define how many units
(shares/contracts) are to be traded for each transaction.
You can specify the Position size in units, dollars or as percentage of the
available equity (initial capital). You can also opt to calculate the position
size dynamically using one of the four available formulas.
For stocks, we recommend that you opt for the the position- size-indollar-amount option and enter the dollar amount per transaction.
For futures, we recommend that you define the position size in units and
enter the number of contracts per transaction.
If you want to trade depending on the available equity without investing
more or picking up your profits, specify the position size as percentage of
the available equity. For example, to invest the whole of the available
account you can select 100%. Using this option, if you make or lose some
amount on a transaction, the position size of your next position will be
bigger or smaller for the made or lost amount.
337
The following formulas are available for the dynamic calculation of
position size:
The Optimal F formula. This method of estimating the optimal risk
percentage has been improved by Raplh Vince. While Kelly's formula uses
only the average values from the past trades, Raplh Vince proposed to take
into account all the trades, solving the task of optimizing the relative end
capital TWR as a function of f.
The Kelly formula defines the optimal percentage of risk that should be
allowed to maximize the "usefulness" function presented as a logarithm of
the capital.
The Fixed Ratio formula. A common shortcoming of all those methods
that use a fixed fraction of the capital is that they either maximize the
capital growth without relation to risk (i.e., the optimal f) or minimize the
risk (i.e., no more than x% of the capital is risked). Trying to solve this
conflict, Ryan Jones concludes that the relation of the number of lots
traded to the capital growth required to increase the number of lots by one
(or the minimal increment) should be a constant.
Larry Williams formula. Larry Williams formula is a variation of the
fixed ratio method recommended by Larry Williams. The position size in
units/lots is calculated as:
% risk * Capital / (- Max_Drawdown) / 100.
The last free formulas require a minimum position size for their
calculation. You can enter it in the Minimum position size box.
If the Position size amount is not enough to buy at least one
share/contract, Tradecision will not generate any trades.
338
Using Custom Formula for Position Size
You can define your own formula for Position Size.
To write a custom formula for Position Size:
1. In the Position Size tab of the Money Management dialog box, select the
Custom Formula option.
2. From the list, select the Dollars, % of Account or Units.
3. Click Edit.
The Improvian Editor dialog will be displayed.
4. Write an expression and click OK.
5. In the Money Management dialog box, click OK.
339
Stop Loss
The Stop Loss parameters are used to easily define a combination of stoploss rules. To select a rule, select the corresponding check box and define
the rule parameters.
All rules are combined using the logical OR. In other words, an exit signal
will be generated if any of the conditions are met.
340
Trailing Stop
The Trailing Stop parameters are used to easily define a combination of
trailing stop rules. To select a rule, select the corresponding checkbox and
define the rule parameters.
All rules are combined using the logical OR. In other words an exit signal
will be generated if any of the conditions are met.
341
Profit Target
The Profit Target parameters are used to easily define a profit target rule.
To select a rule, select the corresponding option and define the rule
parameters. You can select only one profit target rule.
342
Strategy optimization (Professional Editions)
Understanding Strategy Optimization
Optimization is the process of performing multiple tests while varying the
parameters used in the strategy rules. The purpose of optimization is to
discover the most profitable settings for a rule when applied to a specific
security. Optimization is used to improve profitable trading ideas. It
should be used after a trading system has proven suitable for your risk
preferences and profit objectives. Do not use optimization to build a
strategy or turn a bad strategy into a good one.
You should find profitable trading ideas and/or build profitable neural
models. After that, you should test and improve them with several
securities until you can entrust your money to this strategy. And only then
you can use optimization to make sure that you are using the optimal
parameters for entry/exit conditions.
To find the optimal parameters, you need to replace the numeric constants
in the trading rules with optimization variables. You can use any name for
an optimization variable, but the variable must be preceded by the "#"
character. For example, if you want to find the optimal moving average
length, you must write "SMA(Close, #length) instead or SMA(Close, 14) in
your trading rule.
Additionally, you need to specify the range (minimum, maximum) and step
(increment) for each optimization variable.
Note: the more optimization variables you have and the more values have to be tested
for each variable, the longer the optimization process will take.
The optimization process can take seconds, minutes or hours depending
on the number of simulations being run. To reduce the time required for
optimization, you can either reduce the number of the optimization
parameters, or use Genetic Algorithms for the optimization.
In those cases, when you have multiple optimization variables and wide
search ranges, the Genetic Algorithms work much faster than the
exhaustive search, while remaining very robust.
After the optimization, you can view and analyze the Strategy Performance
Report and Trades Report - on each combination of values tested, as well
as the combination’s Equity and Drawdown curves. The best
combinations can be saved as separate strategies.
343
Understanding Optimization Algorithms
Your strategy parameters can be optimized using Genetic Algorithms
(GA) or exhaustive search.
Exhaustive search verifies all possible combinations of the optimized
parameters and is, therefore, sure to find the best possible solution.
However, the time required for conducting exhaustive search is
dramatically increased when the number of the parameters increases.
Exhaustive search should be used if you have only a few parameters and
small limits for them.
Genetic Algorithms are search algorithms based on the mechanics of
natural selection and natural genetics. They combine the survival of the
fittest rule with a structured yet randomized information exchange. The
method uses terms accepted in genetics, such as fitness, population,
generation, mutation, gene, and so on.
In contrast to random search methods (such as, for example, Monte Carlo)
genetic algorithms are not a simple random walk. These algorithms
efficiently use historical information to speculate on new search points
with expected improved performance. Their goal is forming or finding a
population of trading strategies that will have the best fitness level, or in
other words, the best optimization criteria values.
Genetic algorithms possess the best characteristics of the other
optimization methods, such as robustness and fast convergence, which
does not depend on any of the optimization criteria (for instance, on
smoothness).
Although genetic algorithms are much faster while searching a large
number of possible options, they are slower than exhaustive search as far
as a small search space is concerned.
344
Walk-Forward Testing (Strategy Builder)
Understanding Walk-Forward Testing
Tradecision does automatic walk-forward testing, which is significant in
that it gives you confidence in successfully trading with your optimized
strategy.
Most trading software applications do not provide this advanced feature,
which enables automatic generation of powerful tests.
With walk-forward testing, you can perform a strategy optimization by
defining the test date ranges that give you the power to select the stock
parts that you want to use for optimization and out-of-sample testing.
Testing a trading strategy against the data that was used to optimize the
trading system is referred to as in-sample testing.
Note: A trading system SHOULD NOT be tested only against in-sample data.
Testing that using data the system was not optimized against is referred to
as out-of-sample or walk-forward testing. The system parameters
(optimization variables) are frozen, and the system is then fed data it has
not seen before. A system SHOULD obviously be tested against out-ofsample data.
When walk-forward testing is done, a portion of the available price data is
not used. This portion is used for testing after the strategy optimization is
complete. Walk-forward testing represents a truer measure of system
performance in real-time trading.
In-sample testing results can only show that a trading system has the
potential to generate profits in walk-forward testing and, consequently, in
real-time trading too.
A system must be profitable with both in-sample and out-of-sample data
to be used in real-time trading.
For trustworthy testing results, you should make sure your test (in-sample
or out-of-sample) results in at least 30 trades per signal. Another good
approach is to test your strategy using different periods of data.
Inspect stock chart visually to be sure that market behavior during
optimization period is not dramatically different from the market during
walk-forward testing. For example, if your optimization period has only
small sideway moves but the test period represents a strong bull market,
your model will not be able to provide good signals during walk-forward
test period since it wasn't optimized to respond correctly to such market
situations.
To increase confidence in system profitability you should also test it
against other stocks of the same market type. Most likely, the system will
345
not perform as good as with the stock for which it was optimized, but in
any case you should get tolerable results with other similar symbols.
346
Strategy Optimization Wizard
The Strategy Optimization wizard will guide you step by step through the
optimization process.
Starting the Strategy Optimization wizard
To start the Strategy Optimization wizard:
1. To start the wizard in Strategy Builder, select the strategy that you
want to optimize and click Optimize.
Note: The selected strategy should contain optimization variables in its rules.
347
Step 1: Selecting Symbol
During this step, you need to select the security for which you want to run
the optimization.
The security that you want to optimize can be selected in the Symbols
area.
You can sort the Symbols table by name, description or category. To do
this, you need to right-click the corresponding column caption. You can
also use the filtering functionality in the Filter area of the window to
display only those symbols that belong to the selected category or
exchange. Alternatively, you can type the name of the symbol in the
Symbols box. The system will select the specified symbol from the list
and display it.
348
Step 2: Parameters to be Optimized
During this step you need to specify the search ranges for the optimization
variables in your rules.
In the upper section of the window, there are two tabs–, the Entry Long tab
and the Entry Short tab, – containing rules with the optimization variables
(such as Operiod1). To select a rule whose optimization variable you want
to edit, select the corresponding tab.
The Variable section of the window contains a table with the optimization
variables used in the selected rule.
The Variable Name column shows the variable that you are currently
editing.
In the Range From column, enter the minimum value for the
optimization variable.
In the To column, enter the maximum value for the optimization variable.
In the Step column, enter the step size by you want the optimization
variable to be incremented.
For example, if the minimum/maximum range is 4 to 10, and the step size
is 2, the optimization variable would be will be assigned with the values 4,
6, 8, and 10.
349
Step 3: Optimization Algorithm
During this step, you need to select the optimization algorithm and goal.
In the Algorithm area, select the algorithm you want to use for the
optimization:
The following options are available:
• Exhaustive search. The method tests all possible combinations of inputs
and selects the best combination.
Note: The method can be very time-consuming if you have a large amount of inputs
and a big dataset.
• Genetic algorithms. The method starts with a random population of
input configurations. Input configuration determines which of the inputs
are ignored during the performance test. During each of the following
steps (generations) input configuration uses a process that is similar to
natural selection to select superior configurations and use them to generate
a new population. Each step successively produces better input
configuration. At the last step the best configuration is selected. The
method is very time-consuming but good for determining mutuallyrequired inputs and detecting interdependencies.
The Genetic Algorithm parameters can be modified. To display the
Genetic Algorithm Parameters, click Advanced.
350
In the Categories area, select a category for the optimization goal. In the
Optimization Criteria area, select the optimization goal.
351
Genetic Algorithm Parameters
The Genetic Algorithm Parameters dialog box enables changing the
following parameters to improve the algorithm efficiency:
• Population Size. The number of potential configurations used during
each step of the algorithm. The larger the population, the greater is the
probability of finding a good configuration and the more time is required
to find this solution.
• Best population size. is the parameter is used to artificially preserve the
best solutions of the previous generation and protect them from mutations
or crossover in case nothing better is produced during the next iteration.
This has a ratchet effect that ensures that the GA will generate the desired
outcome since any move in the right direction is protected.
• Number of Generations. The number of the genetic algorithm’s steps.
Each generation is equal to the interval during which a new population is
created using crossover and mutation. Each new generation is produced by
modifying the previous generation with a view to selecting those inputs
that produced the best results. The larger the Number of Generations, the
bigger the probability of finding a good solution and the more time is
required to find this solution. Crossover is the process of creating a new
configuration from parts of its parents' configurations.
• Crossover Probability. The parameter indicates the probability of
crossover for each configuration during any given generation. The higher
the crossover rate is, the greater the possibility of convergence with a
similar set of children (configurations). A lower crossover rate requires a
larger number of generations to explore the search space better. Mutation
is the process of altering one ore more parts in the inputs configuration
(mask).
• Mutation Probability. The parameter specifies the probability of
mutation for each configuration of each new generation. The higher the
mutation rate is, the better the search possibilities of the algorithm and the
greater the possibility of good configurations’ being ruined are.
352
Selecting Additional Stopping Conditions for Genetic Algorithms
This capability can be very helpful when you use Genetic Algorithms as
your optimization method. You can use it to prevent excessive use of
valuable computer resources. The capability can be configured in the
Genetic Algorithms settings (in the Advanced Optimization Options dialog
box) when you are creating a Neural Model or Strategy.
This capability offers the two following options:
• Maximum Time … Minutes. The algorithm will be automatically
stopped after an indicated time.
• No improvement for … Iterations. The optimization process will be
stopped if the fitness of the best model/strategy after improved after a
specified number of iterations.
353
To define the additional stopping conditions for Genetic
Algorithms in Strategy Builder:
1. During the Step 3 of the Optimize Strategy wizard, click Advanced.
2. In the Additional Stopping Conditions area of the Advanced
Optimization Options dialog box, select the Maximum Time … Minutes
and/or No improvement for … Iterations check boxes and enter the
appropriate numbers in the corresponding text boxes.
3. Click OK.
To skip Step 4 of the wizard, you can select the Define data ranges
automatically check box. In this case, the data ranges used for model
training and testing will be selected using default settings. By default, 3000
bars will be used for strategy optimization without walk-forward testing.
354
Step 4: Optimization Data Ranges
During this step, you need to define how much data will be used for
strategy optimization. You can also allocate the portion of data to be used
for walk-forward testing manually.
To select the amount and position of the price data to
be used for model preparation:
1. In the Price data range group box, select the Use last radio button
and enter the amount of data you want to use. The specified amount can
be allocated from the end of available price.
2. Select the Custom date range radio-button to specify exactly the start
and the end date for the data used for model preparation. This option is
especially useful if you want to train or test the model on certain price
patterns.
3. Select the Use all available data to use all data available for the given
security.
The data that will be used for walk-forward testing will be allocated
automatically. The allocated range is displayed in the Walk-forward test
group box.
Note: Although it is not recommended, you can skip the walk-forward testing by
clearing the Walk-forward test check box.
355
To change the amount and position of price data used
for model walk-forward testing:
1. In the Walk-forward test area, click Change.
The Test Range dialog box is displayed.
2. In the Test Range dialog box, select the Use % of data from option to
specify the test period as a percentage of the data available for the
model’s preparation.
Note: The specified amount can be allocated at the beginning or at the end of the
available price data depending on which is selected by you from the corresponding list.
3. Select the Use last option to select the test period in bars, years,
months or weeks and enter the amount of data you want to use. The
specified amount will be allocated from the end of available price.
4. Select the Custom date range radio-button to specify exactly the start
and the end date for the data used for model preparation. This option is
especially useful if you want to train or test the model on certain price
patterns.
5. Click OK. The walk-forward data range will be re-allocated.
356
Step 5: Optimization Results
During this step, you can analyze the results of the optimization. The
wizard creates a set of reports for each combination of the optimization
variables.
The Strategy Performance area shows performance ratios for the most
profitable systems found during the test. To sort the table by any of the
ratios, click the heading of the corresponding column.
The table is sorted in descending order by the optimization goal specified
by you during the previous step. For example, if your optimization goal
was Net Profit, the most profitable system will be the first.
By default, the tables contain the top 20 systems. To increase or decrease
this number, enter a new value in the Show best box at the bottom of the
dialog box and click the green triangular button.
To save the selected system as a new strategy with hard-coded values
instead of the optimization variables, click Save. In the Strategy dialog box,
enter the name for the new strategy and click Ok. The strategy will be
saved in Strategy Builder.
To examine the performance of the selected system, click Analyze.
The Alyuda system will display the Strategy Performance dialog box. In the
Strategy Performance dialog box, you will be able to view the Strategy
357
Performance Report, Trades Report and Equity and Drawdown curves,
Profit Distribution, MAE/MFE, and Net Profit by Period.
358
Chapter 16
Integrated Trading
Tradecision supports Integrated Trading with Interactive Brokers, Man
Financial and TD AMERITRADE. Both modes, Direct Trade
Execution from a selected trading strategy and Manual Order Placement,
are supported by the application. To connect to another broker that is not
directly integrated with Tradecision, the Trading API can be used (Help
menu).
Direct Trade Execution (DTE)
The Direct Trade Execution mode allows making trades on the market
automatically. In this mode, the selected strategy sends buy/sell signals to
the broker. All the sent signals are stored into Trading History.
How DTE Works
When the DTE mode is activated, the streaming mode is automatically
activated.
Note: The streaming mode is activated automatically when DTE is activated.
DTE Mode for Several Symbols and Several Strategies
The initial account, commission, slippage and margin data in the DTE
mode are taken from the broker. That is why while testing a strategy or
while working with the broker, the strategy signals may differ if the values
of these parameters don’t coincide. Pay attention to the Money
Management parameters in Tradecision when working in the DTE mode.
The DTE mode of Tradecision does not guarantee the correct
performance of strategies if DTE is activated for several strategies and
symbols simultaneously. This is connected with the specifics of the initial
account functionality in Money Management (each strategy has its own
initial account).
359
Activating the DTE Mode
The DTE mode can be activated in the four following ways.
To start the regular DTE mode:
1. On the main Tradecision menu, click the Direct Trade Execution icon,
–ORSelect Tools> Direct Trade Execution.
To start the DTE mode for the last-used strategy:
1. On the main Tradecision menu, click the DTE With Last Strategy icon,
–ORSelect Tools> DTE With Last Strategy.
To start the DTE mode for the last-used strategy:
1. On the main Tradecision menu, click the DTE With Current Strategy
icon,
–ORSelect Tools> DTE With Current Strategy.
To start the DTE mode for the selected strategy:
1. At the bottom of the Strategy Builder window, click Start DTE.
360
361
DTE Mode Settings
The DTE mode settings are located in the Integrated Trading tab of the
Preferences window (Tools menu).
The Brokers area:
Select Broker. Sets the broker that handles the trade.
The Default Settings for Trading Toolbar area:
• Modify the Order Type (Market, Limit, Stop, StopLimit); Position and
TIF (Good Till Cancel, Good Till Day) as appropriate;
• Select the Show Order Confirmation to request user confirmation
before each transaction.
Note: TIF stands for Time in Force. TIF is used during the placement of a trade
to indicate for how long an order will remain active before it is executed or expires.
The Direct Trade Execution area:
• Show Order Confirmation. Requests user confirmation before each
transaction.
• Close All Positions after Trading is Stopped. Closes all open
positions when the DTE mode is deactivated.
362
Trading Toolbar
The system supports placing trades with a selected broker manually. This is
done using the Trading Toolbar at the bottom of the main Tradecision
window.
Placing Orders using the Trading Toolbar
To place an order manually from the Trading Toolbar:
1. On the Trading Toolbar at the bottom of the main Tradecision window,
select the parameters for the new order, such as Order type, Position,
Limit price, Stop price, and TIF.
2. Click Buy or Sell.
An order with the defined parameters will be sent to the selected broker (To
select a broker: Tools > Preferences > Integrated Trading tab > Brokers
> Select Brokers).
Selecting Parameters for an Order on the Trading Toolbar
There are a number of parameters that can be applied to an order:
e
e
e
e
e
Order Type. Market, Stop, Limit, Stop Limit;
Position. A number of units in the order;
Limit Price. Enter the limit price for Limit, Stop Limit;
Stop Price. Enter stop price for Stop, Stop Limit;
TIF. Time in force. Can be GTC (Good Till Cancel) or GTD (Good
Till Day).
Connecting to a Broker Using the Trading Toolbar
It is possible to connect to a selected broker using the Trading Toolbar.
To select a broker:
Select Tools > Preferences > Integrated Trading tab > Brokers >
Select Brokers).
To connect to a broker:
Click the Connect button on the Trading Toolbar.
After the connection is established, the Bid and Ask values of the current
chart will be shown on the toolbar.
363
Changing Settings for the Trading Toolbar
To modify settings for the Trading Toolbar:
1. From the Tools menu, select Preferences.
2. In the Preferences dialog box, select the Integrated Trading tab.
3. In the Default Settings for Trading Toolbar area, modify the Order
Type (Market, Limit, Stop, StopLimit); Position and TIF (Good Till
Cancel, Good Till Day) as appropriate.
4. Select the Show Order Confirmation option to to request user
confirmation before each transaction.
Note: TIF stands for Time in Force. TIF is used during the placement of a trade to
indicate for how long an order will remain active before it is executed or expires.
5. Click OK to save changes.
364
Removing the Trading Toolbar
If you do not need to use the Trading Toolbar regularly, you can remove it
from the Tradecision program window. To do this, right-click the main
toolbar and clear the Trading option in the list that will appear.
365
Trading History
The user can view the results of the past trades.
To view the results of the past trades:
1. From the main Tradecision window, select Tools>Trading
History.
The Trading History window is displayed.
DTE work sessions are displayed in the TradingHistory window. For each
of the sessions, the start time, end time, the name of the symbol, the name
of the strategy and the number of the generated signals are displayed.
2. To display the DTE sessions for a certain period of time, in the
Filter area at the top of the trading History window, select the
relevant period:
e
e
e
e
e
All
Today
Yesterday
Last 7 days
Last 30 days
The sessions that meet the selected period are displayed.
Note: The signals in the displayed session can be inserted into a chart. To insert
signals into a chart, select the required session and click Insert Signals.
366
Order Window
The Order Window allows you to monitor your order placement activities.
To open the Order Window:
From the Tools menu, select Order Window.
The Order Window has four tabs:
The Open Orders tab shows the list of open orders and their parameters.
To cancel an order(s), click the Cancel or Cancel All buttons at the
bottom of the Order Window.
The Executions tab shows the list of executed orders and their
parameters.
The History tab is a convenient way to review the history of all executed
orders. Click Clear History to clear the list.
The Portfolio tab shows the list of symbols with open positions. The tab
also shows the following information: Account Size, Realized
Profit/Loss, Unrealized Profit/Loss, and a number of open (Open
Orders) and executed (Executed Orders) orders.
367
Modifying Properties of Open Orders
You can easily modify properties of open orders.
To modify properties of open orders:
1. From the Tools menu, select Order Window.
2. In the Open Orders tab of the Order Window dialog box, select an order
and double-click it.
The Modify Order dialog box will be displayed.
3. In the Modify Order dialog box you can change the following
parameters: Order Type, Action, TIF, Position, Limit Price and
Stop Price.
4. Once you have selected the new parameters, click Modify.
Note: Some options of the Modify Order dialog box may be disabled as some of the
brokers do not allow modifying the available parameters.
368
Interactive Brokers Settings
To set the Interactive Brokers settings:
1. Go to the Tools menu, select Preferences, select the Integrated
Trading tab and then in the Brokers area select Interactive Brokers.
2. In the Interactive Brokers connection properties area, provide the
following information:
• Address. The address of the computer on which Interactive Brokers is
run; if Interactive Brokers is run on the same computer with
Tradecision, this box can be left empty.
• Post. The port number.
• Client ID. The numeric identifier of the customer. This parameter and
the parameter that performs its function in Data Manager must be
different for the application’s correct work.
369
Man Financial Settings
To set the Man Financial settings:
1. Go to the Tools menu, select Preferences, select the Integrated
Trading tab and then in the Brokers area select Man Financial.
2. In the Man Financial connection properties area, provide the
following information:
• Address and Port. Enter the address and port of the STAS server;
• Price Address and Price Port. Enter the address and port of the
SMDS server;
• Login. Enter user login;
• Password. Enter the user password;
• Account. Enter the account details.
3. To save the settings, in the Preferences dialog box, click OK.
370
To set the Man Financial Settings in Data Manager:
1.
2.
3.
4.
Open Data Manager.
Go to the Tools menu.
From the Tools menu, select Preferences > the Man Financial tab.
Enter the following connection parameters:
• Address and Port. Enter the address and port of the STAS server;
• Price Address and Price Port. Enter the address and port of the
SMDS server;
• Login. Enter the user login;
• Password. Enter the user password.
• Account. Enter the account details.
5. Click OK.
371
TD AMERITRADE Settings
To set the TD AMERITRADE settings:
1. Go to the Tools menu, select Preferences, select the Integrated
Trading tab and then in the Brokers area select TD AMERITRADE.
2. In the TD AMERITRADE connection properties area, provide the
following information:
• Login. Enter user login;
• Password. Enter the user password.
372
Chapter 17
Simulation Manager
Simulation Manager enables easily creating, running and storing any
number of simulations. Simulations are stored into an express simulations
list that can be quickly categorized or filtered. Any stored simulation can
be inserted into a chart or analyzed with one click.
Understanding Simulations
Strategy analysis is a vital stage of the strategy development process. When
you insert your strategy into an active chart, a new simulation is
automatically created and all performance reports are generated and stored
in the Simulations Manager. This is the fastest way to simulate and analyze
a strategy.
Tradecision provides advanced simulation capabilities, specifically designed
to help professional traders easily identify the advantages and
disadvantages of a strategy.
With the New Simulation wizard, you can simulate one strategy with
different symbols concurrently. Moreover, within one run of just one
simulation you can back-test several strategies with one symbol. In both
cases, you can easily compare the results. All this means that your strategy
analysis will be a lot more efficient.
373
Working with Simulation Manager
Tradecision Simulation Manager allows you to create and manage
strategy simulations. You can create, run, insert into a chart, delete and
thoroughly analyze a simulation.
To access Simulation Manager:
1. From the Tools menu, select Simulation Manager.
Simulation Manager can also be launched by clicking the tool button on
the main Tradecision toolbar.
The Simulations dialog box contains a toolbar with commands, a list of
your simulations, a list of the available reports for each simulation and the
performance reports pane, displaying a selected report.
To work with a simulation, select it in the simulations list and click the
appropriate toolbar button.
374
Creating a New simulation (the New Simulation wizard)
The New Simulation wizard will guide you through the process of creating
a new simulation.
Starting the New Simulation wizard:
To start the wizard in Simulation Manager, click New.
The wizard has three steps:
Step 1: General Information
Step 2: Symbols
Step 3: Strategies
375
Step 1: General Information
During step you need to define the name of the simulation, its type the
period of time it will span and provide a description of the simulation.
In the Name box, you can change the automatically generated model
name to a more descriptive one. The name of the simulation must be
unique among those of the stored simulations.
In the Description box, you can enter a description of this simulation that
will later help you distinguish this simulation from similar ones created for
the same stock or strategy.
In the Simulation Type area, you can select the Run one strategy on
several symbols option if you want to run the strategy simulation on one
or several stocks or the Run several strategies on single symbol option
if you want to run one strategy with several stocks.
In the Simulation Period area, you can define how much data will be
used for the simulation.
Select the Last option to define the simulation period in bars. Enter the
amount of data that you want to use in the box. The specified amount can
be allocated from the end of the available price data.
Select the From option to specify exactly the start and the end date of the
simulation period. This option is especially useful if you want to test a
strategy on specific price patterns.
376
Step 2: Symbols
During this step, you need to select a symbol or symbols for the
simulation.
If during the previous step you selected the Run one strategy on several
symbols option, you can select one or several symbols using the blue
arrow buttons. The selected symbols will appear in the Selected symbols
area.
If during the previous step you selected the Run several strategies on a
single symbol option, you can select only one symbol with a mouse click
or using arrow keys of the keyboard. Alternatively, you can type the name
of the symbol in the Symbols box.
While selecting symbols, you can sort the Symbols table by name,
description or category by right-clicking the column captions. You can also
use the filtering functionality in the Filter area to display only those
symbols that belong to the selected category or exchange.
377
Step 3: Strategies
During this step, you need to select a strategy or strategies for the
simulation.
If during the Step 1 you selected the Run one strategy on several
symbols option, you can select only one strategy with a mouse click or
using the arrow keys of the keyboard. Alternatively, you can type the name
of the strategy in the Strategies edit box.
If during the previous step you selected the Run several strategies on a
single symbol option, you can select one or several strategies using the
blue arrow buttons. The selected symbols will appear in the Selected
strategies area.
To finish the process, click Finish.
The new simulation will be added to your simulations list. The following
message will be displayed.
378
Analyzing a Simulation
To analyze a simulation:
1. From the Simulations pane in the Simulations dialog box, select a
simulation that you want to analyze.
2. If the simulation contains several symbols or strategies, select the
appropriate report from the Simulation Reports list.
3. View Strategy Performance, Trades, Equity, Profit Distribution,
MAE/MFE or Net Profit by Period tabs by selecting them on the
toolbar to analyze the simulation.
379
Summary Report
When you are testing a system against a group of stocks, you can view the
overall system performance against all the stocks. Consequently, you will
know the total number of trades and winners against the entire basket of
stocks to which your trading system has been applied.
To analyze a Summary Report:
1. After you have run a simulation, in the Simulation area, select a
simulation and then select Summary in the Simulation Reports area. .
380
Profit Distribution
To analyze Profit Distribution:
1. In the Simulations dialog box, select a simulation and then go to the
Profit Distribution tab.
2. From the list the upper left corner of the Simulations dialog box, select
Dollars or Percentage.
381
MAE/MFE
Maximum Favorable Excursion (MFE), a theory created by J. Sweeney
to evaluate the distinctive characteristics of profitable trades, can be used
to determine the greatest profit a trade had brought in before it closed.
Analyzing the performance of a trading system allows us to measure the
tendency of of the trades’ MFE.
MFE can be used as part of your analytical process to allow traders to
differentiate between average trades and those that have substantially
greater profit potential. Using MFE, analysis traders can categorize aboveaverage performance during a trade and thus identify new opportunities to
enhance profitability using the MFE risk management strategy.
Maximum Adverse Excursion (MAE) indicates the greatest loss a trade
caused before it closed. The MAE is statistical data provided as a result of
backtesting of a trading system.
Although a trading system may seem practical, a particularly large MAE
may signal that it would not, actually, work in practice because the MAE
will be too big for the proposed account size, perhaps eliciting a margin
call that will render the back-test results inaccurate and misleading.
382
Analyzing MFE and MAE
Analytical MFE and MAE information on a simulation can be analyzed in
the MAE/MFE tab of the Simulations dialog box.
To analyze Maximum Favorable Excursion (MFE) and
Maximum Adverse Excursion (MAE):
1. In the Simulations dialog box, select a simulation and then select the
MAE/MFE tab.
Analyzing MAE/MFE graphs:
X-axis shows MAE/MFE values.
Y-axis shows a number of trades for every MAE/MFE.
383
Analyzing Net Profit by Period
To analyze net profit by period:
1. In the Simulations dialog box, select a simulation and select the Net
Profit by Period tab.
2. To define the period for which the profit is evaluated, from the Select
Period list, select the appropriate value. The following options are
available:
e
e
e
e
e
e
Hourly
Daily
Weekly
Monthly
Quarterly.
Annually
The Net Profit by Period tab displays the required information in two
separate charts: Return and Return Distribution.
The Return chart – shows Net Profit for each period. The number of
columns is equal to the number of periods in the overall period of time the
simulation has spanned. The blue color means positive profit and the red
color means negative profit. The date/time is along the X axis; Net Profit
is along the Y axis.
The Return Distribution chart - shows profit distribution, i.e. the
number of deals that have yielded some profit. The bar with the "0" index
shows the number of deals with Profit from 0 to 100. This bar can be
hidden by selecting the Don't show zero bar Check-box. The blue color
means positive profit and the red color means negative profit. The size of
384
the profit is along the X axis; the number of deals that correspond to this
profit is along the Y axis.
385
Inserting Simulation Signals into a Chart
To insert simulation signals into a chart:
1. From the Simulations pane in the Simulations dialog box, select the
simulation that you want to insert into a chart.
2. In the toolbar, click Insert Signals and select the strategy and chart into
which you want to insert the signals.
386
Grouping and Filtering Simulations
To group or filter simulations in the Simulations pane:
1. In the Group by area, select the Symbol or Strategies option to
group simulations by symbol or by strategy.
2. Additionally, you can type one or several characters in the box to show
only those symbols and strategies whose names contain the specified
characters.
3. Click Apply to apply the defined filter.
387
Viewing simulation Information
To view simulation parameters:
1. On the Simulations Manager toolbar, click the Info button.
The following parameters will be displayed:
Name, Description, Simulation Period, Date/Time Created,
Date/Time Last Run, Simulation Symbols and Strategies.
Note: The displayed parameters cannot be edited.
2. Click Close.
388
Running Simulation
To run a simulation on a chart:
1. In the Simulations pane select the simulation that you want to run.
2. On the toolbar, click Run. A message box will be displayed upon
completion.
3. Click OK.
Now you can analyze the simulation. Also see Analyzing Simulation.
Deleting a Simulation
To delete a simulation:
1. In the Simulations pane, select the simulation that you want to
remove.
2. Click Delete.
The simulation will be deleted.
389
Saving Simulation Reports in the CSV (Excel) format.
You can save a Strategy Performance Report and Trades Report on a
specific simulation to further analyze the figures in Excel or some other
3rd party software.
To save the simulation reports as.csv file:
1. In the Simulations dialog box, select a simulation the reports on which
you want to export.
2. Click Save as CSV and then select Reports.
The corresponding Strategy Performance Report and Trades Report will
be saved to the Tradecision catalog of the CSV Reports folder on your
local hard drive.
390
Saving Strategy Signals in the CSV (Excel) Format
You can save strategy signals in a separate file to export them to a 3rd
party software or use them as a custom time-series.
To save the simulation (strategy) signals as.csv file:
1. In the Simulations dialog box, select a simulation whose signals you want
to export.
2. Click Save as CSV and then select Strategy Signals.
The strategy signals will be saved to the Tradecision catalog of the
Reports folder on your local hard drive
Note: The CSV file will contain three columns: date, simulation signal as a text, and
simulation signal as a numeric identifier.
391
The Equity Curve Indicator
Understanding Equity Curve
The equity curve is an essential factor to be considered before making a
trade decision. It shows — in the graph form — how much you would
have profited or lost with a specific trading system, and how occasional
and/or stable your wins have been.
A smooth, even upward curve is ideal. It indicates that the current
characteristics of a stock are in keeping with the applied system.
Plotting Equity Curve on a Chart
Simulation Manager enables plotting Equity Curve as an indicator on a
chart.
To place Equity Curve on a chart:
1. From the Tools menu, select Simulation Manager and then click
Equity Curve.
2. From the short-cut menu, you can select Longs and Shorts –
Current Chart, Longs – Current Chart, Shorts – Current Chart (or the
same for all charts), depending on which one you want to place on a chart
as indicator.
392
Analyzing Strategy Performance
Simulation Manager is a powerful report generator that allows you to gain
insight into your trading strategies.
Strategy Performance Report
The Strategy Performance Report helps you in analyzing your strategies
and estimating their suitability to your trading style and risk preferences.
The report provides over 100 performance parameters you can use to
analyze a strategy.
The Performance Report contains the following seven sections:
•
•
•
•
•
•
•
Summary;
Trades;
Return;
Risk;
Drawdown and Run-up;
Outlier Trades;
Time Analysis.
393
Summary
Detailed statistical information on a summary can be viewed in the Strategy
Performance tab of the Strategy Performance Report.
• Net Profit. The amount of money that was made or lost trading based on
the selected strategy.
• Return on Initial Capital. A percentage of the profit or loss the system
generated based on its initial equity.
• Gross Profit. The total amount of equity earned during all the profitable
trades .
• Gross Loss. The total amount of equity lost during all the losing trades.
• Profit/Loss. The dollar amount a strategy has earned against the dollar
amount it lost. Profit/Loss is calculated by dividing gross profit into gross
loss.
• Commissions paid. The amount of commissions paid to execute all
generated trades.
Account Size Required. The amount of money you are to have in your
account to trade the system. Account Size Required must be used only for
those systems that trade futures contracts. It is the main parameter for
calculating the Return on Account value.
The Account Size Required is calculated using the following formula:
Max Drawdown + (Margin x Number of Units), where Margin and
394
Number of Units are taken from the Position settings in the Strategy
dialog box.
Return on account. A percentage of profit or loss the system has
generated based on its Account Size Required. The parameter is
calculated by dividing the Net Profit into the Account Size Required.
This value is more important than the Net Profit value when you buy or
sell on margin.
395
Trades
• Total number of trades. The total number of trades that were generated
by the strategy.
• Number of profitable trades. The amount of profitable trades generated
by the strategy.
• Number of losing trades. The amount of losing trades generated by the
strategy.
• % of profitable trades. The percentage of profitable trades generated by
the strategy.
• % of losing trades. The percentage of losing trades generated by the
strategy.
• Largest profitable trade. The amount earned from the largest profitable
trade.
• Largest losing trade. The amount lost during the biggest losing trade.
• Average profitable trade. The average amount earned by one profitable
trade.
• Average losing trade. The average amount lost by one losing trade.
• Average ratio. A trade effectiveness ratio, calculated as the average
profitable trade divided into the average losing trade.
• Average trade. A trade effectiveness ratio, represent the expected gain
from each trade. It is calculated as follows: (% of profitable trades) *
(average profitable trade) – (% of loosing trade * average losing trade).
• Max consequent profitable trades.
• Max consequent losing trades.
• Average days in profitable trades.
• Average days in losing trades.
• Maximum number of days in profitable trade.
• Maximum number of days in losing trade.
396
Return
• Initial Capital. The amount of starting capital selected to test the current
system.
• Final Capital. The amount of the capital that exists at the end of the
specified period.
• Return on Initial Capital. A percentage of the profit or loss the system
generated based on its initial capital.
• Cumulative return. A percentage of the profit or loss calculated as the
amount of money you made divided into the amount of money invested
in the first trade.
• Return on Max Drawdown. The Net Profit divided into the maximum
drawdown of the current strategy.
• Buy & Hold return. The percentage difference between the initial equity
and the final equity in the buy and hold strategy. The buy and hold
strategy assumes that you buy on the first day set in your model and hold
the position. The profit is calculated based on the price on the first day
and the price on the last day of the trading period.
• Annual rate of return. The annual rate of return for the whole period.
• Buy & Hold annual rate of return. The annual rate of return achieved
for the same period using the buy and hold strategy.
397
Risk
Gain to Pain Ratio. A reward/risk ratio, calculated as the average annual
profit divided into the average annual equity dip. For example, if the Gain
to Pain ratio is equal to 3, the average annual profit is three times bigger
than the average equity dip measured from the previous equity peak. The
higher the ratio, the better the strategy is.
Sharpe Ratio. A reward/risk ratio calculated as a measure of an account
return relative to the total variability of the account. The Sharpe ratio uses
account standard deviation as the measure of risk. The higher the ratio, the
better the strategy is.
Return Retracement Ratio. A reward/risk ratio that, unlike the Sharpe
ratio, distinguishes upside and downside return fluctuations. The higher
the ratio, the better the strategy is.
Max Equity Drawdown. A risk ratio, calculated as a percentage of the
maximum equity dip from the previous equity peak. The lower the ratio,
the better the strategy is.
Net Profit / Largest Losing Trade. A reward/risk ratio, calculated as
the net profit divided into the maximum loss. The higher the ratio, the
better the strategy is.
Net Profit / Max Drawdown. A reward/risk ratio, calculated as the net
profit divided into the maximum drawdown. The higher the ratio, the
better the strategy is.
398
Drawdown and Run-up
Max Drawdown. The largest equity dip the system has undergone within
a single trade. Drawdown measures the open to the lowest (highest)
unrealized low (high) of the trade.
Average Drawdown. The average equity dip of all the trades. This
amount represents the system’s more probable behavior compared to the
maximum drawdown.
Max Run-up. The largest profit potential (realized or unrealized)
experienced by the system on a single trade. Run-up measures the open to
the highest (lowest) high (low) of the trade.
Average Run-up. The average maximum profit potential of all the trades.
This amount represents the system's more probable behavior than the
maximum run-up.
399
Outlier Trades
Positive outlier trades. The number of trades and cumulative profit/loss
for positive outlier trades. Positive outlier trades are trades that are three
standard deviations bigger than the average trade..
Negative outlier trades. The number of trades and cumulative
profit/loss for negative outlier trades. Negative outlier trades are trades
that are three standard deviations lower than the average trade..
Total outlier trades. The number of trades and cumulative profit/loss for
all outlier trades.
400
Time Analysis
Trading period. The trading period in years, months, weeks and days
from the start date to the end date.
Bars in the market. The number of days during which the strategy had
open positions.
% in the market. The percentage of the test period during which the
strategy had open positions.
Bars out of the market. The largest number of bars during which the
strategy did not have any open positions.
Average time in trades. The average number of bars in
profitable/losing/all trades.
Average time between trades. The average number of bars between
profitable/losing/all trades.
401
Trades Report
Trades Report displays details on the trades generated by a strategy during
the test period.
For each trade, the report displays the following values:
• Trade. The consecutive number of the trade.
• Position. The position type, indicating whether the position was long or
short.
• Entry Date. The entry date of the trade.
• Exit Date. The exit date of the trade.
• Entry Signal. The entry strategy signal: Buy or Short.
• Exit Signal. The exit strategy signal: Sell, Cover, Stop-Loss, Trailing Stop
or Last Bar.
• # of units. The number of shares/contracts traded.
• Entry Price. The security’s price when the position was opened.
• Exit Price. The security’s price when the position was closed.
• Commission. The amount of money that was paid in commissions for
this trade.
• Slippage. The amount of money that was lost on this trade due to
slippage.
• Profit/loss. The profit/loss for this trade.
402
• Profit/loss %. The profit/loss for this trade expressed as percentage.
• Bars held. The number of bars contained in a position.
• Profit/loss per bar. Average profit/loss per bar that is profit/loss divided
by number of bars held in the position.
• Cumulative profit/loss. The cumulative profit/loss for all the preceding
trades and the current trade. For the first trade, this value is equal to the
Profit/loss value. For the second trade, the profit from the first trade and
the second trade are combined, and so on.
• Cumulative profit/loss, %. The percentage of the Cumulative
profit/loss.
• Run-up. Trade run-up.
• Drawdown. Trade drawdown.
403
Equity and Drawdown Curves
Tradecision displays Equity and Drawdown curves.
Equity curve displays the account’s equity during the strategy testing
period. With this graph, you can easily get a general idea about how well
the strategy performs.
X-axis indicates bars/months, y-axis indicates account equity.
Underwater curve displays the percentage equity dip at the end of each
period measured from the previous equity peak. Each black vertical line
represents a new equity peak. The curve between the peaks represents the
equity dip from the previous equity peak expressed as percentage.
X-axis indicates months, y-axis indicates equity drawdown in percentage.
Taking into consideration the relative simplicity of equity and drawdown
graphs and the informational depth they have, a combination of both
graphs provides traders with an ideal methodology to compare profits and
risks of different systems.
404
Chapter 18
Function Builder
Understanding Functions
Function Builder enables using the Tradecision library of built-in functions
and creating custom functions and import/export functions, including
importing functions from TradeStation.
You can use the functions in Tradecision when developing a strategy,
technical indicator, study, and so on.
Each function has a name and returns a value based on some underlying
calculation. A function can be nested into another function. Functions can
be combined using mathematical operators.
Many of the functions require parameters that provide the information
required to calculate the function value. Even if a function does not
require any parameters, it must be followed by a pair of parentheses.
For example, AutoTrendMinor()
405
Creating a New Function
To create a new custom function:
1. From the Tools menu, select Function Builder.
The Function Builder dialog box is displayed.
2. In the Function Builder dialog box, click New.
The Custom Function dialog box is displayed.
3. In the Custom Function dialog box, enter the following information in the
corresponding boxes:
• Function Name;
• Full Name;
• Description.
4. To define the function formula, under Expression, click Edit .
The Improvian Editor dialog box will be displayed.
5. In the Expression box of the Improvian Editor dialog box, write the
formula for the function.
6. Click OK.
For details, refer to Using Improvian Editor.
7. Click OK to save the new function.
406
Editing a Function
To edit a function:
1. From the Tools menu, select Function Builder.
The Function Builder dialog box will be displayed.
2. In the Function Builder dialog box, select the function you want to edit
and click Edit.
The Custom Function dialog box will be displayed.
3. In the Custom Function dialog box, edit the Full Name and/or
Description as appropriate.
4. To define the function formula, under the Expression, click Edit.
The Improvian Editor dialog box will be displayed.
5. In the Expression box of Improvian Editor dialog box, edit your
function formula, if required.
6. To save the changes, click OK.
Separating User-created Functions
You can separate your functions from the list of built-in functions. To do
this, right-click a function from the Custom Functions List and clear the
Show Built-in Functions option in the list that will appear.
407
Copying a Function
You can make a copy of the function from the Function Builder dialog box
using the Copy button. This capability is used when you want to create a
new function that is very similar to another one.
To copy a function:
1. From the Tools menu, select Function Builder.
The Function Builder dialog box will be displayed.
2. From the Custom Function List in the Function Builder dialog box,
select a function that you want to copy.
3. Click Copy.
All the function data will be copied and the Custom Function dialog box
will be displayed.
4. Make changes to the values of the following the appropriate text boxes
(Function Name, Full Name, Description and Expression).
5. Click OK.
408
Deleting a Function
You can delete a selected function from the Function Builder dialog box
using the Delete button.
To delete a function:
1. From the Tools menu, select Function Builder.
2. In Custom Function List of the Function Builder dialog box, select the
function that you want to delete.
3. Click Delete.
Importing a Function
To import functions:
1. In the Function Builder dialog box, click Import/Export and then select
Import Functions.
The Import – User Function(s) dialog box will be displayed.
2. From the Import – User Function(s) dialog box, click Browse to browse
for the folder from which you want to import the functions on your local
hard drive.
3. Choose the functions that you want to import by selecting the
corresponding check boxes.
4. Click Import.
All the imported functions will be added to your Custom Functions List.
5. Click Close.
409
Exporting a Function
To export a function or functions:
1. In the Function Builder dialog box, click Import/Export, and then select
Export Functions.
The Export - User Function(s) dialog box is displayed.
2. In the Export - User Function(s) dialog box, click Browse to browse for
the folder on your local hard drive to which you want to export the
functions.
3. Choose the functions that you want to export by selecting the
corresponding check boxes.
4. Click Export.
The functions will be saved into the folder specified by you with the .tfn
extension. Now you can send them to your friends or partners by e-mail.
The recipient will need to use the Import command to work with
functions.
5. Click Close.
410
Importing a Function from TradeStation
Using Function Builder, you can import TradeStation functions.
To import a function from TradeStation:
1. Open Function Builder.
2. Click Import and select Import from TradeStation.
The Omega Import dialog box will be displayed.
3. In the Omega Import dialog box, enter the name of the required function
and select the function type. The following function type options are
available:
• Numeric,
• String,
• Boolean.
4. Choose the source from which the functions are to be imported by
selecting one of the following options
• From Clipboard;
• From File.
Note: If you select the From Clipboard option, you will need to run TradeStation,
copy the function, and then paste it in Improvian Editor.
The function type and name have to be the same as in TradeStation.
411
Note: If you select the From File option, you will need to locate the imported file on
your PC.
5. Click OK.
The Improvian Editor will be displayed for you to check, edit and
approve the function syntax. For details, refer to Using Improvian Editor.
6. In the Improvian Editor, click OK.
The function will be added to the Custom Functions List.
412
Chapter 19
Alert Builder
You can create, modify and delete alerts using Alert Builder. You can
receive whatever alerts you prefer on any of the issues in your portfolio
through audio or visual messages or by e-mail. This enables you to act
immediately on any arising profitable opportunities.
Understanding Alerts
Alerts allow to you set and receive notifications for specific symbol(s) and
conditions. Alerts can be set on trading signals or price changes. You need
to define the condition for an alert and Alert Builder will informs you
when the event occurs for the given symbol(s).
The Tradecision software has an advanced system (Alert Builder) for
creating custom, user-defined alerts. Alert Builder includes a capability that
will alert the user each time an event occurs by displaying a message
and/or playing a sound file. Moreover, alerts can also be sent to you by
email.
Alert Builder allows the user to set and receive notifications for specific
symbol(s) and conditions. Alerts can be set on trading signals or price
changes. To set an alert, you simply need to define a condition, and Alert
Builder will inform you when the event occurs.
To create an alert, you need to know what you want the alert to notify you
about. With the help of the Improvian language, you can easily express
your ideas in a formula, enabling the application to inform you when the
defined condition is met.
Note: Tradecision also provides strategy alerts that differ from the alerts you create
using Alert Builder. Strategy alerts are alerts that are automatically generated by a
trading strategy inserted into a chart. To access the alerts list, from the Tools menu,
select Alerts History. The Alerts History dialog box will display both the Custom
Alerts that you created with using Alert Builder and -strategy alerts (if a strategy has
been inserted into a chart).
413
Creating an Alert
To create a new alert:
1. From the Tools menu, select Alert Builder.
The Alert Builder dialog box will be displayed.
414
2. In the Alert Builder dialog box, click New.
The Improvian Editor window will be displayed.
3. In the Expression box, define a formula containing the alert rules, and
click OK.
A new alert will be displayed in the Alerts List of the Alert Builder dialog box.
4. In the Name box, enter the name of an alert.
5. In the Symbol box, enter the symbol on which you want the alert to
appear.
Note: Also, you can select several symbols. Use the Select button for a quick symbol
look-up.
6. In the Message box, enter a text (message) that you want to be
displayed in the alert message and alerts history.
7. In the Action area of the Alert Builder dialog box, you select the way the
alert will be shown to you by selecting any of the following corresponding
check boxes:
• Pop-up massage.
• Play sound.
Note: To find an audio file on your computer, click Browse.)
415
• Send e-mail. An e-mail message will be sent to you or someone else
when the set alert is triggered.
Note: To configure SMTP Sever and E-mail address, click Setting.
Note: Select the Disable check box if you want to inactivate an alert .
416
Deleting an Alert
To delete an alert:
1. From the Tools menu, select Alert Builder.
The Alert Builder dialog box will be displayed.
2. In the Alerts List of the Alert Builder dialog box, select the alert that
you want to delete.
3. Click Delete.
The alert will be deleted from Alert Builder.
417
Copying an Alert
You can make a copy of the selected alert in the Alert Builder dialog box
using the Copy button. This capability is used when you want to create a
new alert that is supposed to be the same as another one.
To copy an alert:
1. From the Tools menu, select Alert Builder.
The Alert Builder dialog box will be displayed.
2. In the Alerts List area, select the alert that you want to copy and then
click Copy.
The new alert will be added to the Alert List.
3. In the Alert Builder dialog box, enter the following parameters of the
alert, such as Name, Expression, Message, and Action.
418
Import/Export
Tradecision’s easy-to-use Import/Export tool you can exchange any of
your trading ideas with your friends. To do this, you have to save alerts on
your local hard drive and after that you will able to share the alerts with
your friends and partners.
Importing Alerts
To import alerts:
1. In the Alert Builder dialog box, click Import/Export, and then select
Import Alerts.
The Import - Alerts dialog box will be displayed.
2. In the Import - Alerts dialog box, click the button to browse for the folder
on your local hard drive from which you want to import the alerts.
3. Choose the alerts that you want to import by selecting the
corresponding check boxes.
4. Click Import.
All the imported Alerts will be added to your Alerts List.
5. Click Close.
419
Exporting Alerts
To export Alerts:
1. In the Alert Builder dialog box, click Import/Export, and then select
Export Alerts.
2. In the Export - Alerts dialog box, click the button to browse for the
folder on your local hard drive to which you want to export the alerts.
3. Choose the alerts that you want to export by selecting the corresponding
check boxes.
4. Click Export.
The alerts will be saved in the folder specified by you with the extension
.tal. Now you can send them by email to your friends or partners. The
recipient will need to use the Import command to work with the alerts.
5. Click Close.
420
Chapter 20
NeatScan Market Scanner
Understanding Tradecision NeatScan
Tradecision NeatScan is a powerful, flexible, multi-purpose market scanner
that will keep you on top of your trading opportunities.
NeatScan is a multi-symbol scanning and analyzing program which gives
you the ability to locate money-making opportunities. As you know, a
scanner's main task is finding stocks that meet the characteristics you are
interested in. With the help of NeatScan, you will be able to examine
hundreds of symbols, stored in Tradecision's Data Manager, using a set of
diverse criteria, defined by you.
421
With the NeatScan, you will be able to:
•
Observe a multitude of symbols and/or intervals arranged and ranked in
any order you prefer.
•
Automatically scan your symbol portfolio in real time in order to obtain
easy-to-read reports on the results of each search.
•
View the market activity in real time, arranged by volume, amount and
percentage gainers and losers, as well as according to other multiple
criteria.
•
Customize your searches based on price, volume and market cap, and
remove those stocks that do not meet your trading needs.
•
Gain easy access to Tradecision charts to find out more about each
possible trading opportunity
422
Using Built-In Library of Scans
NeatScan™ includes a library of built-in scans, such as MACD, MA
Crossover, Stochastic, Price, Bollinger Bands and many more. However,
with the help of Tradecision Formula Language (TFL), you can create
virtually any scan you may need.
Defining Custom Columns
You can define anything from the simplest to the most complicated
criteria for market scanning and custom column calculation. You can
create custom scanning formulas and use the built-in system of filters.
In addition to displaying different kinds of standard price information
based on the last bar in a chart, the NeatScan functionality of Tradecision
allows performing calculations for any other function or indicator,
provided the corresponding formula can return a numerical value. The
calculated information will be displayed in a specifically created custom
column along with the displayed standard price information in the Scan
Results window.
Choosing a Time Frame
Both built-in and custom scans can be applied to any of the time frames
that you use in Tradecision:
• 1-, 5-, 10-, 15-, 30- and 60 minute: for short-term and day traders.
• Hourly: for swing traders.
• Monthly, weekly and daily: for long-term investors and position traders.
Filtering by Price and Volume
In order to indicate the number of shares a stock has to trade, you can
indicate specific volume parameters using the Min Volume (K) and Max
Volume (K). If necessary, you can change the minimum price and
maximum trading price of a symbol to be scanned using the Min Price and
Max Price options.
423
Opening the Scanner
To open the NeatScan:
1. Open Tradecision.
•
From the Tools menu, select NeatScan.
The NeatScan application will be displayed.
424
Running a Scan
To run a scan:
1. In the Scans area, select a scan that you want to run.
2. On the toolbar menu, click Run.
A progress bar will be displayed.
3. The scanning results (symbols and their parameters) will be displayed in
the Scan Results area.
425
Creating a New Scan
To create a new scan:
1. In the Scans area, select the group to which you want to add a new
scan.
2. On the toolbar menu, click New.
3. In the Scan Name in the New Scan area, enter the name of the scan
being created.
4. To use the Improvian Editor, click Edit.
The Improvian Editor dialog box will be displayed.
5. In the Expression box, enter an expression for the scan.
Note: To verify the correctness of the expression , click Check.
6. If you want to create a special column for the scan, do the following:
• Click Add;
• In the Column name box, enter a name for the new column;
• Click Edit to write a formula for the column.
Note: A formula has to have a numeric value.
–ORSkip to Step 7 of this procedure.
7. Click OK.
The scan will be added to a selected group.
426
Editing a Scan
To edit a scan:
1. On the toolbar menu, click Edit.
2. In the Edit Scan dialog box, you can edit any of the parameters of the
selected scan, such as name, expression and column name.
3. To save the changes, click OK.
Deleting a Scan
To delete a scan:
1. In the Scans area, select the scan that you want to delete.
2. From the toolbar menu, select Delete.
The scan will be deleted from the Scans area.
Creating a New Scan Group
To create a new scan group:
1. From the toolbar menu, click New Group.
2. Enter a name for the new group in the folder that has appeared.
Deleting a Scan Group
To delete a scan group:
1. In the Scans group box select a group you want to delete.
2. On the toolbar menu, click Delete Group,
–ORat the bottom of the Scans area, click Delete Group.
The group will be deleted from the Scans area.
427
Import/Export
To use the Import/Export tool, you have to save scans on your local
hard drive and after that you will be able to share the scans with your
friends or partners.
Importing Scans
To import scans:
1. On the toolbar, click Import/Export, and then select Import.
The Import - Scans dialog box will be displayed.
2. In the Import - Scans dialog box, click the button to browse for the file on
your local hard drive from which you want to import the scans.
3. Choose the scans that you want to import by selecting the
corresponding check boxes.
4. Click Import.
All the imported scans will be added to your scans list.
5. Click Close.
Exporting Scans
To export scans:
1. On the toolbar, click Import/Export, and then select Export.
The Export - Scans dialog box will be displayed.
2. In the Export - Scans dialog box, click the button to browse for the file
on your local hard drive from which you want to export the scans.
3. Choose the scans that you want to export by selecting the
corresponding check boxes.
4. Click Export.
The scans will be saved in the folder specified by you with the extension
.scan. Now you can send them to your friends or partners by e-mail. They
will need to use the Import command to work with the scans.
5. Click Close.
428
Using the Filtering Functionality for Scanning
You can use the filtering funftionality in the Filter area to locate required
scans and manage them more efficiently.
To sort scans using the filtering functionality:
1. From the Category list, select the type of the scans that you want to
find. The following options are available:
•
•
•
•
•
•
All;
Forex;
Futures;
Indices;
Mutual Funds;
Stocks.
2. From the Exchange list, select the exchange that you have been
following.
Note: If necessary, you can change the minimum price and maximum price for
scanning using the Min Price and Max Price boxes.
Note: You can indicate specific volume parameters using the Min Volume (K) and
Max Volume (K) edit boxes.
429
Using Additional Options for Scanning
In the Options group box you can:
1. Choose the Auto Refresh option to use 1, 2, 5, 10, 30, or Never autorefreshment parameters.
2. Select the Interval option to use 1, 2, 3, 5, 10, 20, or Original data
interval parameters.
3. Opt the Symbols to display option to select a number of symbols you
want to be shown you in the Scan Results group box after the scanning
process will be completed.
430
Displaying Scanning Results in Charts
To open scan results into chart(s):
1. In the Scan Results area, click the Open Chart or Open All button.
The chart(s) will be opened in the corresponding chart window(s).
431
Selecting Columns
To select columns:
1. In the Scan Results area, click Select Columns.
2. In the Columns area, you can select any or all of the following columns
that you want to be displayed at the top of the Scan Results area:
•
•
•
•
•
•
•
Name,
Close,
Change,
%Change,
Volume,
High,
Low.
3. Click Close.
432
Exporting scanning Results into a Text File
To export scanning results into a text file:
1. In the Scan Results area, click Export Results.
The Save As dialog box is displayed.
2. In the Save As dialog box, locate the folder to which you want to export
the file on your local hard drive and enter a name for the file.
3. Click Save.
Note: You can select columns that you want to export. To do this, after you get a list
of your scanning results, you need to click the Select Column button and then select
the columns that you want to export into a text file.
Note: Exporting scanning results into a text file is not to be confused with exporting
scans. Exporting scans results allows you to save a list of symbols with their parameters
into a text file. When you use the Export scans feature, you export scans themselves
along with their formulas into a specific file with the extension *scan resolution.
433
Chapter 21
DLL Manager
Understanding DLL Manager
With DLL Manager, you can refer to functions/subroutines stored in .dll
files.
DLL stands for Dynamic Link Library and indicates a file with a .dll
extension. DLLs are used by applications to store functions and data
required for proper operation. You can register a function using the DLL
Manager tool. Once properly registered, a DLL can be used as a standard
function. For example, it can be used for creating custom indicators.
For a DDL to be registered, it must be in compliance with the following
requirements:
1. The DLL is to use the standard parameter-transferring mechanism, for
example, in C++, this is done by using the keyword “_stdcall». The
following is an example of how a function is declared:
declspec(dllexport) int _stdcall MyDouble(double b)
2. Only the following parameter types can be used:
•
•
•
•
•
•
•
•
int - 4 bytes (integer);
float – 4 bytes (a number with a floating point);
double 8 – bytes (a number with a floating point);
bool 1- byte (0 false, otherwise true);
int * 4 –bytes (points to the cell with one number);
float * 4 – bytes (points to the cell with one number);
double * 4 – bytes (points to a cell with one number);
bool * 4 –bytes (points to the cell with one number);
3. The following types of returned values can be used:
•
•
•
•
int - 4 bytes (integer);
float – 4 bytes (a number with a floating point);
double 8 – bytes (a number with a floating point);
bool 1- byte (0 false, otherwise true).
Note: All the names of the types are indicated for C++. If you need to use a library written in another language, you
need to use the corresponding types. All the functions cause no errors while working with software and hardware.
434
Registering a New Function
To register a new function:
1. From the Tools menu, select DLL Manager.
The Dll Manager dialog box will be displayed.
2. Click Add.
The Creating New Function dialog box will be displayed.
435
3. To locate a .dll file on your PC, in the Creating new function dialog box,
click Select Library.
4. From the Library Function list, select the function that you want to
register.
5. In the Function Name box, enter the name of the function.
6. From the Return Value list, select a return value. The following options
are available:
•
•
•
•
int. (Integer Value);
Float. (Floating Point Value);
Double. Floating Point Value with Double capacity;
Bool. Boolean.
7. From the Parameter types from first to last list, select a parameter
type for the function.
8. Click Add.
Note: You can select several parameter types.
9. Click Save.
The function will be added to the Registered functions list and the
External DLL functions category of Improvian Editor.
436
Editing a Function
To edit a function:
1. From the Tools menu, select DLL Manager.
The Register function dialog box will be displayed.
2. Select the function that you want to edit and click Edit.
3. In the Creating new function dialog box, modify the required parameters as
appropriate.
4. Click Save.
437
Removing a Function
To delete a function:
1. From the Tools menu, select DLL Manager.
The Register function dialog box will be displayed.
2. Select the function that you want to delete and click Remove.
The function will be deleted from the Register function list.
438
Chapter 22
Custom Time Series
Custom Time Series is a capability that allows you to add external data for
market calculations. The data should be stored on your local hard drive in
a text file. You can use proprietary indicators and model outputs in your
trading strategy or as market gauges.
Once created, custom time series are added to the Custom Time Series
category available in Improvian Editor. You can use custom time series to
build your custom indicators, custom studies, strategies, and neural
models.
For example, very often you can improve your model performance by
using fundamental factors and market indices as model inputs. Similar to
custom time-series, you can use 3-rd party time-series, such as the values
of proprietary indicators and studies.
439
Adding New Custom Time Series
To add a new Custom Time Series:
1. From the Tools menu, select Custom Time Series.
The Custom Time Series dialog box will be displayed.
2. In the Custom Time Series dialog box, click New.
The New Custom Time Series dialog box will be displayed.
3. In the New Custom Time Series dialog box, type the name of the Custom
Time Series being added.
4. To locate the text file in which the data is stored, click the icon in the
Data Path box.
440
Note: The first column of your text file must contain dates only.
Note: You can select the Automatic update every box to enable the automatic
data update capability for new the Custom Time Series. Tradecision will automatically
update the data from the file at the time interval set by you.
6. To manually define the delimiters, formats and separators used in your
text data file, click Advanced... For details, refer to Advanced Text import
parameters.
7. From the Data Column list, select the column containing the numeric
data to be imported.
8. Click OK.
441
Reloading All the Existing Time Series
To save your time when it is possible, you can reload all the existing time
series. The Reloading functionality is used when the contents of the CSV files
that serve as source files for the time series are modified. When the time series
are reloaded, their contents are updated in accordance with the information
currently contained in the corresponding CSV files.
To reload all custom time series:
1. From the Tools menu, select Custom Time Series.
The Custom Time Series dialog box will be displayed.
2. Click Reload All.
442
Defining Advanced Text Import Parameters
To define parameters manually:
1. From the Tools menu, select Custom Time Series.
The Custom Time Series dialog box will be displayed.
2. In the Custom Time Series dialog box, click New.
The New Custom Time Series dialog box will be displayed.
3. To manually define the delimiters, formats and separators used in your
text data file, in the new Custom Time Series box, click the Advanced...
button.
4. In the Data delimiter box, select None, Double quote, or Single
quote depending on the way the strings are separated in your text file.
5. In the Decimal separator box, select Point or Comma depending on
which of the characters is used in your text file.
6. In the Thousand separator box, select the None, Point, Comma, or
Single quote depending on which of these is used in your text file.
7. In the Date format box, select the date format that you want to use.
8. If you would like to skip some of the rows in the data file, in the Skip
… rows of the data file box, select the desired number of rows to be
skipped.
443
9. If your file contains any successive delimiters that you want to be
ignored during the import, select the Treat successive delimiter as one
check box.
10. If the first row of your file contains headers and you want them to be
ignored during the import, select the First row contains headers check
box.
Note: Steps 5 and 6 of this procedure are optional.
11. Click OK.
444
Modifying the Custom Time Series
To modify the Custom Time Series:
1. From the Tools menu, click Custom Time Series.
The Custom Time Series dialog box is displayed.
2. In the Custom Time Series dialog box, select the Custom Time Series that
you need to modify and click Edit.
The Edit - Custom Time Series dialog box will be displayed.
3. In the Edit - Custom Time Series dialog box, make the required changes.
4. Click OK.
445
Deleting Custom Time Series
To delete a Custom Time Series:
1. From the Tools menu, select Custom Time Series.
The Custom Time Series dialog box will be displayed.
2. In the Custom Time Series dialog box, select a Custom Time Series that
you want to delete and click Delete.
3. Click Yes and then click Close.
446
Chapter 23
Preferences Functionality
The Preferences dialog box enables setting a variety of multiple preferences,
grouped together by purpose in the dialog box’s five following tabs:
General, Objects, Alerts, Real-Time and Integrated Trading.
To open the Preferences dialog box:
1. From the Tools menu, click Preferences.
General tab
In the New Chart area of the General tab, you can define the following
parameters:
The Number of bars to be loaded area in the General tab is used for
loading bars into a chart
.
• All price data. This option defines how many bars will open when a
symbol is loaded. If the All price data is selected, all bars will be loaded.
447
• Only...bars. If the Only...bars is selected, the indicated number of the
latest bars will be loaded. Only loaded bars can be used for strategy testing,
model creation and other analysis.
• Automatically. If Automatically is selected, the number of bars to be
loaded will be determined by Tradecision.
•
Number of bars to be displayed...bars. Enter a number to define the
number of bars to be displayed on charts.
•
In the Space to the right box, you can enter the number of bars to
define the size of the blank space to the right of the last bar in the chart.
For example, this will be useful, when you want to insert drawing objects
and studies into a chart to forecast future price movements. This space is
also used to draw the Fibonacci Clusters study.
•
Select the Apply main chart properties to new sub-charts check box,
if you want to automatically apply chart colors and fonts to new subcharts.
Note: New parameters will be applied to a new chart only.
In the On Startup area of the General tab, you can define the following
parameters:
•
Automatic opening of a specific workspace. You can specify the
workspace that will open automatically every time you start Tradecision.
You can also specify that no workspace should open.
•
Automatic opening of a specific workspace from the last session.
Select the Open Workspace from the last session check box if you
want a workspace from the last session to open automatically.
•
Automatic opening the Open Workspace dialog box. Select the
Display "Open Workspace" dialog check box, if you want to the Open
Workspace dialog box to be displayed automatically during the launch of
the Tradecision application.
•
Creation of a new workspace. Select the Create new workspace
check box, if you want to create a new workspace during the launch of
the Tradecision application.
•
Automatic launch of Data Manager. Select the Automatically start
the Data Manager check box for Data Manager to be launched
automatically every time you start the Tradecision application.
•
Maximum number of workspaces displayed. The Recent
Workspaces box is used to define the maximum number of workspaces
448
that will be displayed after you select Reopen from the File menu. By
default, 10 most recent workspaces are displayed.
Note: New parameters will be applied after you restart Tradecision.
.
449
Objects tab
The Objects tab of the Preferences dialog box allows setting and adjusting a
variety of parameters related to drawing objects and the way they are
displayed.
• Colors and Style. In the Initial properties area, you can define the
default colors and style of drawing objects. For this, click Drawing
objects. The Object Properties dialog box will be displayed. Set the
parameters you need and click OK.
• If you want the Object Properties dialog box to be displayed every time you
insert a drawing object into a chart, select the Show properties for new
drawing objects check box.
• Colors of the Long and Short Positions. In the Buy/Sell signals area,
you can define separate colors for long and short positions.
450
Alerts tab
Alerts. In the Show alerts after area, you can set an alert or alerts by
selecting an appropriate check box. The following alert options are
available:
e Workspace is open;
e Symbol data is updated.
Note: An alert will be shown to you if new data has been added and a chart with a
strategy (with buy/sell signals in it chart) has been opened. Tradecision will
automatically process this new data according to the strategy rules and will show you an
alert dialog box: buy, sell or hold. This dialog box also contains all alerts history.
451
Strategy Alerts Customization
With the Strategy Alerts Customization functionality, you can receive alerts
when the conditions of your trading strategy are met. You can receive any
kind of alerts you prefer on any of the issues in your portfolio in the form
of audio or visual messages or by e-mail. This will enable you to act
immediately on any arising profitable opportunities.
To configure the strategy alerts settings:
1. From the Tools menu, select Preferences.
2. In the Preferences window, select the Alerts tab.
3. In the Strategy Alert area, you can choose the way in which the
alert will be shown to you by selecting any of the following
corresponding check boxes: Play sound on Strategy Alerts or
Send E-mail on Strategy Alerts.
4. If you have selected the Play sound on Strategy Alerts check box,
click Select to browse for an audio file on your computer.
–OR–
If you have selected the Send E-mail on Strategy Alerts check box, click
Setting to configure the SMTP Sever and E-mail address.
452
An email message will be sent to you or another recipient when the set
alert is triggered.
4. In the Preferences window click OK.
453
Outputting Alerts into a Text File
You can store information on the incoming alerts, both custom and
strategy, into a file located on your computer. This option can be useful
for receiving an output from Tradecision to be able to generate a live order
using a third party application.
To select a file to store information on incoming alerts:
1. From the Tools menu, select Preferences.
The Preferences tab is displayed.
2. In the Preferences window, select the Alerts tab.
3. In the Store Information on the Incoming Alerts into a File
area, select the Custom Alerts and/or Strategy Alerts check
boxes and then click Browse to browse for a text file(s) for storing
the alerts.
454
Note: The names of the Custom Alerts и Strategy Alerts files can not
be the same.
4. Click OK.
The files will be created on your local hard drive and all the alerts
generated by Tradecision will be stored in the text file(s).
455
Real Time tab (for Real Time edition only)
Duration of Trades
In the Trading Signals area of the Real Time tab, select the Allow Trades
Across Day Breaks check box.
Displaying an Incomplete Bar
Select the Show an Incomplete Bar on the Price Chart option to enable
the displaying of an incomplete bar.
Technique Recalculation
In the Technique Recalculation area, you can set the time interval for
the progress bar window using the Time Interval for the Progress Bar
window option. This feature is useful if you don’t want the Progress Bar
window to be shown frequently on open charts where trading techniques,
for example, indicators and studies, are being recalculated in real time.
Note: If you enter, for example, 0.5 sec, this will imply that if no technique recalculation
has occurred within a 0.5 second, you will see the Progress Bar window. If you enter 0.0
sec, the Progress Bar window will be shown constantly. We do not recommend selecting
more than a 2 second interval.
456
Integrated Trading Tab
In the Integrated Trading tab of the Preferences window (Tools menu),
the DTE mode settings are located.
The Brokers area:
Select Broker. Sets the broker that handles the trade.
The Default Settings for Trading Toolbar area:
• Modify the Order Type (Market, Limit, Stop, StopLimit); Position
and TIF (Good Till Cancel, Good Till Day) as appropriate;
• Select the Show Order Confirmation to request user confirmation
before each transaction.
Note: TIF stands for Time in Force. TIF is used during the
placement of a trade to indicate for how long an order will remain
active before it is executed or expires.
The Direct Trade Execution area:
• Show Order Confirmation. Requests user confirmation before each
transaction.
Close All Positions after Trading is Stopped. Closes all open positions
when the DTE mode is deactivated.
457
Inreractive Brokers
To set the Interactive Brokers settings:
1. Go to the Tools menu, select Preferences, select the Integrated
Trading tab and then in the Brokers area select Interactive Brokers.
2. In the Interactive Brokers connection properties area, provide the
following information:
• Address. The address of the computer on which Interactive Brokers is
run; if Interactive Brokers is run on the same computer with
Tradecision, this box can be left empty.
• Post. The port number.
• Client ID. The numeric identifier of the customer. This parameter and
the parameter that performs its function in Data Manager must be
different for the application’s correct work.
458
Man Financial
To set the MAN Financial settings to be used for Direct Trade
Execution:
1. Go to the Tools menu, select Preferences and then select the Man Financial tab.
2. Provide the following information:
•
•
•
•
•
Address and Port. Enter the address and port of the STAS server;
Price Address and Price Port. Enter the address and port of the SMDS server;
Login. Enter user login;
Password. Enter the user password.
Account. Enter the account details.
3. To save the settings, in the Preferences dialog box, click OK.
459
TD AMERITRADE
To set the TD AMERITRADE settings:
1. Go to the Tools menu, select Preferences, select the Integrated
Trading tab and then in the Brokers area select TD AMERITRADE.
2. In the TD AMERITRADE connection properties area, provide the
following information:
• Login. Enter user login;
• Password. Enter the user password.
460
Chapter 24
Real Time Edition
Tradecision Professional Real Time is an advanced analysis and decision
support trading software application for intraday traders. If you are a day
trader trading stocks, futures, Forex or options, with Tradecision you get
the ability to succeed.
Tradecision Professional Real-Time enables:
e reacting to small market movements;
e identifying short-term trends;
e applying your trading strategies to minute bars; - receivimg
timely strategy alerts.
Tradecision Pro Real Time is charting and analysis trading software for
intraday traders. Owing to the cutting-edge technology used by
Tradecision Pro Real Time, the application is capable of ensuring such a
level of precision, which will enable you to identify money-making
opportunities and capitalize on them in real time.
Locating Opportunities in Real-Time
Tradecision Pro Real Time adds real-time performance capabilities to the
feature set offered by Tradecision Professional. Therefore, using this
version of the system, you can apply your strategies and neural models to
minute bars.
Upgrades
Tradecision Standard and Tradecision Professional can be upgraded to
Tradecision Real Time. This upgrade will allow you to use real-time
intraday data.
To purchase an upgrade, visit
www.tradecision.com/purchase/purchase_upgrade.htm
Receiving Real Time Data
Tradecision Pro Real Time currently supports IB, Man Financial, IQfeed
and eSignal real time quotes. Getting accurate streaming data enables you
to look for profitable opportunities and analyze the current market
conditions and trends.
You can import your MetaStock and ASCII intraday databases.
461
Key Features
In Tradecision Real Time, the Tradecision functionality has been expanded
to include a number of new features that are narrowly tailored to meet the
more demanding needs of today's investors and real-time traders:
•
Streaming, real-time quotes and charts displaying custom minute
charts;
•
A sophisticated money management set of rules and functions;
•
Portfolio-level backtesting and optimization;
•
Advanced reporting system;
•
Power to design multiple-security strategies and indicators in seconds;
•
Multiple data feeds.
462
Data Manipulations
With Tradecision, you can trade any kind of securities on practically any
exchange in the world:
•
Real-time streaming quotes via IB and IQFeed, granting access to all US
exchanges and major world exchanges.
•
eSignal supports U.S., Canadian, European, Asian and African Level I
equities, indices, CME E-Minis and CBOT Mini-Sized Futures, plus 100s
of world indices.
•
Man Financial specializes in day trading, futures brokers, futures trading,
forex trading, currency trading, managed futures.
•
A user-configurable ASCII import wizard allows you to read quotes stored
on your local hard drive in the format defined by you. Data Manager is
flexible enough to import most of the date-based end-of-day and intraday
price data from an ASCII file.
•
Built-in MetaStock® database importer reads all stocks directly from your
MetaStock database (in both EOD and intraday modes).
•
CSI database is supported directly through a CSI’s product, known as
Unfair Advantage®. CSI is a low cost information vendor of summary
end-of-day world financial market data. CSI's historical coverage includes
all commodity markets gathered from over 80 futures exchanges traded
worldwide. CSI also supplies daily summary data on all New York Stock
Exchange stocks, nearly all American, and NASDAQ stocks, and virtually
all 25,000 US mutual funds. The CSI market data is supplied to the most
popular financial websites, such as Yahoo! Finance and MSN Money.
463
Strategy Execution
Whether you employ traditional technical analysis techniques, neural
networks, or a combination of the two, as a strategy trader you can apply
your trading systems and strategies in real time.
After you have backtested your ideas and defined a rule, Tradecision will
display a buy, sell or hold alert in real time, as soon as it receives the
corresponding signal.
Real Time Advanced Charting
Designed for individual investors with limited experience, as well as for
active and professional traders, Tradecision displays all bars in an accurate,
clear, and easy-to-see way, so that you can easily follow and analyze them.
Stock and Quote Database
Tradecision features advanced database system that offers the following:
•
Build-up and store historical bar data for backtesting purposes;
•
Build-up and store intraday minute-bar or end-of-day data for backtesting
purposes;
•
Unlimited number of stocks and quotes; Support of multiple databases.
464
Setting Up the IQfeed Real-Time Mode
IQfeed is a very reliable and established data provider that has clear and
strict rules for obtaining market data from them.
To receive market data from IQfeed, become an IQfeed subscriber (a free
trial isavailable) and download the IQfeed client.
First of all to operate with IQfeed data in Tradecision you need to
subscribe to this datafeed. IQfeed offers free trial. You can get it at
http://www.iqfeed.net/index.cfm?displayaction=start
Also, you need to download IQfeed client for free from
http://www.iqfeed.net/index.cfm?displayaction=support§ion=downl
oad
Note: The latest version must be downloaded.
465
Configuring Data Manager
To configure Data Manager:
1. In the Properties dialog box of Data Manger, indicate IQfeed as the data
source for the selected symbol.
Note: By default, Data Manager selects and shows E-Signal as the primary data
source. You need to click Change to select another data source.
To receive data from the IQfeed in the streaming mode, you also need to
perform certain steps in Tradecision.
To enable Tradecision to receive real-time market data:
1. Open Tradecision.
2. Open the symbol for which you want to receive real-time data.
3. From the Tools menu, select Streaming mode.
The IQ Connect Login dialog box will be displayed.
4. Enter your login and password which were e-mailed to you by IQfeed
shortly after your subscription.
5. Select the Save Login and Password/Pin and Automatically
Connect check boxes.
6. Click Connect and you will be able to operate with IQfeed real-time
data.
466
Configuring Interactive Brokers
Tradecision supports real-time streaming quotes from Interactive Brokers
TWS.
Note: For details, you can refer to the quick-start tutorial How to create a symbol with
Interactive Brokers Data which can be found at
http://tradecision.com/product/videos.htm
To use Interactive Brokers data you need to:
1. Download and install TWS API and then restart your computer.
Note: This procedure is required to register TWS API ActiveX components.
2. Run the Web-based TWS or download standalone TWS.
3. In TWS, you need to select Configure > API > Enable Active X
and Socket clients.
To configure Interactive Brokers in Data Manager
1. Launch the Trader Workstation (4.0 or greater).
2. Open Data Manager.
3. Go to the Tools menu and select Preferences > Interactive Brokers
tab.
Set or modify the following connection preferences:
• Address. If TWS is launched from a local PC, you can leave the
Address box empty. If TWS is located on a remote machine, you
must enter the IP address of the remote computer.
• Port. It should be the same as in TWS > Configure >API >
Socket Port.
• Client ID. If TWS is accessed by several concurrent users, they
each need to have a unique Client ID. If there is only one user, a
default setting can be used.
• Selecting Autosave period. Data Manager automatically collects
and saves data from TWS in the cached price data custom format.
To indicate an autosave period for cached price data, select a
desired parameter in the Autosave period, min list
• The Show messages. With the Interactive Brokers' messages
dialog box you can analyze the IB messages on its activity.
467
In the Interactive Brokers tab, you can see the state of connection between
Data Manager and Interactive Brokers. If the connection indicator is
green, the connection has been established successfully and you can start
collecting market data. If the indicator is red, some kind of connection
error has occurred. If the indicator is yellow, Data Manager is trying to
connect to IB.
If you want to receive market data for a particular symbol, from the
Symbol menu, select Add New or just click the Add New button on the
Data Manager toolbar;
The Add New Symbol dialog box will be displayed.
To set Interactive Brokers as the data source for the symbol.
In the Add New Symbol dialog box, click the Change button in the Data
Source area and then select Interactive Brokers.
Note: you can use the "Save as default" button in order to use the same symbol
properties for the symbols you will create in the future.
Note: Make sure that the selected symbol's Exchange is the same as in TWS.
Otherwise the symbol won't receive data from Interactive Brokers.
If a symbol is added and no errors are displayed, all the data for this
symbol can now be easily downloaded and stored in Data Manager.
To receive new data, click Update or Start Streaming.
Note: IB (TWS) does not allow receiving historical data. Data Manager receives only
real-time price information. That is why it is very important for Data Manager to be
remaining active for as long as possible. The more time Data Manager and TWS work
together, the larger amount of price data Data Manager will be able to collect.
468
Futures Symbols
When working with futures, it is often required to indicate the Expiration
Date. This can be done in the Data Source dialog box of a particular
symbol.
To indicate the expiration date:
1. In the Add New Symbol, dialog box click Change next to Data source.
The Data Source dialog box will be displayed.
2. In the Data Source dialog box, select Interactive Brokers and indicate an
expiration date in the YYYYMM format.
469
Exchange Management
If the exchange you need is not included in the Exchange list of Data
Manager, you can add it manually using the Tools menu.
To add an exchange manually:
• From the Tools menu of Data Manager, select Exchanges.
In the Exchange Management dialog will be displayed.
• Click Add.
The Add Exchange dialog will be displayed.
470
• Fill in the corresponding fields and click OK.
• In the Exchange Management dialog, click OK.
Note: The exchange you use must contain a Session Time for Data Manager to be
able to receive market data.
471
Switching on the Streaming Mode
To receive real-time data, you can easily switch to the Streaming Mode.
The Streaming mode is activated by clicking the Start/Stop Streaming
Mode icon on the main Tradecision tool bar or by selecting the
Streaming Mode menu item from the Tools menu.
When the Start/Stop Streaming Mode icon is clicked or the Streaming
Mode menu item is selected, all the currently open charts start receiving
data in the Streaming mode. All newly opened charts start working in the
streaming mode automatically. When the button or icon is clicked
repeatedly, the Streaming mode is inactivated and canclelled for all
currently open charts.
To switch to the streaming mode:
1. Open Tradecision.
2. From the Tools menu, select Streaming Mode or click the Start/Stop
Streaming Mode icon on the Tradecision tool bar.
To start receiving data in the streaming mode in Data
Manager:
Select a symbol from the Symbol List of Data Manager, right-click it and
select Start Streaming.
472
Selecting Time Frames
To change the chart time frame:
1. From the View menu, point to Time frame, and then select one of the
timeframe values (1, 3, 5, 10, 15, 30 or 60) or enter your custom time
frame using the Minutes toolbar.
473
Selecting Day Session Range
How to Specify the Chart Loading Period for a Trading Day
The Day Session Range is a data range you can use for chart analysis. The
chart will only load those bars that fall within the period specified in the
session period. You can specify in Tradecision which "hours" and
"minutes" are permitted for analysis and entering trades.
For example, if you want to use the data from 2 pm till 5 pm only, you
need to select this data range and only this data range will be displayed.
FOREX traders will benefit from this feature. Since there are many pseudo
"start/end" periods in which traders may want to participate, the
capability will assist them in creating charts that are loaded for the opening
of a specific exchange or for specific day sessions.
To define the Day Session Range:
1. From the File menu, select Workspace Properties.
The Workspace Properties dialog box will be displayed.
2. From the Workspace Properties dialog box, select the Define the day
session range check box and select the appropriate values in the Start
and End boxes,
-ORClick Default if you want to use the default parameters.
Note: By default, the system will set 9 am – 4 pm.
3. Click OK.
Note: This option will be applied to the current workspace even if it has not been saved
yet.
4. To close the dialog box, click Cancel.
474
Allowing Trades Across Day Breaks
Most day traders do not carry positions overnight. However, in intraday
trading it is possible, where one enters during a day session but exits, upon
a signal, 2 to 3 days later.
Note: When you apply your strategy, Tradecision will forcibly generate the exit
signal at the end of each day.
To define the overnight/day trading conditions:
1. From the Tools menu, select Preferences.
2. In the Preferences dialog box, select the Real Time tab.
The Real Time tab will be displayed.
3. In the Trading Signals area, select the Allow trades across day
breaks check box.
4. Click OK.
475
Chapter 25
FAQ - Frequently Asked Questions
Get quick answers to the most frequently asked questions about
Tradecision
476
General questions
Q. How can I try the software before I buy it?
A. We do not offer any demo or trial version. We offer a 30-day money
back guarantee. If you are not satisfied with our software, you can return it
within 30 days and get your money back. Additionally, you can find a great
deal of information on our product on our website.
Q. What is a "30-Day Money Back Guarantee"?
A. If, for any reason, you are not 100% satisfied with Alyuda’s Tradecision,
you can obtain a refund of the full amount of your payment within 30 days
following the key activation.
Q. How can I determine that the software is right for me?
A. If you need a robust technical analysis tool to test your trading ideas
before actually using them, and if you have been disappointed by other
specialized technical analysis or neural network software as being too
complicated to use, Tradecision is for you.
Use Tradecision to make better trading decisions in your everyday trading.
You can use it for any of the following tasks:
Charting with easy-to-use drawing tools;
Analyzing price data with indicators and analytical studies;
Developing and testing trading systems based on neural networks and
technical indicators;
Forecasting market moves and turning points to act before others;
Using genetic algorithms for fast and efficient trading system optimization.
Q. What are the strengths of your software?
A. Whether you're a beginning investor or veteran trader, Tradecision
provides you with the practical and advanced collection of tools to support
your trading decision-making process.
The following Tradecision’s strengths are at your service:
Power of both traditional technical analysis and artificial neural networks
in a single software package.
Easy-to-use technology and GUI. With Tradecision, you can employ
advanced technology without the need to learn any new theoretical or
scientific details.
Accurate constructive neural networks for making predictions and
composing neural strategies.
477
Point-and-click Money Management Editor, allowing you to easily use and
customize the most well-known position size, stop-loss, trailing stop and
profit target rules.
Powerful strategy development and testing capabilities. Strategy Builder, a
powerful language, Optimization Wizard and Simulations Manager,
providing portfolio testing and detailed reporting capabilities.
Fast optimization with Genetic Algorithms. The system will allow you to
automatically find the best inputs for neural networks, the number of the
trading strategy parameters to be optimized being unlimited.
Extensive list of analytical studies and indicators. Support your trading
decisions with over 100 technical indicators, auto-trends, chart patterns,
Elliott waves identification, and other analytical studies. Any kind of
analysis made using Tradecision is exceptionally accurate. This makes the
application a great tool for active and professional traders.
Q. Which would be better for me to purchase - Standard or
Professional Edition?
A. It depends on a number of factors, including your approach to trading,
your need for using advanced tools and your desire to improve your
trading experience.
With Professional Edition, you get the following significant advantages:
Ability to create your own custom indicators.
Since trading technologies and technical analysis are constantly developing,
it is very important that this tool be used for experimenting and creating
up-to-date, effective indicators.
Neural Models optimization with Genetic Algorithms.
Use Genetic Algorithms to find the best neural model inputs and their
parameters. Genetic algorithms combine the best characteristics of the
other optimization methods, such as robustness and fast convergence,
which does not depend on the properties of the optimization criteria (such
as, for example, smoothness). At the same time, Genetic Algorithms are
much faster than exhaustive search.
Perform a strategy optimization with Genetic Algorithms.
The optimization process can take seconds, minutes or hours, depending
on the number of simulations being run. To reduce the time required for
optimization, you can either reduce the number of optimization
parameters or use Genetic Algorithms for optimization. For those cases
when you have a large number of optimization variables and wide search
ranges, Genetic Algorithms are much faster than exhaustive search while
remaining very robust.
478
Q. Can you guarantee I will become rich after buying your software?
A. No, we cannot Alyuda Research designed the analytical Tradecision
software application in order to support YOUR OWN profitable trading
ideas and significantly improve your trading experience. By automating
neural network analysis, intuitive charting and money management, as well
as by offering proven technical analysis tools, Tradecision gives traders the
power to make fast and profitable decisions.
Experts say that no software will help you become rich if you lack
discipline, sound cash management, risk control and profitable trading
strategy(ies).
Q. Is it really so easy to make a profit?
A. This one isn’t so easy to answer. Tradecision is not a "system" or
predefined trading strategy making money for you. It is a powerful tool
that helps you create and test your own winning trading systems powered
by proven technical analysis tools and the latest AI achievements. You
should understand that being a great trading software application,
Tradecision, just like any other software, does not provide magic bullets or
Holy Grail trading systems.
Q. What makes Tradecision different from other trading software in the
market?
A. In Tradecision, the Alyuda Research team has applied its thorough
knowledge and expertise in developing efficient trading software and
artificial neural networks.
The following are the powerful advantages of the application:
•
•
•
•
•
•
Neural network predictions and strategies;
Wizards’ guidance;
Advanced Money Management editor;
Powerful language;
Fast optimization with genetic algorithms;
Elliott Waves Analysis.
In addition, Tradecision has passed numerous extensive tests and
improvements allowing professionals to speak of a new and reliable piece
of software hitting the market.
Q. Is Tradecision easy to use?
A. Yes, it is. It is both easy to learn using and use on a daily basis.
Tradecision was designed to be as intuitive and user-friendly as possible.
To work with Tradecision, you do not need any previous trading software
and/or neural network experience. By using the application’s intuitively
479
user-friendly interface you will become familiar with Tradecision right
from the first click.
Q. Can I install Tradecision on multiple computers?
A. You may only:
• install and use one copy of the Software on a single computer.
• you may also make a second copy of the Software, install it, and
use it on a home or portable computer used exclusively by you.
• make one backup copy of the Software, provided your backup
copy is not installed or used on any computer.
For intensive back testing studies, optimizations, multi-input neural
models and charts containing multiple objects, we recommend 3GHz
Pentium 4 processor and 1GB of RAM.
Q. Has Tradecision any help materials?
A. Yes, it does. Tradecision contains a lot of help materials. Every dialog in
Tradecision contains the Help button. When the Help button is clicked,
Tradecision displays a window containing detailed information on the
dialog or feature.
Q. What about support? How long does your technical support last and
how much does it cost?
A. All registered users are entitled to free technical support without time
limits. There are no limits on the number of requests either. We will
provide prompt and detailed answers to all your questions. Our support
team is dedicated to helping you succeed in improving your trading
decisions with our software.
Q. Will I pay for the products just once or monthly/annually?
A. No, you will not You are charged just once – when you are purchasing
the software.
Q. Which markets can I trade using Tradecision?
A. With Tradecision you can trade stocks, FOREX and futures.
480
Q. Why are you selling the software instead of making $$$ using it?
A. Several professional traders work on our team as consultants. They
successfully trade using the Alyuda software sharing their trading
experience and market knowledge with us. The company’s employees also
successfully use Tradecision but they do it on a private basis only and
during non-working hours.
As a company, Alyuda does not engage in any kind of trading because it
focuses on Artificial Intelligence research and software development.
We do what we like doing the most: solve difficult real-world problems
using neural networks. Just like in any other industry, there are companies
that build and sell tools, and there are those that use these tools.
Q. I would like to get more info about Alyuda.
A. Alyuda Research helps traders, managers and data analysis specialists
leverage the power of artificial intelligence. Since 2001, Alyuda has been
successfully developing and marketing software products based on neural
networks and other AI technologies.
Today, owing to Alyuda’s software products, thousands of business
analysts, traders and engineers enjoy the benefits of AI. Visit Alyuda's website at www.alyuda.com for detailed information on the company.
Q. I am a beginner trader. Couldn’t you please recommend a resource
for traders where I can find some valuable information?
A. Yes, we could. Below you will find links to Internet resources that as we
believe will be of help.
Data vendors:
http://www.esignal.com
http://finance.yahoo.com
http://www.csidata.com
http://www.reuters.com
Forums:
http://www.elitetrader.com
Magazines:
http://www.traders.com
Finance world:
http://online.wsj.com
http://finance.yahoo.com
http://www.thestreet.com
481
http://www.barrons.com
http://finance.lycos.com/qc/default.aspx/
http://cbs.marketwatch.com
http://smartmoney.com
http://www.forbes.com
http://www.fool.com
http://moneycentral.msn.com
http://dmoz.org/Business/Investing/Research_and_Analysis/
http://dmoz.org/Computers/Software/Business/Investing/
Stock Exchanges:
http://www.nasdaq.com
http://www.nyse.com
482
Charting
Q. Can I work with Candlestick Chart?
A. Yes, you can. Just click the Candlestick Chart button on the toolbar.
Q. Can I work with Point & Figure Chart?
A. No, you can’t. Tradecision does not support working with Point &
Figure Charts.
Q. Can I work with weekly/monthly charts?
A. Yes, you can To change the chart time frame, on the Time frame of the
Chart menu, then select the daily, weekly or monthly time frame.
Q. Can I display the charts of two or more different stocks at the same
time?
A. Yes, you can You can add new chart windows to the current workspace
with chart(s).
Also, you can resize chart windows, manage indicators, sub-charts,
analytical studies, and your own trading ideas, and then save them on your
local hard drive. Tradecision saves a workspace with your defined stocks in
a file with extension Tradecision Workspace (*.tws).
Q. What should I mark with buy/sell markers?
A. In Tradecision, the Buy marker and Sell marker are drawing tools used
to mark out specific parts of a chart you believe to be important. Using the
markers, you can denote specific occurrences, such as the bar you
purchased a stock, sold a stock, identified an uptrend, and so on.
You can use markers in conjunction with analytical tools. For example,
there is always a period of time between a trading strategy generating an
order and filling that order. This difference in price is known as slippage.
To determine the average slippage amount, you can insert a marker,
indicating the actual bar that your position was filled, and then calculate
the difference between the point in time when your orders are generated in
accordance with your strategy and the point in time when they are filled.
483
Q. What are Fibonacci Retracements?
A. Fibonacci Retracements help anticipate support and resistance levels
along with price targets. Fibonacci Retracements indicate the possible
support and resistance levels from important highs and lows. The distance
between the start and end points is divided into Fibonacci Retracements,
which suggest possible support and resistance points.
The Fibonacci Retracement tool is used to measure the amount the market
has retraced compared with the overall market movement. When used
together with Elliott waves, Fibonacci Retracements are normally drawn
from the beginning of Wave 1 (the Zero point) to the top of Wave 3 to
find a target price area for the Wave 4 retracement.
You should keep an eye out for the end of a trend or correction at the
Fibonacci Levels. Horizontal lines are drawn at the common Fibonacci
levels of 38.2%, 50%, and 61.8%. As the price retraces, support and
resistance often occur at or near the Fibonacci Retracement levels .
Q. How many sub-charts can I open?
A. You can use up to 6 visible sub-charts with indicators.
Q. Can I save my charts with modifications the way I like?
A. Yes, you can. This can be done using workspaces.
Workspaces provide a convenient way to manage charts and organize your
investment ideas. Workspace itself is a single file that contains all the
charts with their drawing objects, indicators and studies.
Workspace is a single file that contains all the charts with their drawing
objects, indicators and studies. When a workspace is opened, each chart is
opened and displayed on the screen exactly the way it appeared when the
workspace was saved, including all the chart's elements. When you save a
workspace, you save all your changes and modifications in all active charts.
You can create a separate workspace for your favorite stock, a group of
stocks, an industry or anything you decide to work with together. For
example, you may want to analyze QQQ and Dow along with four of your
favorite indicators. Or you may want to save the current positions of
windows with all their elements. The best way to save your time and
manage groups of charts/sub-charts/objects is using workspaces.
Once you have created a workspace, you can add new chart windows to
the workspace, manage charts, indicators, sub-charts, analytical studies, as
well as many other trading ideas, and then save them on your local hard
drive.
You can work with one workspace at a time.
484
Tradecision saves a workspace in a file with the Tradecision Workspace
extension (*.tws)
485
Analytical Studies and Indicators
Q. Could you tell me what the Elliott Waves Theory is about?
A. In 1939, Ralph Nelson Elliott published a pattern-recognition
technique, which holds that the stock market follows a rhythm or pattern
of five upward waves and three downward waves to form a complete cycle
of eight waves. The three downward waves are referred to as a
"correction" of the preceding five upward waves.
Wave is a movement in the market, either upwards or downwards. The
size of the wave depends on the period of time that is being analyzed.
Impulse Wave is a wave that moves in the direction of the main market
trend. It subdivides into 5 smaller waves (1-2-3-4-5). Waves 1, 3, and 5
move in the direction of the main market trend. Waves 2 and 4 move
against the main market trend.
Corrective Wave is a wave that moves in the direction opposite to the
direction of the main market trend. It subdivides into 3 smaller waves (a-bc). Waves a and c move against the main market trend. Wave b moves in
the direction of the main market trend.
Q. How does Tradecision Elliott Waves?
A. Tradecision’s Elliott Wave study uses the simplified Elliott Wave theory
that states that price usually makes a 5-wave pattern in one direction,
followed (in most cases) by a corrective pattern, and, finally, by a new 5wave pattern in the opposite direction.
The Tradecision Elliott wave study uses a special mathematical algorithm
to resolve conflicting situations and identify waves and corrections as
precisely as possible. Experts can fine-tune this algorithm. For example,
it’s possible to specify a parameter that indicates the percentage for which
Wave 4 can overlap Wave 1 before the Wave count is considered invalid .
Q. Where I can read about the description of indicators?
A. Tradecision’s Help contains a library with a description of the 100 +
most popular built-in indicators, including MACD, RSI, Stochastic,
PercentR, Bollinger Bands, Average True Range, and others.
Q. What is Fibonacci Clusters?
A. Using Fibonacci Clusters you can determine the probability of a trend
reversal for each price level. Fibonacci Clusters indicate the price level on
which a potential change in the trend may occur. The stronger the cluster,
the greater the likelihood that the price level is a support or resistance level
for the current trend.
486
Fibonacci Clusters were not designed to be used alone. They should be
used as a confirming indicator or for gauging where in a trend a change
may potentially happen.
Fibonacci Clusters are calculated using the following procedure: the price
range of a security is divided into a specified number of sub-ranges
(clusters). After that, Tradecision uses all pivots (minor, intermediate and
major) to form all possible Fibonacci Levels (Retracements and
Extensions). The more Fibonacci Levels are assigned to a cluster, the
stronger the cluster is
Q. Can I build my own indicator?
A. Yes, you can. Tradecision affords you the opportunity to create and
improve your own custom indicators. Since the trading technologies and
technical analysis are constantly developing, it is very helpful to use this
tool for experimenting and creating up-to-date advanced indicators.
A custom indicator can be a combination of other indicators. Some wellknown indicators are simply a combination of other indicators. For
instance, Chaikin Oscillator is a subtraction of a 10-period EMA of
Accumulation-Distribution from a 3-period EMA of AccumulationDistribution, and TRIX is a combination of 3 Exponential Moving
Averages.
You can create or edit your own custom indicators using Indicator Builder.
Q. Can I use data and indicators from 2 stocks in one neural study? I
think qqv will be helpful while predicting qqq.
A. To do this, you need to use External function
487
Neural Networks, AI, GA
Q. Is it really so easy to build a profitable strategy based on neural
forecasting?
A. The Tradecision interface is very easy-to-use and all the scientific details
are hidden inside the application. With Tradecision, you can use the most
advanced technology without the necessity to spend your time on getting
familiar with the latest AI achievements. You don’t need to have any
mathematical or artificial intelligence background to effectively use the
software.
However, you need to be persistent and ready to experiment, since
different markets and stocks require different inputs and strategies. You
should be prepared to spend some time on preparing your neural models.
Technological specifics, such as neural network architecture and training
algorithms, data preprocessing, and so on are completely automated but
you still have to select the necessary data, verify your ideas, adapt models
to changing market situations. You will have to rely on your own judgment
while assessing system performance or selecting the best model based on
your trading style and risk preferences.
Tradecision is not a ready-made strategy but rather an advanced tool that
offers you a significant advantage over other traders. It helps you obtain
accurate forecasts and build winning strategies based on the latest
achievements in the artificial intelligence technologies.
Q. Why can neural networks be better than other technical analysis
techniques?
A. A neural network can process a huge amount of data and detect those
trends and price patterns that cannot possibly be seen in charts by humans
or discovered using the traditional technical analysis methods.
Neural networks learn from price data and discover complex non-linear
dynamic patterns in price movements. Unlike typical indicators, neural
networks have the ability to learn from the data itself. Neural networks
learn the patterns of price data whereas standard analysis techniques assign
a model form to the data and then test it to determine whether the data fits
the assigned structure or not.
A very often, regular trading systems work for a while until the market
situation changes, causing the system performance to deteriorate. A neural
network-based trading system can be retrained every time you have new
data and thus be adapted to any new market situations.
488
Q. What are neural networks?
A. An artificial neural network consists of a large number of simple
processing units linked by weighted connections. By analogy, the
processing units may be referred to as neurons. Each unit receives inputs
from many other units and generates a single output. The output acts as an
input for other processing units.
The power of a neural network stems from the combination of multiple
units in a network. A certain network can be tuned to solve a specific
problem by modyfing the connection topology and values of the
connecting weights between its units.
Neural networks have proven to be among the best methods of detecting
hidden relations in stock market data. Once a neural network has analyzed
your dataset (i.e. “has received training”), it is able to make predictions
based on the hidden dependencies that have been found.
Q. Do I need the knowledge in neural networks / programming /
statistics / artificial intelligence to effectively use your software?
A. The Tradecision interface is very easy-to-use and all the scientific details
are hidden inside the application. With Tradecision, you can use the most
advanced technology without the necessity to spend your time on getting
familiar with the latest AI achievements. You don’t need to have any
mathematical or artificial intelligence background to effectively use the
software. In fact, you will be ready to use your first neural model several
minutes after you started using the application. However, you need to be
persistent and ready to experiment, since different markets and stocks
require different inputs and strategies. You should be prepared to spend
some time on preparing your neural models.
Q. What level of accuracy should I expect while making predictions
about out-of-sample stock data?
A. The majority of neural models, provided they been fed the right amount
of data and relevant inputs, forecast with 60-85% accuracy. Out-of-sample
accuracy and forecasting errors are reported after you perform walkforward testing of your model.
Q. What information should I feed into a neural model to achieve good
forecasting results?
A. Tradecision requires a set of input columns to base the neural model
training on, and identify price patterns and relationships. All data that as
you believe significantly affects the value of the target or represents the
market situation should be used as inputs. This includes price data (open,
high, low, close and volume), technical indicators (moving averages, lags,
489
MACD, RSI, PercentR, and so on) market indexes (S&P500, Dow Jones
Industrial, NASDAQ, and so on), as well as relevant stocks and other
information that represents the market conditions.
Inputs are the only kind of knowledge about the market that will be
available to a neural model to base its forecasting on. Therefore, selecting
the right inputs is the trader’s most important task as the rest of the tasks
in Tradecision are automated.
It is worth a mention, that irrelevant or insignificant inputs may deteriorate
the model’s performance.
Another important aspect is the right amount of data. If your historical
data has a small number of price patterns, the neural network will not have
enough information about your market to train correctly. For daily bars, it
is recommended that you have price data for at least 4-6 years (1000-1500
bars) for the network training and for at least 6 months for the walkforward testing.
Too much data may increase a neural model’s training period but will not
improve the forecasting quality. Additionally, some old price patterns will
simply not be valid in the current market situation. Therefore, to reduce
the input dataset you need to remove the oldest data.
Q. What types of neural networks are used in Tradecision?
A. Tradecision uses constructive neural networks. Having spent years on
research, we have discovered that some types of constructive networks
often outperform the other ones in stock market forecasting. Their main
advantage is their easy adaptability and precision. Constructive nets grow
and train themselves during iterative price data analysis.
Q. What is the target column?
A. The target column is a column that contains history for the value you
have been trying to forecast. For example, if you are trying to make a
three-day forecast of Close price , the target column will be Close.
490
Trading Strategies
Q. What is a trading system and what is it for?
A. A trading system (or strategy) is just a set of rules that unambiguously
tell you how you should trade. A trader should strictly follow a trading
system he has opted for. A sound trading strategy includes entries, exits,
and stops, as well as sound cash management rules.
This set of rules shouldn’t vary subjectively from day to day based on
broker recommendations, friends’ tips or emotions, and, therefore, can be
tested on past data to understand objectively how profitable, reliable and
suitable to your trading style these rules are.
A system approach to trading is an integral part of trading as a profession.
Every professional trader has his personal trading approach, personal
preferences and his own view on risks & profit.
We cannot offer advice on the kind of trading system that should be
chosen. Only you know what you need to improve in your trading to
achieve good results.
Therefore, it will be up to you to decide what should be included in your
personal trading plan.
Q. Can I use back-testing in Tradecision?
A. Yes, you can. With Tradecision Strategy Builder, you can create a
workable trading strategy and then historically test it to see how it works.
Prior to helping you effectively use your trading account, Tradecision will
secure you against the perils of real trading by performing a precise and
realistic trading simulation.
Simulations Manager allows you to realistically simulate your strategy on
one or several stocks simultaneously. Once your strategy is simulated, you
can analyze it strategy using buy/sell signals placed on a chart.
The Strategy Performance Report will provide detailed information on the
profitability of the strategy, risks involved, results of time analysis, and
more.
Additionally, you can receive the Trades report, providing more than 10
ratios for each of your trades as well as the Equity and Drawdown curves.
Any flaws of your trading system you have detected can be corrected. The
strategy can then be tested over again until you feel confident in using it
for making your future trading decisions.
491
Q. What is the Strategy Performance Report?
A. The Strategy Performance Report assists you in analyzing a strategy, as
well as in evaluating its suitability to your trading style and risk preferences.
The report provides over 100 performance parameters that can be used to
analyze a strategy.
The Strategy Performance Report contains 7 sections:
Summary (including Net Profit, Return on Initial Capital. Gross Profit,
Gross Loss, Profit/Loss, Commissions paid, Account Size Required,
Return on account).
Trades (including Number of profitable trades, Number of losing trades,
Average profitable trade, Average ratio, Average trade, Average days in
profitable trades, Maximum number of days in profitable trade and more).
Return (including Initial Capital, Final Capital, Return on Initial Capital,
Return on Max Drawdown, Buy & Hold return, Annual rate of return, Buy
& Hold annual rate of return).
Risk (including Gain to Pain Ratio, Sharpe Ratio, Return Retracement
Ratio, Max Equity Drawdown, Net Profit / Largest Losing Trade, Net
Profit / Max Drawdown).
Drawdown and Run-up (including Max Drawdown, Average
Drawdown, Max Run-up, Average Run-up).
Outlier Trades (including Positive outlier trades, Negative outlier trades,
Total outlier trades).
Time Analysis (including Trading period, Bars in the market, % in the
market, Bars out of the market, Average time in trades, Average time
between trades).
Q. What is strategy simulation?
A. Before you risk your trading account, Tradecision can perform a
realistic trading simulation and inform you about the performance of your
trading ideas.
Strategy analysis is a vital stage of the strategy development process. When
you insert your strategy into an active chart, a new simulation is
automatically created and all performance reports are generated and stored
in the Simulations Manager. This is the fastest way to simulate and analyze
a strategy.
With the New Simulation Wizard, you can simulate one strategy with
different symbols at once. Moreover, within one run of just one simulation
you can back-test several strategies with one symbol. In both cases, you
can easily compare the results.
492
Simulations Manager enables easily creating, running and storing any
number of simulations.
Q. What is a strategy optimization?
A. Optimization is the process of performing multiple tests while varying
the parameters used in the strategy rules or indicators. The purpose of
optimization is to discover the most profitable settings for a specific
indicator or rule when applied to a specific security.
Optimization can greatly expand your knowledge of each strategy and your
competence in what works in different types of markets. Optimization
allows you to experiment with the parameters of your strategy without
changing its main functions.
When you have tested the strategy and are confident enough about its
profitability, only then it will be the right time to start optimization.
Q. How can I manage my trading strategies?
A. Part of the Tradecision functionality is Strategy Builder - a convenient
tool for managing your trading strategies. You can create, edit, copy, or
delete a strategy, insert a strategy into a chart, and perform strategy
simulations or optimization.
Q. What is the Improvian Language?
A. Improvian is a full-featured programming language. It gives you a
variety of opportunities to implement your own trading ideas. For
example, you can design a trading system or improve an existing study or
indicator.
Tradecision makes it easy to limit losses by coding the trading rules using
the powerful features of Improvian. It is possible to create custom
functions, call DLL functions, and import trading techniques from
EasyLanguage and MetaStock. For creating advanced trading techniques,
the new language allows traders to use variables, inputs and skip words.
Q. Its pretty hard to learn using the Improvian Language, isn’t it?
A. No, it is not. The Improvian Language is a formal method with a
strictly defined but rather easy-to-use syntax. Tradecision provides a
detailed language help file, containing numerous examples and
descriptions.
493
Money Management
Q. Why using money management rules is important for me?
A. Sound money management and risk control are the key factors in being
a profitable trader. When setting up a trade, it is essential to define the
amount of risk that you are going to allow for this trade. That means
taking control of the position size, stop loss and profit target before
entering the market! That is why the conditions for closing out (exiting) a
trade are more important than the entry conditions.
When you take a proper money management approach, you are never
afraid of your losing your account.
Q. What kind of money management rules can I use with Tradecision?
A. For your convenience, the most popular money management rules are
predefined and easily accessible with an advanced point-and-click editor:
• Position size can be automatically calculated using Optimal F,
Kelly, Fixed Fractional Trades and Williams formulas;
• Several stop-loss rules can be applied with a couple of clicks;
• Trailing stop rule can also be easily defined as a combination of
predefined conditions;
• You can also opt to use a predefined Profit Target.
To test your own money management rules, you can define them using the
Improvian Language. The New Strategy dialog box contains special
controls for defining and editing your stop-loss, trailing stop and profit
target rules. You can create the same or separate rules for long and short
trades. For more information on Strategy Builder, see Working with
Strategy Builder.
Q. What are the Optimal F, Kelly, Fixed Fractional Trades and Williams
formulas?
A. The following formulas are available for dynamic position size
calculation:
Optimal F formula. This method of estimating the optimal risk
percentage has been improved by Raplh Vince. While Kelly’s formula use
only the average values from the past trades, Raplh Vince proposed to take
into account all trades.
Kelly formula - defines the optimal percentage of risk that should be
allowed to maximize the “usefulness” function presented as a logarithm of
the capital.
Fixed Ratio formula. A common problem of all those methods that use a
fixed fraction of the capital is they either maximize the capital growth
494
without taking the risk into account (i.e. the optimal f) or minimize the risk
(i.e. expose to the risks not more than x% of the capital).
Trying to solve this conflict Ryan Jones came to the conclusion that the
relation of the number of lots traded to the capital growth required for
increasing the number of lots by one (or by the minimum increment)
should be a constant .
The Larry Williams formula. A variation of the fixed ratio method
recommended by Larry Williams. The position size in units/lots is
calculated as follows:
% risk * Capital / (- Max_Drawdown) / 100.
Q. What is a Trailing Stop?
A. A trailing Stop is a stop-loss order that follows the prevailing price
trend.
This rule allows a trader to set a limit on the maximum possible loss
without setting a limit on the maximum possible gain.
495
Data Management
Q. What kinds of data feeds does Tradecision support?
A. The Data Manager subsystems support receiving data from several data
sources:
• Built-in downloader provides a quick way of receiving free end-of-day
quotes from major US and International exchanges through Yahoo
Finance data provider.
• User-configurable ASCII import wizard allows you to read quotes stored
on your local hard drive in the format defined by you.
• Built-in MetaStock® database importer reads all stocks directly from
your MetaStock database.
Q. How can I import MetaStock data?
A. You can import the entire MetaStock database (symbols and their data)
using the following procedure:
From the File menu, select Import MetaStock database.
2. In the Folders’ view dialog box, select the folder that contains the
MetaStock database.
Click Import.
Q. I have problems with importing data from ASCII files. What am I
doing wrong?
A. Data Manager is flexible enough to import most date-based end-of-day
price data. However, there are the following restrictions:
Only one Date column is allowed;
Information or blank lines between the lines of price data are not allowed;
Information following the last line of data is not allowed (i.e., total or
summary information at the bottom of the columns);
Column names for date, open, high, low, close, volume and open interest
must be labeled D or Date, O or Open, H or High, L or Low, C and
Close, V or Volume and Open Interest or OI, correspondingly.
Q. How to import data from ASCII files?
A. To import data from an ASCII file:
In the Symbol List, select a symbol, the data for which you want to import;
From the File menu, select Import symbol data and then click From text
file;
Locate the ASCII file with the price data, click the file name and then click
Open;
In the Field order box of the New Import From Text File dialog box,
select the field order you need.
In the Delimiter box, select the data delimiter that you have in the text file:
Comma, Semicolon, Point, Space, or Tab Character.
496
Note: The First data row box allows selecting the number of the row from
which your data will start in the text file. Select the Preview check box to
verify in the preview pane that your data is parsed correctly.
Click Import.
The price data will be imported into the internal database.
497
Tradecision Professional Real Time
Q. What are the key capabilities provided by Tradecision Real Time?
A. This version provides:
• All the techniques used in the regular version of Tradecision, with
the ability to be used in real time.
• Streaming, real-time quotes and displaying of 1-, 5-minute intraday
charts.
• Intraday data from IQfeed.
• Import MetaStock and ASCII intraday databases.
Q. How can I select the streaming mode?
A. The data-streaming process is started and stopped by clicking the
Start/Stop data streaming mode button on the toolbar.
Q. Where my real-time data will be saved?
A. Intraday data collected from real-time data provider(s) is kept locally on
your hard drive. The data may require a large amount of hard drive space,
depending on how many securities you are following and the periodicity
you prefer.
Q. What real-time data feeds will be supported in the future versions?
A. We are planning to add Quote.com and Prophet.net.
Q. Can I import intra-day data from a text files?
A. Yes, you can. You just need to have this file on your local hard drive.
You will able to import the required data with the help of the Import Files
Folder command or by changing a symbol's data source in Data Manager.
All new records will be imported automatically from the corresponding
file/folder when you click Update or Update Alll.
498
Keyboard Shortcuts
This page describes the keyboard shortcuts that are available in Tradecision.
The Main Window and Charts
New chart
Open workspace
Save workspace
Close Chart
Close Workspace
Next chart window
Previous chart window
Ctrl + N
Ctrl + O
Ctrl + S
Ctrl + F4
Ctrl + Shift +F4
Ctrl + Tab
Ctrl +Shift+ Tab
Scroll chart right
Scroll chart left
Scroll chart to the 1st bar
Scroll chart to the last bar
Scroll page left
Scroll page right
Right arrow OR “Mouse Wheel Down”
Left arrow OR “Mouse Wheel Up”
Home
End
Ctrl + Left arrow, Ctrl + Mouse Wheel
Down
Ctrl + Right arrow Ctrl +Mouse Wheel Up
Increase bar spacing
Decrease bar spacing
Increase bar height
Decrease bar height
Time frames
Reload prices
Crosshair On/Off
Data Window
Manage subcharts
“+” OR “Shift + Mouse Wheel Up”
“-“ OR “Shift + Mouse Wheel Down”
Ctrl + Up Arrow
Ctrl + Down Arrow
Ctrl + “1” … Ctrl + “0”
Ctrl + Shift + R
Ctrl + Shift + C
Ctrl + Shift + W
Ctrl + Shift + S
Zoom in box
Zoom back
Reset Zoom
F2
F3
F4
Insert indicator
Insert Strategy
Insert Trends
Insert Pivots
Insert single bar patterns
Insert Elliott Waves
Insert Reversal Patterns
Insert Fibonacci Clusters
Insert Custom Study
Insert Ingenious MA
Ctrl + I
Ctrl + G
Ctrl + T
Ctrl + P
Ctrl + B
Ctrl + E
Ctrl + R
Ctrl + F
Ctrl + H
Ctrl + J
Noise Removal
Revert noise removal
Ctrl + M
Ctrl + Shift + M
Model Builder
Strategy Builder
Indicator Builder
Function Builder
Simulations
Study Builder
Alert Builder
Custom time series
F5
F6
F7
F8
F9
F10
F11
F12
499
New model
New strategy
Technique dependencies
Alert History
Custom bars
Trace watcher
Data Manager
NeatScan
Streaming mode
Ctrl + F5
Ctrl + F6
Ctrl + F9
Ctrl + F10
Ctrl + F11
Ctrl + F12
Alt+ Ctrl + D
Alt+ Ctrl + N
Alt + Ctrl + S
Model Builder
New Model
Edit the Model
Copy the Model
Delete the Model
Train the Model
Analyze Training Range
Analyze Test Range
Insert Training Range
Insert Test Range
Insert Forecasted Price
Create Neuro Strategy
Save Model Output as CSV
Trace watcher
Import
Export
Help
F2
F3
F4
Del
F5
F6
F7
F8
F9
F10
F11
Ctrl + S
Ctrl + F12
Ctrl + I
Ctrl + E
F1
Strategy Builder
New Strategy
New Neuro Strategy
Edit the Strategy
Copy the Strategy
Delete the Strategy
Apply to current chart
Simulations
Optimize
Trace watcher
Import
Export
Help
F2
Ctrl + F2
F3
F4
Del
F5
F8
F9
Ctrl + F12
Ctrl + I
Ctrl + E
F1
500
Simulations
New Simulation
Info…
Run the Simulation
Delete the Simulation
Insert signals
Apply strategy to current char
Save
Trace watcher
Help
F2
F3
F4
Del
F5
F6
Ctrl + S
Ctrl + F12
F1
Indicator Builder
New
Edit
Edit Expression
Copy
Delete
Insert into chart
Trace watcher
Import
Export
Help
F2
F3
Ctrl + F3
F4
Del
F5
Ctrl + F12
Ctrl + I
Ctrl + E
F1
Study Builder
New
Edit
Copy
Delete
Insert into chart
Trace watcher
Import
Export
Help
F2
F3
F4
Del
F5
Ctrl + F12
Ctrl + I
Ctrl + E
F1
Function Builder
New
Edit
Copy
Delete
Insert into chart
Trace watcher
Import
Export
Help
F2
F3
F4
Del
F5
Ctrl + F12
Ctrl + I
Ctrl + E
F1
501
Alert Builder
New
Copy
Delete
Help
Import
Export
F2
F4
Del
F1
Ctrl + I
Ctrl + E
Custom Time Series
New
Edit
Delete
Reload All
Help
F2
F3
Del
Ctrl + R
F1
Custom Bars
Insert
Append
Remove
Move Bar Up
Down
Increase Bar Height
Decrease Bar Height
Invert Bar
Select All
Clear all
Ins
Ctrl + Ins
Del
Ctrl + Up Arrow Move Bar
Ctrl + Down Arrow
Shift + Ctrl + Up Arrow
Shift + Ctrl + Down Arrow
Ctrl + I
Ctrl + A
Ctrl + Shift + C
DLL Manager
Add
Edit
Remove
Test
F2
F3
Del
F5
Trace Watcher
Save
Clear
Ctrl + S
Ctrl + Alt + C
502
Data Manager
Update the symbol
Batch update
Import from MetaStock
Import from Text files
Export symbol data
Global Datasource change
Abridge Symbols
Add new symbol
Add from Ticker List
Start Streaming
End Streaming
Edit Properties
Edit Price Data
Clear Price Data
Holidays…
Exchanges
Futures Database
Help
F5
Ctrl + F5
Ctrl + M
Ctrl + T
Ctrl + S
Shift + Ctrl + D
Shift + Ctrl + A
Ctrl + N
Shift + Ctrl + N
F11
F12
F3
F4
F8
Ctrl + H
Ctrl + E
Ctrl + U
F1
NeatScan
New
Edit
Copy
Delete
Run
New Group
Rename Group
Delete Group
Import
Export
Help
Open chart
Open all charts
Select columns to display
Export results
F2
F3
F4
Del
F5
Ctrl + F2
Ctrl + F3
Ctrl + Del
Ctrl + I
Ctrl + E
F1
Ctrl + O
Ctrl + Shift + O
F12
F11
Progress dialogs
Stop
Pause
Alt + S
Alt + P
Improvian Editor
Check
Copy
Paste
Cut
Undo
Redo
Clear
Auto Complete
Select All
Show messages
Show dictionary
F5
Ctrl + C, Ctrl + Ins
Ctrl + V, Shift + Ins
Ctrl + X, Shift + Del
Ctrl + Z
Shift + Ctrl + Z
Ctrl + Del
Ctrl + Space
Ctrl + A
Ctrl + M
Ctrl + T
503
Print
Options -> Editor
Options -> Improvian
Options -> Code templates
Search for function
Insert function to the code
Details on selected function
Save and exit
Ctrl + P
Ctrl + F10
Ctrl + F11
Ctrl + F12
Ctrl + F
Ctrl + I
Ctrl + D
Ctrl + S
504
Disclaimer
LEGAL NOTICE:
Tradecision generates hypothetical or simulated performance results. Hypothetical or simulated
performance results have certain inherent limitations. Unlike an actual performance record, simulated
results do not represent actual trading. Also, since the trades have not actually been executed, the
results may have under- or over-compensated for the impact, if any, of certain market factors, such as
lack of liquidity. Simulated trading programs in general are also subject to the fact that they are
designed with the benefit of hindsight. No representation is being made that any account will or is
likely to achieve profits or losses similar to those shown.
ALYUDA RESEARCH IS NOT A REGISTERED TRADING ADVISOR IN ANY CAPACITY
NOR IS, IN ANY FORM WHATSOEVER, MAKING TRADING RECOMMENDATIONS OR
ADVICE THROUGH THIS SOFTWARE. ANY BUY OR SELL SIGNALS CREATED BY THIS
SOFTWARE OR ANY APPLICATION OR SYSTEM USING THE RESULTS OF THIS
SOFTWARE ARE PURELY HYPOTHETICAL AND ANY TRADES YOU EXECUTE ARE
SOLELY UPON YOUR JUDGEMENT AND ACCEPTANCE OF RISK. THE RESULTS OF
THIS SOFTWARE IS HIGHLY DEPENDENT UPON USER OPERATIONAL FACTORS,
USER SPECIFIED SETTINGS AND USER PROVIDED DATA, INCLUDING DATA
QUALITY AND CONSISTANCY. THIS SOFTWARE IS EXPERIMENTAL IN NATURE AND
ANY USE IS FULLY AT YOUR OWN RISK. PAST PERFORMANCE IS NOT ALWAYS
INDICATIVE OF FUTURE PERFORMANCE AND ANY MODELS BUILT BY THIS
SOFTWARE MAY CREATE SUBSTANTIAL FINANCIAL LOSSES, WITHOUT NOTICE, IF
YOU OR OTHERS DECIDE TO TRADE SECURITIES BASED ON THE RESULTS OF THIS
SOFTWARE. YOU ACCEPT THAT THERE MAY BE DEFECTS IN THIS SOFTWARE AND
SHALL HOLD ALYUDA RESEARCH, INC. HARMLESS FROM ANY CONSEQUENCES OF
SUCH DEFECTS OR FOR ANY OTHER CAUSE, INCLUDING THE INABILITY TO USE
THIS SOFTWARE OR ANY OF ITS FUNCTIONALITY, REGARDLESS OF WHETHER
ALYUDA RESEARCH, INC. IS AWARE OF SUCH DEFECTS OR INABILITIES.
505
Support
The Tradecision Support Team is dedicated to helping you succeed with Tradecision. That is why our
support it is easily accessible, thorough, flexible and free.
Feel free to contact us via:
E-mail
[email protected]
Internet
www.tradecision.com/support/support.htm
or
Live Support (online chat)
Phone:
(510) 931 7808 (7am - 3pm Eastern Time)
(888) 862 2759, ext. 3 (9am - 5pm Pacific Time)
Fax
(510) 279 5649
Mail
Alyuda Research
864 Terrace Dr.
Los Altos, CA 94024 USA
Please include the following information with your technical support questions:
Clear, detailed description of the problem or the question.
Is the problem reproducible? If so, how? If a dialog box with an error message was displayed, please
include the full text of the dialog box, including the title on the title bar.
Which version of Windows are you using?
For example, Windows XP, Service Pack 2.
Which version of Tradecision are you using?
On the Tradecision menu, click Help and then click About. Please include the entire "version" line in
your problem report.
506
Thank you for using Tradecision!
We wish you the best of luck in your trading!
Should you have any questions, feel free to contact
The Tradecision Technical Support Team at
[email protected]
© Alyuda Research, 2001-2009
507