1
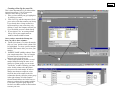
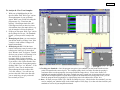
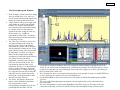
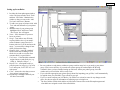
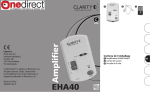
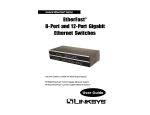
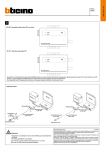
Quick introduction to STRand Software:
Basic Program Operations:
Page 2 - Setting up STRand & user preferences
Page 3 – Starting STRand & importing your files
Page 4 – Creating Locus Rules
Page 5 – Entering STRand & creating Gel Groups
Page 6 – Adding gels to your Gel Queue
Page 7 – Creating a gel Line Up
Page 8 – Finding lanes on a slab gel (not for capillary machines)
Page 9 – How to Analyze and View your samples
Page 10 – The Stuff in the Electropherogram Window
Page 11 – Setting up Locus Rules
Page 12 – What everything in the Locus Window means?!
Written by:
Melissa Locke, Eric Baack & Rob Toonen
University of California at Davis, 2000
Updated by Rob Toonen (June 2007)
Copyright © 2000, 2007
All rights reserved.
Miscellaneous Useful STRand Information:
Page 13 – Selecting and Unselecting peaks, Exporting Data
Page 14 – Comparing Samples & Superimposing Lanes
Page 15 – ResultViewer and Upgrading STRand
Page 2.
Setting up STRand software.
A. Downloading and installing
The most recent version of STRand is on the UC Davis VGL Home
Page at http://www.vgl.ucdavis.edu/informatics/STRand/
B. Setting up STRand once installed.
The updated version of this manual assumes that users do not need to
create a matrix file or dye standards for their machine. If that
assumption is incorrect and you need to configure your instrument
manually, refer to the original version of the instruction manual for the
information.
STRand configuration files are stored in an Access database
found in the STRand directory. Microsoft Access is not needed for
normal use of the program. However, you may wish to work with the
files directly if you run into a bug.
Note: Updating the STRand preferences and configuration is
an iterative process – in other words, you usually need to exit the
program and restart it for the changes that you have made to take
effect in the STRand program.
1. Computer environment Change your display settings (if needed)
to at least 1280 x 768 resolution – lower resolution can result in
program difficulties.
2. Start STRand, and choose a user name
3. Create a gel group for your data (or one for each set of data,
as this will keep things organized)
- Tools > Manage > Gel groups
- Add
- Enter the name for each unique gel group (or folder of
*.fsa files that come off a capillary sequencer) that
you wish to keep separate in your analysis
- Done
** Note: We’ll say it again: updates are iterative, so the gel groups
window in the lower right corner of the screen will not show your new
gel groups until you have exited from STRand and then restarted the
program from the newly modified database. **
4. Verify that your sequencer is identified
Tools > Preferences
Here you can set the color of the traces (dye labels) that you prefer,
the default path to the folders in which you keep your gel files and so
on. The important things to set are:
a) Default configuration – this must match the general sequencer
platform (even if the exact model number is not available) and the
complete dye set that you are using. In our case, we have an ABI
3130XL which is not included in the default list, but the ABI 3700
FVNPL (6-FAM, VIC, NED, PET & LIZ) option is equivalent and
works just fine for analyses.
b) Default size standard – this should match the size standard that you
are using to score your alleles, but can be changed in the test that is
applied.
c) Default test – this is the set of locus rules and the size standard that
you want applied to your samples in order to score the allelic sizes
(once you set locus rules – Pg 4).
The rest of the settings under preferences can be considered
personal preferences, but these three settings must generally be set
correctly in order to score your data. For example, you can
specify the directory from your data will be imported, and where
you will want results exported. (These can be the same directory,
but they don’t have to be).
8. EXIT STRand (we will want all the changes we have made to
take effect)
Page 3.
Importing a gel from the sequencer to STRand
1. Start STRand.
2. Add sample files.
File > Add Sample Files
Use the explorer window to navigate to the folder in which your
samples from the sequencer are stored on your hard drive. It is
important to include only sample files from the sequencer in that
folder because other files can confuse STRand.
3000 is sufficient to cut off the unincorporated primer fronts and
generally gives a cleaner electropherogram, but can be reduced if very
small fragments need to be scored. To be safe, this value should
initially be set to 0 and increased to an appropriate starting point after
looking at a number of gels. Generally, a value close to 3000 is about
right. Click OK when ready.
3. Check the settings. Double click on the name of the gel (run
name) in the gel queue to check that the configuration shown is the one
you expect (instrument configuration and dye set). Change to the
correct one if needed. This is also where you can delete the gel results
if you decide that the calling was incorrect and you want to start over
(e.g., with a new configuration).
4. Analyze the gel. Click on the run name in your gel queue window
to highlight it, and click on the DNA Type radio button to analyze the
gel files. This may take a moment with many lanes of data, but you
should see the progress moving along steadily on the screen.
Double-check that the instrument matches your dye set, and set the run
name to something that will make sense to you a year from now when
you have 100 gels to go through in order to find this one. Click the
Append Tube and Autonumber boxes to include all the samples in
your folder and automatically create a line-up (see Page 7) for you
(otherwise you will get unnamed samples that stop at the same number
of samples as your machine has capillaries). The Starting Scan allows
you to cut off the front of each sample. The default starting scan of
5. Check that the number of samples matches your expectation
– if you ran a 96-well plate, but only have 16 samples here or don’t
have any names associated with your samples, you most likely
forgot to check the Append Tube and Autonumber boxes when
adding sample files. Also, check to make sure that the spacing on
the alleles is consistent and that the marker names match your locus
rules that you have set (see below). Any of these being off is a sign
that something has gone wrong with the automatic gel analysis or
you have made an error in the configuration when adding your
sample files.
Page 4.
Set up locus rules for your gel analysis
You will want the lanes on your gels to be scored according to the
appropriate locus rules that you have determined. If you are working
with multiple species, or multiple people are using the same computer,
you will want unique locus rules for automatic size calling of each
locus.
1. Tools > Loci rules
Click the Add Test button
Enter the name for the species or analysis that you will perform on
your gels, and click OK.
2. Add locus rules
Select the new test name and click on Add Locus
This is simply an example – locus rules can be set using the locus
rule tool (pictured here) or programmed manually in the locus rules
window. The Process is covered in detail on Page 10, and virtually
everyone uses the locus rule tool because it makes life easy.
Repeat this process for each of the loci that you will want to score
within this test group (e.g., a species primer set or a specific
analysis).
3. EXIT STRand (we will want to incorporate the changes we just
made)
4. Restart STRand
5. Reset preferences
Tools > preferences
Make sure that the value for “Default configuration” includes the full
range of dyes for which you just defined locus rules, and change it to
the appropriate instrument and dye set configuration if it is not
already there. Click on the value for “Default test” and change it to
the test you just named that includes your specific locus rules that
you want applied to your gels and the size standard that you are
using.
Page 5.
Entering STRand:
1. Open the STRand program and the
STRand Login window should pop
up.
2. Click ‘Manage’. Once in the
‘Manage Users’ window click
‘Add’.
3. Type in your name.
4. Click ‘OK’ and then ‘Done’. Your
name should now be added to the
STRand Login window. Click once
on your name then click OK to enter the program.
You should now see this screen, the Gel
Queue.
Currently the only
folder available to store your gels is in
Equine Production. If you want to create
your own folder (Gel Group) see below.
To create your own Gel Group:
1.
2.
3.
4.
5.
On the toolbar click ‘Tools’,
‘Manage’, and ‘Gel Groups’.
In the Gel Groups box all current
gel groups are displayed and to add
yours simply click ‘Add’.
In the Input Window type your
Gel Group Name and click OK.
For STRand to activate your new
settings EXIT the program and reenter.
Once you’ve returned to the Gel
Queue window your new Gel Group
can be entered by clicking on the
down arrow in the lower right hand
box, and selecting your gel group.
4.
Page 6.
Once you have created your
own gel group you can then
add and analyze your gels:
If you are using a capillary sequencer,
your ‘gels’ are added by following the
instructions on Page 3, so skip the rest
of this page…
If you are using a slab gel machine, you
need to add your gels to your new gel
group as follows:
1. Select your gel group in the lower
right hand corner of the Gel Queue.
If you have just created your gel
group you should not see any preexisting gels in your folder.
2. Click ‘Add Gels’ and select the
file that contains your gel. (The
ABI Sequencer outputs three files
after its run; a gel file, a log file,
and a run file. The gel file contains
the gel image that you will want to
analyze.)
3. As you are selecting a gel to add
you also want to select the
appropriate instrument that your gel
was run on (e.g. ABI 377 A 96 can
be used if your gel was run on an
ABI 377 and has 96 lanes). You
may need to manually add a matrix
file and instrument configuration if
none of the available instruments fit
your needs.
4. Once you have your gel selected,
click ‘Add’ and your gel should
automatically be added to the Gel
Queue window.
Page 7.
Creating a Line Up for your Gel:
This is done automatically if you followed the
instructions on Page 3, but if you need to
change or add a line up, you will:
1. Once you have added your gel, highlight it
by clicking on it once.
2. Click ‘Line Up’ and the computer will ask
you to select a file that contains your lineup.
If you already have a lineup created in a
text document you may select that, or by
clicking ‘Cancel’ the computer will ask you
if you would like to create a blank lineup.
3. If you selected ‘Yes’ to creating a blank
line up, fill in your sample names or
numbers into the middle column.
Once you have entered the Lineup window you will see three columns:
4. LANE (left column)- To select all samples
click on ‘Lane’ and the whole column will
be highlighted. To select specific samples
hold the shift button while you select your
samples.
5. SAMPLE NAME (middle column)- Enter
your sample names here. The # of samples
you name should correspond to the # of
lanes you select in the next step.
6. TEST (right column) If you have several
samples amplified using the same set of
primers (or primer group) you can create
‘Loci Rules’ to make evaluating your data
easier. In this column select the primer
groups used for each sample. In order to
change more than one sample at a time
select the lane of the sample in the left
column then directly select the primer group
in the right column. All of the samples
selected should follow suit. In this case we
choose to evaluate all our samples with the
Locus Rules for primer group Equine1b.
See the Locus Rules section to find out how
to create your own.
P age 8
U
Finding the Lanes you your Gel Image:
Again, if you are using a capillary machine, there is
no need to find lanes on your gel, so you can skip
this entire page. If however, you are using slab gel
system, STRand needs to know where each sample
is located on the gel, and the find lanes process is:
1. With your gel highlighted in the Gel Queue
window click ‘Find Lanes’ and a picture of
your gel should appear. (If no picture appears
in the Lane Find window check that the gel you
are trying to analyze is the correct gel image
file and not the ABI run file.)
2. To select the lanes you want to view double
click in the middle of each single lane while
holding the shift key. As you double click a
numbered line should appear; #1 corresponding
to the first lane you selected, #2 to the second,
and so on. The number of lanes that you ‘find’
should correspond to the # of samples in your
lineup. To delete a lane, hold the shift key and
right-clicking on one of the nodes (white dots).
3. Adjust the lines so that they lie in the middle of
the corresponding lane by moving your cursor
over either end joint of the lane until a two-way
¤ arrow appears. Click once while moving the
arrow in the desired direction. (To get the best
readings make sure that your line passes
through all of the size standards (red bands) for
5.
that lane.)
4. You can also adjust the top (red line) and bottom
(green line ) parameters by holding the cursor over
line until a up and down arrow appears. Drag and
drop so that the bottom line (green) cuts out the blob 6.
of junk and primer dimers (if you fail to do this you
may have problems getting STRand to read the
standards correctly) but leaves at least 1 (and pref- 7.
erably 2) size standard peak(s) between it and the
lowest band you intend to size. The top line (red)
should leave at least 2 size standard peaks above your
last allele for best accuracy in size calling.
If you can not get the line to match up with your lane by just adjusting the end it is possible to adjust
along the length of the lane as well. To reshape the line set the cursor where you would like the line to
bend and hold the control key while double clicking. A new joint will appear along with a two-way
arrow that can be moved either right or left. You can also delete nodes by holding the control key and
right clicking with your mouse.
The left box of the gel file window allows you to view the vertical slice of gel corresponding to the
highlighted line (e.g.: lane 15 is selected and we can see that it passes cleanly through all the size
standards and a band ~120bp).
Use the Lane Find Settings Window to change the settings of your gel picture. Adjust the brightness by
moving the tab and clicking “Apply”. To automatically use the “Find Lanes” function adjust the height
and delta to specify how many scan lines represent a real band and the least amount of scan lines
between two bands, respectively (we actually find it easier to just find all the lanes manually like
explained in steps 2-5). Use the “Scale Image” functions to stretch or shrink the gel picture for ease of
viewing when selecting lanes.
P age 9
U
To Analyze & View Your Samples:
1. With your gel highlighted in the Gel
Queue window click ‘DNA Type’ and an
electropherogram of your gel should
appear. When your gel data is loading the
program may say, “some lane data
missing”. Just disregard and click ‘OK’.
(This happens when you have less lanes
selected than what your matrix allows, e.g.
only 90 samples but 96 wells allowed)
2. If when you first open ‘DNA Type’ and in
the Gel Image box it says, “No Standards
Found”, you may need to reanalyze the
gel.
3. Reanalyzing the Lane- you can reanalyze
just the lane itself by clicking ‘Lane’ then
‘Analyze’ on the toolbar. Changes will
happen immediately.
4. Reanalyzing the Gel– If all the lanes
require reanalyzing it may be easier to just
reanalyze the entire gel. On the toolbar
click ‘Window’ then ‘Gel Queue’. Double
click on your gel and a ‘Gel Settings’ window should pop up. It should not be
necessary unless you have changed
something with rounding or loci rules, but
if you need to, click ‘Delete Results’ then
‘Yes’ and reenter the Electropherogram by
clicking ‘DNA Type’ (or ‘Window’, ‘Your
Gel File’). Once you are back into the
Electropherogram on the toolbar click
‘Gel’ and ‘Analyze’. You will lose any
previous data, but if this is the first time
you are analyzing your gel you should
have no data yet to lose.
5. Checking your Standards - Once the program recognizes your standards you may want to make sure the
peaks correspond to the correct bp size. The simplest quality check is to make sure that the spacing is
consistent and covers the appropriate size range (unlike the image above). If not, in the ‘Peaks’ box
highlight each standard separately (like in the example next page) to make sure it corresponds to the correct
peak on the electropherogram. If a peak shows up that is not a standard, but is being read as one, you can
block the program from recognizing it by right clicking in the left column of the ‘Peaks’ box.
6. Alerts - If when you open ‘DNA Type’ and the Gel Image box says “Alleles before first standard” you may
need to readjust your included scans in the initial import of files (Page 3) so that each lane includes your
standards as well as all your amplification bands.
P age 10.
U
The Electropherogram Window:
1. In the ‘Samples’ column select then sample
/lane you would like to view. Once you
have it selected, the Electropherogram will
display the results for that specific lane.
2. ‘Graph Controls’ allow you to toggle each
color marker on or off by simply double
clicking. The X and Y zoom will allow
you to stretch a selected peak horizontally
or vertically. This box also contains a
legend for the color-coding for each dye
labeled primer (e.g. TAMRA is
represented by black peaks). ‘Gel Image’
shows the actual gel and the lane that you
are currently viewing.
3. The ‘DNA Type’ box allows you to view
your data according to the Loci Rules
specified in the Lineup. Each ‘Marker’
corresponds to a primer, and the program
will automatically estimate the size of any
peaks within the range and color specified
for that primer (see below to set up Loci
Rules). In this example primer ASB2
evaluates any FAM colored peaks between
222-258bp. The blue peak that is
highlighted is a heterozygote with two
peaks, one at 246 and one at 248. Type
corresponds to either the letter or size
designation. Pressing ‘Z’ or BACKSPACE
moves you back one marker. Selecting a
peak and pressing ‘V’ changes the pointer
to a wedge that you can click on the peak
5.
and split it into two peaks (some strong
alleles with a weak adjacent allele can be
6.
detected as a single fat peak).
4. The ‘Peaks’ box displays all the peaks
7.
that are visible within the selected lane.
For each peak there is also a
corresponding scan length, base pair size, 8.
peak height and color label. The red
corresponds to GeneScan standards, and in this example the 300bp standard is highlighted both in the
‘Peaks’ box as well as on the electropherogram. Sometimes the program will read peaks that are a result
of pull-up or stutter that you want to disregard. These peaks can be toggled on or off by right clicking in
the left column of the ‘Peaks’ box.
The Gel Image box shows a virtual gel and the lane that you are currently viewing - use the RETURN key
to move down from one sample to the next in the Samples box.
Use the SPACEBAR to move between markers of one sample on both the Electropherogram and DNA
Type box.
The x-axis of the Electropherogram corresponds to the bp length and the y-axis corresponds to the
peak scan height.
The ruler corresponds the specific marker highlighted in the DNA Type box. The range of the ruler
corresponds to the range set in the Locus Rules selected when creating the Lineup (see next section).
U
Page 11.
Setting up Locus Rules:
1. In either the electropherogram window
or the Gel Queue window click ‘Tools’
and then ‘Loci Rules’. Maximize the
window so that you can see the ‘Add
Test’ and ‘Add Locus’ Buttons.
2. To add a new group of primers click ‘Add
Test’ and enter the name of your primer
group.
3. With the name of your primer group
highlighted click ‘Add Locus’ and a
’New Locus’ box will appear.
4. Name – fill in the name of your new
locus (or primer).
5. Range – from min to max fill in the
expected alleles sizes of your amplication. Estimate a range based on a
known peak size if you do not know the
range – you can always change it later
when you know the range.
6. Example allele – enter the ‘standard’
allele to determine rounding of your
allele sizes to odd or even (the most
common allele is a good choice).
7. Use Letters – if checked this command
assigns letters to each allele size (e.g.
122bp-A, 124bp-B, 126bp-C…)
8. Repeat Unit – corresponds to the expected repeat size in bp (e.g. CACACA
* You can evaluate several primers within one group so add as many loci as you need to your primer
is a 2 unit repeat, CATCATCAT, is a 3
group. (This is most effective if you make new primer groups for each multiplex PCR being
unit repeat)
evaluated.) Once you have finished setting up each locus within your primer group, close this
9. Color – choose the color that your new
window and your Loci Rules will be ready to use.
locus primer is tagged with.
∗ If you select the appropriate test (primer group) when first importing your gel files, it will automatically
10. Repeat steps 3 through 9 until all your
be applied when you click DNA Type to analyze your gel.
loci have been added.
∗ If you ever need to adjust your Loci Rules, you will have to exit and re-enter for any changes to take
place. See the next page for information on adjusting a pre-existing locus.
∗ The list of alleles control which alleles are listed in the chooser lines on the Electropherogram and
what labels are assigned to each of the called alleles.
Page 12.
What everything in the Locus
Window means?!
1.
2.
3.
4.
5.
6.
Tests – lists all of the existing primer
groups or locus rule sets.
Size Standard – make sure the size
standard selected for the locus corresponds the standards used during
ABI sequencing run.
Loci – lists all the loci in the selected
primer group. Highlight a loci of
interest to view its parameters.
Channel – corresponds to the color
designation of that locus/primer. Blue
(e.g., 6-FAM)-Channel 1 Green
(e.g., VIC)-Channel 2 Yellow
(e.g., NED)-Channel 3 Red (e.g.,
PET)-Channel 4
Purple (e.g., LIZ) – Channel 5
Allele Info - In the ‘Allele Info’ box
are the expected sizes of the sequence
for the primer from the smallest to the
largest, spacing between the numbers
a comma, then a space, then semicolon (e.g.
122, ;124, ;126, ; and so on). If you
input even numbers the machine will
round even, and odd numbers will
round odd. In this example, we
expected an even di-nucleotide repeat
defined when creating the locus).
so we can get away with inputing the
sequence sizes spaced two bps apart. 7. Move Up, Move Down - The ‘Move Up’ and ‘Move Down’ buttons will change the order of the primers
within a primer group. The way that they are ordered in Loci Rules will determine the order in the
Analysis Script, Rounding Script,
Electropherogram window during your analysis.
and Globals - The Analysis and
Rounding Script boxes contain pa- * If you ever need to make adjustments of your locus parameters, you can do it manually by changing the
information in Boxes 1-7. For example, say in the primer group and locus above, your max range expanded to
rameters for calling and estimating
150bp and the color of your primer was actually green not yellow. First in the Allele Info box add sizes 148 and
peak sizes based on the information
150 spaces with a comma, space (or letter designation) and a semi-colon (142,L;144,M;146,N;148,O;150,P;).
in the Globals box. The Globals box
Next in the Globals box change RangeMax to be 150, M (your ‘standard’ allele to set binning) to be 146, and
contains the specific parameters for
Plane (same as Channel) to 2. Lastly change Channel box to read 2 as well.
that locus (the same ones that you
Page 13.
Miscellaneous Useful STRand
Information
Selecting and Unselecting peaks in
the Electropherogram:
The program, based on the Locus Rules,
will call any ‘normal’ alleles in the locus
range. For example, in the picture on the
right, locus ASB 2 is selected and its
range ruler is visible. The program has
called this peak a heterozygote with a 246
and 248 allele. But if you believe the
automated calling is in error, you can do
several things:
Adding a peak the program has
missed – If you see a peak, but it does
not register in the Peaks box you can
manually select it by holding shift,
clicking and dragging across the top of
it. This will add a size standard peak
when no locus is selected or when a
locus is selected a peak in the color of
that locus.
Marking or Unmarking an allele of
2.
an existing peak – If you see a peak and Basic Export of Allele Calling Data:
it is not registering as an allele of the
1. You can use the built-in ResultViewer program (see Page 15) to manage your data, or you can do a simple
selected locus, right click on it and its bp
export.
size should appear in the DNA type box.
Also use right click to unselect a wrongly 2. While in the Electropherogram, on the Toolbar click ‘File’, ‘Export Data’.
3. The program will automatically tell you how many of your lanes have problems (because of no size
called allele.
standards, invalid alleles, more than two alleles, etc. — you should have already gotten a warning about this
Changing the size of a called peak –
3.
when working with the files on your gel image) and mark them with an asterisk. You can choose to cancel
If you think the program is calling a
(i.e., go back and fix those lanes) or ignore (continue). If you do not get this message, all of your data
peak the wrong size you can change it
checks
out properly.
by clicking on the peak and then
4.
If
you
choose to continue you will need to pick the number of lanes to export, generally you want to do
clicking on the size that you think it
all of them, but if you want the data from the first 10 lanes, you can specify that.
should be on the drop down dotted line
5. An Export Results box will then appear and you must specify where you want your data file to go, and
of range ruler.
name it. Once it has been saved you can view or print the results by opening the file in Excel.
1.
Page 14.
Viewing Select Samples from Different Gels Together:
In order to view a specific sample that is located in several gels in a gel folder, you can use ‘Open Case’
to select specific samples to view together:
1.
2.
In the Gel Queue window click ‘Open Case’ and a window (like one below) will appear.
Type in the name of the sample that you want to view and click ‘Add’. The Sample List will
show all the gels that contain that sample. Use ‘Remove’ by selecting any samples that you do
not want to view and click ‘Remove”.
3. Once you have finished click ‘OK’ and an Electropherogram will appear that only contains the
lanes specified.
Superimposing Lanes in a Multi-Lane Electropherogram:
If you have two lanes in a gel that you want to view one on top of the other you can use the Multi-Lane Electropherogram function:
1. In the Electropherogram click ‘View’ and ‘Multi-Lane Electropherogram’. A Lane Selection box should pop up.
2.
In the Lane Selection box click under the lanes of interest select the dye color of the peaks that you want to superimpose. (In this example I want to see
the blue peaks all together from lanes 2, 7 and 10.) Click ‘OK’ and the MultiLane box will appear.
3. On the left of the MultiLane box it lists all the dye colors possible for the lanes that were selected. The dye colors designated by a full colored box are shown,
the half-colored boxes are not. All lanes selected for the same dye color will be represented by a different shade for ease of viewing (e.g. since only blue was
selected for lanes 2, 7, and 10 they are shown as blue for lane 2, purple for lane 7, and pink for lane 10). The X and Y switches will shrink or stretch the image
horizontally or vertically, respectively.
Page 15.
ResultViewer
Tools > ResultViewer
The ResultViewer window will launch and you have the option to examine results from a Serial selection of lanes, a
single sample, or an entire gel at once. Type in the name of the gel from your Gel Queue and click Add. Highlight the
name of the gel and click on the Show button at the bottom of the window. This will generate a table with the sample
names listed down the rows and the loci listed across columns. The first allele is listed in the column labeled with the
locus name (e.g., Pc102) and the second allele is listed in the following column. Samples highlighted in red have an
alert associated with them in the original gel file, and missing data is represented by a zero (0) entry. Scrolling the
mouse cursor over any entry cell will give a pop-up widow of the metadata underlying that calling (gel, lane, locus,
alleles called, etc…) so that you can go back to the DNA Type window and locate the sample to double-check the
calling.
The complete table can then be saved directly as an Excel data file (*.dat) or as a text file for import into whatever
spreadsheet program is preferred.
Upgrading STRand to the latest version without overwriting your existing data:
If you want to upgrade your working version of STRand to the latest version, you can find your STR.mdb
file (usually in c:\program files\strand\) and copy it to a temporary folder. Download and install the latest
version of STRand (as outlined at the beginning of the manual) and then copy your STR.mdb file back
into the STRand folder, overwriting the one you just installed. This process will transfer all of your
existing data into the new version of the software.