1
PerTrac Analytical Platform User Manual
PerTrac Version 6.0.19 New Feature Summary
1
Getting Started
16
Getting Started SQL Version
48
Single Investment Analysis
61
Single Investment Analysis SQL Version
113
Universe (Multi-Fund) Analysis
118
Optimization & Simulation
155
Portfolio Construction
175
PerTrac Investment Summary Reports
182
PerTrac Publisher Reports
187
PerTrac Reports (Universe Reports)
223
Style Analysis (Single Fund)
231
Style Analysis (Multiple Funds)
237
Peer Group Analysis
240
Portfolio Simulation and Stress Testing
248
Data Manager
254
Statistics Definitions
268
Frequently Asked Questions
282
PerTrac Tips & Tricks
286
Technical Support & Training
291
© 2006 Strategic Financial Solutions, LLC
PerTrac Version 6.0.19 New Feature Summary
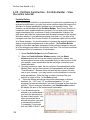
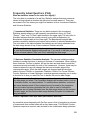
I. PerTrac ID/Investment Grouping: This feature addresses the issue of
multiple records for the same investment when multiple databases from different
investment data vendors are merged into a single, master database. Through
rigorous qualitative and quantitative comparisons of databases from different
data vendors, PerTrac can now identify investment records from different data
sources that are actually the same investment. The user has the option of
grouping duplicate investment records together so that only one record is shown
for each unique investment in the Home/Current Universe window. The other
duplicate record(s) for an investment are not deleted, but simply hidden in a tree
format. The user can prioritize the various data sources used to create the
merged database in order to determine which investment record will be the one
displayed.
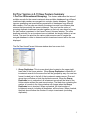
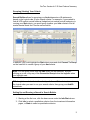
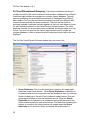
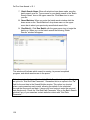
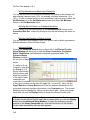
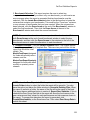
The PerTrac Home/Current Universe window also has a new look.
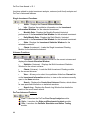
1. Group Duplicates: This is a new check box located on the upper righthand side of the Home window. When Group Duplicates is checked, all
investment records for the same fund will be grouped by way of a new tree
format, located just to the left of the investment master names. Plus and
minus signs will show or hide the duplicate records. When the Group
Duplicates box is unchecked, all investment records will be listed in the
Home window without the new tree structure. The black box containing the
number of records in the Home window will change when the Group
Duplicates box is checked. When unchecked, the total number of
investment records, including all duplicates, will be shown. When checked,
the black box will show the number of unique investments (excluding
duplicates).
1
PerTrac User Manual v.19 1
TIP: If your investment records are grouped, we have added a new drop-down
box to the lower left corner of the Investment Information, Investment Statistics
and Investment Data Monthly/Quarterly windows. The drop-down box will allow
you to easily toggle between the duplicate records from different data sources for
the currently displayed investment if your data is grouped.
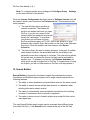
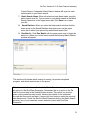
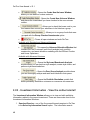
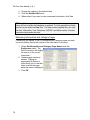
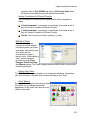
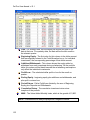
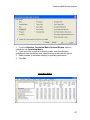
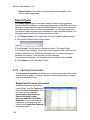
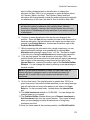
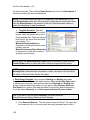
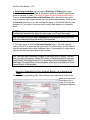
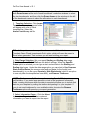
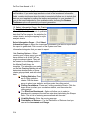
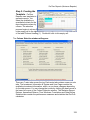
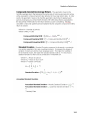
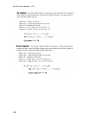
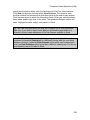
2. Configure Data Vendor
Priority: If you have multiple
databases from different data
vendors, and you wish to
merge these databases and
group duplicate investment
records together, you will
have to set a priority on which
data vendors record will display for a duplicated investment. To set your
data vendor priority, click Preferences on the upper menu bar. The first
option is Configure Data Vendor Priority. Place the data source you
wish to give highest priority at the top of the list, and on down so that the
lowest priority source is at the bottom of the list. (Based on the example
screen above, if PerTrac identified duplicate records for the same
investment from Hedgefund.net and Stark, the record from Hedgefund.net
would be displayed in the Home/Current Universe window if the Group
Duplicates checkbox was checked. The record from Stark would be
hidden by default.) This priority will also be used when creating universes
with PerTracs new Search Builder search engine, which can automatically
remove duplicate records from your results.
3. Data Source Name: In previous versions of PerTrac the data source
name was shown in a box at the top of the Home window. Now the data
source name is located to the right of the fund name.
4. New universe selection drop-down menu: Located at the top of the
Home window is a new drop-down menu containing the various universes
saved in your default universe folder. You can quickly switch the universe
that is currently open with this menu.
2
PerTrac Version 6.0.19 New Feature Summary
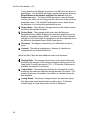
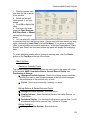
II. New splash screen for PerTrac announcements
There is a new Messages button located on the lower left side of the Home
window. Clicking this button will launch the new splash screen. Here you will find
messages about PerTrac releases, updates and other product news. To hide the
splash screen, click Messages again.
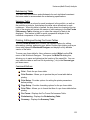
III. Soft-key Licensing
PerTrac has started the transition from the physical hard-key (USB/Parallel Port
dongle) license to an electronic soft-key license. Users who have a soft-key
license no longer need to plug any special hardware into their computers to run
PerTrac. (Note: This option is currently only available for the single user license.
The network (concurrent) softkey license will be available in the near future. Your
current hard-keys (USB/Parallel Port) will continue to work as well.) If you would
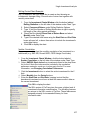
like to take advantage of soft-key licensing please follow these steps:
1. Contact Amanda Sturgeon in the U.S. at 775851-5880 ext 23. Once approved you will
receive an email with your soft-key license
number.
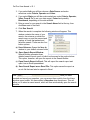
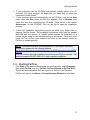
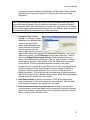
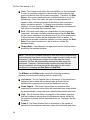
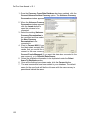
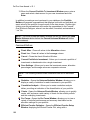
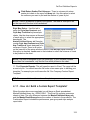
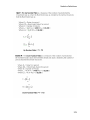
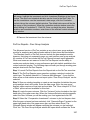
2. When you receive your 16 digit soft-key
license number, complete the License
Configuration form. To do so, click
Preferences on the PerTrac upper menu
bar. About half way down click License
Configuration. The form shown to the right
will open.
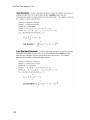
3. Key Type: Select Software Activation from the drop-down menu. Under
Software Activation Settings, enter the Product Key (your 16 digit
number), First Name, Last Name, Phone and Computer Description fields.
4. Click Save Changes/Exit.
3
PerTrac User Manual v.19 1
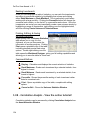
Note: To configure specific proxy settings click Configure Proxy
on the lower left side of the window.
Settings
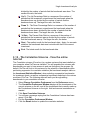
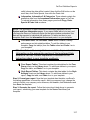
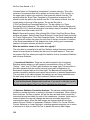
Once the License Configuration has been saved, a Software License form will
be created, which is also located on the Preferences tab. This form serves two
main purposes.
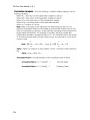
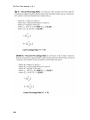
1. The new soft-key option requires an
internet connection. The license will
work for two weeks each time you open
PerTrac. If you do not connect to the
internet within two weeks the license will
have to be reactivated. To reactivate
your license you will have to phone
PerTrac technical support at 775-851-5880 to be issued a 25 digit
Activation Key number. Enter that number on this form in the Activation
Key boxes. Once the number has been entered, click Renew
Activation.
2. This form will also be used to release a license. In the past, if multiple
users shared a license, the associated hard-key would have to be
physically moved from computer to computer. The new soft-key allows
the current user to release the license so that it can be activated by
another user. To release your license, click Release Activation, at
which point you will be logged out of PerTrac. If someone else is using
the license, you will not have access to PerTrac until they release it.
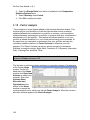
IV. Search Builder
Search Builder is a powerful new search engine that combines the current
Information and Statistics search engines into a single search engine with the
following features:
1. The ability to select qualitative and quantitative criteria in the same search.
2. The ability to search across multiple data sources in a database when
selecting Information search criteria.
3. The option to automatically remove duplicate records from the resulting
universe of investments when a search is completed.
4. The option to save your set of search criteria as a search file that can be
used again later.
The new Search Builder search engine can be accessed three different ways
from within PerTrac: (1) the Search button located at the top of the PerTrac
4
PerTrac Version 6.0.19 New Feature Summary
window; (2) the Tools menu in the menu bar; (3) the more familiar Create New
Universe button at the left of the Home/Current Universe window. The Create
New Universe window no longer contains the Select by Information Search or
Select by Statistics Search buttons. They were replaced by the single Search
Builder button. Either of these options will open the new PerTrac Search Builder
window.
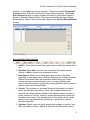
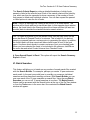
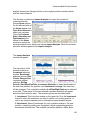
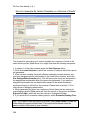
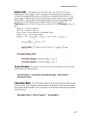
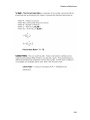
Search Builder Table Options
1. And/Or: These options control the logical order in which the search will be
run.
2. Info/Stat: Select Info to choose from Investment Information search
criteria, or Stat to choose from quantitative criteria.
3. Data Source: Allows you to select which data source to use when
searching on information fields. (Different data sources contain somewhat
different information fields; the information fields listed in the Criteria
column will depend on which data source is chosen.) Multiple data
sources can be included in a search by selecting different data sources on
different rows in the Search Builder.
4. Criteria: This is where you will select the actual information or statistic
field to be included in the search. (Note: The available statistics are
currently the same as those available in the statistics search function of
earlier versions of PerTrac. However, more statistical search criteria will
be added in the future.) The available Info or Stats fields can be viewed
either in one long alphabetically ordered list or grouped into various
PerTrac categories.
5. Operator: Equals, does not equal, greater than, greater or equal to, less
than, less than or equal to. Applies to both Info and Stat search criteria.
5
PerTrac User Manual v.19 1
6. Value: The requested value entered by the user. Applies to both Info and
Stat search criteria.
7. From: Enter the start date for the selected criteria. You can search Start
of Data (Since Inception), or enter a Month/Year.
8. To: Enter the end date for the selected criteria. You can search, End-Date
Parameter (a shortcut when running a saved search each month and you
want the statistic run through the new month end date without having to
change the end date each month), End of Data or enter a Month/Year.
9. Benchmark: This option applies when selecting correlation statistic
criteria. When a correlation statistic has been selected under the Criteria
column, the Benchmark column will light up for your benchmark selection.
(Note: When you click the down arrow to select a benchmark, you will see
a list of all your assigned benchmark universes. By default the Correl.unv
is assigned to all funds in your database. If you have not assigned
additonal benchmark universes to your funds, the Correl.unv will be the
only listed universe to choose from).
10. Period: The period options are Monthly or Quarterly.
Search Builder Tool Bar Options
1. File: Contains options for starting a new search, saving and deleting
searches, and resetting your search options.
2. Edit: Typical editing features used in spreadsheet applications: cut, copy,
paste, insert rows, delete rows, clear contents in a row, move criteria up or
down, and grouping functions to group your criteria based on And/Or logic.
3. View: Allows the user to view the Criteria lists by category or
alphabetically, and to launch the Value Hints, Options or Errors tabs.
4. Run: Run a search or check for errors.
5. Help: Contains a brief document on how to start a search.
6. Saved Searches: This drop-down menu will contain a list of your saved
searches. (Note: If you select search criteria, run the search, and then exit
without saving, PerTrac will automatically save your search for you. When
you click the down arrow saved files will be named Autosave1, Autosave2,
etc.
7. Search Name: Use this field to name your search. Once a name has
been entered, click the Save icon just to the right of the field.
8. Universe: This drop-down menu allows you to select the universe on
which you will run your search. The list will include All.unv (the universe
6
PerTrac Version 6.0.19 New Feature Summary
containing all investments in the current database) as well as any
universes saved in the Universe folder.
Search Builder Shortcut Options
These buttons appear at the right side of the Search Builder window.
1. Click Run Search! to run your search.
2. Click Move-Up to move the selected row up in the Search Builder table.
3. Click Move-Down to move the selected row down.
4. Click Add Row Above to insert a row above the highlighted row.
5. Click Add Row Below to insert a row below the highlighted row.
6. Click Delete Row to delete the highlighted row.
Value Hints, Options & Errors
These tabs appear at the bottom of the Search Button window. Information
related to these tabs is displayed in the area just above them.
1. Value Hints: This option applies to statistical criteria and will display a
definition of the selected statistic and hints related to values the user could
enter for that statistic.
2. Options: There five available options.
i.
View Criteria By option to view your Criteria selection list by
category or alphabetically.
ii.
Automatically Launch Search Report Window: This option will
automatically launch the search report when the search is
7
PerTrac User Manual v.19 1
complete. (Note: Depending on the size of your database, the
search report could take some time to run. You may want to
uncheck this box. You will always have the option to manually
run the search report when your searches have run.)
iii. Use PerTrac ID Fund Groupings and Data Vendor Priority:
This option when checked will result in a de-duplicated
universe that contains only one record for each investment
when you search is complete. In the case of duplicate records
for an investment, PerTrac will choose which record to keep in
the results universe based on your data vendor priority
selected on the PerTrac Preferences tab.
iv. Optimize Search: This option when checked allows the search
to process and evaluate criteria in the quickest order possible.
If turned on, qualitative criteria will be evaluated before
quantitative criteria regardless of the order listed in your
search. When unchecked, your search will be run in the order
you specify.
v.
Force Search Criteria to Check All Criteria: This option when
checked forces the search to find all specified criteria values
for all investments. This is useful for creating reports. By
default, which is unchecked, the search will process as few
criteria as possible to determine if an investment passes or
fails a search. For a given fund, depending on the logical
structure of your search, PerTrac may not need to evaluate all
criteria. (For example, if this option is unchecked and an
investment fails the criterion specified in the first row of the
Search Builder table and the criterion in the second row is
linked by the And operator, PerTrac will not continue checking
to see if the investment passes the criterion specified in the
second row since an investment must pass both the first AND
second criteria in order to make it into the results universe.
This allows the search to run as quickly as possible.)
Note: The one option that all users will generally wish to have checked on
a regular basis is the Use PerTrac ID Fund Groupings and Data Vendor
Priority to produce search universes that contain no duplicate funds.
3. Errors: This tab will list any errors generated when running your search.
Typically, the errors will refer to selected criteria values entered or the logical
order of your search criteria.
8
PerTrac Version 6.0.19 New Feature Summary
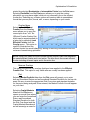
Grouping (Nesting) Your Criteria
Search Builder allows for grouping your And statements or Or statements
based on the logical order of your search criteria. For example, if you wanted to
find all HFR market neutral funds or Hedgefund.net market neutral funds prior to
running your Stat criteria, you would group together your Info criteria to find all
market neutral funds first. See the screen below.
In addition, you could highlight the Stat criteria rows and click Convert To Group
on the lower left to create a group of your And criteria.
Note: You can group funds from the Edit button on the menu bar, by rightclicking on a row, or by way of the Convert to Group button that appears when
you highlight rows.
TIP: It might be useful to first define all of your Info and Stat criteria, determine
the logical order you want to run your search criteria, then group your And/Or
statements.
Setting Up and Running a Search in Search Builder
1. Starting at the first row, click the down arrow under the Info/Stat column.
2. Click Info to select a qualitative criterion from the investment information
pages, or Stats to select a quantitative criterion.
9
PerTrac User Manual v.19 1
3. If you select Info you will then choose a Data Source and make
selections under Criteria, Operator and Value.
4. If you select Stats you will then make selections under Criteria, Operator,
Value, From & To (to set your date range), Period and possibly
Benchmark, depending on the stat selected.
5. Enter a name for your search in the Search Name field at the top, then
click Save next to that field.
6. Click Run Search!
7. When the search is complete the following window will appear. This
window contains the name of your
search; the universe on which the
search was run; and the percent and
number of funds that passed and
failed the search. There are also four
button options:
a) Save Universe: Opens the Save As
window to your default universe folder.
b) Open Search Report Window:
Search Builder generates three
detailed search reports, each of which is discussed in the section below.
This option, however, will open the reports in the Search Builder.
c) Open Search Report in Excel: This will export the search report and
open it as an Excel spreadsheet.
d) Save Search Report as an Excel File: This option saves the report as
an .xls file that can later be opened in Excel.
Once you have
TIP:
created and saved your searches, you can access them quickly from the Home
window upper toolbar. We have added a Searches drop-down menu. This will
allow you to select a saved search, which will then automatically open the search
window.
10
PerTrac Version 6.0.19 New Feature Summary
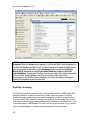
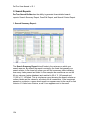
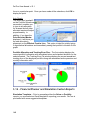
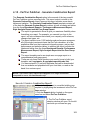
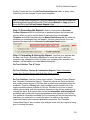
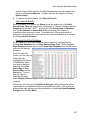
V. Search Reports
PerTrac Search Builder has the ability to generate three detailed search
reports: Search Summary Report, Pass/Fail Report, and Search Criteria Report.
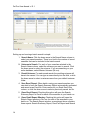
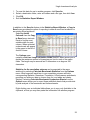
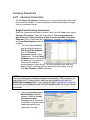
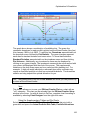
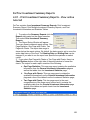
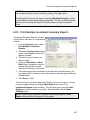
1. Search Summary Report:
The Search Summary Report lists all funds in the universe on which your
search was run. By default the report is sorted by the funds that passed your
search criteria. In the lower left corner you will find a summary table indicating
how many funds passed and failed. In this example the search was run on the
All.unv universe (entire database) and resulted in 60 of 11,145 passed and
11,085 of 11,145 failed. This is a columnar report showing the search criteria as
column labels and the values for all criteria for all investments. If the investment
passed on a criterion, a green check mark icon appears next to the result for that
criterion. If it failed on a criterion, a red X icon appears next to the result.
11
PerTrac User Manual v.19 1
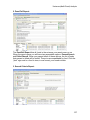
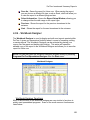
2. Pass\Fail Report:
The Pass\Fail Report lists all funds in the universe your search was run on.
When the report opens you will have two expandable options: Passed Search
and Failed Search. When you expand either of these options, the list of funds
that passed or failed will be visible. These too are expandable by fund. Click the
plus sign next to a fund to view, in row format, your search criteria.
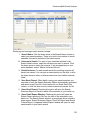
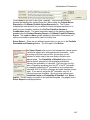
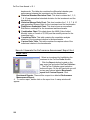
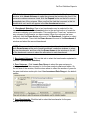
3. Search Criteria Report:
12
PerTrac Version 6.0.19 New Feature Summary
The Search Criteria Report provides a detailed breakdown of which funds
passed or failed at the criterion level. Each of the search criteria will be listed by
row, which can then be expanded to show a summary of the number of funds
that passed or failed each individual criterion. You can then expand the passed
or failed options to view the list of funds.
Note: There is a Warnings box located at the bottom of all three reports. This
window will list funds with bad or insufficient data. In this example report window
above, the funds listed in the Warnings box did not have sufficient (at least two
months) data to calculate the standard deviation search criterion.
TIP: To create a universe of just the passed funds click the save option on the
menu bar Save All Passed Funds to a universe. This is helpful if you had not
saved your passed funds as a universe prior to generating the report. In addition,
the funds listed in all three reports will have check boxes in front of the fund
name. Use these check boxes to create a universe of just your checked funds.
When you have selected the funds to be included in the universe, click File on
the menu bar and select Create Universe from Checked Funds.
4. Open Search Report in Excel: This option will export the Search Summary
Report to Excel.
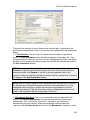
VI. Batch Searches
This feature will allow you to batch run any number of saved search files created
with the Search Builder. For example, perhaps you create 15 peer universes
each month. In the past you would have to possibly run numerous individual
searches and then save each resulting universe. With Search Builder you can
now save each of the 15 peer searches as search files. Using the new Batch
Searches you can run all 15 saved searches at one time. The Batch Search
feature can be accessed with the Search button at the top of the PerTrac window
or from the Tools menu in the menu bar. Once selected the Batch Search
window will appear.
13
PerTrac User Manual v.19 1
Setting up and running a batch search is simple.
1. Search Name: Click the down arrow in the Search Name column to
select your saved searches. There is no limit to the number of saved
searches that can be included in the batch search.
2. Universe to Search: For each of your searches selected in the
Search Name column, select the universe you want to search. Click
the down arrow to select the universe. If you are searching on your
entire database, select Master Universe (All.unv).
3. Result Universe: For each saved search the resulting universe will
have to be named. You can type a name directly into the field, or click
the down arrow to select a universe name from your default universe
folder.
4. Save Excel Report: When batch running your saved searches you
can elect to have the Search Summary Report automatically generated
and saved as an Excel file. Enter names for you Excel files in this
column, or click the down arrow to select a previously saved .xls file.
5. Open Excel Report: Checking this option will open the Search
Summary Report in Excel for each of the searches in your batch run.
6. Open Detail Report Window: Checking this option will open the
Search Report window in PerTrac for each of the searches in your
batch run. The Search Report window, as mentioned above contains
three reports: Search Summary Report, Pass/Fail Report and Search
14
PerTrac Version 6.0.19 New Feature Summary
Criteria Report. A separate Search Report window will open for each
saved search in your batch search.
7. Batch Search Name: When all selections have been made, save the
batch search as a file. Type a name for your batch search in the Batch
Search Name box on the upper menu bar. Click Save icon to save
your file.
8.
Saved Batches: When you enter the batch search window click the
down arrow on the Saved Batches drop-down menu on the upper
menu bar to select your previously saved batch search files.
9. Run Batch! : Click Run Batch! with the green arrow icon to begin the
batch run. When you run the batch search the following Batch Results
window will appear.
This window will indicate which search is running, its percent completed
progress, and which searches are in the queue.
Note: Located on the lower left side of the Batch Search window you will notice
an option for Stat End-Date Parameter. Remember this is an option in the To
field for the end date in the Search Builder window. This option is a shortcut
when running searches each month, allowing the statistic to be calculated
through the new month end date. It saves you from having to enter the new end
date each month. Check the Stat End-Date Parameter box on the Batch Search
window if any of your searches contain statistics criteria with End-Date
Parameter.
15
Getting Started
1.1 - PerTrac Installation Requirements and Instructions
System Requirements
PerTrac was designed to take advantage of the latest in hardware and
software technology and may therefore not operate efficiently on older and/or
slower hardware. The following conditions are the minimum system
recommendations:
1.6 GHz processor
256 MB memory
4 GB free space on hard disk
CD-ROM Drive
SVGA Graphics (1024 X 768 Resolution, 2 MB RAM)
17” Monitor (recommended)
Windows 2000, Windows ME, Windows NT, Windows 98, Windows
XP
Internet connection with 56 kbps modem (high speed internet
connection is strongly recommended)
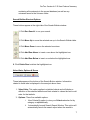
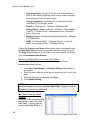
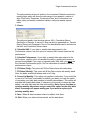
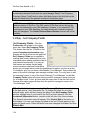
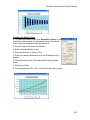
Checking System Settings
PerTrac requires that the system display be set to at least 1024 by 768 pixels
with small fonts. To check your system settings, go to Start menu, then select
Control Panel.
1. Double-click Display to open the Display Properties Window.
2. Select the Settings tab and change the Desktop Area settings to
1024 by 768 pixels.
3. Change the Font Size to Small Fonts.
4. Set the Color Palette to High Color. Click OK. It may be necessary
to restart your system for the changes to take effect.
IMPORTANT NOTE: Please take a moment to ensure that the system
date for your computer is set correctly. The security key reads the date to
which your computer is set. If the key reads an incorrect system date, the
key may fail to operate or may eventually require reprogramming.
Installing PerTrac – Individual and Network (Non-SQL versions)
The PerTrac installation CD comes with an interactive installation program
that includes several possible installation procedures. Please follow these
steps to install your PerTrac software:
1. Insert the PerTrac Installation CD-ROM.
16
Getting Started
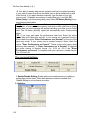
If your computer runs the CD-ROM automatically (usually within 15 or 20
seconds), the setup program will begin and you need only to follow the
instructions on the screen.
3. If your computer does not automatically run the CD-Rom, click on the Start
menu, then click Run. When the Run box appears, click on Browse, then
select the disk drive containing the CD-ROM. There will be a file named
Autorun.exe, on the CD-ROM. Click on this file to open the installation
process.
2.
4.
Follow the installation instructions required for either your Single User or
Network PerTrac license. The installation instructions cover both the parallel
and USB port key options. A network install requires the installation of a
license server setup on the machine acting as the server. Each user must
install PerTrac on their local machine and point to the network server for
PerTrac to operate properly.
NOTE: if you did not receive, the installallation CD and require installation
procedures, please visit the following website:
http://PerTrac.PerTracnet.com/per0020/web/me.get?WEB.websections.show&PER0
020_992
This site contains thorough installation instructions and PerTrac tutorials. Call
technical support 800-851-5880 x5 for help regarding installation.
1.2 - Starting PerTrac
Click Start at the lower left hand corner on your menu bar, select Programs,
then select PerTrac, then (i.e. PerTrac, PerTrac Network or PerTrac SQL).
The file will have the yellow PerTrac logo icon to the left of the file name.
PerTrac will open to the Home or Current Universe Window as seen here.
17
PerTrac User Manual v.19 1
NOTE: If you are a new PerTrac user, you will be prompted to Open an Active
Database when the Home widow appears. PerTrac will look for the databases in
the PerTrac/Database folder on your C:\ drive and open a dialog box that shows
you the contents of the folder. In this Database folder you will find a PerTrac
Blank (V5.0) database and a PerTrac Index Database. Open the PerTrac
Index Database. At this point, PerTrac is now open with a list of the benchmarks
in the PerTrac Index Database. PerTrac is now open with a list of the
benchmarks in the PerTrac Index Database. You have the ability to change or
update this database at any time as well.
Soft-key Licensing
PerTrac has started the transition from the physical hard-key (USB/Parallel Port
dongle) license to an electronic soft-key license. Users who have a soft-key
license no longer need to plug any special hardware into their computers to run
PerTrac. (Note: This option is currently only available for the single user license.
The network (concurrent) softkey license will be available in the near future. Your
current hard-keys (USB/Parallel Port) will continue to work as well.) If you would
like to take advantage of soft-key licensing please follow these steps:
18
Getting Started
1. Contact Amanda Sturgeon in the U.S. at 775-851-5880 ext 23. Once
approved you will receive an email with your
soft-key license number.
2. When you receive your 16 digit soft-key
license number, complete the “License
Configuration” form. To do so, click
Preferences on the PerTrac upper menu
bar. About half way down click License
Configuration. The form shown to the right
will open.
3. Key Type: Select “Software Activation” from the drop-down menu. Under
Software Activation Settings, enter the Product Key (your 16 digit
number), First Name, Last Name, Phone and Computer Description fields.
4. Click Save Changes/Exit.
Note: To configure specific proxy settings click Configure Proxy
Settings on the lower left side of the window.
Once the License Configuration has been saved, a Software License form will
be created, which is also located on the Preferences tab. This form serves two
main purposes.
1. The new soft-key option requires an
internet connection. The license will
work for two weeks each time you open
PerTrac. If you do not connect to the
internet within two weeks the license will
have to be reactivated. To reactivate
your license you will have to phone
PerTrac technical support at 775-851-5880 to be issued a 25 digit
“Activation Key” number. Enter that number on this form in the
“Activation Key” boxes. Once the number has been entered, click
Renew Activation.
2. This form will also be used to release a license. In the past, if multiple
users shared a license, the associated hard-key would have to be
physically moved from computer to computer. The new soft-key allows
the current user to release the license so that it can be activated by
another user. To release your license, click Release Activation, at
which point you will be logged out of PerTrac. If someone else is using
the license, you will not have access to PerTrac until they release it.
19
PerTrac User Manual v.19 1
PerTrac ID/Investment Grouping: This feature addresses the issue of
multiple records for the same investment when multiple databases from different
investment data vendors are merged into a single, master database. Through
rigorous qualitative and quantitative comparisons of databases from different
data vendors, PerTrac can now identify investment records from different data
sources that are actually the same investment. The user has the option of
grouping duplicate investment records together so that only one record is shown
for each unique investment in the Home/Current Universe window. The other
duplicate record(s) for an investment are not deleted, but simply hidden in a tree
format. The user can prioritize the various data sources used to create the
merged database in order to determine which investment record will be the one
displayed.
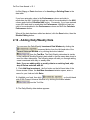
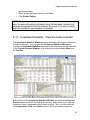
The PerTrac Home/Current Universe window also has a new look.
1. Group Duplicates: This is a new check box located on the upper righthand side of the Home window. When Group Duplicates is checked, all
investment records for the same fund will be grouped by way of a new tree
format, located just to the left of the investment master names. Plus and
minus signs will show or hide the duplicate records. When the Group
Duplicates box is unchecked, all investment records will be listed in the
Home window without the new tree structure. The black box containing the
number of records in the Home window will change when the Group
Duplicates box is checked. When unchecked, the total number of
20
Getting Started
investment records, including all duplicates, will be shown. When checked,
the black box will show the number of unique investments (excluding
duplicates).
TIP: If your investment records are grouped, we have added a new drop-down
box to the lower left corner of the Investment Information, Investment Statistics
and Investment Data – Monthly/Quarterly windows. The drop-down box will allow
you to easily toggle between the duplicate records from different data sources for
the currently displayed investment if your data is grouped.
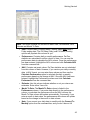
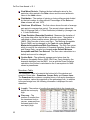
2. Configure Data Vendor
Priority: If you have multiple
databases from different data
vendors, and you wish to
merge these databases and
group duplicate investment
records together, you will
have to set a priority on which
data vendor’s record will display for a duplicated investment. To set your
data vendor priority, click Preferences on the upper menu bar. The first
option is Configure Data Vendor Priority. Place the data source you
wish to give highest priority at the top of the list, and on down so that the
lowest priority source is at the bottom of the list. (Based on the example
screen above, if PerTrac identified duplicate records for the same
investment from Hedgefund.net and Stark, the record from Hedgefund.net
would be displayed in the Home/Current Universe window if the Group
Duplicates checkbox was checked. The record from Stark would be
hidden by default.) This priority will also be used when creating universes
with PerTrac’s new Search Builder search engine, which can automatically
remove duplicate records from your results.
3. Data Source Name: In previous versions of PerTrac the data source
name was shown in a box at the top of the Home window. Now the data
source name is located to the right of the fund name.
4. New universe selection drop-down menu: Located at the top of the
Home window is a new drop-down menu containing the various universes
saved in your default universe folder. You can quickly switch the universe
that is currently open with this menu.
21
PerTrac User Manual v.19 1
New splash screen for PerTrac announcements
There is a new Messages button located on the lower left side of the Home
window. Clicking this button will launch the new splash screen. Here you will find
messages about PerTrac releases, updates and other product news. To hide the
splash screen, click Messages again.
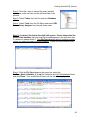
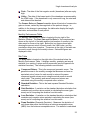
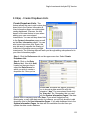
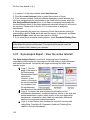
2.00 - View Default Folders
When PerTrac was installed on your computer, a number of sub-folders were
installed as well. These folders are the default folders where you will save and
open files created in the PerTrac modules. To view the default folders, or to
change paths to your folders, click Help on the PerTrac upper menu bar and
select View Default Folders.
1. Application Path: This folder is
typically located on you root
directory and contains all of the
PerTrac program files.
2. Current Database: This will
show the database currently
open in PerTrac.
3. Default Database: This will
show the path to your default
database, which opens each
time you launch PerTrac.
4. Universe Folder: Default
universe folder where your
(.unv) universe files will be
saved.
5. Charts Folder: When creating and saving charts in PerTrac, the files will
be saved to this folder.
22
Getting Started
6. Peer Folder: When creating peer databases for analysis in the peer
module, all files will be saved to this folder.
7. Style Folder: When creating style databases for analysis in the style
module, all files will be saved to this folder.
8. Simulation Folder: When creating and saving simulation table and chart
files all files will be saved to this folder.
9. Reports Folder: All PerTrac Reports .tpl files will be saved to this folder.
10. Search Folder: All saved search files created in the Search Builder will be
saved to this folder.
11. Description Files Folder: By default all data vendor description files will
be located in this folder, typically the same as the application folder.
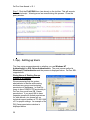
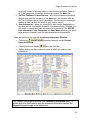
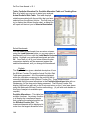
Description Files
A database may contain items from several different sources (data vendor or
user entered data). Each data source has its own collection of field labels to
accompany records. In the example above, for instance, the Data Source is
“User”, as indicated in the Source field just above the second column of
check boxes.By the time the Investment Information window opens,
PerTrac has identified the data source for the current investment and supplies
the appropriate labels for each text box and check box.
These labels are initially stored and accessed from your “C:\PerTrac” folder
(or another directory where you’ve installed program). The example above
shows the “General” page of the Investment Information window (which is
just 1 of the 25 pages that use description files) and displays the labels found
in “User.des”. The following is a complete list of file extensions associated
with pages in the Investment Information window:
Investment Information Page
General
Description File
{DataSource}.des
Information Windows 1 - 6
Categories Windows 1 - 6
User Information Windows1 - 6
{DataSource}.ilf
{DataSource}.clf
User.ulf
User Categories Windows 1 - 6
User.ucf
TIP: If you move your default folders, or create default folders, to your shared
drive, click the locate button at the end of each path to re-map your default
folders.
23
PerTrac User Manual v.19 1
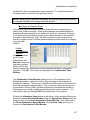
1.4 - Understanding Databases
PerTrac is an application that queries data within a Microsoft database formatted
for PerTrac. Prior to performing any analysis with PerTrac, the User must first
select a Database of investments. When opening PerTrac for the first time, most
users open the PerTrac Index Database (see Section 1.2). However, the
PerTrac Index Database that comes pre-loaded on the CD-ROM should be
updated as soon as possible.
There are also numerous data vendor databases that provide investment
information that can be analyzed within PerTrac. All of the databases listed below
needs to be updated monthly or quarterly to ensure you have access to the most
current investment data. Instructions on how to update your data can be found in
section 1.6. In addition, each of these data vendor databases can be viewed
separately in PerTrac, or can be merged to create a larger, Master Database.
Instructions for merging databases together can be found later in section 1.6.
Please NOTE, however, that the Home/Current Universe widow can hold a
maximum of 32,766 investments.
NOTE: The 32,766 investment limit only applies to the Microsoft Access version
of PerTrac. The SQL version of PerTrac has no limit on the amount of
investments.
The PerTrac Blank (V5.0) database is a blank Microsoft Access database that
can be used to create your own propriety database of investments. You may
merge this database with vendor databases as well.
NOTE: Our technical support staff sends email notifications to all of our clients
when a database update has been posted to our site. Upon receipt of the email,
follow the instructions in section 1.6 to quickly update your data.
Complimentary Databases http://pertrac.pertracnet.com/per0020/web/me.get?WEB.websections.show&PER
0020_1001
Subscription Based Databases http://pertrac.pertracnet.com/per0020/web/localdata/WEB/DATA/WEBSECTION
S]MATTACHMENT/PER0020_872//NewPriceListTriFoldlimiteddescriptionsSep04.pdf
24
Getting Started
1.5 - Understanding Universes
As mentioned above, all analysis within PerTrac starts with a database of
investments. However, much of the analysis you will perform with PerTrac will be
done at what we call a Universe level. A Universe is defined as any subset of
investments contained within a database. The file extension for Universe files is
“.unv”. A universe may consist of (1) fund or investment, 10 funds, 100 funds or
an entire database. A universe could consist of fund of funds, the managers
within a portfolio, benchmarks, convertible arbitrage managers, large cap value
managers, etc. Universe creation and analysis will be addressed in Part III –
Multiple Investment/Universe Analysis.
NOTE: As a user of PerTrac you could create hundreds of universes over time.
However, there are two system universes you should be aware of that were
installed on your computer when you installed PerTrac: the “All.unv” and
“Correl.unv”. These files are located in the PerTrac/Universe sub-folder on your
computer, and should not be deleted. The All.unv contains all of the investments
in the database. The “All.unv” file was created for the Load Master Universe
function. When you click this button, the entire database of investments will be
loaded into the universe window for analysis. The Correl.unv is a universe
created as a comparative benchmark universe. When you perform
regression/correlation analysis or create charts where you utilize comparative
benchmarks, PerTrac looks for the Correl.unv file for benchmark selection.
Think of Correl.unv as a list of the common benchmarks you use for most
investments.
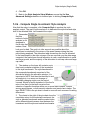
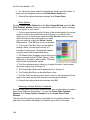
FAQ: How do I add benchmarks to the Correl.unv universe? At the
Home/Current Universe window, click the Preferences tab on the menu bar.
Then select the first option, Change Default Correlation Preferences. This will
open a two-box window. The box on the left will list all of the investments in your
current database, which will include over 1,000 indices if you download the free
PerTrac Index database. (Remember: PerTrac provides more than 1,300 indexes
to choose from in the Index Database, or you may enter your own data.) Use the
scroll bar in this window to locate the benchmarks you wish to add to the
Correl.unv file. Highlight the benchmark then click ADD on the menu bar. This
will add the benchmark to the box on the right. When you have added all the
benchmarks you want, click the Save Correlation Universe button.
25
PerTrac User Manual v.19 1
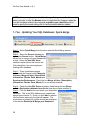
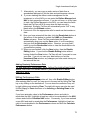
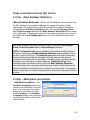
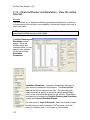
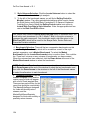
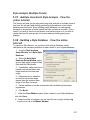
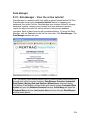
1.6 - Updating Your Databases: Automated Update - View
the online tutorial!
Any database to which you subscribe, and PerTrac’s free index databases,
should be updated monthly. This will insure that you have the most current
investment data in the database(s). We have added an Automated Update
function to the Tools tab in PerTrac to facilitate updating database information in
PerTrac. The following instructions will explain the process for updating your data
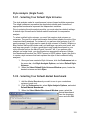
with the Automated Update feature.
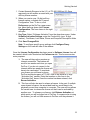
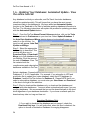
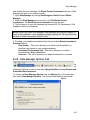
Step 1: From the PerTrac Home/Current Universe window, click on the Tools
tab located next to Preferences on your icon bar. Select Update Database. If
the Auto Data Update and Merge window does not automatically come up,
select it on the tool bar. An
input box will appear: Auto Data
Update and Merge.
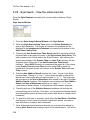
Step 2: Select the appropriate
database(s) to download. This
window will allow you to
Download Only or Download &
Merge up to five databases from
our website. Click the arrow at
the end of Database 1 line. This
list contains both the
complimentary and subscription
databases available in PerTrac.
Select a database. Proceed with
Database 2, 3, 4 & 5 if applicable. For example, if you subscribe to HFR and
would also like to update your index database, select the HFR database for
Database 1 and the PerTrac Indices for Database 2. Please NOTE that if you
select a subscription database, you must enter your User Name and Password
in the box to the right of the selection.
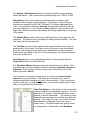
Step 3: Elect to download the database only, or download the database and
merge it with other databases. You must select a download path even if you are
merging databases. We recommend that you set the download path to the local
drive regardless of your database destination. If you chose a network path, the
download may take too long and time out.
Download Database Only
1: If you wish to download the database and not merge it, check the
Download Only box. You will notice that, when this box is checked, the
option to choose a Destination Database for merging disappears.
26
Getting Started
2: Click the Download Folder button at the end of this box. The path you
select here will be the location to which the database will be extracted.
3: Enter your license number in the boxes provided if it does not
automatically display.
TIP: If you do not have your license number, click on Help in PerTrac, and
then select About PerTrac. Write down the alpha-numeric license
number located on the left.
4: Check the box below the license number to delete the compressed
WinZip file that has been downloaded (Delete Downloaded Zip File).
There is generally no reason to keep this file on your computer once the
database has been extracted. If you leave it unchecked, the zip file with
the database will reside in you specified download directory.
5: Now that you have made your selections, you can save your settings
for the next time you update data. Click the Save Settings button. When
the Save As box appears, name your settings file, then click Save. The
next time you download data, click the Load Settings button at the lower
left to load your saved selection criteria.
6: Click Go. The database will be downloaded to the selected directory.
Download & Merge Your Databases
1: Do not check the box Download Only. There is now a second box
below Download Folder, named Destination. Click the Destination box
to locate the database you want to merge the selected databases.
NOTE: If you do not have a current merged (Master) database, follow
step 2 below to create one.
2: If you want to create a new merged (Master) database click on the
Create Database button. A box will appear prompting you to name and
save your new Master database. Enter the file name in the File Name box
then click Save. The Save box will close and you will be back to the
Automated Update Database window. You will now receive a
confirmation message that your blank Master database has been created.
Click OK when this message appears.
3: Enter your license number in the boxes provided if it is not displayed.
TIP: If you do not have your license number, click on Help in PerTrac, and
then select About PerTrac. Write down the alpha-numeric license
number located on the left.
4: Check the box below the license number to delete the compressed
WinZip file that has been downloaded (Delete Downloaded Zip File).
There is generally no reason to keep this file on your computer once the
database has been extracted. If you leave it unchecked, the zip file with
the database will reside in your specified download directory.
27
PerTrac User Manual v.19 1
5: The second available checkbox allows you to Delete Unzipped
Database(s) that were selected at the top of the page. If you have merged
the databases and don’t want to have individual databases as well, check
this box to delete the uncompressed database after it has been merged. If
you leave it unchecked, you will have one Master Database with all the
merged data and individual databases as well.
6. The third checkbox allows you to Synchronize Performance. This
checkbox should rarely be checked. Once checked, PerTrac will take
each item in the source database and make an exact duplicate in your
destination. This will take considerable time. It is useful, however, if you
want to clean up your data to match the vendor download. For example, a
manager may have been supplying 20 years of data to the database
vendor when he decides he would only like to start displaying 10 years
and remove the pro-forma history. PerTrac will not remove the history
without the Synchronize Performance button checked. PerTrac will only
look at the supplied data from the vendor and update your local database
with the checkbox off.
7: Now that you have made your selections, you can save your settings for
the next time you update data. Click the Save Settings button. When the
Save As box appears, name your settings file, then click Save. The next
time you download data, click the Load Settings button at the lower left to
load your saved selection criteria.
8: Click the Go button to start the update
process. When the update is complete,
“Done” will appear in the bottom left
corner of the window. In addition, an Error
Log will be generated. If your destination
database is open, the log will display a
message stating it could not compact the
database. This is normal, and you may
compact the database at another time.
Clear the log and Exit. Every sixth time
you exit PerTrac you will be given the
opportunity to compact the database. We recommend that you compact
the database often - at least once a week. See Database Maintenance for
further discussion on this topic.
When the download process is complete, the updated
database(s) can be opened in PerTrac. If you selected Download
Only, the updated database(s) will be located in the folder that
you selected prior to downloading. In PerTrac, click on File\Open
New Database and select the database. If you elected to
Download & Merge your database(s) with an existing Master
Database using the Destination button, and that database was
28
Getting Started
open in PerTrac, simply click on the Load Master Database button
on the left side of the Home window to update/reset the Master
Database. If you elected to Download & Merge and the Master
Database was not open in PerTrac, click File\Open New Database
and select the Master Database.
NOTE: Updating databases may take time. Data Manager
backs up your database prior to updating. You can disable the
automatic backup by clicking on the Data Manager Options tab
and uncheck the option “Always Back-up the Destination
Databases”. The update may take time. Data Manager by
default backs up your database prior to updating.
TIP: If at any time in the future you wish to view a tutorial further illustrating the
use of the Automated Update feature, click on this link.
http://support.PerTrac2000.com/tutorials.asp
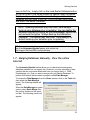
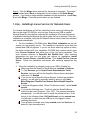
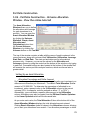
1.7 - Merging Databases Manually - View the online
tutorial!
The Automated Update feature allows you to download and merge any
database available on our support site. However, you may subscribe to data
vendors that do not provide downloads from our support site (i.e. TASS,
Eurekahedge, etc.) that you want to merge with your Master Database. To
perform this task we have created a program called Data Manager.
To access the Data Manager from the Home window, click on the Tools tab,
then select the Data Manager
option. The following window will
appear.
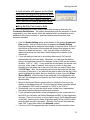
When the Data Manager program
opens, select Quick Merge from
the options located on the upper
tool bar. The following screen will
appear:
29
PerTrac User Manual v.19 1
To merge databases together only two steps are required. Click on the
Source Database button. A file window will open allowing you to select the
database you want to merge. Select your database and click Open. The path
will be listed in the box to the right of Source button. The next step is to select
the database you wish to merge the database into. Click the Add button. A
window will open for you to select your destination database, usually a
Master Database. The path to the destination database will be listed to the
right of the Add button. Once the selections have been made, click the Merge
button. PerTrac’s default settings back up the destination database prior to
writing. This will take time. DO NOT EXIT THE APPLICATION. Allow it to
finish. The word “Done” will appear in the bottom left corner of the window
when the merge is complete. Close Data Manager. As mentioned above, if
the Master Database was open in PerTrac when you merged with the Data
Manager, simply click on Load Master Universe to update your database to
reflect the merged data. If the Master Database was not open, click
File\Open New Database to select the destination database.
Quick Merge can also blend a small universe of managers and data into a
database. The checkbox labeled Merge by Universe should be checked if
that is the desired action. Once you check the box, you will be prompted to
find the .unv file that contains the list of mangers to merge. Find it and click
Open. The button labeled Merge All User (Description, Information,
Checks, Data, Memo) should be used if you are transferring user entered
funds with custom qualitative information. If you do not check that option, any
data that you entered in either the User Information or User Categories
Pages will not be transferred. Synchronize Performance was explained in
the section titled Download and Merge Database.
NOTE: The maximum number of investments allowed in the Home/Current
Universe window is 32,766. This is the PerTrac database limit.
TIP:It is always good to backup your data when prompted. We will examine
database maintenance in the following section.
To view additional Data Manager features please refer to Section VIII of this
manual.
1.8 - Database Maintenance - View the online tutorial!
Most of the databases that our clients use contain hundreds or thousands of
investments. As the databases grow in size, or as the number of users increases,
the potential for corruption increases. Once a database has become corrupt
there is a good chance that some or all of your data will be lost. However, there
are preventive measures that will reduce the chance of database corruption.
30
Getting Started
Compacting and Backing up your data: Compacting is a file
maintenance tool. It is very important that you compact your database at least
once a week, if not more often. This is even more important if you are working
with other users on a network. The compacting process will keep the file
structure from becoming corrupt. PerTrac will prompt you on a regular basis,
when you close the program, to compact your database. Please compact. You
can also compact your database at anytime from the Tools/Data Manager
option within PerTrac.
!!! NOTE:Do not use Ctrl-Alt-Del while compacting a database. This action will
actually corrupt your database to the point that all data will be lost. Let the
process finish even if your task manager says it is not responding.
TIP: For more technical preventive and repair measures, have your IT
department review this Microsoft Access Database site.
http://support.microsoft.com/default.aspx?scid=kb;en-us;Q306204
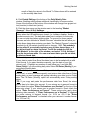
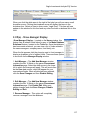
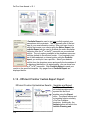
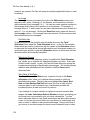
1.9 - Adding Investments and Performance Data to a
Database - View online tutorial!
PerTrac allows you to enter or
import your own investments,
returns and data into your
database. To add a new
investment, use the Add New
Investment button. This
button can be found in the top
left corner of the PerTrac
Home window. This is the easiest way to enter funds into the database. If you
need to import a number of funds, please call tech support and we can give you
details on using the Import function within Data Manager. Once you click the
Add New Investment button, PerTrac will prompt you to Enter New Investment
Name. The name you enter will be displayed as a record in the database just as
any other manager and/or index. Notice that there is a dropdown box for Data
Source. PerTrac’s default Data Source is User, which allows the client to enter
qualitative and quantitative data that will never be erased or overwritten by a data
download. Once you enter a name for a new investment, the window will
disappear and put you back at the home window. Find and highlight the
investment name that you just entered and click the Investment Data Monthly/Quarterly button (if you are entering monthly or quarterly returns) or the
Investment Data - Daily/Weekly button (if you are entering daily or weekly
data). You can also open the Investment Data Windows by clicking the buttons
labeled Monthly Data or Daily/Weekly Data from the Tool Bar. Entering
monthly, quarterly, daily or weekly data will be explained below.
31
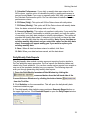
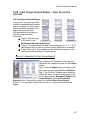
PerTrac User Manual v.19 1
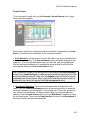
The Investment Data Window allows you to view and edit the performance data
for the current investment.
At the top of the window are fields showing the investment, fund name; start and
end dates; and the number of monthly periods in the data table. Below these
fields is the standard data table. For data-vendor provided files, the data table is
updated each time the user downloads an updated database for that vendor.
User investments, however, must be updated manually.
The data table includes columns for Date, Performance (percent return), Funds
Managed, NAV (Net Asset Value), VAMI (Value Added Monthly Index), and
Cumulative Return. The data table also contains an Estimate column, which
allows you to flag the rows of data that contain estimated performance values.
Only the first five columns require data entry, while the VAMI and Cumulative
Return columns contain locked cells that PerTrac calculates automatically.
The Previous and Next buttons at the bottom of the screen allow you to view
data from other investments within your universe. Finally, the Statistics and
Information buttons allow you to move directly to those windows.
When you enter a new investment in PerTrac and click Investment Data, a
window will appear, indicating that the investment does not have performance
data. Click OK.
32
Getting Started
A small window will appear on the blank
data sheet giving you the option to enter
performance quarterly. If you want to
enter monthly performance click No. Click
Yes if you will be adding quarterly data.
Adding Monthly Performance Data
All new investments will initially require that a data stream is entered in the
Investment Data Window. All existing investments (with the exception of those
supported by your data vendor, which are updated when you download a new
database) also require monthly or quarterly updates as performance data
becomes available.
1. Click the Enable Editing button at the bottom of the window Investment
Data window. Notice how the button is renamed as Disable Editing.
Enabling editing allows additional functionality to become active. Some of
the buttons at the bottom of the window will change from grayed out text
(inactive) to black text (active). Also, you will notice a formula bar
appears just above the data table, which displays the contents of the
current cell.
2. If you are adding a new row to an existing data record, PerTrac will
automatically fill in the next date. Otherwise, you can enter the date by
typing it in month/year format (For example January 1990 can be entered
as either “1/90” or “1-90”). If you would like to enter dates for several rows
at a time, enter a date in one cell, then use your mouse to drag and
highlight from the dated row to the end of the cells you wish to date, then
click Fill Dates. Also, the month/year date format assumes that the date
is the first of the month. If you want all the data to reflect the last day of the
month highlight all the dates that you would like to alter, then click Dates
(End of Month). While the day of the month will not be displayed in the
cell itself, the change can be viewed in the Cell Contents Field, just above
the data table.
3. Move to the Percent Return column either by hitting the Tab key or by
clicking on the appropriate cell. Enter the percent return in percent format
(For example 2.54% could be entered as “.0254” or as “2.54%).”
4. Alternatively, you can copy an entire series of data from a spreadsheet
and paste it into the date and performance columns.
5. If you are tracking the dollars under management for the investment or a
fund NAV you can enter the Dollars Managed and NAV in their respective
columns. If you do not know, or do not care to track, the Dollars Managed
or the NAV, you may leave those fields blank and PerTrac will fill in zeros
when the data record is calculated. Similarly, PerTrac will automatically
enter “NO” in any blank cells in the Estimate column.
6. Continue to fill in the appropriate cells for each row that contains a date.
33
PerTrac User Manual v.19 1
7. Once you have entered all the data, click the Recalculate button at the
bottom of the window to update the VAMI and Cumulative Return
columns. Since PerTrac recalculates the figures automatically when you
use the Save option, it is not mandatory that you click the Recalculate
button. However, you may find it useful to use the Recalculate button to
view the recalculations before saving.
8. When you are finished, click the Save button, then the Disable Editing
button. If you click the Disable Editing button without having clicked the
Save button, PerTrac will ask if you want to save your data. If you do not
save your data before you exit the Investment Data window, any changes
you have made since your last save will be lost.
Adding Quarterly Performance Data
To add quarterly investment data, follow the instructions listed
above but click YES when asked if you would like to enter
quarterly data.
Editing Performance Data
To edit data, highlight the appropriate cell, then click Enable Editing . After
entering data in a cell, you can move to the next cell by hitting the Tab key or by
clicking on the desired cell. You can clear the contents of any cell by right
clicking and selecting Clear. The right-click menu can also be used for Cut,
Copy, or Paste functions or for Inserting or Deleting Rows in the data table.
If you have entered a value in the Performance column and wish to calculate the
NAV, highlight at least two cells to be calculated in the NAV column and click the
Calculate NAV button. Conversely, if you have entered a new NAV and wish to
calculate the Performance, highlight at least two cells to be calculated in the
Performance column and click the Calculate Performance button.
When all the data has been edited as desired, click the Save button, then the
Disable Editing button, as before.
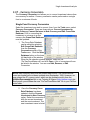
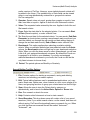
Updating User Entered
Investment Returns
Although the Investment Data
Window allows you to edit all the
data for a single investment, you
may wish to enter data for several
investments at once, such as when
new monthly performance data
becomes available. This can be
accomplished by using the monthly
data entry form.
34
Getting Started
1. From the Tools menu, select Monthly Data Entry Form.
2. In the Date box, (bottom left corner) enter the month and year for which
you would like to enter data.
3. Click the Load button. PerTrac displays all the data for each investment
in the current universe for 3 consecutive months, ending with the month you
selected.
4. Enter and edit the data as needed.
5. Click the Save button. If you do not save your data before you exit the
Monthly Data Entry Form window, any changes you have made since your
last save will be lost.
6. Exit the Monthly Data Entry Form.
TIP: Be sure to open just the universe of investments you wish to update at the
Home/Current Universe window. When you click the Load button on the form
shown above, PerTrac will load the universe listed in the Home/Current Universe
window. If you have the entire database open, which could consist of thousands
of funds, when you click the Load button your system may freeze.
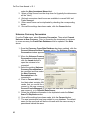
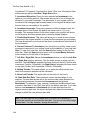
Adding Daily/Weekly Data
You can open the Daily/Weekly Investment Data Window by clicking the
command button from the left-hand side of the
Current Universe Window or by clicking the button labeled
from the Tool Bar. The Daily/Weekly data sheet is similar
to the traditional Monthly/Quarterly data sheet in that the same data sheet is
used for either data series. The following steps will walk you through adding
a new investment with daily or weekly data.
Note: If you are adding daily or weekly data to an existing fund, skip
step #1 below and start with #2.
1. Click Add New investment , the first button on the left hand side of the
Home window. When the Add New Investment window opens, enter a
name for your fund and click Enter.
2. Highlight your fund, then click
on the left-hand
side of the Current Universe Window or by clicking the button labeled
from the Tool Bar.
3. The Daily/Weekly data window appears:
35
PerTrac User Manual v.19 1
Note: This sheet contains five columns of data: Date, Performance, NAV,
Estimate and Month To Date.
36
•
Date: Contains daily or weekly dates. Weekly dates must have a
Friday ending date. The Fill Dates (Daily) and Fill Dates (Weekly)
options will populate this column for you.
•
Performance: Contains daily or weekly performance. PerTrac
statistics are calculated from this column of data. You can use the
performance data to calculate the NAV column. Once the performance
has been entered, highlight the NAV column and click Calculate NAV
from the command bar.
•
NAV: Contains net asset values. PerTrac statistics are not calculated
from this column of data. However, if you receive your daily or weekly
data in NAV format, you can enter those values and then use the
Calculate Performance option to calculate the daily or weekly
performance based on the change in NAV. Once the NAV has been
entered, highlight the Performance column and click Calculate
Performance from the command bar.
•
Estimate: Use this column indicate whether or not you returns are
estimates. Enter either Yes or No.
•
Month To Date: The Month To Date column is linked to the
Performance column. If you enter data directly to the performance
column, or calculate the performance from the NAV column, the
Month To Date column will update automatically. Conversely, if you
enter a month to date value, the performance will column will update
based on the change in the month to date column.
•
Note: If you convert your daily data to monthly with the Convert To
Monthly option from the command bar, and you don't have a full
Getting Started
month of data, the return in the Month To Date column will be entered
on the monthly data sheet.
4. Click Enable Editing at the bottom of the Daily/Weekly Data
window. Enabling editing allows additional functionality to become active.
Some of the buttons at the bottom of the window will change from grayed out
text (inactive) to black text (active).
5. Click the down arrow on the window next to the heading "Market
Closures". Select U.S.A. Holidays.
Note: When entering daily data there will be numerous days throughout
history when the US markets were closed. (i.e. holidays, weather, world or
economic events, etc.) The daily data sheet has to account for these day.
You can not skip days when entering data. To account for those market
closures, we have included a "Market Closures" schedule that will allow you
to skip those dates when entering your data. The "Market Closures" schedule
accounts for all US market closures back to January, 1965. This schedule
can be edited if you actually traded on any of these closed days, or if
you did not trade on dates not listed. To edit the schedule click the
"Edit Markets" to the right of the window, and select "U.S.A. Holidays"
from the drop-down menu. You can now insert dates you did not trade,
or delete a closed date.
6. Your daily or weekly data can be copied from Excel or entered manually.
If your data is copied from Excel the dates have to be formatted with a valid
Excel format. If you enter the dates manually, type the date of your first
return in cell 1. Highlight any number of rows below row 1 and click Fill
Dates (Daily) if you are entering daily data. Select Fill Dates (Weekly) if you
are entering weekly data.
NOTE: Weekly data must have a Friday end date. If you copy weekly data
from Excel, or enter your data manually, and enter a date other than a Friday
ending date, an error message will appear indicating your date is not a Friday
date. The Fill Dates (Weekly) option will automatically enter Friday ending
dates.
TIP: If you copy and paste the performance data from Excel, the return
format has to be taken into account. If your returns are in percent format in
Excel check the option "Enter Performance as a Decimal" on the top of the
data entry sheet. If your returns are in number format in Excel check the
option "Enter Performance as Percent". These options also apply when
entering data manually. If "Enter Performance as a Decimal" is checked
you enter returns in decimal format. (i.e. 2.0% as .02) If the "Enter
Performance as Percent" is checked enter your returns in number format.
(i.e. 2.0% as 2.0)
37
PerTrac User Manual v.19 1
The command buttons:
1. Enable/Disable Editing: Enable edit must be selected prior to adding or
editing data on this sheet. When data has been entered or edited click
Disable Editing to exit and save your data.
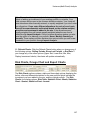
2. Statistics:
The daily statistics window is similar to the Investment Statistics window for
monthly data, which will show the date range of your analysis, number of
days, Risk Table, Drawdown, Consecutive Gain, and Consecutive Loss
tables, daily and weekly correlation statistics, daily and weekly capture
ratios.
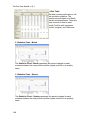
3. Charts:
The daily and weekly chart window options: NAV, Cumulative Return,
Distribution of Returns. A second Y-Axis can also be generated on: Percent
Rate of Return and Drawdown. One or Two benchmarks can be included on
the NAV and Cumulative Return charts.
4. Calculate NAV: If your daily or weekly data was entered in the
Performance column, use this option to create a NAV stream based on the
performance.
38
Getting Started
5. Calculate Performance: If your daily or weekly data was entered in the
NAV column, use this option to calculate the daily or weekly performance in
percent format. Note: if you copy or manually enter NAV data, you must use
the Calculate Performance option. PerTrac calculates all statistics from the
performance column.
6. Fill Dates (Daily): This option will fill the Date column with daily dates.
7. Fill Dates (Weekly): This option will fill the Date column with weekly dates.
Note: the dates entered will always end on a Friday.
8. Convert to Monthly: This option only applies to daily data. If you would like
to use all of PerTrac's functionality to analyze your data, you have the option
of converting your daily data streams to monthly data streams. This option will
populate the monthly data sheet. If selected, your fund will not have two data
sheets, one with daily data the other with monthly. Note: If your fund has an
existing monthly data sheet, and you select this option on the daily data
sheet, a message will appear asking you if you want to replace your
existing monthly data.
9. Save: When all data has been entered or edited, click Save.
10. Exit: When your data has been saved, exit the data sheet.
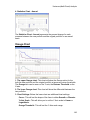
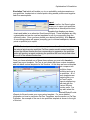
Daily/Weekly Data Reports
The daily/weekly data module contains an export reporting function similar to
PerTrac publisher report generation. PerTrac exports the statistics tables and
charts to an Excel workbook. You can then create custom reports from scratch or
use one of the templates installed on your computer. The following steps will
walk you through generating daily/weekly data reports.
1. Open the Daily/Weekly Investment Data Window by clicking the
command button from the left-hand side of the
Current Universe Window or by clicking the button labeled
from the Tool Bar.
2. Click Statistics on the command bar. This will open the daily/weekly data
investment statistics page.
3. The daily/weekly data statistics page contains a Generate Report button on
the upper right corner. Click Generate Report to open the Daily Report window.
39
PerTrac User Manual v.19 1
4. Click Locate to open the file selection window. The Custom Reports folder will
open by default, which contains the Master template "MasterDailyReport.xls" file
for creating your report from scratch, and a pre-built daily data report template
"Daily Report.xls".
5. Select "Daily Report 1.xls" and click Export. Your report is now open as and
Excel workbook.
Note: The "MasterDailyReport" and "DailyReport" files can also be used for
weekly data streams.
2.05 - Adding Performance Data - View the online
tutorial!
Adding Monthly Performance Data
All new investments will initially require that a data stream is entered in the
Investment Data Window. All existing investments (with the exception of
those supported by your data-vendor, which are updated when you download
a new database) also require monthly or quarterly updates as performance
data becomes available.
1. From the Current Universe Window, highlight an investment and
) button.
click the Investment Data (
2. If you are adding data to a newly created investment, you will see a
message telling you that there is no data for this investment. Click
OK.
3. The next window will ask if you want to enter data in quarterly
format. If you will be entering monthly data, select No.
4. Click the Enable Editing button at the bottom of the Investment
Data window. Notice how the button is renamed as Disable
Editing. Enabling editing allows additional functionality to become
active. Some of the buttons at the bottom of the window will change
from grayed out text (inactive) to black text (active). Also, you will
notice a formula bar appears just above the data table, which
displays the contents of the current cell.
5. If you are adding a new row to an existing data record, PerTrac will
automatically fill in the next date. Otherwise, you can enter the
date by typing it in month/year format. For example January, 1990
can be entered as either “1/90” or “1-90”. If you would like to enter
dates for several rows at a time, drag a selection which
encompasses both the most recently entered date and all the cells
in which you would like to enter dates, then click Fill Dates. Also,
since the month/year date format assumes that the date is the first
of the month, you may want all the dates to indicate the last day of
the month. To do this, highlight all the dates that you would like to
alter, then click Dates (End of Month). While the day of the month
40
Getting Started
will not be displayed in the cell itself, the change can be viewed in
the Cell Contents Field, just above the data table.
6. Move to the Performance column either by hitting the Tab key or
by clicking on the appropriate cell. You may enter percent or
decimal format by selecting ether Enter Performance as Percent
(for example 2.5% entered as 2.5) or Enter Performance as
Decimal (for example 2.5% as .025)
(
) button just
above the formula bar.
7. Alternatively, you can copy an entire series of data from a
spreadsheet and paste it into the date and performance columns.
8. If you are tracking the dollars under management for the
investment or a fund NAV you can enter the Dollars Managed and
NAV in their respective columns. If you do not know, or do not care
to track, the Dollars Managed or the NAV, you can leave the fields
blank and PerTrac will fill in zeros when the data record is
calculated. Similarly, PerTrac will automatically enter “NO” in any
blank cells in the Estimate column.
9. Continue to fill in the appropriate cells for each row that contains a
date.
10. Once you have entered all the data, click the Recalculate button at
the bottom of the window to update the VAMI and Cumulative Return
columns. Since PerTrac recalculates the figures automatically when
you use the Save option, it is not mandatory that you click the
Recalculate button. However, you may find it useful to use the
Recalculate button to view the recalculations for yourself before
saving.
11. When you are finished, click the Save button, then the Disable
Editing button. If you click the Disable Editing button without
having clicked the Save button, PerTrac will ask if you want to save
your data. If you do not save your data before you exit the
Investment Data window, any changes you have made since your
last save will be lost.
Adding Quarterly Performance Data
To add quarterly investment data, follow the instructions listed
above, but click YES when asked if you would like to enter
quarterly data.
Editing Performance Data
To edit data, highlight the appropriate cell, then click Enable Editing button.
After entering data in a cell, you can move to the next cell by hitting the Tab
key or by clicking on the desired cell. You can clear the contents of any cell
by right clicking and selecting Clear. The right-click menu can also be used
41
PerTrac User Manual v.19 1
for Cut, Copy, or Paste functions or for Inserting or Deleting Rows in the
data table.
If you have entered a value in the Performance column and wish to
recalculate the NAV, highlight at least two cells to be recalculated in the NAV
column and click the Calculate NAV button. Conversely, if you have entered
a new NAV and wish to recalculate the Performance, highlight at least two
cells to be recalculated in the Performance column and click the Calculate
Performance button.
When all the data has been edited as desired, click the Save button, then the
Disable Editing button.
2.16 - Adding Daily/Weekly Data
You can open the Daily/Weekly Investment Data Window by clicking the
command button from the left-hand side of the
Current Universe Window or by clicking the button labeled
from the Tool Bar. The Daily/Weekly data sheet is similar
to the traditional Monthly/Quarterly data sheet in that the same data sheet is
used for either data series. The following steps will walk you through adding
a new investment with daily or weekly data.
Note: If you are adding daily or weekly data to an existing fund, skip
step #1 below and start with #2.
1. Click Add New investment , the first button on the left hand side of the
Home window. When the Add New Investment window opens, enter a
name for your fund and click Enter.
on the left-hand
2. Highlight your fund, then click
side of the Current Universe Window or by clicking the button labeled
from the Tool Bar.
3. The Daily/Weekly data window appears:
42
Getting Started
Note: This sheet contains five columns of data: Date, Performance, NAV,
Estimate and Month To Date.
•
Date: Contains daily or weekly dates. Weekly dates must have a
Friday ending date. The Fill Dates (Daily) and Fill Dates (Weekly)
options will populate this column for you.
•
Performance: Contains daily or weekly performance. PerTrac
statistics are calculated from this column of data. You can use the
performance data to calculate the NAV column. Once the performance
has been entered, highlight the NAV column and click Calculate NAV
from the command bar.
•
NAV: Contains net asset values. PerTrac statistics are not calculated
from this column of data. However, if you receive your daily or weekly
data in NAV format, you can enter those values and then use the
Calculate Performance option to calculate the daily or weekly
performance based on the change in NAV. Once the NAV has been
entered, highlight the Performance column and click Calculate
Performance from the command bar.
•
Estimate: Use this column indicate whether or not you returns are
estimates. Enter either Yes or No.
•
Month To Date: The Month To Date column is linked to the
Performance column. If you enter data directly to the performance
column, or calculate the performance from the NAV column, the
Month To Date column will update automatically. Conversely, if you
enter a month to date value, the performance will column will update
based on the change in the month to date column.
•
Note: If you convert your daily data to monthly with the Convert To
Monthly option from the command bar, and you don't have a full
43
PerTrac User Manual v.19 1
month of data, the return in the Month To Date column will be entered
on the monthly data sheet.
4. Click Enable Editing at the bottom of the Daily/Weekly Data
window. Enabling editing allows additional functionality to become active.
Some of the buttons at the bottom of the window will change from grayed out
text (inactive) to black text (active).
5. Click the down arrow on the window next to the heading "Market
Closures". Select U.S.A. Holidays.
Note: When entering daily data there will be numerous days throughout
history when the US markets were closed. (i.e. holidays, weather, world or
economic events, etc.) The daily data sheet has to account for these day.
You can not skip days when entering data. To account for those market
closures, we have included a "Market Closures" schedule that will allow you
to skip those dates when entering your data. The "Market Closures" schedule
accounts for all US market closures back to January, 1965. This schedule
can be edited if you actually traded on any of these closed days, or if
you did not trade on dates not listed. To edit the schedule click the
"Edit Markets" to the right of the window, and select "U.S.A. Holidays"
from the drop-down menu. You can now insert dates you did not trade,
or delete a closed date.
6. Your daily or weekly data can be copied from Excel or entered manually.
If your data is copied from Excel the dates have to be formatted with a valid
Excel format. If you enter the dates manually, type the date of your first
return in cell 1. Highlight any number of rows below row 1 and click Fill
Dates (Daily) if you are entering daily data. Select Fill Dates (Weekly) if you
are entering weekly data.
NOTE: Weekly data must have a Friday end date. If you copy weekly data
from Excel, or enter your data manually, and enter a date other than a Friday
ending date, an error message will appear indicating your date is not a Friday
date. The Fill Dates (Weekly) option will automatically enter Friday ending
dates.
TIP: If you copy and paste the performance data from Excel, the return
format has to be taken into account. If your returns are in percent format in
Excel check the option "Enter Performance as a Decimal" on the top of the
data entry sheet. If your returns are in number format in Excel check the
option "Enter Performance as Percent". These options also apply when
entering data manually. If "Enter Performance as a Decimal" is checked
you enter returns in decimal format. (i.e. 2.0% as .02) If the "Enter
Performance as Percent" is checked enter your returns in number format.
(i.e. 2.0% as 2.0)
44
Getting Started
The command buttons:
1. Enable/Disable Editing: Enable edit must be selected prior to adding or
editing data on this sheet. When data has been entered or edited click
Disable Editing to exit and save your data.
2. Statistics:
The daily statistics window is similar to the Investment Statistics window for
monthly data, which will show the date range of your analysis, number of
days, Risk Table, Drawdown, Consecutive Gain, and Consecutive Loss
tables, daily and weekly correlation statistics, daily and weekly capture
ratios.
3. Charts:
The daily and weekly chart window options: NAV, Cumulative Return,
Distribution of Returns. A second Y-Axis can also be generated on: Percent
Rate of Return and Drawdown. One or Two benchmarks can be included on
the NAV and Cumulative Return charts.
4. Calculate NAV: If your daily or weekly data was entered in the
Performance column, use this option to create a NAV stream based on the
performance.
5. Calculate Performance: If your daily or weekly data was entered in the
NAV column, use this option to calculate the daily or weekly performance in
percent format. Note: if you copy or manually enter NAV data, you must use
45
PerTrac User Manual v.19 1
the Calculate Performance option. PerTrac calculates all statistics from the
performance column.
6. Fill Dates (Daily): This option will fill the Date column with daily dates.
7. Fill Dates (Weekly): This option will fill the Date column with weekly dates.
Note: the dates entered will always end on a Friday.
8. Convert to Monthly: This option only applies to daily data. If you would like
to use all of PerTrac's functionality to analyze your data, you have the option
of converting your daily data streams to monthly data streams. This option will
populate the monthly data sheet. If selected, your fund will not have two data
sheets, one with daily data the other with monthly. Note: If your fund has an
existing monthly data sheet, and you select this option on the daily data
sheet, a message will appear asking you if you want to replace your
existing monthly data.
9. Save: When all data has been entered or edited, click Save.
10. Exit: When your data has been saved, exit the data sheet.
Daily/Weekly Data Reports
The daily/weekly data module contains an export reporting function similar to
PerTrac publisher report generation. PerTrac exports the statistics tables and
charts to an Excel workbook. You can then create custom reports from scratch or
use one of the templates installed on your computer. The following steps will
walk you through generating daily/weekly data reports.
1. Open the Daily/Weekly Investment Data Window by clicking the
command button from the left-hand side of the
Current Universe Window or by clicking the button labeled
from the Tool Bar.
2. Click Statistics on the command bar. This will open the daily/weekly data
investment statistics page.
3. The daily/weekly data statistics page contains a Generate Report button on
the upper right corner. Click Generate Report to open the Daily Report window.
4. Click Locate to open the file selection window. The Custom Reports folder will
open by default, which contains the Master template "MasterDailyReport.xls" file
for creating your report from scratch, and a pre-built daily data report template
"Daily Report.xls".
46
Getting Started
5. Select "Daily Report 1.xls" and click Export. Your report is now open as and
Excel workbook.
Note: The "MasterDailyReport" and "DailyReport" files can also be used for
weekly data streams.
47
Getting Started SQL Version
1.1(a) – SQL Server Requirements
10/100 MB Ethernet card
MS SQL Server 7.0 or higher
1 GB RAM
1 GB free space for Database
CD-ROM Drive
1 GB or more processor speed
NOTE: Setting up databases and users should be done by qualified IT
personnel. SQL Server knowledge is assumed in this documentation.
Run the PerTrac SQL installation program and follow the instructions on the
screen. We suggest that you accept all the defaults. Icons will be added to your
Start menu and Desktop for PerTrac SQL, Data Manager SQL and Reports
SQL. This initial installation can be done on any workstation or server that has
Microsoft SQL Server installed with proper permissions to create a database and
add users and/or groups. Client workstations should have software installed
after the database and all permissions are set up. Setting up workstations will be
covered in section 1.3(a).
A SQL script file (PerTrac Blank SQL.sql) is installed to the PerTrac\Database
folder. Launch the file and use the following steps to create a new PerTrac
formatted SQL Server database on your designated SQL server.
1.2(a) – Creating a New SQL Database
Step 1: You create a new SQL Server
Database in SQL Enterprise Manager
which can be found by going to your
Start menu, selecting Microsoft SQL
Server program group and Enterprise
Manager. This launches a window
detailing directories in your SQL
Server Group. Click on the
Databases sub-directory. This lists
the existing databases. Right click
and select New Database from the
pull down menu. Give your database
a name. Double check the file location and then click OK.
48
Getting Started SQL Version
Step 2: Click the + sign to expand the newly created
databases in the tree view on the left hand side of the
window.
Step 3: Select Tables from the list under the Database
folder.
Step 4: Select Tools from the File Menu and select SQL
Server Query Analyzer from the pull down menu.
Step 5: A window (like that to the right) will appear. Please ensure that the
name of the database that you have just created appears in the pull down box.
If it does not, please select it. Your PerTrac database will not function correctly
unless you select the newly created database. Leave the query window open.
Step 6: Click the File Open Icon on the menu bar, select the
PerTrac_Blank_Database_6_0.sql file located in the PerTrac\Database folder,
and click Open. Your screen should now look like the following figure.
49
PerTrac User Manual v.19 1
Step 7: Click the PLAY/RUN Icon (see above) on the tool bar. This will execute
the selected script. Warning errors are nomal during this process. Close the
query window.
1.3(a) – Setting up Users
The User setup process depends on whether you use Windows NT
Authentication or SQL Server Authentication. The most secure method is
Windows NT Authentication and the process is displayed below. PerTrac SQL
supports both.
Giving Users of Existing Groups
Access to a Database
We are assuming that the system
administrator is familiar with creating
windows user groups and assigning
permissions to databases. In order for
users to have COMPLETE functionality in
PerTrac, they must have DB_Owner
permissions. If you would like to have
separate groups with limited permissions
for table access, etc. please call our
technical support number at 775-851-5880
x31 for proper settings. An example of the
DB_Owner permissions window is
displayed below.
50
Getting Started SQL Version
Step 1: Open Enterprise Manager. See Step 1 in 1.2(a) – Creating a New
Database if you do not know how to navigate to Enterprise Manager. Highlight
the Security option and expand the list with the plus sign. Highlight Logins, right
click and select New Login.
Step 2: The SQL Server Login Properties window
displays with the General tab selected will be
dislplayed. If a dropdown menu is displayed in the
Name box, select the proper windows group with
domain. If the dropdown menu is not displayed,
type in the domain with group (domain\user format).
Step 3: Select the dropdown menu below Windows
NT authentication and add the domain if it did not
appear. Select Grant access or Deny access for the
group with the radio button. Select the newly
created database with the dropdown menu and keep
the language as Default.
Step 4: Click on the Tab labeled Database Access. Select each database and
select their permission levels.
NOTE: In order for users to have FULL functionality in PerTrac, they must have
DB_Owner permissions. If you would like to have separate groups with limited
permissions for table access, etc. please call our technical support number at
775-851-5880 x31 for proper settings.
Step 5: Repeat these steps for each group that will access the database.
1.4(a) – Merging Data into the SQL Database
Data can be merged into PerTrac using the Data Manager SQL option in the
PerTrac program group. Make sure you launch Data Manager through the
PerTrac program group and not the PerTrac application itself. Data Manager
51
PerTrac User Manual v.19 1
SQL can be found by going to Start, All Programs, PerTrac 6.0, Data Manager
SQL. The Data Manager will open a window with many available options.
Option 1: This option is for new PerTrac users that do not have an
existing Microsoft Access Database. Please see the instructions listed under
Updating Your SQL Databases: Automated Update below.
Option 2: This option is ideal for PerTrac Users that are merging a
Microsoft Access Database and/or merging data not available through
Automated Update. Please see the instructions listed under Updating Your
SQL Databases: Quick Merge below.
NOTE: Most index and third party databases are available to download using
Automated Data Update. See that selection for more details.
1.5(a) – Updating Your SQL Databases: Automated Update
Each of the databases being analyzed within PerTrac should to be updated
either monthly or quarterly depending on whether the database is provided on a
monthly or quarterly basis. This will insure that you have the most current
investment data in the database or databases you are analyzing. Periodically you
will receive an email from Strategic Financial Solutions LLC informing you that
one or more of the databases available for download with the automated update
feature have been updated.
Step 1: Select Automated Data
Update from the menu and the Auto
Data update and Merge window
appears.
52
Getting Started SQL Version
Step 2: Select the appropriate database(s) to be downloaded. This window will
allow you to Download Only or Download & Merge up to five databases from
our website. Click the down arrow at the end of Database 1. This list contains the
complimentary PerTrac databases, as well as the subscription databases. Click
on the database you wish to download. If you select a subscription database you
must also enter your User Name and Password, located in the boxes to the right
of each database.
NOTE:The three complimentary databases are: PerTrac Indexes (which
contains approx. 1,300 of the most widely used Traditional and Hedge Fund
indices), MSCI Equity (which contains approximately 6,000 MSCI indices
worldwide), and SSB Indexes (which contains approximately 3,100 Salomon
Smith Barney indices worldwide)
TIP:When you click the down arrow to select a database(s) you will see a long
list of database names. However, you may not subscribe to some of them.
Rather than sort through the list each time, there is an option in the Auto Data
Update and Merge window that will allow you to customize the drop down list to
show only selected databases. Click the Options tab on the Auto Data Update
& Merge window. The Proxy/Firewall Settings window will open. Click the
Automated Data Download tab. Check each of the databases you want to add
to your custom list and then click OK.
Proceed with Database 2, 3, 4 & 5 if applicable. Remember: If you select a
subscription database(s), you will have to enter your User Name and Password
in the box to the right of each selection.
Step 3: Elect to download the database only, or download the database and
merge it with other databases.
Download only
1: If you wish to download the
database and not merge it, check
the Download Only box. You will
notice that when this box is
checked the option to choose a
Destination Database for merging
disappears.
53
PerTrac User Manual v.19 1
2: Click the Download Folder button at the end of this box. The path you select
here will be the location the database will be extracted to.
3: Enter your license number in the boxes provided. By default, your license
number will be added for you.
4: Check the box below the license number, Delete Downloaded Zip File, to
delete the compressed WinZip file that has been downloaded from the web.
There is usually no reason to keep this file on your computer.
5: Now that you have made your selections, you can save your settings for use
the next time you update data. Click the Save Settings button at the bottom of
this window. When the Save As box appears, Name your settings file, then click
Save. The next time you download data, click the Load Settings button at the
lower left to load your saved settings.
Download & Merge Your
Databases
1: If you wish to download and merge
databases Do not check the box
Download Only. There is now a second
box below Download Folder, named
Destination. Click the Destination box to
locate the database you want to merge
the selected databases with. The SQL
version of Data Manager allows you to
select an Access (mdb) database or a
SQL Server database, and will have a
SQL Server check Box. To select a SQL
Server database, check the box labeled SQL Server. Check this box if you are
merging to with a SQL server database.
2: To select the SQL database you wish to
merge the new data with, click the Destination
button. This will open the Data Link
Properties window. By default the Connection
tab will open. There are three steps to
selecting your database:
1. Select the server name. Click the down
arrow to select the SQL Server that
contains the database or type in the name
of IP address of the server.
2. Enter server log on information. Choose
either “Use Windows NT integrated
security”, or “Use a specific user name
and password”. If you choose the second
54
Getting Started SQL Version
option you must then enter the User Name and Password in the widows
provided. Then check the box Blank password if applicable. Always check
the Allow saving password box.
3. Select the database. Click the down arrow to see a list of SQL server
databases. Select the database you want to merge you new data with.
When all information has been entered click the Test Connection button on the
lower right. When the Test Connection Succeeded message appears, click ok
and close this window.
NOTE:The Data Link Properties window will require that SQL Server
information to be entered. This information should only be entered by your
Database Administrator.
3: Your license number is automatically entered in the boxes provided.
4: Check the box below the license number, Delete Downloaded Zip File, to
delete the compressed WinZip file that has been downloaded from the web.
There is usually no reason to keep this file on your computer.
5: Choosing the option to download and merge activates a second check-box
option just below the license number, Delete Unzipped Database. You can elect
to delete the individual un-compressed database(s) that were selected at the top
of the page. If you have merged the databases and don’t want to have individual
databases as well, check this box to delete the uncompressed database after it
has been merged.
6. Synchronize performance: many data vendors make adjustments to their
data over time. For example, a data vendor may have included in the historical
performance for managers, pro-forma data. Then months or years later delete
the pro-forma data, which means it will not show up in the new database
available for analysis. The Synchronize Performance option will erase the
entire history for the funds and replace each performance stream with the data
they are currently supplying. If you know the data vendor has made changes
since your last database update, you can check this box to completely rewrite the
performance data in the destination database.
6: Save Your Settings: now that you have made your selections, you can save
your settings for use the next time you update data. Click the Save Settings
button at the bottom of this sheet. When the Save As box appears, Name your
settings file, then click Save. The next time you download data, click the Load
Settings button at the lower left to bring back your selection criteria.
55
PerTrac User Manual v.19 1
Step 4: Start the Download: click Go to start the update process.
NOTE: When the download process has ended close the Data Manager
windows. The updated database can now be opened in PerTrac. If you selected
Download Only, the updated database will be located in the folder that you
selected prior to downloading. In PerTrac, click on File\Open New Database and
select the database. If you elected to Download & Merge your databases with
an existing database, and that database was open in PerTrac when you ran the
update, click the Load Master Database button on the left side of the Home
window to update/reset the database. If you elected to Download & Merge and
the database being merged was not open in PerTrac, click File\Open New
Database and select the database.
1.6(a) – Schedule Automatic Database Downloads
The SQL version of PerTrac allows users to
schedule automatic database downloads,
and then merge the downloaded database
with a selected destination database. The
following steps will walk you through
scheduling your automatic data update.
Step 1: Save your Settings. Prior to
scheduling your automatic data update you
must save your settings in the SQL Data
Manager utility. Click the Tools tab on the
upper menu bar and select Update
Database. The Auto Data Update and
Merge window will appear. For instructions on setting up your download please
see the section on Updating Your Databases – Automated Update. To save
your download settings click the Save Settings button. This will open the Save
As window to name and save your file. The file will have a ".dmx" extension.
NOTE – Be sure to remember where this file is being saved. In the last step of
this process you will have to specify the path of the saved Settings.dmx file.
56
Getting Started SQL Version
Step 2: Schedule the task. Click the Start
button on your desktop. Select Control
Panel, and then double click the Scheduled
Tasks option. The Scheduled Task Wizard
window opens. Click the Next button to
proceed to the program selection window.
From this list select Data Manager SQL. If
Data Manager SQL is not listed, click the
Browse button to locate the program
(located @
C:\PerTrac\DataManagerSQL.exe). Click the
Next button.
Step 3: The next window will prompt you to select the period (i.e. weekly,
monthly) you want to perform the scheduled task (running the automated
database update).
Step 4: The next widow will prompt you to select the day and time for the task.
Step 5: The next window will prompt you to enter a User Name and Password for
the computer performing the scheduled task. Enter the data then click the Next.
Final Step: The last window will appear
stating that you have successfully scheduled
the task and will also show the timing of your
new task. Now that the task has been
scheduled you must specify the path of the
Settings.dmx file you saved in Step 1. Check
the box Open advanced properties for this
task when I click Finish, then click the
Finish.
The Data Manager SQL window will open. Now that
the task has been scheduled you must specify the
path of the Settings.dmx file you saved in Step 1.
Enter the path to the saved .dmx file in the window
labeled Run. For example, if you had saved the
Settings.dmx file in your universe folder the path
would be entered as: C:\PerTrac\Data Manager
Enterprise.exe
–a:C\Universe\Setting.dmx.
57
PerTrac User Manual v.19 1
NOTE – this is a sample path to the Data Manager Enterprise.exe file. You would
enter your path, or click the Browse button to locate this file. However, when the
.exe file has been entered, the command -a:(path to your .dmx file) must be
used to specify the saved settings file for the automated database update.
1.7(a) – Updating Your SQL Databases: Quick Merge
Step 1: Select Quick Merge from the menu and the Quick Merge window
appears.
Step 2: Select the Source database by
clicking the Source button. Quick Merge
allows you to merge only one database at
a time. Notice the Use SQL Sever
checkbox option above the Source tab.
Only check this if you are merging an
existing SQL database.
Step 3: Three checkboxes appear
underneath the Source button: Merge by
Universe, Merge all User, (Description,
Information, Checks, Data, Memo) and
Synchronize Performance. Check the box Merge all User, (Description,
Information, Checks, Data, Memo) if it is not already checked.
Step 4: Check the Use SQL Server checkbox listed below the text Please
select a Destination database from the list (see above figure number 2).
Step 5: Click the Add button and select your destination
database. This is the SQL database you created (see
above figure number 3). Once you click Add, a window
like the screen capture to the right will appear. The
procedures to properly fill out this window are displayed
in the section Download & Merge your Databases.
58
Getting Started SQL Version
Step 6: Click the Merge button and wait for the merge to complete. The merge
will be finished when Done is displayed in the left corner of the Quick Merge
window. If you have to merge another database into the destination, repeat Step
2 and click Merge. Close the window when you are finished.
1.8(a) – Installing License Service for Network Users
For network installations of PerTrac, install the license server by following the
links on the setup CD-ROM for your key type. Remove any USB or parallel
Sentinel SuperPro keys before continuing the installation. We have had reports
of problems installing the Sentinel key driver while the key is attached. Once the
installation is complete, verify that the SuperProServer service has been installed
and started automatically.
1. On the installation CD-ROM select New Client Installation as this will
ensure you are properly set up. The installation instructions cover both the
parallel and USB key options. If you do not know which key option to select,
the sheet included with your installation CD-ROM has a section which gives
both License Numbers and which type of key you have purchased. The
most common selection is SuperPro Net Parallel Port. After selecting
appropriate key type you are given two options for installation; Install
PerTrac License Server or Install PerTrac. Click Install PerTrac License
Server. Follow the installation instructions after selecting appropriate key
type.
2. When the installation is complete, plug in your USB or Parallel key.
Make sure that the SuperPro Server Service is started in Services
To Find Services, go to Control Panel/ Administrative Tools/
Services, here you will find the SuperPro Server Service and again
make sure it is Started
If you do not see a SuperPro Server Service, it did not get installed
properly, you will have to manually install by going to your Start
Menu/Programs Files/PerTrac Network Server/Install SuperPro
Service.
A window will appear called, “Super Pro Service Loader”, select install
service.
If you get the following error: “Could not start the SuperProServer
service on the Local Computer. Error 1067: The process terminated
unexpectedly”. You will also need to install the sentinel drivers. To do
this go to the following folder: PerTrac/Drivers/ and run setupdr.exe.
You will want to make sure the USB key is not plugged in when
installing the drivers.
Then go back and make sure it says started under the Services, if it
does not, then manually start it
59
PerTrac User Manual v.19 1
Now that you have successfully installed the License Server Setup,
you will need to install the client side on each individual workstation(s).
NOTE: If you did not receive the PerTrac installallation CD and require
installation procedures, please visit the following website:
http://PerTrac.PerTracnet.com/per0020/web/me.get?WEB.websections.show&PER0
020_992
This site contains thorough installation instructions and PerTrac tutorials. Call
technical support 800-851-5880 x 5 for any additional help regarding
installation.
1.9(a) – Installing PerTrac on the Individual Workstations
The individual station setup uses the same PerTrac installation CD-ROM.
The only difference in the workstation installation will be selecting Install
PerTrac vs. Install PerTrac License Server. You can follow the Single
User Instructions from here.
Once PerTrac is successfully installed and launched, a network configuration
window will appear. In Key Type select SuperPro Net key and type the IP
Address of the machine hosting the key in the Contact Server Box and
leave key timeout alone. This will launch the PerTrac application.
60
Single Investment Analysis
2.01 - The Master/Home Window
The Master/Home Window is the primary window in PerTrac and remains open
at all times. It contains the Tool and Menu bars at the top of the screen and the
Status Bar at the bottom. The large middle section contains a list of the
investments in the database currently open.
Menu Bar
The Menu Bar is located at the top of the Master Window and offers pull-down
menus that are similar to those of a typical Windows program. The PerTrac
Menu Bar provides the following menu options:
61
PerTrac User Manual v.19 1
•
File - Contains options for opening, creating, and saving Universes. Also allows
you to load charts, and exit the program. Contains a quick-launch list of recently
used databases. Databases can also be opened or compacted using this menu.
•
Reports - Investment Summary Reports, Multiple Investment Reports,
Investment Statistical Tables, PerTrac Reports, and PerTrac Publisher.
•
Preferences - Allows you to customize the default settings and control the
overall functionality and layout of PerTrac.
•
Tools - Options for opening the Monthly Data Entry Form, Portfolio Builder,
Workbook Designer, Assign Benchmark Universe setup, Assign Peer Universe
setup, Currency Conversion, Fee Simulator, Excess Return Conversion, Rename
Investments in Universe Files setup, and Data Manager.
•
Window - Provides options for manipulating the arrangement of active windows.
•
Help - PerTrac Interactive Manual, PerTrac Online Help, Technical Support,
Statistics Definitions, Default Folders and Frequently Asked Questions.
Current Universe Window
The current universe window is the large square area containing the names of
the investments. Clicking over your Current Universe with the right mouse button
will provide access to some of PerTrac’s primary functions. See the box outlined
in red below.
62
Single Investment Analysis
Right Click Shortcuts
•
Information - Displays the Investment Information Window for the current
investment.
•
Statistics - Displays the Investment Statistics Window for the current
investment.
•
Charts (Investment) - Loads the Single Investment Charting Module for the
current investment.
•
Data - Displays the Investment Data Window for the current investment.
•
Open New Universe – Opens a dialogue box, allowing you to select a new
universe.
•
Load Master Universe – Scans the entire database and builds and displays the
Master Universe file “All.unv”. The All.unv universe is synonymous with the entire
database.
•
Create New Universe – Opens the Create New Universe Window, where you
can define a custom universe.
•
Create Checked Items Universe – Opens the Create New Universe Window
and places the investments you have checked in the new universe column.
•
List Related Funds – The Related Funds feature will find all funds that have
the identical first-field (the first upper left field) values on the general investment
information page. Depending on the data vendor, that field could be manager
name, company name etc.
Tool Bar
The Tool Bar is located immediately below the Menu Bar and contains buttons
that allow quick access to PerTrac’s primary windows. These buttons launch
63
PerTrac User Manual v.19 1
functions related to single investment analysis, universe (multi-fund) analysis and
PerTrac’s Advanced features.
Single Investment Functions
•
Home - Displays the Current Universe Window.
•
Info - Displays the qualitative information on the Investment
Information Windows for the selected investment.
•
Monthly Data - Displays the Monthly/Quarterly historical
performance in the Investment Data Window for the selected investment.
•
Daily/Weekly Data - Displays the Daily/Weekly historical
performance in the Investment Data Window for the selected investment.
•
Stats - Displays the Investment Statistics Window for the
selected investment.
•
Charts (Investment) - Loads the Single Investment Charting
Module for the selected investment.
Universe Functions
•
Universe – Reads investment returns for the current universe and
displays the Asset Allocation Window.
•
Statistics (Universe) - Displays the Multi-Investment Statistics
Window for the current universe.
•
Charts (Universe) - Loads the Multi-Investment Charting module
for the current universe.
•
View – Allows you to select four qualitative fields from General tab
on the Investment Information window, to view on the universe currently
open in the Home window.
•
Search - Displays the Create New Universe Window, which allows
for user-specified information or statistical searches.
•
Search Log - Displays the Search Log Window that details the
results of the most recent search.
PerTrac Advanced Features
Peer – Launches the PerTrac Peer Group Analysis module.
Style – Launches the Style and Benchmark Analysis module.
Sim – Launches the Portfolio Simulation and Stress Testing
module.
64
Single Investment Analysis
Status Bar
The status bar is located at the bottom of the Master Window. It displays (from
left to right):
•
The name of the current active investment
•
The name of the current active universe
•
The number of investments in the current universe
•
Current date and time
During a search or portfolio calculation, the investment display at the far left is
updated to show the investment currently being processed. Since all operations
process investments in alphabetical order, viewing this part of the status bar
during an operation will give you an indication of the progress of the operation.
Also, when an operation is being performed, a small flashing clock will appear in
the status bar until the operation has finished.
2.02 - The Current Universe Window
The Current Universe Window is the gateway for all activity in PerTrac. When
PerTrac is launched, the Current Universe Window automatically appears
within the Master Window with “All.unv” as the current universe.
65
PerTrac User Manual v.19 1
NOTE – the “All.unv” always consists of each investment in the current
database and can be rebuilt at any time by clicking the Load Master Universe
button.
The Current Universe Window contains the following sections as shown in the
screen capture above.
1. Current Investment Box- displays the source name of the current
investment.
2. Current Universe Box - displays the list of saved universes in your
default universe folder.
3. Data Source - displays the Data Source of the selected investment.
4. Number of Investments - displays the total number of investments in the
current universe.
5. Investment List Box - displays alphabetic listing of each investment in
the current universe.
6. Command Buttons - initiate a variety of functions.
7. Group Duplicates - This is a new check box located on the upper righthand side of the Home window. When Group Duplicates is checked all
identical funds will be grouped by way of a new tree format located just to
the left of the fund names. Plus and minus signs will expand and contract
the duplicate funds. When the Group Duplicates box is unchecked all
funds will be listed in the Home window without the new tree structure.
The black box containing the number of funds in the Home window will
change when the Group Duplicates box is checked. When unchecked the
total number of funds will be shown, when checked the black box will
show the number of unique funds (no duplicates).
Selecting an Investment
While working with single investments, all operations are performed on the
currently selected investment. To select a particular investment from the
current universe, click on the investment name in the Investment List Box or
click in the Investment Box and type the first few letters of the investment
name. This is a shortcut that will move you down the list more quickly than
simply scrolling.
Current Universe Window Command Buttons
Available in all versions of Pertrac
The command buttons are located down the left hand side of the
Current Universe Window. Below you will find a brief description of
each command.
•
66
- This function allows you to create your own funds,
managers, indices, or other investments. When a new investment is
created, its name is added to the Master Universe of the active
database. Investment information and investment performance data
Single Investment Analysis
for the new investment can then be added by highlighting the new
investment name and clicking either the Investment Information
button or the Investment Data button.
•
- Clicking the Remove Investment button from the
Current Universe Window allows you to delete an investment and its
related files from the Master Universe (“all.unv”). Since investments
can only be removed from the Master Universe, the Master Universe
must be loaded in the Current Universe Window before attempting to
remove an investment.
!!NOTE: Once an investment is removed from the Master Universe, all
information and data are lost and are irrecoverable. On network or
multi-user systems, this function may be restricted to the system
administrator.
•
- Creates a copy of the selected investment with
same qualitative information and performance data.
•
- Renames the investment but keeps the
information and performance intact.
•
- Opens the Investment Information Window,
which contains qualitative information about the current investment.
•
- Opens the Investment Data Window,
where you can enter, view and edit the monthly or quarterly
performance data for the current investment.
•
- Opens the Investment Daily/Weekly
Data Window, where you can add and edit daily or weekly
performance.
•
- Opens the Investment Statistics Window, which
contains summary performance statistics for the current investment.
•
- Opens the Investment Charts Window, where
you can create charts on numerous performance and risk measures.
•
- Scans the entire database and builds and
displays the Master Universe file “All.unv”.
•
•
- Opens a dialogue box, allowing you to
select a new universe.
- Opens a dialogue box, allowing you to save the
current universe with a different name.
67
PerTrac User Manual v.19 1
•
- Opens the Create New Universe Window,
where you can define a custom universe.
•
- Opens the Create New Universe Window,
and places the investments you have checked in the new universe
column.
•
− Allows you to check the boxes next to your
fund names then convert your selections to be listed as a group.
•
•
− Allows you to un-group funds that were
grouped with the Group Checked Investments option.
- Closes all open windows and exits PerTrac.
Available with Standard and Advanced Versions
•
- This opens the Universe Allocation Window that
contains PerTrac’s universe (multi-fund) analysis tools, portfolio
construction, and asset allocation modeling with the Efficient Frontier
and Linear Optimizers.
Available with Advanced Versions
•
– Opens the Style and Benchmark Analysis
module where you can perform style analysis, create style charts, and
perform style-based searches.
•
– Opens the Peer Group Analysis module where
you can thoroughly analyze and rank funds relative to their peers.
•
– Opens the Portfolio Simulation module that
builds probability distribution outcomes on numerous risk measures.
2.03 - Investment Information - View the online tutorial!
The Investment Information Window allows you to view and edit qualitative
information related to the current investment. There are three main uses for the
Investment Information Windows:
1. Searches/Queries – one of the five powerful search engines in PerTrac
is the Select by Information Search option. The information search
68
Single Investment Analysis
criteria will consist of all data vendor or user entered qualitative fields on
all of the investment information window tabs except the Notes tab.
2. PerTrac Publisher Custom Reports – all of the investment information
window tabs, with the exception of the Notes tab, get exported with the
PerTrac Publisher custom report generators. The investment information
qualitative data can then be added to your custom report.
3. User Information – when you subscribe to data vendor databases you
will have access to potentially hundreds of qualitative fields. However, you
may want to compile your own information on those funds. The NOTES,
User Information, User Categories and User Memo windows give you a
large amount of space to add you own qualitative fund information.
There are three ways to open the Investment Information Window:
•
Clicking the
Universe Window.
•
Clicking the button labeled
•
Double-clicking on the investment name for which you wish to view
information.
command button from the Current
from the Tool Bar.
TIP: When you highlight a fund and click Investment Information button, or
double click on a fund name to open the investment information window, the
General information page is the default view.
69
PerTrac User Manual v.19 1
Initially, PerTrac will look for these description files in the program directory. You
can, however, change the path to an alternate directory by changing your
preferences.
1. Select Default Description Files Folder from the Preferences menu.
2. Locate and double-click on the desired folder.
3. Click OK.
TIP:This can be useful when sharing data over a network where several
computers might have different versions of the description files. Sharing the
description files folder ensures that all users are using the same labels.
Information Pages
By using the buttons at the top of the Investment Information Window, you
can access eight different information displays.
They are: General, CMS, Notes, Information, Categories, User
Information, User Categories and Memo.
- The General Investment Information is automatically
1.
displayed when you open the Investment Information Window and
includes fields such as company name, address, and phone numbers as
well as investment-specific information such as start date, minimum
account, and fees. If you purchase data, the database vendor supplies the
70
Single Investment Analysis
information in these fields and field names. User files can be programmed
as desired. Clicking the Enable Edit button allows you to edit or add
information. For information on editing information field labels see
“Customizing Field Labels” later in this section.
The Investment Strategy Description box is located at the middle left of the
General display of the Investment Information Window. This field is
used for vendor-supplied descriptions of investment managers or for any
other relevant information that is supplied by the data vendor and not
found in the investment information fields above. The scroll bar allows you
to view of the entire field. The contents of this field can be copied to
another application by using the right-click functions to copy and paste.
NOTE – If you edit the General Information page by changing the field
labels or values for an investment that is part of a data vendor database,
your changes will be overwritten when you subsequently download and
update that data vendor database.
The user-entered Strategy Description box is located directly below the
Program Description box. Unlike the Investment Description box, the
user-entered description will not be overwritten by data vendor updates.
This field can hold up to 1 gigabyte of information. You can copy entire
documents directly from, or paste the contents to, other applications using
the clipboard. The scroll bar allows you to view the entire field. Clicking on
the Enable Edit button allows you to enter information into the User Notes
box.
NOTE – Data entered in the user description fields will not be overwritten
when you update the data vendor database.
The 36 check boxes at the lower right of the window represent categories
supplied by the data vendor or defined by the user (see Customizing
Field Labels later in this section). They provide a general overview of the
investment type, sectors traded, and trading style. To add or remove a
check mark, click the Enable Edit button.
2.
- This button allows the user to interface with their CMS
system. Once a fund has been linked from CMS to PerTrac, this option will
access the fund in CMS from the PerTrac information window.
NOTE – You must have a subscription to the PerTrac Financial Solutions
CMS product for this option to be available.
71
PerTrac User Manual v.19 1
3.
- The Notes section allows you to maintain notes with an
automatic time-stamp. These re-sizable boxes are most often used to
enter due diligence notes with a date and time stamp.
NOTE – Data entered in the user description fields will not be overwritten
when you update the data vendor database.
4.
- The Information tab lists six windows with 50
fields/cells in each window. These windows and fields contain a variety of
investment qualitative information supplied by the data-vendor. Each
window can be customized by selecting Set Information and Category
Page Names to rename each window, or Specify Information Page
Layout to change the layout of the columns and rows. Both of these
options are located on the menu bar Preferences tab.
NOTE: If you change the information page field labels or values for an
investment that is part of a data vendor database, your changes will be
overwritten when you download and update this particular data vendor
database.
TIP: For both the Information and User Information windows, the cells
in the first 4 windows will hold a maximum of 256 characters. Information
windows 5 and 6 will hold 1 gigabyte of information. If the information you
are attaching to an investment has a large amount of text, use the cells on
information windows 5 and 6.
- The Categories tab lists six Category Windows, which
5.
can be viewed either by repeatedly clicking the Categories button or by
clicking the drag-down portion of the Categories button and selecting a
specific window. There are 4 columns of check boxes on each Category
Window that are defined by the data vendor. Each column contains 30
check boxes. To add or remove a check mark, click the Enable Edit
button and click the appropriate box.
NOTE – If you edit the Category Window page by changing the field
labels or values for an investment that is part of a data vendor database,
your changes will be overwritten when you download and update this
particular data vendor database.
72
Single Investment Analysis
6.
- Clicking the User Information button displays the
first of six User Information Windows. These windows act just like the
Information Windows described earlier, including custom sizing. The
unique feature about the User Information Windows, however, is that
the information stored here is not changed or overwritten during datavendor updates. This allows you to store and customize the information in
a way that best suits your needs.
User Information
In addition to storing text
information, these fields
can also be used as file
links. These automatic
links are designed to give
you easy and convenient
access to other files that
you might maintain on a
particular investment
manager or fund (such as
an Excel spreadsheet, a
Word document or PowerPoint presentation file).
1. Click the Enable Edit button in the Information Window.
2. Double-click on any blank cell. The Select Document to Launch
dialogue box appears.
3. Once you have found the file to which you wish to link, you may
either double-click on it or click Open button. This opens the file
with the appropriate program so that you can ensure you have
made the correct link.
4. Close the selected file. Back in PerTrac, the linked cell now
contains the path to the file you have chosen.
5. Click the Save button at the bottom of the Investment Information
Window to save the link.
Once the link is established, you can open the linked file at any time by
double-clicking on the linked cell. To clear a linked cell, click the Enable
Edit button and delete the file path contained in the cell.
- The User Categories tab lists six User Category
7.
Windows, which can be viewed either by repeatedly clicking the User
Categories button or by clicking the drag-down portion of the User
Categories button and selecting a specific window. There are 4 columns
of check boxes on each User Category Window that are defined by the
data vendor. Each column contains 30 check boxes. To add your own
73
PerTrac User Manual v.19 1
Category, click the Enable Edit button, then click your right mouse button
and select Edit Label. Type the label for your category, enter a check
mark if this category applies, and then exit.
The User Categories windows are similar to the User Information
Windows in that the information stored here is not changed or overwritten
during data-vendor updates. This allows you to store and customize the
information in a way that best suits your needs.
8.
- The Memo section contains both a System Memo display
and a User Memo display, each containing four resizable windows. The
System Memo information will be provided by the data vendor, while the
User Memo information is for your use and can be updated by clicking the
Enable Editing button. Each memo field may contain approximately 1
gigabyte of information.
The User Memo windows are similar to the User Category and User
Information Windows in that the information stored here is not changed
or overwritten during data-vendor updates. This allows you to store and
customize the information in a way that best suits your needs.
Tool Bar
The Investment Information Window contains its own tool bars that provide
access to the available functions. Listed below are brief descriptions of the
items highlighted on the Information window tool bars.
• Data source drop-down window. This window contains a list of
your grouped duplicate data sources. Although you group your
duplicate funds, you can toggle between multiple data sources
in the information window to view qualitative data specific to
each data vendor.
74
•
The Statistics, Data, and Charts (
buttons open those respective windows.
•
With the Export, Import, and Clear (
)
buttons, you can export a page of information to the Clipboard.
From the Clipboard you can then import information to another
investment's Investment Information Window.
•
The Enable Edit (
) button at the bottom of the
window must be activated before any fields in the window can
be edited. Once you have edited the information for an
investment, you can use the Disable Edit button or the Save
button to complete the editing process.
)
Single Investment Analysis
•
The Exit button in this window will the exit Investment
Information Window. It does not exit the PerTrac program.
•
The Current Window Label (
) is
shown between the Save and Exit buttons. This indicates the
information window you are currently viewing.
TIP:Double-clicking on the e-mail address within a particular investment
record will automatically launch an e-mail to an individual/company.
Likewise, double-clicking on the web site address within a record will
launch your web browser to access that site.
Customizing Field Labels
You can change the layout of both the System Information pages and User
Information pages to suit your specific needs.
1. Select Specify Information Page Layout from the Preferences menu
option.
2. When the Enter Preferences For Information Tables Window
opens, select the window you wish to alter from the drag-down menu.
3. Select either 1 or 2 columns, keeping in mind that each column
consists of a label column and an info column.
4. In either the Left Column Width or Right Column Width box, enter the
width of the column as a percentage of available space (the other
column will automatically take up the remaining space).
5.
For each column, define the label width as a percentage of the entire
column (the actual information will be stored in that column's remaining
space).
6.
For each column, choose a row height by entering the number of
lines that will be visible.
NOTE: Keep in mind that the information that will go in these boxes is not
confined to the size of the box. When there is more information than the box
shows, you may view the remaining information by using the scroll bars.
Another way to customize the Information and User Information pages, as
well as both the Categories and User Categories pages, is by changing the
field labels.
1. From one of the Information or Category Pages, click
the Enable Edit button.
2. Right-click over the label you wish to change.
3. Select Edit Label.
75
PerTrac User Manual v.19 1
4. Change the caption in the desired label.
5. Click the Disable Edit button.
6. When asked if you want to save investment information, click Yes.
TIP:For all files supplied by data vendors, changes made to any non-user
items will be lost when the database is updated. For this reason these fields
should only be edited on User files. For data-vendor supplied files, use only
the User Information, User Categories, NOTES, and Memo pages to further
customize data vendor records.
Renaming Information and Category Pages
Customizing the names of the 24 Information and Category pages can help
you more quickly identify the location of the information in a record.
1. Select Set Information and Category Page Names from the
Preferences menu. The
Data Source box will display
the source of the current
investment.
2. Replace page names as
desired. Placing an
ampersand (&) before a
letter allows you to use that
letter to select the page
while the menu is displayed.
3. Click OK
76
Single Investment Analysis
2.04 - Investment Data - View the online tutorial!
The Investment Data Window allows you to view and edit the performance data
for the current investment. You can open the Investment Data Window by
clicking the
command button from the
Current Universe Window or
by clicking the button labeled
from the Tool Bar.
Investment Data Window
At the top of the window are
fields showing the manager
name, investment name, start
and end dates, and the number
of monthly periods in the data
table. Below these fields is the
standard data table. For datavendor provided files, the data table is updated each time the user updates the
vendor database; user-entered data, however, must continue to be updated
manually.
The data table includes columns for Date, Performance (percent return), Funds
Managed, NAV (Net Asset Value), VAMI (Value Added Monthly Index), and
Cumulative Return. The table also contains an Estimate column, which allows
you to flag the rows of data that contain estimated performance values. Only the
first five columns require data entry, while the VAMI and Cumulative Return
columns contain locked cells that are calculated automatically.
Note: The drop-down window on the lower left allows you to toggle between data
vendors when you have duplicate investments grouped.
The Previous and Next buttons at the bottom of the screen allow you to view
data from other investments within your universe. Finally, the Statistics and
Information buttons allow you to move directly to those windows, as in the
Current Universe Window.
77
PerTrac User Manual v.19 1
2.05 - Adding Performance Data - View the online
tutorial!
Adding Monthly Performance Data
All new investments will initially require that a data stream is entered in the
Investment Data Window. All existing investments (with the exception of
those supported by your data-vendor, which are updated when you download
a new database) also require monthly or quarterly updates as performance
data becomes available.
1. From the Current Universe Window, highlight an investment and
click the Investment Data (
) button.
2. If you are adding data to a newly created investment, you will see a
message telling you that there is no data for this investment. Click
OK.
3. The next window will ask if you want to enter data in quarterly
format. If you will be entering monthly data, select No.
4. Click the Enable Editing button at the bottom of the Investment
Data window. Notice how the button is renamed as Disable
Editing. Enabling editing allows additional functionality to become
active. Some of the buttons at the bottom of the window will change
from grayed out text (inactive) to black text (active). Also, you will
notice a formula bar appears just above the data table, which
displays the contents of the current cell.
5. If you are adding a new row to an existing data record, PerTrac will
automatically fill in the next date. Otherwise, you can enter the
date by typing it in month/year format. For example January, 1990
can be entered as either “1/90” or “1-90”. If you would like to enter
dates for several rows at a time, drag a selection which
encompasses both the most recently entered date and all the cells
in which you would like to enter dates, then click Fill Dates. Also,
since the month/year date format assumes that the date is the first
of the month, you may want all the dates to indicate the last day of
the month. To do this, highlight all the dates that you would like to
alter, then click Dates (End of Month). While the day of the month
will not be displayed in the cell itself, the change can be viewed in
the Cell Contents Field, just above the data table.
6. Move to the Performance column either by hitting the Tab key or
by clicking on the appropriate cell. You may enter percent or
decimal format by selecting ether Enter Performance as Percent
(for example 2.5% entered as 2.5) or Enter Performance as
Decimal (for example 2.5% as .025)
(
above the formula bar.
78
) button just
Single Investment Analysis
7. Alternatively, you can copy an entire series of data from a
spreadsheet and paste it into the date and performance columns.
8. If you are tracking the dollars under management for the
investment or a fund NAV you can enter the Dollars Managed and
NAV in their respective columns. If you do not know, or do not care
to track, the Dollars Managed or the NAV, you can leave the fields
blank and PerTrac will fill in zeros when the data record is
calculated. Similarly, PerTrac will automatically enter “NO” in any
blank cells in the Estimate column.
9. Continue to fill in the appropriate cells for each row that contains a
date.
10. Once you have entered all the data, click the Recalculate button at
the bottom of the window to update the VAMI and Cumulative
Return columns. Since PerTrac recalculates the figures
automatically when you use the Save option, it is not mandatory
that you click the Recalculate button. However, you may find it
useful to use the Recalculate button to view the recalculations for
yourself before saving.
11. When you are finished, click the Save button, then the Disable
Editing button. If you click the Disable Editing button without
having clicked the Save button, PerTrac will ask if you want to save
your data. If you do not save your data before you exit the
Investment Data window, any changes you have made since your
last save will be lost.
Adding Quarterly Performance Data
To add quarterly investment data, follow the instructions listed
above, but click YES when asked if you would like to enter
quarterly data.
Editing Performance Data
To edit data, highlight the appropriate cell, then click Enable Editing button.
After entering data in a cell, you can move to the next cell by hitting the Tab
key or by clicking on the desired cell. You can clear the contents of any cell
by right clicking and selecting Clear. The right-click menu can also be used
for Cut, Copy, or Paste functions or for Inserting or Deleting Rows in the
data table.
If you have entered a value in the Performance column and wish to
recalculate the NAV, highlight at least two cells to be recalculated in the NAV
column and click the Calculate NAV button. Conversely, if you have entered
a new NAV and wish to recalculate the Performance, highlight at least two
cells to be recalculated in the Performance column and click the Calculate
Performance button.
79
PerTrac User Manual v.19 1
When all the data has been edited as desired, click the Save button, then the
Disable Editing button.
2.06 - Updating User-Entered Performance - Monthly
Data Entry Form - View the online tutorial!
Although the Investment Data Window allows you to edit all the data for a
single investment, you may wish to enter data for several investments at
once, such as when new monthly performance data becomes available for a
portfolio of managers. This can be accomplished by using the Monthly Data
Entry Form.
1. Open the universe of funds you wish to update at the Home window. If
you do not open the universe, PerTrac will default to the All.unv, or entire
database. PerTrac will then try to load the entire database into the Monthly
Data Entry Form, which could crash your PerTrac.
2. From the Tools menu, select Monthly Data Entry Form.
3. In the Date box, located on the lower left hand side of the window, enter
the month and year for which you would like to enter data.
4. Click the Load button. PerTrac will display all of the data for each
investment in the current universe for 3 consecutive months, ending with
the month you selected.
5. Enter and edit the data as needed.
6. Click the Save button. If you do not save your data before you exit the
Monthly Data Entry Form window, any changes you have made since
your last save will be lost.
7. Exit the Monthly Data Entry Form.
80
Single Investment Analysis
2.07 - Currency Conversion
The Currency Conversion tool allows you to convert investment returns from
one currency to another. Currency conversion can be performed on a single
fund or a universe of funds.
Single Fund Currency Conversion
Select the investment you wish to convert, then, from the Tools menu, select
Currency Conversion. There are three options: Convert Investment to
New Currency, Convert Universe to New Currency and Edit Cross Rate
Database. Prior to converting the
investment or universe to a new
currency the Cross Rate Database
must be updated.
1. The Cross Rate Database
can be edited by selecting
Edit Cross Rate Database
from the Currency
Conversion section of the
Tools menu. Click the Select
Database button on the lower
left hand side of the window.
When the file selection window appears, select the file
“PerTracCrossRates.cdb” and click Open. A list of currencies will now
be listed in the window. You can now Add, Remove, or Edit
Currencies.
NOTE: New currency rates must be entered each month. The currencies that
come pre-loaded have not been updated since September, 1999. However, we
now upated the G7 currency rates, which can be updated monthly from the
Utilities/Documentation link on our Training & Support (http://pertrac.com) site.
Each month you will Save the new "PerTracCrossRates.cdb" file to your PerTrac
main folder.
2. Once the Currency Cross
Rate Database has been
updated, click the Convert
Investment to New Currency
option. Select the currencies of
both the current investment
and the new investment. The
new investment name is listed
81
PerTrac User Manual v.19 1
3.
4.
5.
6.
under the New Investment Name label.
Select a Data Source from the drop down list (typically the data source
will be “User”)
Optional conversion check boxes are available to convert NAV and
Funds Managed.
Other record items can be duplicated by checking the corresponding
boxes.
Once all the settings have been made, click the Convert button.
Universe Currency Conversion
From the Tools menu, select Currency Conversion. Then select Convert
Universe to New Currency. Prior to converting the investment or universe
to a new currency the Cross Rate Database must be updated. See Note
above.
1. Once the Currency Cross Rate Database has been updated, click the
Convert Universe to New Currency option. The Universe Currency
Conversion window appears.
2 When the Universe Currency
Conversion window appears
click the Locate button to
open the universe to be
converted.
3. Select the existing Universe
Currency Denomination to
be converted and then select
the New Currency
Denomination to be
converted to.
4. Elect to Convert NAV (if your
fund data sheet contains NAV
vaules that you would like to
convert to the new currency),
Convert Funds Managed (if you want this data also converted to the
new currency), or to Override Data Source.
5. Select the qualitative information to be duplicated under the Select
Items To Duplicate section.
6. Once all the settings have been made, click the Convert button.
7. The new investments have been added to your database. The default
name for the new funds will be the old name with the new currency in
parenthesis behind the name.
82
Single Investment Analysis
2.08 - Fee Simulator
The Fee Simulator provides the option of adjusting an investment’s
performance for various fees and interest rates. Select the investment you
wish to adjust and select Fee Simulator from the Tools menu.
1. When the Fee Simulator
window opens, enter the
applicable fee
percentages and payment
frequencies.
2. In the Initial Settings
section, enter the
invested amount, along
with any credit or loan
amounts (leverage) along
with their corresponding
interest rates.
3. Using the option buttons, fees can be charged to either the invested funds
or credit/debit balances.
4. Enter the desired start date and end date.
5. Checking the Save as new investment to add the new record your
database.
6. Click Convert. A new window will appear that
contains investment information to duplicate
into the new “Net” investment record. Click
Save to create the new “Net” of Fees”
investment.
2.09 - Excess Return Conversion
A data stream can be created
which reflects the difference
(excess return) between an
investment and a benchmark.
Choose the investment you wish to
convert to an excess return stream
and then select Excess Return
Conversion from the Tools menu.
1. Select a benchmark from
the pull down menu.
83
PerTrac User Manual v.19 1
2. Select the Data Source. By default the data source is “User”. We
recommend that you keep this setting.
3. Check the boxes that correspond to the qualitative data you wish to
duplicate in the new record.
4. Select the period, Monthly Data or Quarterly Data.
5. Click Convert.
2.10 - Investment Data Window Command Buttons
84
•
Previous - Displays the data for the previous investment in
the current universe list.
•
Next - Displays the next investment in the current universe
list.
•
Statistics - Displays the Investment Statistics Window for
the current investment.
•
Information - Displays the Investment Information Window
for the current investment.
•
Export - Copies the current data record (including column
headings) to the clipboard.
•
Import - Pastes contents of the clipboard into the current
Investment Data Window after checking for formatting or other
errors.
•
Calculate NAV - Uses the values in the Performance column
to calculate a NAV for the same month (the appropriate cells in
the NAV column must be highlighted).
•
Calculate Performance - Uses the values in the NAV column
to calculate the performance for the same month (the
appropriate cells in the Performance column must be
highlighted).
•
Enable Editing - Allows users to edit the Investment Data
Table.
•
Disable Editing - Prevents users from editing the Investment
Data Table.
•
Recalculate - Updates the VAMI and Return to Date
columns of the Investment Data Table based on the values in
the Performance column.
•
Fill Dates - Uses the last highlighted date as a reference to fill
any blank highlighted cells with dates.
•
Dates (End of Month) - Converts all highlighted dates to
reflect the last day of the month.
Single Investment Analysis
•
User Data - Displays the User Data Table (see below).
•
Leverage - Displays the Leverage Data Table (see below).
•
•
Daily Data - Opens the Daily Data entry and analysis window.
Exit - Closes the Investment Data Window.
•
Save - Saves all data in the Investment Data Window.
•
Data source drop-down window - This window contains a
list of your grouped duplicate data sources. Although you group
your duplicate funds, you can toggle between multiple data
sources in the information window to view qualitative data
specific to each data vendor.
User Data Table
In addition to the standard Investment Data Table, PerTrac includes an
expanded User Data Table that allows you to track up to 20 columns of
performance-related information such as additions, withdrawals, realized and
unrealized P&L, interest income, and fees. This table is ideal for tracking
investment funds or customer accounts on a very detailed level. To access
the User Data Table, click the User Data button at the bottom right of the
Investment Data Window.
NOTE: This is a stand-alone table intended for compiling historical data. The
data in this table is not linked to other PerTrac tables. This table is available for
export into PerTrac Publisher. As a result, if you want to include data from this
data on your custom template, the table will be available.
User Data Table Formulas
The initial setup for the User Data Table consists of 15 pre-defined
columns, some of which contain formulas. Four of the columns that
contain formulas will initially show a value of zero, since they are
referencing cells that are either initially blank or initially contain zeros.
Other formulas will initially return an error message that indicates that the
formula is attempting to divide by zero. These zeros and error messages
will be replaced with actual numbers as you enter the investment data on
which the formulas make their calculations. The following columns
contain formulas:
85
PerTrac User Manual v.19 1
•
Beginning Equity - Except for the first row, which requires a
value to be entered, beginning equity for any month is equal to
the ending equity from the prior month.
•
Change Unrealized - Unrealized P/L for the current month Unrealized P/L for the prior month.
•
Total P/L - Realized P/L + Change in Unrealized P&L.
•
Ending Equity - Beginning Equity + Additions + Withdrawals +
Total P/L + Interest Income + Management Fees + Incentive
Fees + Expenses.
•
Monthly Return - (Ending Equity/(Beginning Equity + Additions
+ Withdrawals))-1
•
VAMI - Prior Month VAMI * (1+Monthly Return). In the first
month, the formula is 1000 * (1+Monthly Return).
Clicking the Previous and Next buttons allows users to navigate through
the User Data Tables for other investments within the current universe.
The Copy button allows you to copy data in the same way as you would
from the Investment Data Window.
Entering or Editing Data in the User Data Table
The User Data Table works in much the same way as the other
spreadsheets within PerTrac.
1. In the User Data Window, click Enable Editing at the bottom of
the window.
2. Enter the data, using the arrow keys to move from cell to cell in the
table.
3. When all data has been entered, click Save.
4. Click Disable Editing.
NOTE – Values that decrease equity, such as withdrawals, must be
entered as negative numbers in the User Data Table. Negative numbers
will appear in red and in parentheses.
User Data Table Workbook
Designer
In addition to the normal entering
and editing of data in the User
Data Table,, you may want to
print the User Data Table or to
86
Single Investment Analysis
reformat the overall look of the table and save your changes for future
reference. You can print and reformat the User Data Table using the
Workbook Designer, which brings up a copy of the User Data Table that
can be edited.
1. Click Workbook Designer button at the bottom of the User Data
Table window. A spreadsheet with full editing, formatting, and printing
capabilities will appear.
2. Format the spreadsheet using the options on the menu bar. To
change a column heading, double-click on it to open Header Name
dialogue box. To enter a formula, select the relevant cell and enter the
formula as you would in any Excel™ (any existing formula for the cell
will be visible in the Formula Bar). The Formula One Workbook
Designer has a built in Help index to guide you through additional
tasks. (See Using the Workbook Designer for more information.)
3. When the formatting is complete, select Write from the File menu
or click the Write.
4. When the Write dialog box appears, give the file a new name. The
name can be anything except the default filename for the User Data
Table (“UserDefaultTable.vts”).
5. Click Save.
Once you have created a customized spreadsheet, you can re-open it
choosing Read from the File menu.
Changing the User Data Table Universal Format
Although the method described above allows you to change the format of
a particular spreadsheet, you may wish to change the initial appearance,
or Universal Format, of the User Data Table for all of your investments.
Once defined, the format for the User Data Table becomes universal
throughout PerTrac. This means that the column definitions, formulas and
other formatting will be the same for all investments while using the User
Data Table.
1. From Tools tab on the menu bar select Workbook Designer.
This will open the Formula One Workbook Designer program,
which is included with the PerTrac software.
2. Once inside the Workbook Designer, click Open on the File
menu.
3. Select “UserDefaultTable.vts” from the PerTrac directory and click
Open. This will open the default User Data Table format.
4. Set up the data table as you would an individual User Data Table,
keeping in mind that this will be the setup for the User Data Table
for each investment.
87
PerTrac User Manual v.19 1
5. Once you have finished formatting, select Save from the File menu
or click the Save button.
6. When the Save dialogue box opens, save your work under the
same name (“UserDefaultTable.vts”).
7. When asked if you want to replace the existing file, click Yes. Your
new User Data Table will replace the pre-formatted table and will
automatically open when the User Data Table button is clicked.
User Data Table Command Buttons
Previous - Displays the User Data Table for the previous investment
in the Current Universe.
Next - Displays the User Data Table for the next investment in the
Current Universe.
Copy - Copies the current User Data Table (including column
headings) to the clipboard, which you can then paste to another
spreadsheet program.
Workbook Designer - Displays the editable Workbook Designer
spreadsheet for the current User Data Table.
Save - Saves data input into the User Data Table. This button will not
save format changes made to the table using the Workbook Designer
(See Changing the User Data Table Universal Format above).
Enable Editing - Allows users to edit the User Data Table.
Disable Editing - Prevents users from editing the User Data Table.
Exit - Closes the current User Data Table.
Leverage Data Table
In much the same way as the User Data Table, the Leverage Data Table
allows you to keep additional data on the investments in your database. To
access the Leverage Data Table, click the Leverage button at the bottom
right of the Investment Data Window.
From the Leverage Data Window,
click Enable Editing button at the
bottom of the window.
1. When entering dates, NOTE that
the Fill Dates and Dates (End of
Month) buttons work the same
way as in the Investment Data
Window.
2. Long, Short, and Net columns
are available for both Leverage
88
Single Investment Analysis
and Invested data.
3. When all data has been entered, click Save.
4. Click Disable Editing.
NOTE: The Leverage Data Table is a stand-alone table for compiling historical
data. The data in this table is not linked to other PerTrac tables. However, this
table can be exported into PerTrac Publisher. As a result, if you wish to include
data from this table on your template, it is available.
2.11 - Investment Statistics - View the online tutorial!
The Investment Statistics Window displays summary performance statistics for
a single investment. You can open the Investment Statistics Window by
clicking the Investment Statistics command button located on the left hand side
of the Current Universe Window, or by clicking the button labeled Stats from
the Tool Bar.
At the bottom of the Investment Statistics Window, you will see the Next and
Previous buttons (the left and right green arrows), which allow you to view the
statistics of other investments in the current universe. Also, you will notice the
usual Information, Data, and Charts buttons, which open those respective
89
PerTrac User Manual v.19 1
windows in the same way as the Tool Bar in the Master Window. Finally,
clicking Exit at the lower right will close the Investment Statistics Window. The
remaining buttons will be discussed later in the manual.
Note: The drop-down window on the lower left allows you to toggle between data
vendors when you have duplicate investments grouped.
Statistics Tables - Statistics Definitions
The Investment Statistics Window contains the following statistical tables:
1. Annual Statistics
2. Cumulative and Annualized Returns
3. Time Windows
4. Drawdown
5. Monthly Performance
6. Risk Table
7. Correlation Analysis
When the window is opened, statistics will be calculated and displayed over
the entire performance history of the investment. If you wish to calculate the
statistics over a different period, you may enter these dates manually in the
Start Date and End Date fields at the top right of the window. Once a new
date is entered in either of these fields, PerTrac automatically recalculates all
statistics to reflect the new date range.
Annual Statistics Table
The Annual Statistics Table is located at the top left of the window and
contains the
following six
rows of data
for each
calendar year:
Annual
Return - The total cumulative percent return for the year.
Year End VAMI - The amount that $1000 invested the investment’s at
inception would be worth at the end of the calendar period.
Year End Assets - Total Assets Under Management (in millions) in
the investment at year-end.
Cumulative Dollar Profit - The total profit/loss in dollars (in millions)
from the investment’s inception to the end of the calendar year.
Maximum Annual Runup - The maximum percentage increase from
an equity low to an equity high during the calendar year.
90
Single Investment Analysis
Maximum Annual Drawdown - The maximum percentage decrease
from an equity high to an equity low during the calendar year.
Recent Returns Table
The Recent Returns Table is located just below the Annual Statistics
Table on the left side of the window. This table contains the cumulative
and annualized returns covering various periods from the latest month
through 120 months.
Time Windows Table
The Time
Windows Table is
located below the
Recent Returns
Table and displays
nine rows of
information for
each rolling time
period. A time windows statistic is derived by calculating the statistic for
each rolling period. The table displays statistics for 1, 3, 6, 12, 18, 24, 36,
48 and 60 month rolling periods.
There are three columns for each rolling period. The first column shows
the statistics for all rolling periods. The Gain column shows the statistics
for each rolling period in which the investment posted a gain. The Loss
column shows the statistics for each rolling period in which the investment
posted a loss. Some rows of data use these three columns in different
ways, depending on the nature of the statistic. The Time Windows Table
repeats these three columns for each rolling period length.
The following statistics are displayed in the Time Windows Table:
Count - The number of rolling periods that fall within the Start Date
and End Date.
Average Return - The average arithmetic return for each rolling
period.
Standard Deviation - The standard deviation of the average
arithmetic return for each rolling period.
Sharpe Ratio - The average arithmetic return less the arithmetic riskfree return (annual risk free rate displayed in parentheses) divided by
average arithmetic standard deviation.
91
PerTrac User Manual v.19 1
Best/Worst Periods - Displays the best arithmetic return for the
particular rolling period in the Gain column and the worst arithmetic
return in the Loss column.
Distribution - The number of gaining or losing rolling periods divided
by the total number of rolling periods. Percentages in the Gain and
Loss columns will total 100%.
Gain/Loss $Profit/Loss - The first column shows the ratio of average
gain period to average loss period. The second column shows the
ratio of (Average Gain x % Gain Distribution) divided by (Average Loss
x % Loss Distribution).
Down Deviation (Downside Deviation) - Measures the deviation of
only those data points that fall below a certain return. The statistic is
calculated on three possible returns: Minimum Acceptable Return
(MAR), Risk-Free rate of return, and Zero. The Minimum Acceptable
Return (MAR) can be changed on the Tools tab under Default
Minimum Acceptable and Risk Free Returns. The Risk-Free return,
which is used for the calculation of Downside Deviation, Sortino Ratio
and Sharpe Ratio, can also be changed under Default Minimum
Acceptable and Risk Free Returns. The Zero return calculation is a
default and can not be changed.
Sortino Ratio - The arithmetic average period return less the
Minimum Acceptable Return (MAR, Risk-Free, Zero) divided by the
downside deviation from the MAR. Just as with the Down Deviation
calculation, the Sortino is calculated on the 3 assumptions for MAR
shown in parentheses.
Drawdown Table
The Drawdown Table is located at the bottom left of the window and
consists of three tabs – Drawdown, Consec Gain, and Consec Loss.
The Drawdown tab contains a complete history of all equity drawdowns
since inception, ranked by magnitude of the percentage loss. In addition
to the percentage loss, the following information is displayed for each
drawdown:
Length - The number of months from equity high to the lowest point
before the next equity
high.
Recovery - The
number of months from
the investment took to
recover, measured from
thelowest point to the
next equity high.
92
Single Investment Analysis
Peak - The date of the first negative month (drawdown) after an equity
high.
Valley - The date of the lowest point of the drawdown as measured by
the VAMI index. If the drawdown is only one month long, the start and
end dates will be identical.
The Consec Gain and Consec Loss tabs show all periods of consecutive
gains or losses, ranked by the magnitude of the percent change. In
addition to the change in percentage, the tables also display the length,
start date, and end date of each period.
Monthly Performance Table
The Monthly Performance Table is located at the top right of the
Statistics Window. The Start Date and End Date for the investment are
shown at the top left of the table and the total number of months in the
data record is shown at top right. Below this is a three-column table
showing the percent return for each month, the VAMI index, and the
cumulative return since inception. The arrows to the right of the table can
be used to scroll through the monthly returns. Estimated figures are
displayed in blue.
Risk Table
The Risk Table is located on the right side of the window below the
Monthly Performance Table. It displays monthly, quarterly and annual
statistics for a variety of return and risk measures (see the Appendix for
statistical formulas). The following statistics are included:
Compound Return - This is the compound geometric mean. The
geometric mean is the monthly average that assumes we have an
equivalent rate of return for each month to arrive at the same
compound growth rate as we do using the actual month-to-month
return data. The quarterly and annual compound returns are
calculated using the monthly compound return solution.
Standard Deviation - This is the least squares Standard Deviation
calculation.
Gain Deviation - A variation on the standard deviation calculation that
considers only positive return periods in calculating the mean (gain
mean) and in computing the variation from this mean.
Loss Deviation - A variation on the standard deviation calculation that
considers only negative return periods in calculating the mean (loss
mean) and in computing the variation from this mean.
Down Deviation (Downside Deviation) - Measures the deviation of
only those data points that fall below a minimum acceptable return
(MAR) from the minimum acceptable return. The statistic is calculated
93
PerTrac User Manual v.19 1
3 ways based on the different assumptions for MAR that are shown in
parentheses. The first MAR assumption can be changed by selecting
Default Minimum Acceptable and Risk Free Returns from the
Preferences menu. The second MAR assumption uses the Sharpe
risk free rate, which can be changed at the same time as the minimum
acceptable return. The third MAR assumption is zero, which shows
the deviation of all losing rolling periods below zero.
Sharpe Ratio - The arithmetic average return less the risk-free return
divided by the standard deviation.
Sortino Ratio - The average period return less the Minimum
Acceptable Return (MAR) divided by the downside deviation from the
Minimum Acceptable Return (MAR). Just as with the Down Deviation
calculation, the Sortino Ratio is calculated on the three assumptions for
the Minimum Acceptable Return (MAR) listed above.
Skewness - The degree of asymmetry of a distribution around its
mean.
Kurtosis - The relative peakedness or flatness of a distribution
compared with the normal distribution.
Below the Risk Table are three additional return risk measures:
Sterling Ratio - The average annual return for the latest 36 months
divided by the average of the maximum drawdown during each of the
latest three 12-month periods plus 10%. If 36 months of data are not
available, this statistic is not shown.
Calmar Ratio - The average annual return for the latest 36 months
divided by the maximum drawdown during the latest 36 months. If 36
months of data are not available, this statistic is calculated using the
data available.
Losing Streak - The percent change between the maximum equity
high (high water mark) and the latest month’s equity. If the latest
month’s equity is a high water mark then 0% is displayed.
94
Single Investment Analysis
Correlation Analysis Table
The Correlation Table is located at the bottom right of the Investment
Statistics
Window and
provides a
measure of the
relationship
between the
current
investment and
one or more
benchmark investments.
Correlation statistics are divided among 8 tabs - M, Q, M-Ratios, QRatios M-Up, M-Down, Q-Up, and Q-Down.
The M, Q, M-Up, M-Down, Q-Up, and Q-Down tabs display the following
correlation statistics:
Alpha - The Y intercept of the regression line.
Annualized A - Calculated by annualizing the Alpha for the period.
Beta - The slope of the regression line.
R - The correlation coefficient (Pearson Product Moment Correlation).
R2 - The coefficient of determination.
T-Error - Tracking Error is measured by taking the square root of the
average of the squared deviations between the investment’s returns
and the benchmark’s returns.
Treynor - Treynor Ratio is similar to the Sharpe Ratio, except it the
risk measure in the denominator is Beta, versus standard deviation for
the Sharpe Ratio.
Jensen A - Jensen Alpha quantifies the extent to which an investment
has added value relative to a benchmark. The Jensen Alpha is equal to
the investment’s average return in excess of the risk free rate minus
the Beta times the benchmark’s average return in excess of the risk
free rate.
Active Premium - A measure of the investment’s annualized return
minus the benchmark’s annualized return.
Information Ratio - The Information Ratio is the Active Premium
divided by the Tracking Error. This measure explicitly relates the
degree by which an investment has beaten the benchmark to the
consistency by which the investment has beaten the benchmark.
95
PerTrac User Manual v.19 1
Start - The earliest month taken into consideration for the benchmark.
In order for correlation statistics to be accurate, the benchmark data
must coincide with that of the current investment. Therefore, the Start
Date for the current investment must not fall before that of any of the
benchmarks. If this is the case, the data for the benchmarks will
appear in blue, indicating that there is insufficient data to perform a
proper correlation analysis. To display more accurate correlation
statistics, you may change the Start Date of the current investment so
that it does not predate the benchmark data.
End - The latest month taken into consideration for the benchmark
investment. Accurate correlation statistics require that the End Date
for the current investment must be after that of any of the benchmarks.
If this is the case, the data will be displayed in blue, as above. To
display more accurate correlation statistics, you may change the Start
Date of the current investment so that it does not outdate the
benchmark data.
Sharpe Ratio - The arithmetic average return less the risk-free return
divided by the standard deviation.
NOTE – The key for correlation analysis is that the current investment and
the benchmarks must share common date ranges in order to make a valid
comparison. If the benchmarks contain more data than the current
investment, PerTrac will automatically decrease the date range the
benchmark. However, if the benchmark contains less data than the
current investment, you must narrow the date range for the current
investment by changing the Start Date and End Date.
The M-Ratios and Q-Ratios tabs contain the following correlation
statistics for monthly and quarterly periods, respectively:
Up Capture - The Up Capture Ratio is a measure of the investment’s
compound return when the benchmark was up divided by the
benchmark’s compound return when the benchmark was up.
Down Capture - The Down Capture Ratio is a measure of the
investment’s compound return when the benchmark was down divided
by the benchmark’s compound return when the benchmark was down.
Up # - The Up Number Ratio is a measure of the number of periods
that the investment was up when the benchmark was up, divided by
the number of periods that the benchmark was up. The larger the ratio,
the better.
Down # - The Down Number Ratio is a measure of the number of
periods that the investment was down when the benchmark was down,
96
Single Investment Analysis
divided by the number of periods that the benchmark was down. The
smaller the ratio, the better.
Up % - The Up Percentage Ratio is a measure of the number of
periods that the investment outperformed the benchmark when the
benchmark was up, divided by the number of periods that the
benchmark was up. The larger the ratio, the better.
Down % - The Down Percentage Ratio is a measure of the number of
periods that the investment outperformed the benchmark when the
benchmark was down, divided by the number of periods that the
benchmark was down. The larger the ratio, the better.
% Gain - The Percent Gain Ratio is a measure of the number of
periods that the investment was up divided by the number of periods
that the benchmark was up. The larger the ratio, the better.
Start - The earliest month for the benchmark data. Again, for accurate
statistics, the benchmark data must coincide with that of the current
investment.
End - The latest month for the benchmark data.
2.12 - The Correlation Universe - View the online
tutorial!
The Correlation universe (Correl.unv) is a system universe that was installed on
your computer when PerTrac was installed. You will populate this universe with
benchmarks you want to have access to and use throughout the program. By
default, PerTrac will look to this universe for the selection of benchmarks when
performing regression for correlation statistics (the benchmark analysis table on
the Investment Statistics Window), when selecting comparative benchmarks
for investment charts, as well as comparative benchmark selection in the various
modules of PerTrac. The following steps will walk you through adding
benchmarks to your correlation universe.
1. Select Change Correlation Preferences from the Preferences menu
2. The Correlation Preferences Window displays all the investments of the
current universe on the left, and all the investments that currently make up
the Correlations Universe on the right. Add and remove investments as
needed.
3. Click Save Correlation Universe.
4. You will see a message saying that the Correlations Universe has been
saved. Click OK.
5. Exit the Correlation Preferences Window.
6. Click the Recalc button to update the correlation statistics.
97
PerTrac User Manual v.19 1
TIP: Do not delete this file. If PerTrac can’t find this file, you will receive an
error message.
2.13 - Assigning Benchmark Universes - View the online
tutorial!
Since different investments are compared to different benchmarks, you may
want to assign a separate benchmark universe to different investments. The
Correlation Universe is the default universe assigned to all investments.
However, you can create custom benchmark universes containing only those
benchmarks that apply to a certain asset class or investment strategy. Please
see the section on creating universes for instructions on creating the
benchmark universes. Once universes are created, follow these steps to
assign a particular benchmark universe to a specific investment.
1. Select the investment to which you wish to assign a benchmark universe,
or, if you wish to assign benchmarks to all investments in a given
universe, open the desired universe.
2. From the Tools menu, select Assign Benchmark Universe.
3. When the Assign Benchmark Universe window opens, make the
selection to assign the benchmark universe to the current investment, or
each investment in the current universe.
4. Click Locate to select the desired benchmark universe.
5. Click OK.
2.14 - Exporting
Investment
Statistics
You may find it
useful to export
PerTrac’s investment
statistics to another
program where you
can manipulate the
layout of the data,
transfer it to a disk,
or print it out for a
presentation.
1. From the
Information
Statistics Window, click the Export button.
2. In the Statistics Export Window, there are Page Setup and Print options
which you can use now to change the page setup.
98
Single Investment Analysis
3.
4.
5.
6.
To save this data for use in another program, click Save As.
Select a destination folder, enter a file name and a file type, then click Save.
Click OK.
Exit the Statistics Export Window.
In addition to the Save As feature in the Statistics Export Window, a Copy to
Excel menu provides the option of exporting to either a new Excel workbook or
an existing Excel workbook.
Selecting Autofit
Columns from the Copy
to Excel menu instructs
Excel to find the most
suitable width for each
column. When activated,
a check mark will appear
in the menu to the left of
Autofit Column.
The Options menu
contains a Set Line Length For Memo Fields function, which allows you to
decide the maximum amount of characters per line for each of the memo
fields. The length may be as small as 10 characters or as large as 254
characters.
Statistics for the correlation universe can be exported to the same
workbook by selecting Calculate Benchmark Statistics from the Options
menu. When exported, each item in your correlation universe will have
corresponding Statistics, Drawdown, Correlation, & Performance worksheets,
providing you with more data to choose from for your tables and charts.
Similarly, selecting Calculate Benchmark Comparison Sheets from the
Options menu allows you to export three additional sheets that provide side
by side analysis of the investment and its benchmarks.
Right-clicking over an individual table allows you to copy only that table to the
clipboard, so that you may then paste the information into another program.
99
PerTrac User Manual v.19 1
Displays and Charts
The Investment Statistics Window offers a convenient set of statistical tools
that allow you to further analyze the current investment.
Monthly Performance Table
Clicking the Monthly
Performance button
opens the Monthly
Performance Table,
which displays the
complete monthly
performance history for
the current investment. For each year, a row of data supplies the performance
(in percentage format) from January to December, followed by the value for the
entire year. This table can be copied to the clipboard by right-clicking over the
table, then clicking Yes. This will allow you to paste the table in another
program.
Rolling Returns Summary
Clicking the Rolling Returns button opens the Rolling Returns Summary,
which displays the rolling performance history for various time periods ranging
from one month to ten years. This table can also be copied to the clipboard
using the same steps as above.
Quick Charts
Clicking the Quick Charts button creates four convenient charts pertaining to the
current investment. Each chart (VAMI Chart, Benchmark Chart, Rolling
Statistics Chart, and Distribution of Returns
Chart) provides a quick visual representation of
the data and also contains a multitude of layout
and print options. Clicking the Chart Options
button will provide you with several
customization features. Of course, this is just a
hint of what you will be able to accomplish
through the Investment Charts Window,
explained in section 2.15 below.
100
Single Investment Analysis
2.15 - Investment Charts - View the online tutorial!
PerTrac gives you the ability to quickly create, edit, and save a wide variety of
charts created in the Investment Charts Window by clicking the Investment
Charts command button from the Current Universe Window or by clicking the
button labeled Charts from the Tool Bar.
Along the left side of the Investment Charts Window is a selection of 13
different chart types, as well as Start Date and End Date boxes with which to
define the time period for your chart. The rest of the window consists of 3
options areas that allow you to further define your chart.
Creating an Investment Chart
The following is a simplified list of the steps required to create a chart.
Different chart types require different options to be entered. For more specific
assistance, please call technical support or schedule additional training.
1. From the Investment Charts Window, select a chart type that will
best present the information you would like to see. The options
available for creating you chart will depend on your selection of the
chart type.
2. Enter a Start Date and End Date in the lower left corner of the
window. The initial settings for these fields reflect the entire time
101
PerTrac User Manual v.19 1
3.
4.
5.
6.
period for which data is available. If you are creating a correlation
chart, you may need to narrow this date range to match the benchmark
dates.
Modify the relevant chart options to suit your needs.
Click OK to display the chart.
Customize the chart using the Chart Designer, Edit Chart Data, or
Wizard options from the pop-up menu.
You can also print or save the chart, if necessary, from the pop-up
menu.
Once a chart has been saved, you may open it from the Master Window
by selecting Load Chart from the File menu.
Chart Options
Geometric Statistic Charts
The following options are associated with the chart types in the upper left
corner of the window (VAMI, Cumulative Return, Percent Rate of
Return, Cumulative Dollar Profit, Dollars Under Management, and
NAV):
Volatility Bands - Volatility bands are plotted two standard deviations
above and below the moving average. The moving average itself is
plotted for the time period specified in the box to the right of the
selection. For instance, selecting Volatility Bands and entering “10” in
the box would plot a 10-period moving average and 2 standard
deviation volatility bands above and below the 10-period moving
average.
Moving Averages - Specify up to three additional moving averages.
Again, the length is set in the box to the right of the selection and is
expressed in number of periods.
Linear Regression - Check this box to display a linear regression line
on the chart.
Second Axis - A second axis can be charted by selecting one of the
buttons from the listed options.
Momentum Index (In Second Axis choices) - This index is a measure
of directional momentum.
Period - Period may be monthly, quarterly, or yearly.
Index 1, Index 2 - Check one or both of these boxes to display the
performance of additional comparative investments on the chart. Use
the drop down list box to select the comparative benchmark. The
102
Single Investment Analysis
benchmarks listed will be those currently in the Correlation Universe
(Correl.unv).
Distribution of Returns
This bar chart displays the distribution of returns for the current investment
in fixed increments. You can specify both the increment and range (above
and below 0%) of the rate of return.
Rolling Statistics
Annualize Statistics - Annualizes the data for the current chart.
Show Rate of Return Bars - Incorporates the monthly rate of return
bars in the chart.
Plot Statistic-Return Scatter – Places return on the Y-axis and the
selected statistic on the X-axis and connects the points in sequential
order.
Number of Rolling Months - Allows you to choose the rolling period
length. You can select to plot up to three different rolling periods.
Data Type - Allows you to choose a period length, either monthly or
quarterly, for the rolling average return calculation.
Rolling Correlations
103
PerTrac User Manual v.19 1
Rolling Correlations Options – The rolling correlations options
include: Alpha, Beta, Correlation(R), R-Squared, Information Ratio,
Tracking Error, and Beta T-Stat.
Plot Investment - Plots the cumulative return for the current
investment.
Plot Benchmark - Plots the cumulative return for the benchmark.
Differential Performance
Plot Cumulative Differential Return - Plots the cumulative differential
return.
Recent Returns
Plot Historical Average - Check this box to chart the average rate of
return for the period.
Plot Standard Deviation - Check this box to chart the standard
deviation for the period.
Show Benchmark - Check this box to chart the standard deviation for
the period.
Display Options - Toggles between Annualize Returns and
Normalize Returns.
Periods To Display - Allows you to select or de-select particular
periods.
Universe Risk/Return Options
Use Risk Free Rate – When plotting the CAPM (Capital Asset Pricing
Model) line, select this option if you want to use the risk free rate of
return that was set in the Default Minimum and Risk Free Returns
window located on the Preferences tab.
Risk Free Asset – When plotting the CAPM (Capital Asset Pricing
Model) do not check Use Risk Free Rate as above, but click the dropdown menu to select a Risk Free benchmark rather than the risk free
rate.
Risk Asset - When plotting the CAPM (Capital Asset Pricing Model)
click the down arrow to select the risk asset for the CAPM line.
Period – Select the period: Monthly, Quarterly, or Yearly; check the
box to Annualize Returns if you want annualized risk and return
104
Single Investment Analysis
numbers; elect to Plot CAPM Line; elect to Plot Cross Hairs which
will plot the cross hairs through the selected benchmark.
Scatter Correlation & Efficient Frontier
Two investments or indices must be specified for these comparative
charts.
X-Axis Investment - Investment or benchmark to be used as the XAxis for Scatter Correlation & Efficient Frontier
Y-Axis Investment - Investment or benchmark to be used as the YAxis for Scatter Correlation & Efficient Frontier
Period - Period may be monthly, quarterly, or yearly.
Editing a Chart
Each chart in PerTrac
consists of several objects;
including legends, axis titles,
axis labels, and series points
all of which can be
reformatted to create a
specific style. While editing a
chart, the pop-up menu
provides you with Chart
Designer, Edit Chart Data,
and Wizard options. The Chart Designer window works similar to Excel chart
formatting windows.
Editing Chart Data
The Edit Chart Data option allows you to change the headings, dimensions,
size, and contents of the table that contains the data for your chart.
Chart Wizard
Selecting Wizard begins a four-step process
that allows you to change the general
appearance of the chart, such as from a pie
chart to a bar chart.
105
PerTrac User Manual v.19 1
Clicking the Blank Chart button from the Investment Charts Window
creates a blank chart that you can use to create a chart from scratch by using
the methods explained above.
Exporting Charts and Data
By using the Copy option from the pop-up menu, you can paste both the data
and the chart to another program.
1. Right-click over the chart and select Copy.
2. To paste the data, right-click over a cell in Excel and select Paste.
3. To paste the chart, right-click in Excel and select Paste Special, select
Picture, and then click OK.
Creating Chart Templates
All charts in PerTrac have a basic format when generated. If you want to
change your chart formats (i.e. fonts, colors, titles) you can format the chart
and save it as a template. Using your template will eliminate the need for you
to re-format the chart each time you create it. For example, you could make
your formatting changes and save the chart as a template by right-clicking on
the chart and selecting Save. By saving the chart you are actually saving the
formats. You would name your chart say, "MyVamiChartTemplate.vtc". If
necessary, you can create a different chart template (different formatting) for
each type of chart you use. The next time you create the chart our basic chart
formats will appear. To access you saved template click the Copy to
Template button at the top left of the chart window, and select the desired
chart template from your personal gallery.
Investment Chart Examples
Percent Rate of Return Chart Example
Suppose you want to create a chart showing an investment’s quarterly
returns over the past three years.
1. From the Investment Charts Window, click the button labeled
Percent Rate of Return on the left side of the window under Chart
Type.
2. If you want a second axis displayed, check the appropriate button
from the list of options located in the Second Axis frame.
3. Select Quarterly from the Period buttons.
4. Specify the 3-year time frame for the chart by entering a Start Date
and an End Date, keeping in mind that quarterly date ranges must
begin on January, April, July, or October, and end on March, June,
September, or December.
5. Click OK to display the chart.
106
Single Investment Analysis
Rolling Period Chart Example
Say, for example, that you would like to create a chart showing an
investment’s average rolling 12-month rate of return line together with
monthly return bars.
1. From the Investment Charts Window, click the button labeled
Rolling Statistics on the left side of the window under Chart Type.
2. Select Compound Return under Rolling Statistics Options.
3. Type 12 into the Number of Rolling Months box at right to specify
the length of the rolling period calculation.
4. Check the Box labeled Show Rate of Return Bars and select
Monthly under Data Type.
5. Type in the desired time frame using the Start Date and End Date
boxes at lower left, or leave them alone to include the investment’s
entire data history.
6. Click OK to display the chart.
Scatter Correlation
Suppose you want to chart the monthly correlation of an investment to a
benchmark (e.g. S&P 500, Russell 2000, CSFB Hedge Fund Index)
1. From the Investment Charts Window, click the button labeled
Scatter Correlation on the left side of the window under Chart Type.
2. Select S&P500 Stock Index from investments listed in the drop down
list for the X-Axis (the index must be included in the correlation
preference universe, correl.unv, to show up in the list. For more
information, see Changing Correlation Preferences.
3. Click the Investment button to select the active investment for the YAxis
4. Select Monthly from the Period buttons.
5. Enter the Start Date and End Date, keeping in mind that the
benchmark investment must have at least the same months’ data as
the current investment.
Click OK to display the chart.
The SQL version of PerTrac gives the users a higher level of
investment information customization. The following features
are unique to the SQL version of PerTrac. These features are
designed primarily for increased efficiency for User
Information data.
107
PerTrac User Manual v.19 1
2.16 - Adding Daily/Weekly Data
You can open the Daily/Weekly Investment Data Window by clicking the
command button from the left-hand side of the
Current Universe Window or by clicking the button labeled
from the Tool Bar. The Daily/Weekly data sheet is similar
to the traditional Monthly/Quarterly data sheet in that the same data sheet is
used for either data series. The following steps will walk you through adding
a new investment with daily or weekly data.
Note: If you are adding daily or weekly data to an existing fund, skip
step #1 below and start with #2.
1. Click Add New investment , the first button on the left hand side of the
Home window. When the Add New Investment window opens, enter a
name for your fund and click Enter.
on the left-hand
2. Highlight your fund, then click
side of the Current Universe Window or by clicking the button labeled
from the Tool Bar.
3. The Daily/Weekly data window appears:
Note: This sheet contains five columns of data: Date, Performance, NAV,
Estimate and Month To Date.
•
108
Date: Contains daily or weekly dates. Weekly dates must have a
Friday ending date. The Fill Dates (Daily) and Fill Dates (Weekly)
options will populate this column for you.
Single Investment Analysis
•
Performance: Contains daily or weekly performance. PerTrac
statistics are calculated from this column of data. You can use the
performance data to calculate the NAV column. Once the performance
has been entered, highlight the NAV column and click Calculate NAV
from the command bar.
•
NAV: Contains net asset values. PerTrac statistics are not calculated
from this column of data. However, if you receive your daily or weekly
data in NAV format, you can enter those values and then use the
Calculate Performance option to calculate the daily or weekly
performance based on the change in NAV. Once the NAV has been
entered, highlight the Performance column and click Calculate
Performance from the command bar.
•
Estimate: Use this column indicate whether or not you returns are
estimates. Enter either Yes or No.
•
Month To Date: The Month To Date column is linked to the
Performance column. If you enter data directly to the performance
column, or calculate the performance from the NAV column, the
Month To Date column will update automatically. Conversely, if you
enter a month to date value, the performance will column will update
based on the change in the month to date column.
•
Note: If you convert your daily data to monthly with the Convert To
Monthly option from the command bar, and you don't have a full
month of data, the return in the Month To Date column will be entered
on the monthly data sheet.
4. Click Enable Editing at the bottom of the Daily/Weekly Data
window. Enabling editing allows additional functionality to become active.
Some of the buttons at the bottom of the window will change from grayed out
text (inactive) to black text (active).
5. Click the down arrow on the window next to the heading "Market
Closures". Select U.S.A. Holidays.
Note: When entering daily data there will be numerous days throughout
history when the US markets were closed. (i.e. holidays, weather, world or
economic events, etc.) The daily data sheet has to account for these day.
You can not skip days when entering data. To account for those market
closures, we have included a "Market Closures" schedule that will allow you
to skip those dates when entering your data. The "Market Closures" schedule
accounts for all US market closures back to January, 1965. This schedule
can be edited if you actually traded on any of these closed days, or if
you did not trade on dates not listed. To edit the schedule click the
"Edit Markets" to the right of the window, and select "U.S.A. Holidays"
from the drop-down menu. You can now insert dates you did not trade,
or delete a closed date.
109
PerTrac User Manual v.19 1
6. Your daily or weekly data can be copied from Excel or entered manually.
If your data is copied from Excel the dates have to be formatted with a valid
Excel format. If you enter the dates manually, type the date of your first
return in cell 1. Highlight any number of rows below row 1 and click Fill
Dates (Daily) if you are entering daily data. Select Fill Dates (Weekly) if you
are entering weekly data.
NOTE: Weekly data must have a Friday end date. If you copy weekly data
from Excel, or enter your data manually, and enter a date other than a Friday
ending date, an error message will appear indicating your date is not a Friday
date. The Fill Dates (Weekly) option will automatically enter Friday ending
dates.
TIP: If you copy and paste the performance data from Excel, the return
format has to be taken into account. If your returns are in percent format in
Excel check the option "Enter Performance as a Decimal" on the top of the
data entry sheet. If your returns are in number format in Excel check the
option "Enter Performance as Percent". These options also apply when
entering data manually. If "Enter Performance as a Decimal" is checked
you enter returns in decimal format. (i.e. 2.0% as .02) If the "Enter
Performance as Percent" is checked enter your returns in number format.
(i.e. 2.0% as 2.0)
The command buttons:
1. Enable/Disable Editing: Enable edit must be selected prior to adding or
editing data on this sheet. When data has been entered or edited click
Disable Editing to exit and save your data.
2. Statistics:
110
Single Investment Analysis
The daily statistics window is similar to the Investment Statistics window for
monthly data, which will show the date range of your analysis, number of
days, Risk Table, Drawdown, Consecutive Gain, and Consecutive Loss
tables, daily and weekly correlation statistics, daily and weekly capture
ratios.
3. Charts:
The daily and weekly chart window options: NAV, Cumulative Return,
Distribution of Returns. A second Y-Axis can also be generated on: Percent
Rate of Return and Drawdown. One or Two benchmarks can be included on
the NAV and Cumulative Return charts.
4. Calculate NAV: If your daily or weekly data was entered in the
Performance column, use this option to create a NAV stream based on the
performance.
5. Calculate Performance: If your daily or weekly data was entered in the
NAV column, use this option to calculate the daily or weekly performance in
percent format. Note: if you copy or manually enter NAV data, you must use
the Calculate Performance option. PerTrac calculates all statistics from the
performance column.
6. Fill Dates (Daily): This option will fill the Date column with daily dates.
7. Fill Dates (Weekly): This option will fill the Date column with weekly dates.
Note: the dates entered will always end on a Friday.
8. Convert to Monthly: This option only applies to daily data. If you would like
to use all of PerTrac's functionality to analyze your data, you have the option
of converting your daily data streams to monthly data streams. This option will
populate the monthly data sheet. If selected, your fund will not have two data
sheets, one with daily data the other with monthly. Note: If your fund has an
existing monthly data sheet, and you select this option on the daily data
sheet, a message will appear asking you if you want to replace your
existing monthly data.
9. Save: When all data has been entered or edited, click Save.
10. Exit: When your data has been saved, exit the data sheet.
111
PerTrac User Manual v.19 1
Daily/Weekly Data Reports
The daily/weekly data module contains an export reporting function similar to
PerTrac publisher report generation. PerTrac exports the statistics tables and
charts to an Excel workbook. You can then create custom reports from scratch or
use one of the templates installed on your computer. The following steps will
walk you through generating daily/weekly data reports.
1. Open the Daily/Weekly Investment Data Window by clicking the
command button from the left-hand side of the
Current Universe Window or by clicking the button labeled
from the Tool Bar.
2. Click Statistics on the command bar. This will open the daily/weekly data
investment statistics page.
3. The daily/weekly data statistics page contains a Generate Report button on
the upper right corner. Click Generate Report to open the Daily Report window.
4. Click Locate to open the file selection window. The Custom Reports folder will
open by default, which contains the Master template "MasterDailyReport.xls" file
for creating your report from scratch, and a pre-built daily data report template
"Daily Report.xls".
5. Select "Daily Report 1.xls" and click Export. Your report is now open as and
Excel workbook.
Note: The "MasterDailyReport" and "DailyReport" files can also be used for
weekly data streams.
112
Single Investment Analysis SQL Version
2.01(a) - Make Database Relational
Make Database Relational - Located on the Tools tab, this option will scan
the SQL database for Investment Manager (Company)/Investment (Fund)
relationships. This feature also enables the sharing of investment information
created with the Add New Investment button, the new Set Company Fields
and Create Dropdown List features. Make Database Relational will also create
a list of Manager (Company)/Investment (Fund) relationships that can be viewed
by clicking the new Show Managers button on the left hand side of the Home
Window.
TIP: Make Database Relational must be run prior to using the Set Company
Fields, Create Drop-down List and Show Managers features.
NOTE: The Related Funds feature available in both Access and SQL versions
of PerTrac, differs from the Make Database Relational feature available only in
the SQL version of PerTrac. The Related Funds feature will find all funds that
have the identical first-field (the first upper left field) values on the General
Investment Information page. Depending on the data vendor, that field could be
manager name, fund name, company name etc. Related Funds will list all
investments with the identical value in that field. Make Database Relational
takes the relationships one step further by using a number of other fields on the
General Investment Information page to further group investments. For example,
address information or contact information will be scanned to determine if there is
a match.
2.02(a) - Adding New Investments
Add New Investment – The
Add New Investment window now
contains the functionality to not only
name your investment, but to also
assign your new fund to a new or
existing Company. The Add New
Investment button is the first button
on the left hand side of the PerTrac
Home window.
113
PerTrac User Manual v.19 1
TIP: The result of assigning a fund to a new or existing company will be to create
a relationship between funds with the same Manager Name, Fund Company,
Company Name, Fund Family or other field label shown in the first field on the
upper left hand side of the general Investment Information page.
NOTE: There is a 32,766 investment limit that applies to the Microsoft Access
database version of PerTrac. The SQL version of PerTrac has no limit on the
amount of investments in your SQL database. However, if you exceed 32,766
investments in your SQL database, the check boxes next to each investment
name will disappear. The Create Checked Items Universe function will not be
available.
2.03(a) - Set Company Fields
Set Company Fields – Click the
Preferences tab located on the upper
menu bar. Select Set Company Fields.
This feature lists the first 19 fields on the
general Investment Information page,
starting with the first field on the upper left.
Set Company Fields can be applied to
existing data vendor databases, but more
importantly when adding qualitative data to
user-entered investments. You may set
field names and values that will apply
across numerous relational funds which
means you no longer have to add this qualitative information one fund at a time.
For example, let’s say you have a field labeled “Fund Manager” that contains the
name of a portfolio manager who manages multiple funds. You only have to add
the manager’s name to one of the funds. Selecting “Fund Manager” on the Set
Company Fields option will insure that the portfolio manager’s name shows up
for all related funds. In fact, all funds with the same value in the first field on the
General Information page will then show the portfolio manager’s name in the
“Fund Manager” field.
TIP – The 19 field labels shown on the Set Company Fields window are linked
to the data source “.des” description file. To change the labels for your userentered funds, which will then change the labels in the Set Company Fields
window, highlight one of your funds in the PerTrac Home window. Click the
Investment Information button, located on the left side of the Home window.
The General Information page will appear. Click, Enable Edit at the bottom of
this window. You may now change the labels in the first 19 fields starting in the
upper left hand corner. When the labels have been changed click Save, and then
Disable Edit.
114
Single Investment Analysis SQL Version
2.04(a) - Create Dropdown Lists
Create Dropdown Lists - This
feature allows the user to add custom drop
down lists to the System Information &
User Information pages on existing data
vendor databases. However, the real
benefit of this new feature is seen when
adding your own user-entered
investments. You can add drop down lists
to the System Information pages as well
as the User Information pages. You can
also import drop down lists. Again, this
may be used to expedite the sharing of
investment information among multiple
investments. The following steps will walk you through adding a dropdown list to
your User Information pages.
Step 1: Click the Preferences tab on the upper menu bar. Select Create
Dropdown List.
Step 2: Click on the Data
Source label. Now click Add,
located on the menu bar to
select the Data Source for
which you wish to create a
dropdown list. Once you’ve
clicked Add, a window will appear prompting
you to choose a data vendor file with the
extension “.des” For user-entered funds click
the “User.des” file. Remember that you can’t
edit the System Information Pages if the data
source is set to anything other than User. If you select Hedgefund.net,
Morningstar, or any other data vendor for instance, you will only be able to add
dropdown lists to the User Information Pages. If you add dropdown lists to the
System Information Pages, the data will be overwritten the next time you
update the data vendor database.
115
PerTrac User Manual v.19 1
Step 3: Click the plus sign next to the System or User Information Page to
which you are adding the dropdown list to. There are 50 available fields on each
System and User Information Page which are labeled Field 1 – Field 50.
NOTE – By defaut, the labels shown are Field 1- Field 50. However, if you enter
labels on the information pages those new labels will be shown the dropdown
list.
Step 4: Add your new dropdown item. Click on the
Field 1 label. Then click the Add button on the menu
bar and select
Add New Dropdown Item.
Step 5: Name your dropdown items. As you add and name your dropdown
items, they will appear under the field to which you are adding them to. In this
example the field name is
Legal Docs. Remember,
however, that this label can be
changed at any time by going
to that field on the User
Information Page, clicking
Enable Edit, then entering a new name for that field. Once you add your labels
to the User Information page fields they will show up in the Create Dropdown
List window. Then add dropdown items associated with that field.
TIP – Your dropdown items can take numerous forms. They could be names,
places, text or a link to a document file. For example, you could set a link to a
Word document,
Excel spreadsheet, or any other file you wish to associate with a number of
funds.
Step 6: Click Save to save your new dropdown list items.
Step 7: View your new dropdown items. To view your dropdown items, highlight
a user data source investment at the Home window. Click the Investment
Information button on the left hand side of the Home window. When the
Information Window opens click the down arrow next to the User Information
tab, located on the upper menu bar. Click the 1_User Information Window tab.
116
Single Investment Analysis SQL Version
When you click the white area to the right of the label you will now see a small
dropdown arrow. Clicking the dropdown arrow will display the items in the
dropdown box. Select an item to enter under “Legal Docs”. This item will now
appear in the window for this fund and any other fund with a relational link to this
fund.
2.05(a) - Show Manager Display
Show Manager Display – Located on the Home window, this
feature lists all related funds linked by way of the Make Database
Relational feature, located on the Tools tab. Once the database
has been made relational, you can view a list of funds related to
the same managers, company name, fund family, etc.
When the list appears click the plus sign next to fund manager to
display a dropdown a list of related funds. There are three options
to work with on the Manager Display window.
1. Add Manager – The Add New Manager window
contains the first 19 fields on the general Investment
Information page. Select the data source in the lower
left to which the changes will apply. This will most often
be the User data source, which will appear for your
user-entered funds. When all data has been entered,
click the Save Changes and then Disable Editing.
2. Edit Manager – The Add New Manager window
contains the first 19 fields on the general Investment
Information page. Click Enable Edit. Make your
editing changes and click Save Changes, Disable
Editing and Exit.
3. Remove Manager – This option will completely
remove a manager from the database.
117
Universe (Multi-Fund) Analysis
3.01 - Creating Universes - View the online tutorial!
The term “universe” is PerTrac shorthand to describe a list of investment names.
There is no investment data stored in a universe file – instead, the universe files
are used by PerTrac to rapidly retrieve information on a list of investments from a
database upon command. PerTrac allows you to group investments from the
entire database, or Master Universe (“All.unv”), into any number of customized
subset universes that contain only the investments you select manually, through
statistics searches, or through information searches.
Creating a Checked Items Universe
This feature in PerTrac provides you with a convenient, manual way to start a
universe. Each investment in the Current Universe Window has a check
box that can be used to select, or de-select, an
investment.
1. Check the investments that you wish to
include in your universe.
2. Click the Create Checked Items Universe
button. This opens the Create New
Universe Window. This window contains two list-boxes, placing all of
the investments from which to select your universe in the Current
Universe List Box on the left, and all the investments that you have
selected in the New Universe List Box on the right.
3. You may continue to add and remove items until you have the
universe of investments you want.
4. Click Save New Universe.
5. When the Save As window opens, enter a name for your universe.
6. Click Save.
Manually creating a new universe without check boxes
Another way to manually create a new universe is to click the Create New
Universe button from the Current Universe Window. This time, when the
Create New Universe Window appears, the Current Universe List Box on
the left will contain the investments from which you can select, but the New
Universe List Box will be empty.
1. Select an investment from the Current Universe List Box and click
the Add button to move that investment to the New Universe List
Box. The Add All button can be used to add all of the investments in
the Current Universe Window to the New Universe List Box.
Double-clicking an investment in the Current Universe List Box will
also add that investment to the New Universe List Box. Add
118
Universe (Multi-Fund) Analysis
investments until you have the universe of investments that you want.
Once investments have been added, the Remove and Remove All
commands can be used to reduce the number of investments in the
New Universe List Box. The Add, Add All, Remove and Remove All
commands are also available from the right-click menu.
2. Click Save New Universe.
3. When the Save As window opens, enter a name for your universe.
4. Click Save.
NOTE – While in the Create New Universe window, multiple consecutive
items may be selected by dragging your mouse over them. Non-consecutive
items may be selected by clicking the mouse while holding down the CRTL
key.
TIP – A right click with the mouse button in the Home screen
will give you a shortcut to creating or opening a universe.
Creating a new universe by modifying an existing universe
Another way to create universes is by loading an existing universe into the
New Universe List Box, then adding and removing investments as desired.
1. From the Create New Universe Window, click Add to a Universe.
2. When the Open dialogue box appears, select an existing universe file,
then click Open. This places all investments from that universe into
the New Universe List Box.
3. Add and remove items until you have the universe of investments that
you want.
4. Click the Save New Universe button.
5. When the Save As window opens, enter a name for your universe.
6. Click Save.
TIP: Always save the universes after creation, even if only in a temporary file
such as “Temp.unv”.
I. Search Builder
Search Builder is a powerful new search engine that combines the current
Information and Statistics search engines into a single search engine with the
following features:
1. The ability to select qualitative and quantitative criteria in the same search.
2. The ability to search across multiple data sources in a database when
selecting Information search criteria.
119
PerTrac User Manual v.19 1
3. The option to automatically remove duplicate records from the resulting
universe of investments when a search is completed.
4. The option to save your set of search criteria as a search file that can be
used again later.
The new Search Builder search engine can be accessed three different ways
from within PerTrac: (1) the Search button located at the top of the PerTrac
window; (2) the Tools menu in the menu bar; (3) the more familiar Create New
Universe button at the left of the Home/Current Universe window. The Create
New Universe window no longer contains the “Select by Information Search” or
“Select by Statistics Search” buttons. They were replaced by the single “Search
Builder” button. Either of these options will open the new PerTrac Search
Builder window.
Search Builder Table Options
1. And/Or: These options control the logical order in which the search will be
run.
2. Info/Stat: Select Info to choose from Investment Information search
criteria, or Stat to choose from quantitative criteria.
3. Data Source: Allows you to select which data source to use when
searching on information fields. (Different data sources contain somewhat
different information fields; the information fields listed in the Criteria
column will depend on which data source is chosen.) Multiple data
sources can be included in a search by selecting different data sources on
different rows in the Search Builder.
4. Criteria: This is where you will select the actual information or statistic
field to be included in the search. (Note: The available statistics are
currently the same as those available in the statistics search function of
120
Universe (Multi-Fund) Analysis
earlier versions of PerTrac. However, more statistical search criteria will
be added in the future.) The available Info or Stats fields can be viewed
either in one long alphabetically ordered list or grouped into various
PerTrac categories.
5. Operator: Equals, does not equal, greater than, greater or equal to, less
than, less than or equal to. Applies to both Info and Stat search criteria.
6. Value: The requested value entered by the user. Applies to both Info and
Stat search criteria.
7. From: Enter the start date for the selected criteria. You can search Start
of Data (Since Inception), or enter a Month/Year.
8. To: Enter the end date for the selected criteria. You can search, End-Date
Parameter (a shortcut when running a saved search each month and you
want the statistic run through the new month end date without having to
change the end date each month), End of Data or enter a Month/Year.
9. Benchmark: This option applies when selecting correlation statistic
criteria. When a correlation statistic has been selected under the Criteria
column, the Benchmark column will light up for your benchmark selection.
(Note: When you click the down arrow to select a benchmark, you will see
a list of all your assigned benchmark universes. By default the Correl.unv
is assigned to all funds in your database. If you have not assigned
additonal benchmark universes to your funds, the Correl.unv will be the
only listed universe to choose from).
10. Period: The period options are Monthly or Quarterly.
Search Builder Tool Bar Options
1. File: Contains options for starting a new search, saving and deleting
searches, and resetting your search options.
2. Edit: Typical editing features used in spreadsheet applications: cut, copy,
paste, insert rows, delete rows, clear contents in a row, move criteria up or
down, and grouping functions to group your criteria based on And/Or logic.
3. View: Allows the user to view the Criteria lists by category or
alphabetically, and to launch the Value Hints, Options or Errors tabs.
4. Run: Run a search or check for errors.
5. Help: Contains a brief document on how to start a search.
6. Saved Searches: This drop-down menu will contain a list of your saved
searches. (Note: If you select search criteria, run the search, and then exit
without saving, PerTrac will automatically save your search for you. When
you click the down arrow saved files will be named “Autosave1”,
“Autosave2”, etc.
121
PerTrac User Manual v.19 1
7. Search Name: Use this field to name your search. Once a name has
been entered, click the Save icon just to the right of the field.
8. Universe: This drop-down menu allows you to select the universe on
which you will run your search. The list will include All.unv (the universe
containing all investments in the current database) as well as any
universes saved in the Universe folder.
Search Builder Shortcut Options
These buttons appear at the right side of the Search Builder window.
1. Click Run Search! to run your search.
2. Click Move-Up to move the selected row up in the Search Builder table.
3. Click Move-Down to move the selected row down.
4. Click Add Row Above to insert a row above the highlighted row.
5. Click Add Row Below to insert a row below the highlighted row.
6. Click Delete Row to delete the highlighted row.
Value Hints, Options & Errors
These tabs appear at the bottom of the Search Button window. Information
related to these tabs is displayed in the area just above them.
1. Value Hints: This option applies to statistical criteria and will display a
definition of the selected statistic and hints related to values the user could
enter for that statistic.
2. Options: There five available options.
122
i.
“View Criteria By” option to view your Criteria selection list by
category or alphabetically.
ii.
“Automatically Launch Search Report Window”: This option
will automatically launch the search report when the search is
complete. (Note: Depending on the size of your database, the
search report could take some time to run. You may want to
uncheck this box. You will always have the option to manually
run the search report when your searches have run.)
Universe (Multi-Fund) Analysis
iii. “Use PerTrac ID Fund Groupings and Data Vendor Priority”:
This option when checked will result in a “de-duplicated”
universe that contains only one record for each investment
when you search is complete. In the case of duplicate records
for an investment, PerTrac will choose which record to keep in
the results universe based on your data vendor priority
selected on the PerTrac Preferences tab.
iv. “Optimize Search”: This option when checked allows the
search to process and evaluate criteria in the quickest order
possible. If turned on, qualitative criteria will be evaluated
before quantitative criteria regardless of the order listed in your
search. When unchecked, your search will be run in the order
you specify.
v.
“Force Search Criteria to Check All Criteria”: This option when
checked forces the search to find all specified criteria values
for all investments. This is useful for creating reports. By
default, which is unchecked, the search will process as few
criteria as possible to determine if an investment passes or
fails a search. For a given fund, depending on the logical
structure of your search, PerTrac may not need to evaluate all
criteria. (For example, if this option is unchecked and an
investment fails the criterion specified in the first row of the
Search Builder table and the criterion in the second row is
linked by the And operator, PerTrac will not continue checking
to see if the investment passes the criterion specified in the
second row since an investment must pass both the first AND
second criteria in order to make it into the results universe.
This allows the search to run as quickly as possible.)
Note: The one option that all users will generally wish to have checked on
a regular basis is the “Use PerTrac ID Fund Groupings and Data Vendor
Priority” to produce search universes that contain no duplicate funds.
3. Errors: This tab will list any errors generated when running your search.
Typically, the errors will refer to selected criteria values entered or the logical
order of your search criteria.
Grouping (Nesting) Your Criteria
Search Builder allows for grouping your “And” statements or “Or” statements
based on the logical order of your search criteria. For example, if you wanted to
find all HFR market neutral funds or Hedgefund.net market neutral funds prior to
running your Stat criteria, you would group together your Info criteria to find all
market neutral funds first. See the screen below.
123
PerTrac User Manual v.19 1
In addition, you could highlight the Stat criteria rows and click Convert To Group
on the lower left to create a group of your And criteria.
Note: You can group funds from the Edit button on the menu bar, by rightclicking on a row, or by way of the Convert to Group button that appears when
you highlight rows.
TIP: It might be useful to first define all of your Info and Stat criteria, determine
the logical order you want to run your search criteria, then group your And/Or
statements.
Setting Up and Running a Search in Search Builder
1. Starting at the first row, click the down arrow under the “Info/Stat”
column.
2. Click Info to select a qualitative criterion from the investment information
pages, or Stats to select a quantitative criterion.
3. If you select Info you will then choose a Data Source and make
selections under Criteria, Operator and Value.
4. If you select Stats you will then make selections under Criteria, Operator,
Value, From & To (to set your date range), Period and possibly
Benchmark, depending on the stat selected.
5. Enter a name for your search in the Search Name field at the top, then
click Save next to that field.
124
Universe (Multi-Fund) Analysis
6. Click Run Search!
7. When the search is complete the
following window will appear. This
window contains the name of your
search; the universe on which the
search was run; and the percent and
number of funds that passed and
failed the search. There are also four
button options:
a) Save Universe: Opens the Save As
window to your default universe folder.
b) Open Search Report Window:
Search Builder generates three detailed search reports, each of which is
discussed in the section below. This option, however, will open the reports
in the Search Builder.
c) Open Search Report in Excel: This will export the search report and
open it as an Excel spreadsheet.
d) Save Search Report as an Excel File: This option saves the report as
an .xls file that can later be opened in Excel.
TIP:
Once you have
created and saved your searches, you can access them quickly from the Home
window upper toolbar. We have added a Searches drop-down menu. This will
allow you to select a saved search, which will then automatically open the search
window.
125
PerTrac User Manual v.19 1
II. Search Reports
PerTrac Search Builder has the ability to generate three detailed search
reports: Search Summary Report, Pass/Fail Report, and Search Criteria Report.
1. Search Summary Report:
The Search Summary Report lists all funds in the universe on which your
search was run. By default the report is sorted by the funds that passed your
search criteria. In the lower left corner you will find a summary table indicating
how many funds passed and failed. In this example the search was run on the
All.unv universe (entire database) and resulted in 60 of 11,145 passed and
11,085 of 11,145 failed. This is a columnar report showing the search criteria as
column labels and the values for all criteria for all investments. If the investment
passed on a criterion, a green check mark icon appears next to the result for that
criterion. If it failed on a criterion, a red X icon appears next to the result.
126
Universe (Multi-Fund) Analysis
2. Pass\Fail Report:
The Pass\Fail Report lists all funds in the universe your search was run on.
When the report opens you will have two expandable options: Passed Search
and Failed Search. When you expand either of these options, the list of funds
that passed or failed will be visible. These too are expandable by fund. Click the
“plus” sign next to a fund to view, in row format, your search criteria.
3. Search Criteria Report:
127
PerTrac User Manual v.19 1
The Search Criteria Report provides a detailed breakdown of which funds
passed or failed at the criterion level. Each of the search criteria will be listed by
row, which can then be expanded to show a summary of the number of funds
that passed or failed each individual criterion. You can then expand the passed
or failed options to view the list of funds.
Note: There is a Warnings box located at the bottom of all three reports. This
window will list funds with bad or insufficient data. In this example report window
above, the funds listed in the Warnings box did not have sufficient (at least two
months) data to calculate the standard deviation search criterion.
TIP: To create a universe of just the passed funds click the save option on the
menu bar “Save All Passed Funds to a universe”. This is helpful if you had not
saved your passed funds as a universe prior to generating the report. In addition,
the funds listed in all three reports will have check boxes in front of the fund
name. Use these check boxes to create a universe of just your checked funds.
When you have selected the funds to be included in the universe, click File on
the menu bar and select “Create Universe from Checked Funds”.
4. Open Search Report in Excel: This option will export the Search Summary
Report to Excel.
III. Batch Searches
This feature will allow you to batch run any number of saved search files created
with the Search Builder. For example, perhaps you create 15 peer universes
each month. In the past you would have to possibly run numerous individual
searches and then save each resulting universe. With Search Builder you can
now save each of the 15 peer searches as search files. Using the new Batch
Searches you can run all 15 saved searches at one time. The Batch Search
feature can be accessed with the Search button at the top of the PerTrac window
or from the Tools menu in the menu bar. Once selected the Batch Search
window will appear.
128
Universe (Multi-Fund) Analysis
Setting up and running a batch search is simple.
1. Search Name: Click the down arrow in the Search Name column to
select your saved searches. There is no limit to the number of saved
searches that can be included in the batch search.
2. Universe to Search: For each of your searches selected in the
Search Name column, select the universe you want to search. Click
the down arrow to select the universe. If you are searching on your
entire database, select “Master Universe (All.unv)”.
3. Result Universe: For each saved search the resulting universe will
have to be named. You can type a name directly into the field, or click
the down arrow to select a universe name from your default universe
folder.
4. Save Excel Report: When batch running your saved searches you
can elect to have the Search Summary Report automatically generated
and saved as an Excel file. Enter names for you Excel files in this
column, or click the down arrow to select a previously saved .xls file.
5. Open Excel Report: Checking this option will open the Search
Summary Report in Excel for each of the searches in your batch run.
6. Open Detail Report Window: Checking this option will open the
Search Report window in PerTrac for each of the searches in your
batch run. The Search Report window, as mentioned above contains
three reports: Search Summary Report, Pass/Fail Report and Search
Criteria Report. A separate Search Report window will open for each
saved search in your batch search.
129
PerTrac User Manual v.19 1
7. Batch Search Name: When all selections have been made, save the
batch search as a file. Type a name for your batch search in the “Batch
Search Name” box on the upper menu bar. Click Save icon to save
your file.
8. Saved Batches: When you enter the batch search window click the
down arrow on the “Saved Batches” drop-down menu on the upper
menu bar to select your previously saved batch search files.
9. Run Batch! : Click Run Batch! with the green arrow icon to begin the
batch run. When you run the batch search the following “Batch
Results” window will appear.
This window will indicate which search is running, its percent completed
progress, and which searches are in the queue.
Note: Located on the lower left side of the Batch Search window you will notice
an option for “Stat End-Date Parameter”. Remember this is an option in the “To”
field for the end date in the Search Builder window. This option is a shortcut
when running searches each month, allowing the statistic to be calculated
through the new month end date. It saves you from having to enter the new end
date each month. Check the “Stat End-Date Parameter” box on the Batch Search
window if any of your searches contain statistics criteria with “End-Date
Parameter”.
130
Universe (Multi-Fund) Analysis
3.06 - Pro Forma Table
The Pro Forma tables allow
you to view a variety of
historical performance and
summary data based on the
allocation settings for the
current universe. To open the
Pro Forma Window, click the
Pro Forma button from the
Asset Allocation Window.
At the top of the window, you
will see the Pro Forma,
Rebalancing, and Summary buttons. These allow you to quickly navigate
among the three tables contained in this window. When the Pro Forma Window
is first opened, the Pro Forma Performance Table appears.
Pro Forma Table
This table provides monthly or quarterly data, depending on your selection in
the Asset Allocation Window. The pull down menu in the top right corner of
the window contains a list of each investment in the portfolio, allowing you to
view the data for an individual investment. The list also contains a “Portfolio”
selection that will re-display the data for the entire portfolio. The Pro Forma
Performance Table includes the following columns:
131
PerTrac User Manual v.19 1
Date - For monthly data, this will display the month and year of the
data in that row. For quarterly data, the date will be the last month in
the relevant quarter.
Beginning Equity - The first value for this column is the dollar amount
that was originally entered in the Total Allocation box or, for individual
investments, the corresponding percentage of that dollar amount.
Additions/Withdrawals - This column shows the equity added or
withdrawn from each investment during re-balancing. On the portfolio
table, this column will be blank because the re-balancing assumptions
only affect the individual investments.
Profit/Loss - The calculated dollar profit or loss for the month or
quarter.
Ending Equity - beginning equity plus additions and withdrawals, and
plus qrofit or minus loss.
Period Return - Dollar Profit/Loss divided by the sum of Beginning
Equity plus Deposits and Withdrawals.
Cumulative Return - The cumulative investment return since
inception of the portfolio.
VAMI - The Value Added Monthly Index, which is the growth of $1,000.
NOTE – Withdrawals are always displayed as a negative number.
132
Universe (Multi-Fund) Analysis
Rebalancing Table
This table lists the additions and withdrawals for each individual investment
that were made to accommodate the re-balancing specifications.
Summary Table
This table contains a column for each investment in the portfolio, as well as
the portfolio as a whole, that displays the dollar value allocations to each
investment. When this table is opened, the drop down box located at the top
right of the window will contain the names of each category in the Pro Forma
Performance Table, allowing you to select the category of data to be
displayed. This feature is ideal for quick comparative analysis of the
individual components of the current portfolio.
Printing, Editing and Saving Pro Forma Tables
The Pro Forma Window also contains the standard options for editing,
reformatting, printing, and saving your tables. Double-right-clicking over a pro
forma table opens the Workbook Designer and displays a fully editable
version of the table.
To save a pro forma table for future reference, select Write from the File
menu of the Workbook Designer. This opens the Write File dialog box,
allowing you to name and determine the location of the saved file. You can
even save the table as an Excel file by selecting (*.xls) in the Save as type
pull down menu.
Command Buttons
Print - Prints the pro forma table.
Print Preview - Allows you to preview the pro forma table before
printing.
Print Setup - Provides options for setting the printer parameters
before printing.
Page Setup - Provides formatting options for the pro forma table.
Print Titles - Allows you to format the titles of a pro forma table before
printing.
Pro Forma - Displays the Pro Forma Performance Table.
Re-balancing - Displays the Re-balancing Table.
Summary - Displays the Summary Table.
133
PerTrac User Manual v.19 1
3.07 - Universe Statistics - View the online tutorial!
The Universe Statistics Window allows you to display a variety of statistics for
each investment in the current universe. To open the Universe Statistics
Window, click the Statistics button from the Universe Stats Allocation and
Optimization option, or click Statistics on the PerTrac Navigation Bar.
TIP – Always have a universe with only the investments you want to use prior to
launching the Universe Statistics Window. Many statistics are calculated
within this module and it would take considerable time to generate statistics on
an entire database or a similarly large number of funds.
The top of the Universe Statistics Window contains a row for each investment
in the portfolio, as well as a row for the portfolio as a whole, to display the
selected statistics. The bottom of the Universe Statistics Window allows you to
select which statistics are displayed.
134
Universe (Multi-Fund) Analysis
Display Type - The Display Type options are located at the lower left
of the window and include the different types of statistical displays you
can create. When a display type is chosen, the relevant options for
that display type will be activated at right, allowing you to further refine
the display.
Statistic - Selecting Comparative Statistics or Time Windows from
the Display Type options activates the Statistics options allowing you
to select the particular statistic to display.
Correlations - Selecting Correlation Matrix from the Display Type
options activates the Correlations options allowing you to select the
type of correlation to be used.
Period - Certain display types allow you to select a time period
(monthly, quarterly, or yearly) for which statistics are calculated.
Increment & Range - The Distribution of Returns option requires
the selection of the increments at which the returns are grouped, as
well as a range (above and below zero) for which data is displayed.
Hide Portfolio - Checking this box hides the row that displays the
statistics for the portfolio as a whole, so that only statistics for the
individual investments remain. Not checking Hide Portfolio allows
you to quickly view the aggregate portfolio’s statistics without having to
Convert Portfolio to Investment.
Once you have selected all the necessary options, clicking Display shows the
results.
135
PerTrac User Manual v.19 1
Ranking Investments
Once you have displayed a table of statistics, you can rank the investments
according to a particular statistic by highlighting that column and clicking
either Rank Maximum or Rank Minimum. This is particularly useful when
working with a large portfolio. Clicking the Percentile button will change the
numerical rank column, on the far left, to a percentile rank column. Once the
investments are sorted you may immediately create a new universe simply by
highlighting a range of investments, right-clicking over the highlighted area,
and then clicking Create Universe of Selected Items.
Printing, Editing, & Saving
Universe Statistics
Right-clicking over a Universe Statistics
table allows you to copy it to the
clipboard, so you can then paste the
information in another program. Clicking
Print opens a printable copy of the table,
including standard preview and setup
options. Double right-clicking over the
table opens the Workbook Designer, giving you full editing capabilities and
allowing you to save the table for future use.
Command Buttons
Display - Calculates and displays the current selection of statistics
Rank Maximum - Ranks each investment by a selected statistic, from
highest to lowest.
Rank Minimum - Ranks each investment by a selected statistic, from
lowest to highest.
Percentile - Shows the percentile ranking of each investment rather
thatn its numerical rank.
Print - Opens a printable copy of the table, complete with editing
options.
Cancel or Exit - Closes the Universe Statistics Window.
3.08 - Correlation Analysis - View the online tutorial!
Correlation statistics can be accessed by clicking Correlation Analysis from
the Asset Allocation Window.
136
Universe (Multi-Fund) Analysis
1. From the Statistics Correlation Matrix Options Window, select a
statistic for the Correlation Matrix.
2. If you would like to build a correlation matrix, even though some
investments have insufficient data, check the box in the lower left corner.
3. Select whether to use either monthly or quarterly calculations.
4. Click OK.
Correlation Matrix
137
PerTrac User Manual v.19 1
The Correlation Table includes standard preview and setup options, as well
as a Save As button, which allows you to save the table for future use.
Clicking Select Statistic allows you to change the displayed correlation
statistic.
Again, double right-clicking over this table opens the Workbook Designer,
providing more advanced editing capabilities.
3.09 - Universe Charts - View the online tutorial!
Creating charts for a universe of investments is just as easy as creating charts
for an investment. To open the Universe Charts Window, click the Charts
button from the Asset Allocation Window.
As with the
Investment Charts Window, you will notice a selection of chart types along the
left side of the window and some options areas to further refine your chart.
Creating a Universe Chart
The following is a simplified list of the steps required to create a universe chart.
NOTE: the Start Date and End Date that you entered in the Asset Allocation
Window will define the time period used for a universe chart.
138
Universe (Multi-Fund) Analysis
1. Click the desired chart
type from the list at the left
of the window.
2. Select the relevant
chart options to suit your
needs.
3. Click OK to display the
chart.
4. Customize the chart
using the Chart Designer,
Edit Chart Data, or Wizard
options from the pop-up
menu.
5. You can also print, copy
or save the chart from the pop-up menu. Once a chart has been saved, you may
open it by selecting Load Chart from the File Menu. If you chose to copy the
chart, it can be pasted into another application. In Microsoft applications, “Paste
Special” and “Paste” the chart as a picture and paste will display the underlying
data.
To create additional charts without closing an existing chart, click the Charts
button on the Tool Bar at the top of the screen.
Chart Options
Geometric Statistic Charts
The following options are associated with the chart types in the upper left corner
of the window: VAMI, Cumulative Return, Percent Rate of Return, and
Distribution of Returns.
Managers/Portfolio Options - Check one of these boxes to indicate
whether you want to chart the performance of the individual managers,
the performance of the portfolio only, or both.
Period - Period may be monthly, quarterly, or yearly.
Rolling Returns & Recent Returns Charts
Manager/Portfolio Options - Same as above.
Display Options – Select Annualize Returns, Normalize Returns, or
Total Return.
Periods to Display - You can select rolling return periods from 1 to 60
months and recent return periods from 1 month to 10 years.
Rolling Statistics
Manager/Portfolio Options - Same as above.
139
PerTrac User Manual v.19 1
Display Options – Compound return, standard deviation, Sharpe
Ratio, Sterling Ratio, Calmar Ratio, maximum drawdown, downside
deviation (MAR, RF, 0), Sortino Ratio (MAR, RF, 0).
Rolling Periods - Select the Number of Rolling Months and whether
or not to annualize the statistic.
Periods to Display – The rolling statistics charts can be generated on
a monthly or quarterly basis.
Rolling Correlations
Manager/Portfolio Options - Same as above.
Display Options – Alpha, Beta, Correlation-R, R-Squared, Tracking
Error, Beta T-Stat and Information Ratio
Benchmark Selection – Select the benchmark on which the
correlation statistics will be calculated. By default, PerTrac will list the
benchmarks in your Correl.unv correlation universe.
Rolling Periods - Select the Number of Rolling Months and whether
or not to annualize the statistic.
Periods to Display – The rolling statistics charts can be generated on
a monthly or quarterly basis.
Time Windows Charts
The selected statistic will be charted for time periods ranging from 1 to 60
months.
Comparative Statistics Charts
The selected statistic will be charted for the period selected (monthly, quarterly,
or yearly).
Scatter Correlation & Efficient Frontier
X-Axis & Y-Axis - To assign an investment to an axis, select it from
the pull down menu. To assign the entire portfolio to an axis, click
Portfolio.
Period - Periods may be monthly, quarterly, or yearly.
Annualize Returns – Check this check box to annualize returns for
the Efficient Frontier chart.
140
Universe (Multi-Fund) Analysis
Scatter - Risk vs. Return
Period - Same as above.
Annualize Scatter Risk Return Chart – Check this box to display
annualized statistics.
Allocation Pie Chart
This chart displays the allocations (as a percentage of the total portfolio) defined
in the Asset Allocation Window.
Editing a Universe Chart
Each Universe Chart in PerTrac consists of several objects; including legends,
axis titles, axis labels, and series points; that can be reformatted to suit your style
or needs. For more information, see Editing a Chart under Investment Charts.
Universe Chart Examples
VAMI Chart
Suppose you would like to chart the monthly VAMI for each investment a
universe, as well as the combined portfolio VAMI, based on your assigned
allocations.
1. Select the VAMI Chart option on the left side of the window under Chart
Type.
2. Select Managers and Portfolio under VAMI Chart Options.
3. Select Monthly under Period.
4. Click OK to display the chart.
Time Windows
Suppose you want to view a chart showing average standard deviation for
various time windows for each investment in the universe.
1. Select the Time Windows option on the left side of the window under
Chart Type.
2. Select Avg Std Dev from the list of statistics under Time Windows
Options.
3. Click OK to display the chart.
Comparative Statistics
Suppose you want to compare the quarterly Sharpe ratio between investments
for a specified time period.
1. Select the Comparative Statistics option on the left side of the window
under Chart Type.
141
PerTrac User Manual v.19 1
2. Select the Sharpe Ratio from the list of statistics in the Comparative
Statistics Options frame.
3. Select Quarterly under Period.
4. Click OK to display the chart.
3.15 - Factor Analysis
Factor analysis is a new feature added to the universe allocation window. This
module will give you the ability to track the historical and current correlation
statistics between the investments in a portfolio or universe, or the correlation
statistics between investments in a portfolio or universe with other investments or
benchmarks not in the portfolio. This feature will indicate whether or not your
portfolio is indeed diversified, or if your funds are becoming more correlated. At
the same time you can select an investment from your portfolio and view the
correlation statistics relative to a Factor Universe to determine your risk
exposure. The Factor Universe can be any saved universe of investments.
Statistics for analysis include: Alpha, Beta, Correlation R, R-Squared, Information
Ratio, Tracking Error and Beta T-Stat.
Note: The maximum number of investments allowed in the Investments
universe or Factor universe is 100.
The first step to performing factor analysis is to open the universe of investments
at the Pertrac Home
window. On the lefthand side of the Home
window click Open New
Universe to select your
universe. Then click
Universe Stats,
Allocation and
Optimization at the
bottom of the Home
window to access the
universe analysis tools, which now include Factor Analysis. When the universe
allocation window appears click Factor Analysis.
142
Universe (Multi-Fund) Analysis
The Factor Analysis window will appear.
The top section of the
window will contain an
Investments selection
window, Factor
Universe selection
window, Upper StatLower Stat windows to
select two correlation
statistics, Min-Max
options for setting the
chart scales, Rolling
Periods, and Start
Date-End Date. The analysis options are described below.
1. Investments: This is the first window on the upper left. By default the
investment shown is the first investment, alphabetically, in the universe being
analyzed. There is a drop-down arrow at the end of the window to select a
different fund. You will also find spinner buttons (up/down arrows) next to most
windows to quickly toggle through your universe of funds.
2. Factor Universe: This window allows you to select a universe other than
the investment universe for analysis. By default the Upper and Lower charts
will show selected correlation statistics of the fund shown in the Investments
window relative to the other funds in the investment universe. When a Factor
universe is selected the correlation statistics shown for the fund in the
Investments window will be relative to the Factor universe.
3. Upper Stat-Lower Stat: Below the Investments window you will find
Upper Stat and Lower Stat selection windows. Click the down arrows to
select your two statistics. The upper stat will populate the upper chart, the
lower stat the lower chart. The window to the right of the charts will contain the
legend for both charts. The legend will contain the names of the funds in the
Investments or Factor universes depending on which one you have selected.
4. Min-Max: The Min and Max options will allow you to set the Y-axis scales
on the upper and lower charts.
5. Rolling Periods: This option allows you to enter the rolling periods over
which the correlation statistics will be calculated.
6. Show Last Periods: This option with set the scale on the X-axis.
7. Start Date-End Date: These windows show the date range of your
analysis. The start date shown will be the common date range of the funds in
either the Investments or Factor universes. For example, if your
Investments universe has a common date range of Jan-1990, that will be the
143
PerTrac User Manual v.19 1
default start date. If you then select a Factor universe with a common start
date of Jan-2000, the start date will adjust accordingly.
Note: The start date will only change when you select a Factor universe. You
can not manually change the start date. You can, however, change the end
date.
8. Display Investment Labels: Each investment in the chart legend is
assigned a number. Click Display Investment Labels to add the investment
number to the chart. This will help distinguish the investments on the chart.
9. Refresh Charts: Click the Refresh Charts button when you change any of
the following options: Rolling Periods, Show Last Periods, or End Date. If
you change any of the other options (Upper Stat, Lower Stat, Min, Max,
Display Investment Labels) the charts will update automatically.
Chart Formatting and Export Options
The Upper and Lower Stat
charts can be edited, formatted
and exported. The charts
contain a hidden toolbar. To
access the toolbar right-click
on the chart and select
Toolbar. The Toolbar will
appear at the top of the chart.
Once the Toolbar is visible you can save the chart, copy the chart and
underlying data which can then be pasted to other programs, change the
chart type, change the chart colors, and view the underlying data in a table
format.
3.16 - Impact Analysis
Impact Analysis is a new feature added to the universe allocation window. This
module will give you the ability to analyze the affects of adding an investment to
an existing portfolio. The analysis will provide you with before and after
comparative statistics which include the changes in correlations statistics relative
to a selected factor benchmark, risk table, risk charts showing the percent
change in the risk table statistics after adding the new investment, and Omega
144
Universe (Multi-Fund) Analysis
analysis showing the Omega function on the original portfolio and the portfolio
with the new investment.
The first step to performing Impact Analysis is to open the universe of
investments at the
Pertrac Home window.
On the left-hand side of
the Home window click
Open New Universe to
select your universe.
Then click Universe
Stats, Allocation and
Optimization at the
bottom of the Home
window to access the
universe analysis tools, which now include Impact Analysis. When the universe
allocation window appears click Impact Analysis.
The Impact Analysis
window will appear.
The top section of the
window contains an
Investment selection
window, Benchmark
selection window, Risk
Charts, Omega Chart,
correlation statistic
selection, Rolling
Periods, Start Date-End Date, Investment Allocation to enter the allocation of
the new fund added to the portfolio, and Investment Leverage if the new fund
will be leveraged. Two correlation statistics (Left Stat/Right Stat)can be selected
a one time. Three charts for the two selected correlation statistics will appear
below the input selection area. The analysis options are described below.
1. Investment: This is the first window on the upper left. Click the Investment
button to select the investment you want to add to your existing portfolio, or
add to any universe opened prior to entering the impact analysis feature.
2. Benchmark: Select a benchmark for your correlation analysis. The new
portfolio, created by adding your investment, will be regressed against the
benchmark selected here. The available correlation statistics: Alpha, Beta,
145
PerTrac User Manual v.19 1
Correlation R, R-Squared, Tracking Error, Beta T-Stat, and Information Ratio,
will be selected with the Left Stat - Right Stat options.
3. Investment Allocation: Once you have selected an Investment to be
added to your existing portfolio, this window allows you to set or change the
allocation to your new investment. The allocations to your original portfolio
investments will change proportionately based on the original allocations and
the new fund you are adding to the portfolio.
4. Investment Leverage: If this new investment will be leveraged, enter the
leverage factor in this window. By default the value is set to 1.0, or no
leverage. The leverage factors for the other funds in your portfolio will be set
on the universe allocation window prior to entering Impact Analysis.
5. Create New Universe: This option will allow you to create a new universe
comprised of the original portfolio of funds and the investment you are adding.
The new allocations to your funds will be shown in parenthesis behind each of
the fund names.
6. Convert Universe To Investment: Use this button to quickly create a new
investment comprised of your original funds and the addition of your new fund.
Note: To view your new fund, click the Home button located on the PerTrac
menu bar. When the Home window opens, click the Load Master Universe
button located on the left side of the window.
7. Left Stat - Right Stat: Below the Investment window you will find Left Stat
and Right Stat selection windows. Click the down arrows to select your two
statistics. The Left Stat will populate the three charts on the left (Portfolio with
Investment, Portfolio, Differential), the Right Stat will populate the three charts
on the right (Portfolio with Investment, Portfolio, Differential).
8. Rolling Periods: This option allows you to enter the rolling periods over
which the correlation statistics will be calculated.
9. Show Last Periods: This option with set the scale on the X-axis.
10. Start Date-End Date: These windows contain the date range of your
analysis. The start date shown will be the common date range between the
universe being analyzed, the selected Investment and the selected
Benchmark. For example, if your universe, Investment and Benchmark have
a common start date of Jan-1990, that will be the default start date. If you then
select a new Investment or Benchmark with a start date later than the
original common start date, the impact analysis start date will automatically
change to reflect the new common start date.
Note: The start date will only change when you select an Investment or
Benchmark requiring a new common start date. You can not manually change
the start date. You can, however, change the end date.
146
Universe (Multi-Fund) Analysis
Note: Remember the impact analysis feature is designed to analyze the
affects of adding an investment to your existing portfolio or universe. Your
initial universe will be open in the universe allocation window. Your funds will
have allocations either manually entered, or equally weighted if you don't enter
your allocations. If you enter different allocations for each of your funds,
they will be proportionately reallocated (based on the existing weights)
when the new investment is added to the mix. If the allocations were
equally weighted, they will remain equally weighted when the new fund is
added through Impact Analysis. On the universe allocation window you also
have the option to re-balance your portfolio, Never, Monthly Quarterly or
Annually. These options will also be taken into account when you add a new
investment to your portfolio through Impact Analysis.
11. Refresh Charts: Click the Refresh Charts button when you change any of
the following options: Rolling Periods, Show Last Periods, or End Date. If
you change any of the other options (Upper Stat, Lower Stat, Min, Max,
Display Investment Labels) the charts will update automatically.
Risk Charts, Omega Chart and Export Charts
The Risk Charts option contains a table and three chart options displaying the
before, after and differential statistics for the new portfolio which includes the
investment you have added to the mix, and the original portfolio. The Risk
Chart's four display options: Risk Table, Statistics Chart - Month, Statistics
Chart - Quarter, Statistics Chart - Annual.
147
PerTrac User Manual v.19 1
1. Risk Table:
The table includes performance, risk
and correlation statistics. The
statistics are calculated on a Month,
Quarter and Annual basis. There are
three columns of data for each
period: Portfolio with Investment,
Portfolio (original), and Difference.
2. Statistics Chart - Month
The Statistics Chart - Month represents the percent change for each
measure between the new portfolio and the original portfolio on a monthly
basis.
3. Statistics Chart - Quarter
The Statistics Chart - Quarter represents the percent change for each
measure between the new portfolio and the original portfolio on a quarterly
basis.
148
Universe (Multi-Fund) Analysis
4. Statistics Chart - Annual
The Statistics Chart - Annual represents the percent change for each
measure between the new portfolio and the original portfolio on an annual
basis.
Omega Chart
1. The upper Omega chart: This chart will show the Omega ratios for the
both the new portfolio and the original portfolio at numerous return thresholds.
The Omega ratio can be seen on the Y-axis, the Returns Threshold on the
X-axis.
2. The lower Omega chart: This chart will show the differential between the
two portfolios.
3. Chart Settings: Below the lower chart are additional chart settings:
Curve - This will set the shape of the lines to either Smooth or Discrete.
Y-Axis Scale - This will allow you to set the Y-Axis scale to Linear or
Logarithmic.
Omega Threshold - This will set the Y-Axis scale range.
149
PerTrac User Manual v.19 1
Refresh Charts - Click this to reset the charts once changes to the
options above have made.
Export Charts
The Export Charts option is an impact analysis custom report generator.
Similar to PerTrac Publisher, and the report generators in the Efficient Frontier
Optimizer, Linear Optimizer and the Wealth Planner, Export Charts will export
the impact analysis data to an Excel spreadsheet. You can then create your
own custom impact analysis report template(s) or use a pre-built template. The
following steps will walk you through exporting the data.
1. Click Export Charts on the right hand side of the impact analysis window.
2. The Impact Analysis-Export Charts widow
opens.
3. Click Locate. The file selection window will open. The default folder,
C:\PerTrac\Custom Reports, contains the master template files for all PerTrac
modules. Select the file: "MasterImpactAnalysis.xls" if you are creating you
template from scratch. There are two pre-built templates
"ImpactAnalysisTemplate" and "ImpactAnalysisTemplate2" also available.
4. Click Export to export the data to Excel.
2.07 - Currency Conversion
The Currency Conversion tool allows you to convert investment returns from
one currency to another. Currency conversion can be performed on a single
fund or a universe of funds.
Single Fund Currency Conversion
Select the investment you wish to
convert, then, from the Tools menu,
select Currency Conversion. There
are three options: Convert
Investment to New Currency,
Convert Universe to New
Currency and Edit Cross Rate
Database. Prior to converting the
investment or universe to a new
currency the Cross Rate Database
must be updated.
150
Universe (Multi-Fund) Analysis
1. The Cross Rate Database can be edited by selecting Edit Cross Rate
Database from the Currency Conversion section of the Tools menu.
Click the Select Database button on the lower left hand side of the
window. When the file selection window appears, select the file
“PerTracCrossRates.cdb” and click Open. A list of currencies will now
be listed in the window. You can now Add, Remove, or Edit
Currencies.
NOTE: New currency rates must be entered each month. The currencies that
come pre-loaded have not been updated since September, 1999. However, we
now upated the G7 currency rates, which can be updated monthly from the
Utilities/Documentation link on our Training & Support (http://pertrac.com) site.
Each month you will Save the new "PerTracCrossRates.cdb" file to your PerTrac
main folder.
2. Once the Currency Cross
Rate Database has been
updated, click the Convert
Investment to New
Currency option. Select the
currencies of both the current
investment and the new
investment. The new
investment name is listed
under the New Investment
Name label.
3. Select a Data Source from
the drop down list (typically the data source will be “User”)
4. Optional conversion check boxes are available to convert NAV and
Funds Managed.
5. Other record items can be duplicated by checking the corresponding
boxes.
6. Once all the settings have been made, click the Convert button.
Universe Currency Conversion
From the Tools menu, select Currency Conversion. Then select Convert
Universe to New Currency. Prior to converting the investment or universe
to a new currency the Cross Rate Database must be updated. See Note
above.
151
PerTrac User Manual v.19 1
1. Once the Currency Cross Rate Database has been updated, click the
Convert Universe to New Currency option. The Universe Currency
Conversion window appears.
2 When the Universe Currency
Conversion window appears
click the Locate button to
open the universe to be
converted.
3. Select the existing Universe
Currency Denomination to
be converted and then select
the New Currency
Denomination to be
converted to.
4. Elect to Convert NAV (if your
fund data sheet contains NAV
vaules that you would like to
convert to the new currency),
Convert Funds Managed (if you want this data also converted to the
new currency), or to Override Data Source.
5. Select the qualitative information to be duplicated under the Select
Items To Duplicate section.
6. Once all the settings have been made, click the Convert button.
7. The new investments have been added to your database. The default
name for the new funds will be the old name with the new currency in
parenthesis behind the name.
152
Currency Conversion
2.07 - Currency Conversion
The Currency Conversion tool allows you to convert investment returns from
one currency to another. Currency conversion can be performed on a single
fund or a universe of funds.
Single Fund Currency Conversion
Select the investment you wish to convert, then, from the Tools menu, select
Currency Conversion. There are three options: Convert Investment to
New Currency, Convert Universe to New Currency and Edit Cross Rate
Database. Prior to converting the investment or universe to a new currency
the Cross Rate Database must be
updated.
1. The Cross Rate Database
can be edited by selecting
Edit Cross Rate Database
from the Currency
Conversion section of the
Tools menu. Click the Select
Database button on the lower
left hand side of the window.
When the file selection
window appears, select the file “PerTracCrossRates.cdb” and click
Open. A list of currencies will now be listed in the window. You can
now Add, Remove, or Edit Currencies.
NOTE: New currency rates must be entered each month. The currencies that
come pre-loaded have not been updated since September, 1999. However, we
now upated the G7 currency rates, which can be updated monthly from the
Utilities/Documentation link on our Training & Support (http://pertrac.com) site.
Each month you will Save the new "PerTracCrossRates.cdb" file to your PerTrac
main folder.
2. Once the Currency Cross
Rate Database has been
updated, click the Convert
Investment to New
Currency option. Select the
currencies of both the current
investment and the new
investment. The new
153
PerTrac User Manual v.19 1
3.
4.
5.
6.
investment name is listed under the New Investment Name label.
Select a Data Source from the drop down list (typically the data source
will be “User”)
Optional conversion check boxes are available to convert NAV and
Funds Managed.
Other record items can be duplicated by checking the corresponding
boxes.
Once all the settings have been made, click the Convert button.
Universe Currency Conversion
From the Tools menu, select Currency Conversion. Then select Convert
Universe to New Currency. Prior to converting the investment or universe
to a new currency the Cross Rate Database must be updated. See Note
above.
1. Once the Currency Cross Rate Database has been updated, click the
Convert Universe to New Currency option. The Universe Currency
Conversion window appears.
2 When the Universe Currency
Conversion window appears
click the Locate button to
open the universe to be
converted.
3. Select the existing Universe
Currency Denomination to
be converted and then select
the New Currency
Denomination to be
converted to.
4. Elect to Convert NAV (if your
fund data sheet contains NAV
vaules that you would like to
convert to the new currency),
Convert Funds Managed (if you want this data also converted to the
new currency), or to Override Data Source.
5. Select the qualitative information to be duplicated under the Select
Items To Duplicate section.
6. Once all the settings have been made, click the Convert button.
7. The new investments have been added to your database. The default
name for the new funds will be the old name with the new currency in
parenthesis behind the name.
154
Optimization & Simulation
Optimization & Simulation
3.10 - Linear Optimization - View the online tutorial!
PerTrac includes both a Linear Optimizer and a Markowitz Efficient Frontier
Optimizer. These optimizers allow you to define criteria for optimizing a portfolio.
The Linear Optimizer displays optimal portfolio allocations, ranked from best to
worst targeting a specific statistic. The Efficient Frontier Optimizer displays an
Efficient Frontier Plot, along with a corresponding Risk Table and Allocation
Table, which lead to a Markowitz risk/return optimization solution.
Setting up a Linear Optimization
Clicking the Linear Optimizer button from the Asset Allocation Window opens
the Linear Optimization Setup Window.
The top left of the
window contains a list
of investment, as well
as Min Allocation
and Max Allocation
columns that allow
you to select the
minimum and
maximum allocations
for each investment.
The Start Date and
End Date columns,
which are initially
blank, can be
activated by checking the Show Manager Start and End Dates box just above
the Cancel button at the lower left of the window. These dates represent all
periods for which the current investment contain data. The Portfolio Start Date
and End Date for the entire portfolio are displayed in the lower left corner and
can be altered only by returning to the Asset Allocation Window.
155
PerTrac User Manual v.19 1
Setting Minimum and Maximum Allocations
The minimum and maximum allocation percentages are entered using the
Investment Update Bar at the bottom of the window.
1. Highlight the row in the Investment Table for the investment to be
updated. You will notice the name of the selected investment appear in the
Current Investment box just above the portfolio Start Date.
2. To the right of the each investment, enter the minimum and maximum
allocations desired (20%, for example, can be entered as .2 or 20%).
3. Click Enter Minimum/Maximum Allocation.
4. Repeat the steps above for each investment in the current universe.
5. Clicking either the Reset Minimum button or the Reset Maximum button
will reset all values in the relevant column to 0% or 100%, respectively.
6. If you want to enter the same minimum or maximum percentage
allocation for all investments simultaneously, enter the percentage in the
appropriate box and click the Set Minimum or Set Maximum button located
just below the reset buttons.
Selecting the Optimization Method
The various portfolio allocations will be ranked according to the optimization
method you select in the Optimization Method Window.
1. Click the Select Optimization Method button, located in the lower right
of the window.
2. From the Optimization Method Window, click the button next to the
method with which you wish to optimize the portfolio.
3. Select a time period for which the selected statistic will be optimized.
4. Click OK.
The dialog box will close and you will return to the Linear Optimization Setup
Window.
TIP: that the optimization method you selected is now displayed in the box
directly beneath the Select Optimization Method button.
Specifying a Compound Rate of Return Threshold
You can also specify a minimum threshold for the annualized rate of return. For
example, if you define the threshold as 5%, the optimization solution will ignore
results that do not produce a historical annualized return of at least 5%.
Specifying the Allocation Increment
The optimizer requires you to specify an increment for allocation. This is the
increment at which new optimization solutions are considered. For example,
setting the allocation increment to 5% means that each allocation value that is
156
Optimization & Simulation
divisible by 5 will be considered for each investment. To select the allocation
increment, select a value from the pull down menu.
NOTE – Make sure the allocation increments are divisible either by the minimum
or maximum allocation or you may encounter an error.
Specifying the Search Range
In the bottom right hand corner, you have three options for conducting your
search; low, medium and high. Each method samples the available data and
generates allocations based on the statistic for which you optimized. Selecting
“Low” produces results faster but gives a more general picture of the possible
allocations, while selecting “High” will take more time but will generate more
results in a tighter cluster. All three generate sample portfolios and do not display
every possible
solution.
Linear
Optimization
Results
Once you have set
up the Linear
Optimization, click
Execute to begin the
calculation process.
When PerTrac has
finished optimizing, a confirmation will be displayed that states “optimization
complete”. Click OK. The results are displayed in the Optimization Table
Window.
This Optimization Table Window displays the top 100 allocations for the
defined optimization, ranked from left to right according to the optimization
method you selected. The top row of the table shows the value of the statistic for
which the optimization was calculated. The second row shows the Compound
Annual Rate of Return (ROR) that was generated by that particular allocation.
Subsequent rows list the resulting percent allocated to each investment. You
can print this table by clicking Print at the bottom right of this window.
Clicking the Allocations Setup button at the bottom of this window will bring you
back to the Asset Allocation Window, while the Optimization Setup button will
bring you back to the Linear Optimization Setup Window. Also, while back in
the Linear Optimization Setup Window, clicking Show Table allows you to
return to the Optimization Table Window.
157
PerTrac User Manual v.19 1
Optimization Scatter Plot
Clicking the Optimization Scatter Plot button at the bottom of the Optimization
Table opens the Optimization Scatter Plot as well as its corresponding
Allocation List Box. The scatter plot is a graph that plots the Compound Annual
Rate of Return on the y-axis and the statistic by which the allocation is optimized
on the x-axis. Like all other PerTrac charts and graphs, the Optimization Scatter
Plot can be edited, saved, or printed as described in previous sections. For more
information, see Editing a Chart under Investment Charts.
Copying Allocations to a Portfolio
Once you have found a suitable allocation distribution, you can copy it directly to
your current portfolio.
1. Highlight the column within the table containing the desired allocation or
select the desired dot in the Scatter Plot. When you select a point on the
scatter plot, the Allocation List Box will update to display the allocation
percentages and statistics for that point.
2. Click Copy Allocation to Portfolio. The Asset Allocation Window will
appear with the specified portfolio allocations.
The Allocation List Box also contains a Copy Allocation Button, which you
can use to assign the current allocation to your portfolio, essentially creating a
new investment with the selected allocations. Please refer to Converting a
Portfolio to an Investment and Saving an Asset Allocation in Chapter 8 –
Asset Allocation.
158
Optimization & Simulation
3.11 - Efficient Frontier Optimization - View the online
tutorials: (1) Efficient Frontier New Features; (2)
Efficient Frontier Overview; (3) Efficient Frontier Setup
Setting up an Efficient Frontier Optimization
Clicking the Efficient Frontier button
from the Asset Allocation Window
opens the Efficient Frontier Setup
Window, where you can create a
powerful Markowitz quadratic
optimizer that displays a traditional
efficient frontier curve and allows for
extensive analysis of various
investment portfolios. This analysis
uses three statistics to optimize a portfolio, annualized return, standard
deviation and correlation of the inputs.
TIP – PerTrac allows you to enter your own assumptions for return, standard
deviation and correlation if you desire. Please see the section on Advanced
Setup below.
The top of the window contains a table with the name of each investment in the
current universe, along with columns titled Minimum Allocation, Maximum
Allocation, Annualized ROR, and Annualized Std. Dev.
159
PerTrac User Manual v.19 1
Setting Minimum and Maximum Allocations
You can set minimum and maximum allocations by clicking on the relevant cell
and entering a percent value (10%, for example, would be entered as .10 or
10%). To use a common value for each investment, make an entry in either the
Set Minimum box or the Set Maximum box and click either Set Minimum
button or the Set Maximum button.
Altering Rate of Return or Standard Deviation
You can enter your own assumptions in the Annualized ROR column or the
Annualized Std. Dev. column by clicking on the cell and entering the value, as
above.
Entering the Number of Points to Plot
You can choose to plot between 0 and 1000 points, each of which represents a
different allocation on the efficient frontier.
Advanced Setup
Clicking the Advanced Setup button on lower left of the Efficient Frontier
Setup Window will allow you to alter the Group Constraints, Correlation
Matrix, Risk/Return, and individual investment constraints tables. The
Advanced Setup
Window contains a
tab for each of these
tables.
To define a Group
Constraint, start with
the Group 1 (U.S.
Equity in the exhibit
below) column and
place the number 1
to the right of each
investment you
would like to include
in this group (clicking on the cells will toggle the 1 on and off). Next, use the
Upper Bound and Lower Bound rows to set the desired constraints for this
group and enter any important information in the Comments row. The column
headings may be changed by clicking on the column label. Once your groups
have been set click the Display button to create the efficient frontier chart.
TIP: You will notice that there is no Save button in this window. The Save option
is located on the efficient frontier chart that is created when you click the Display
button from the Advanced Setup Window. To retain the changes you have
entered on the Group Constraints tab, click the Save button on the efficient
frontier chart immediately after the chart appears.
160
Optimization & Simulation
The Correlation
Matrix tab can
also be used to
customize the
Efficient Frontier
Setup by replacing
the historical
correlations with
your own
assumptions.
The Risk/Return and Allocations can also be used to customize the Efficient
Frontier Setup by replacing the historical returns with your own assumptions.
TIP: You will notice that there is no Save button in these windows. The Save
option is located on the efficient frontier chart created when you click Display
from the advanced setup window. To retain the changes you have entered in the
Correlation Matrix or Risk/Return and Allocations tabs click Save on the
efficient frontier chart immediately after the chart appears.
NOTE: If you change the mean or standard deviation for any input in the
analysis, the correlation table is not changed. You must manually adjust the
correlations. Additionally, if you change an input’s return, PerTrac will ask you
whether you want a geometric or average mean which will redraw the historical
distribution based on your inputs. Any changes to the underlying data will flow
through to the Simulation module.
When you are finised with the Advanced Setup Window, click Display to view
the Efficient Frontier Plot.
161
PerTrac User Manual v.19 1
Efficient Frontier Optimization Results
Clicking Display from the Efficient Frontier Setup Window (or Plot from the
Advanced Setup Window) will display your results. A variety of windows can
also be displayed by clicking on the efficient frontier line; Efficient Frontier Plot,
Actual Portfolio Risk Table, Portfolio Allocation Pie, Portfolio Allocation
Table and Tracking Error Pie. Each of the displays can be turned on or off
using the drop down box labeled Show on the Efficient Frontier Plot toolbar.
The display below shows all the available exhibits.
Efficient Frontier Plot – Displays annualized return on the y-axis and risk (as
measured by standard deviation) on the x-axis. The blue line connects all
allocations on the frontier with intermediate points (the default number of
portfolios is set to 100 with 1a maximum of 1,000) while the red dots represent
the breakpoints, where investments either rise above or fall to the minimum
allocation amount. A breakpoint is essentially where the shape or slope of the
curve changes.
Print Menu
The allocations of the
breakpoints and the
intermediate points can be
162
Optimization & Simulation
printed by selecting Breakpoints or Intermediate Points from the Print menu.
Selecting Portfolios from the Print menu allows you to print the custom
allocations you may have added, which do not necessarily lie on the efficient
frontier line. Selecting any of these options will create a table in spreadsheet
format that you can print, format, edit, or save, depending on your needs.
Overlay Menu
Selecting Save Efficient
Frontier from the Overlay
menu allows you to save the
current plot as an ".efo" file
(Efficient Frontier Overlay file),
which can be superimposed on
a later plot by selecting Load
Efficient Frontier from the
Overlay menu. This option is
useful to illustrate how the
efficient frontier line would change by adding or removing investments from the
universe of assets being optimized.
NOTE: When you load a previously saved efficient frontier, black line represents
the saved efficient frontier and is not active. The blue line is the current efficient
frontier including all asset inputs and is the active line.
Remove Overlays
This option will remove any overlays that have been applied to the Efficient
Frontier Plot. This option is only visible after an overlay has been applied.
Plot
Selecting Market Portfolio Line from the Plot menu will prompt you to enter
both an Annualized Return and an Annualized Standard Deviation for the low risk
asset. Be sure to enter the appropriate Risk-Free return and standard deviation
for the period being analyzed. Once entered, the Market Portfolio Line will appear
on your chart.
Selecting Capital Markets
Line from the Plot menu
opens up a small form where
you can enter the Annualized
Return and Annualized
Standard Deviation for both
the Risk Free Asset and the
Capital Markets Benchmark,
as well as assign a name for
163
PerTrac User Manual v.19 1
each. Click OK when you have entered these figures to display the Capital
Markets Line.
Your custom allocations can also be presented in pie chart format by selecting
Portfolio Pie Charts from the Plot menu. Occasionally, the portfolio label text
length will impede the size of the chart itself. Using the Chart Options menu to
reduce the maximum number of characters allowed for pie chart labels can
prevent this. As with all charts in PerTrac, complete chart formatting is available
by selecting Chart Designer from the right-click menu.
Remove Plots
This option is available only if you have plotted supplemental statistics on the
Efficient Frontier Plot.
Show Menu
Efficient Frontier Plot items using the options on the Show drop down menu.
Show Grid Lines, Show Tick Marks. Show Point Selected Marker, Show
Breakpoints and Show Legend are all available displays for the graph.
Additionally, supplementary tables and pie charts are available. These are
labeled Show Allocation Pie Chart, Show Tracking Error Pie Chart and Show
Risk Table.
Simulate and Export
These two options will be discussed later after the Supplementary Tables and
Pie Charts are explained.
Display All Windows
If you minimize any of the available windows or tables associated with the
Efficient Frontier Plot, this button will allow you to display them again in their
assigned areas.
Plot Statistic and Plot Universe
PerTrac allows you to add supplementary statistics and displays to the Efficient
Frontier Chart. These can be added by selecting the appropriate statistic from
the dropdown menu bar in the Efficient Frontier Plot and selecting Plot
Statistic, Plot Universe or both.
164
Optimization & Simulation
The graph above shows a combination of available plots. The green line
represents drawdown for each portfolio plotted on the efficient frontier (blue line)
from January 1999 to July 2004. To add this line, Drawdown was selected from
the dropdown menu followed by Plot Statistic. The green triangles represent
each asset’s standard deviation and mean return. To show these statistics,
Standard Deviation was selected from the dropdown menu and then clicking
Plot Universe. Additionally, any investment’s name may be displayed by
clicking on any green triangle. The investment names may be mover around with
your cursor and displayed with the click of the mouse. The supplemental
statistics on the drop down menu can be a useful portfolio planning tool. For
example: A high net worth individual or retirement plan policy constraint may
require a diversified portfolio mix that has a minimal drawdown. The drawdown
statistic can help pinpoint this optimal allocation for you.
TIP – The green arrows to the left of Plot Statistic will move you one portfolio up
or down on the efficient frontier.
Save
This feature allows you to save your Efficient Frontier Plot as a chart with an
".efc" extension. The chart can be reloaded from the Efficient Frontier Setup
window in the future. As with all charts in PerTrac, complete chart formatting is
available by selecting Chart Designer from the right-click menu.
Using the Supplementary Tables and Pie Charts
Selecting a allocation on the Efficient Frontier Plot marks that point with a
green box and opens the Actual Portfolio Risk Table, Portfolio Allocations
165
PerTrac User Manual v.19 1
Table, Portfolio Allocation Pie, Portfolio Allocation Table and Tracking Error
Pie, all of which you can use to assist your analysis.
Actual Portfolio Risk Table: This table displays
statistics associated with the portfolio that you have
selected from the efficient frontier. The first time you
try to display the efficient frontier chart, a dialog box
will open and instruct you to Select a Benchmark.
Select Benchmark
You can select a benchmark from a custom universe
using the Load Universe button, or you may select a
benchmark from All.unv with the Load Master Universe
button. Highlight your preferred benchmark and click
OK. From then on, all of your future efficient frontier
comparison statistics will be measured against the
selected benchmark, until you change the benchmark.
Explain
The Explain button gives a detailed description of how
the Efficient Frontier Plot and the Actual Portfolio Risk
Table were generated. All of the statistics displayed
within the risk table correspond to the portfolio that is
currently highlighted on the Efficient Frontier Plot. These statistics were
generated using the asset allocations in the Portfolio Allocations table with no
rebalancing, for the time period being measured. The Efficient Frontier Plot
display (the blue line with risk on the X axis and return on the Y axis) was drawn
using the Markowitz Efficient Frontier methodology. (A .pdf with more details on
this type of analysis is available upon
request).
Portfolio Allocations – This table has
multiple functions. Its primary function
is to display the investments/assets
that comprise the selected portfolio on
the Efficient Frontier Plot. The
investments/assets will be displayed in
order from the largest allocation to the
166
Optimization & Simulation
smallest allocation. Additionally, you can type any allocation that you wish for
each of the assets and the resulting portfolio will be displayed. This is an ideal
way to type in your current portfolio allocation and display its location on the
graph. Please see the section Auto Recalc for additional options.
Copy Allocation
Any portfolio selected on the Efficient Frontier Line can be converted to a
portfolio by pressing the Copy Allocation button (marked as 1 in the screen
capture above). Once you click the button, the Asset Allocation window is
launched. Refer to the section Convert Portfolio to an Investment for more
details.
TIP – It is a good idea to save your allocations as universes, using the Save
Settings button in the Asset Allocation window. This way you can
recall/document the original asset allocation.
Plot
If you press the Plot button (marked as 2 in
the Portfolio Allocation screenshot), a
window will appear prompting you label the
point and select a marker for that point. In
addition, you can add cross hairs on the
marker to draw emphasis to this portfolio. Plotting portfolios is an essential step
if you want to test this portfolio using the Simulate button which will launch the
Portfolio Planning and Simulation Tool. The financial planning simulation
module will be covered section 3.13.
Create Universe
If you would like to create a sub universe of the assets that comprise a portfolio
on the Efficient Frontier Plot you can highlight them and click Create Universe
(marked as 3 on the Portfolio Allocations screenshot). This will bring up a new
window prompting you to give your new universe a name.
Plot Actual
If you check the Plot Actual checkbox (marked number 4 on the Portfolio
Allocations screenshot), the portfolio plotted on the Efficient Frontier Plot will
exactly match the displayed statistics on the actual Portfolio Risk Table.
You can also plot custom points that represent portfolio allocations off the
Efficient Frontier Line. In the Portfolio Allocations Window, type the
allocations in the appropriate cells and click Plot. This will launch the Select
Point Format window where you can pre-format both the point features and the
label text. There is also a Set Cross Hairs check box, which can provide special
167
PerTrac User Manual v.19 1
focus to a particular point. Once you have made all the selections, click OK to
display the point.
Auto Recalc
This check box (marked 5
on the Portfolio Allocations
screenshot), enables you
to type in any allocation
for an asset and all other
allocated assets will adjust
proportionately. In
addition, if you have the
Point Selected Marker
displayed, it will show you
the new allocation’s
placement on the Efficient Frontier Line. This option is ideal for quickly typing
in hypothetical allocations and immediately seeing that portfolio’s location on the
graph.
Portfolio Allocation and Tracking Error Pies – The first window displays the
current portfolio’s allocation with annualized return and standard deviation for the
selected period. The Tracking Error Pie window displays the current annualized
tracking error of the displayed portfolio along with annualized active premium and
monthly information ratio.
3.14 - Financial Planner and Simulation Custom Reports
Simulation Templates – Prior to generating either the Solver or Portfolio
reports, you must select an Excel template to exporting your results. PerTrac is
pre-loaded with some suggested templates.
168
Optimization & Simulation
Click Locate to the right of the Solver Template. This button will launch a
window that displays pre-loaded Excel files. Select either the Custom Solver
Report.xls or the Master Portfolio Solver Report.xls file. The Custom
template has been pre-built for you while the master template requires you to
build your own template, similar to the PerTrac Publisher Custom or
Combination reports. The same instructions apply to the planning templates.
Locate either the Custom Planning Report or the Master Portfolio Planning
Report. The Load and Save options available in Simulation File area let you
save your simulation setup and/or load it at a later time.
Solver Report – There are two different reports that you can run in the Portfolio
Simulation and Planning Module. The first report is the Solver.
The Solver Report allows you to test breakpoints, interval points
or portfolios against your assumptions and constraints. If you
are testing more than one portfolio, this will give you an
indication of which one(s) are more likely to achieve your
financial goals. The Probability of Shortfall allows you to
select a specific percentile in the simulation distribution
indicating the probability of a shortfall. PerTrac gives you the
option of targeting anywhere from the 95th to the 5th percentile.
For example, targeting the 5th percentile is very conservative essentially 95% of all other outcomes are better than the chosen
target. If you were to target the 95th percentile, only 5% of
outcomes are more favorable. Once you have selected your
Simulation Points and Probability of Shortfall, click Solver
Report. This will send your results to the specified template. Key pages from a
Solver Report are displayed below:
169
PerTrac User Manual v.19 1
A Portfolio Report is used to test one portfolio against your
assumptions and constraints. This is generally one of the last
steps in your asset allocation testing. After you have found a
portfolio that meets your criteria using the Solver Report, the
Portfolio Report can be used to illustrate the entire simulation
distribution from the 5th to the 95th percentile on your selected
portfolio. The only options available in the dropdown menu are
portfolios plotted on the efficient frontier. If you wanted to test
one of the breakpoints or interval points using the Portfolio
Report, you must plot it as a portfolio. Select your desired
portfolio from the dropdown menu and specify the boundaries of
the displayed distribution. As stated earlier, you can show from
the 5th to 95th percentile. Click Portfolio Report to send your
results to the specified template. Key pages from a Portfolio Report are
displayed below:
3.12 - Efficient Frontier Custom Report Export
Efficient Frontier Optimization Results – Simulate and Export
The Efficient Frontier Line
and underlying data can be
exported into an Excel
template using the Export
button. The export feature and
the template function similarly
to PerTrac Publisher
Templates. Additionally, the
Simulate button will launch the
Portfolio Planning and
170
Optimization & Simulation
Simulation Tool which will enable you to run probability analysis scenarios on
your portfolios, breakpoints or interval points using annual positive and negative
cash flow assumptions.
Export
As stated earlier, the Export option
allows you to export your portfolios,
breakpoints or interval points into a
template that displays pre-drawn
charts and tables in an attractive Excel-based format. These templates are fully
customizable and can be used as templates for all of your exporting from the
efficient frontier. Once you have plotted your desired portfolio(s), click Export.
A new dialog window will appear prompting you to choose breakpoints, interval
points or portfolio(s) to export.
NOTE: The breakpoints are the red corner points on the efficient frontier line;
the interval points are ten portfolios PerTrac creates equally spaced portfolios
across the efficient frontier line from conservative to aggressive; the portfolios
option will produce a report containing the portfolios the user has plotted either
on or off of the efficient frontier line.
Once you have selected one of these three options you must click Locate to
specify an export template. PerTrac is pre-loaded with three custom templates
and one blank custom template for this function. At this time we have a template
that compares two
portfolios, three
portfolios and one to
ten portfolios. All of
these templates are
located within your
PerTrac\Custom
Reports subdirectory
and start with the
Custom Efficient
Frontier prefix. You
may also select the
MasterEfficientFrontie
rReport.xls file and create your own custom template. For more detailed
information on how to customize PerTrac Templates, see the section on PerTrac
Publisher. An example of the one to ten portfolios template is shown to the right
of this text.
171
PerTrac User Manual v.19 1
3.13 - Financial Planner and Simulation - View the online
tutorial!
Simulate
This tool allows you to determine whether your selected breakpoints, portfolio(s)
or interval points have a high or low probability of achieving a target value over a
given time frame.
NOTE – Any changes to the underlying inputs in the Efficient Frontier to create
you portfolio will flow through to this module.
Portfolio Planning and
Simulation window
opens. There are
multiple inputs and
restrictions that you can
apply to your analysis.
Let us first consider
Simulation
Parameters.
Simulation Parameters – Simulation Parameters allow you to
apply specific constraints to the analysis. The Start and End
Date are the first two options in the box. This date range will
impact the analysis greatly as this is the sample period drawn
from in order to produce the results for this module. These dates
are fixed prior to entering the Portfolio Planning and Simulation
module in the Asset Allocation Window.
The next option is Years to Simulate. Enter the number of years
into the future you wish to simulate. PerTrac gives you’re the
option of simulating from 1 to 50 years in your analysis.
172
Optimization & Simulation
The Number of Simulations refers to how many portfolios are generated to
draw a distribution. This number should typically range from 1,000 to 10,000.
Rebalancing refers to how often the individual portfolio simulations will
rebalance to the original portfolio allocation. For example; one portfolio you
simulate may originally be 50% S&P 500 and 50% Lehman Aggregate Bond
index. If you choose to rebalance annually, the simulation will yearly start the
year with a 50/50 mix. If you choose to never rebalance, each simulation will
begin with a 50/50 mix but those allocations will change depending on the growth
of the assets.
The Inflation Rate is used to adjust any cash flow that you have applied to the
simulation. The inflation rate is not applied to ending annual balances. The cash
flow inputs will be discussed later.
The Tax Rate you enter will be applied to the year-end balance if you have a
positive return for the year. If you have a loss for the year no tax is calculated.
Once the year-end amount has been taxed, withdrawals are then subtracted.
Contributions are added on the first of the following year, and will be included in
that year's ending value.
Initial Deposit refers to the starting dollar amount of the analysis while the
Target Value refers to the desired result.
The Simulation Method determines how the distribution is to be drawn. The
drop down menu lists the available simulation methods: bootstrap, normal and
lognormal. Each of these methods is discussed in detail at the end of this
section just before Part IV.
The last option is a check box allowing you to use the same fixed random
sequence in your simulations. This check box is essential if you want to
compare results after changing any input in the simulation. If you do not check
this box, each time you regenerate a report, a new random sample will be used
and your comparison will be distorted.
Cash Flow Options – Cash flows can be incorporated
using the additions and withdrawals columns. You can
enter up to four columns of annual additions and four
columns of annual withdrawals. The number of rows
displayed here represents an individual year within the
analysis. If you select 20 years, you will see 20 rows.
Each addition or withdrawal column can have a
custom name. The default names will appear unless
you change them. Please refer to the Workbook
173
PerTrac User Manual v.19 1
Designer section for more information on customizing the column names. If you
want your cash flows to Adjust for Inflation, use the appropriate check box and
enter a desired annual inflation rate.
174
Portfolio Construction
3.04 - Portfolio Construction – Universe Allocation
Window - View the online tutorial!
The Asset Allocation
Window allows you to define
the allocations and leverage
for each investment in a
portfolio. You can open the
Asset Allocation Window
by clicking the Universe
Statistics, Charts, Asset
Allocation and
Optimization button from
the Current Universe
Window or by clicking the
Universe button on the Tool Bar.
The top of the window contains a table with the name of each investment in the
current universe, along with columns titled %Allocation, $Allocation, Leverage,
Start Date, and End Date. The start and end dates are for informational
purposes only. However, you can set the values for the Allocation and
Leverage columns by using the controls at the bottom of the window or by typing
in each cell. Command buttons are also located at the bottom of the window that
will execute the various portfolio analysis functions, which we discuss later in
greater detail.
Setting Up an Asset Allocation
Allocation Percentage and Dollar Amount
PerTrac allows you to either type in a percentage allocation per investment or a
dollar amount allocation per investment. The default Total Allocation $ dollar
amount is $10,000,000. To determine the percentage of allocated to an
investment, enter a percent value in the %Allocation column in the current
universe (20%, for example, could be entered as either “.2” or “20%”).
Alternatively, you could enter a specific dollar amount in the $Allocation
column. Allocations may also be copied from the Efficient Frontier Optimizer
or the Linear Optimizer which will be discussed later.
As you enter each value, the Total Allocation % box at the bottom left of the
Asset Allocation Window displays the total allocated amount entered.
Clicking Reset Allocation clears all values in the Allocation columns, allowing
you to start your allocations from scratch. If no allocation percentages or dollar
175
PerTrac User Manual v.19 1
amounts are entered, PerTrac will create an equally weighted allocation to each
investment.
Leverage
The Leverage column is located to the right of the $Allocation column and
requires a ratio value. Entering a 2, for example, would cause the returns or
that investment to be leveraged 2 to 1. You can also enter negative numbers in
the leverage field to take a short position in an investment. For example, a
leverage factor of -1 would mean you are short that particular return stream at a
ratio of 1:1 (or no) leverage. Clicking the Reset Lev button clears all values in
the Leverage column. If no leverage ratios are entered, PerTrac assumes that
the investments are not leveraged.
Portfolio Size
To define the size of the portfolio enter the dollar amount in the Total
Allocation $ box, below the Total Allocation % box. In the Pro Forma table,
these values are used in conjunction with the values in the Allocation column
to determine the actual dollar amount allocated to each investment unless you
constructed your portfolio using the $ Allocation boxes, in which case the total
allocation will be automatically calculated.
Rebalance Periods
Selecting one of the rebalance options, located below Total Allocation
box, allows you to maintain the intended allocation over time. At the end
of each month, quarter, or year, PerTrac will divide the equity among the
investments according to the allocation percentages. The resulting equity
additions and withdrawals will be reflected in the Pro Forma table,
discussed later.
Start Date & End Date
The Start Date and End Date boxes, located to the left of the Reset
Allocation button, allow you to define the time period for which all
calculations are made. Checking the boxes labeled Use Latest Start
Date and Use Earliest End Date will cause PerTrac to take only the
common dates for all investments into consideration provided the
investments have at least one month in common.
If you attempt to compute statistics or optimize over non-common date
ranges, the Index Calculation Options Window will open, prompting you
to choose how to proceed with your pro-forma calculations. You can
either reallocate assets to only those investments that have data, assume
a zero or risk-free rate return (which you can define) for investments that
have no data, or default to the common date range. Keep in mind that, if
you choose to use date ranges for which some investment have no data,
176
Portfolio Construction
the statistics for the individual investment will be inaccurate when viewed
through the Asset Allocation function.
Quarterly Data Option
If you want to work solely with quarterly data, check the Quarterly Data box,
located to the right of the Use Earliest End Date box.
Saving An Asset Allocation
When PerTrac saves an asset allocation, a new universe is created that contains
not only the names of the investments, but the values in the Allocation and
Leverage columns as well. Click the Save Settings button to save this universe
under a new file name. When you view an allocated universe in the Current
Universe Window, the Allocation and Leverage values will be displayed in
brackets following the name of the investment. When you open the Asset
Allocation Window for this universe, the Allocation and Leverage fields will
automatically contain the saved values.
Converting a Portfolio to an
Investment
There are two areas in PerTrac to
construct allocated portfolios. Here
using the Convert Portfolio to
Investment option and the next section
3.05 Portfolio Builder. Examples of
allocated single investments would be a fund of hedge funds, a diversified
portfolio of investments, or a policy benchmark comprised of allocated
benchmarks. Clicking the Convert Portfolio to Investment button will open a
window to name your composite investment. Note that the data source is User
which means your new fund is not associated with any data vendor investment.
All portfolios that are converted to an investment will appear in the investment list
in the Current Universe Window and can be treated in the same way as any
other investment. This is, therefore, an ideal method of creating an index with
which to make a comparative analysis.
TIP – It may be a good idea to label both your investment and universe with the
same name. You may not recall how you created the investment unless you
have a saved universe file with the allocation per asset saved.
177
PerTrac User Manual v.19 1
3.05 - Portfolio Construction – Portfolio Builder - View
the online tutorial!
Portfolio Builder
While converting a portfolio to an investment is a quick and convenient way to
analyze its performance, you may have more complex needs that require the
allocation to change periodically, perhaps even on a monthly basis. This
situation can be handled with the Portfolio Builder. The Convert Portfolio to
investment option explained above in section 3.04 is a quick way to create
single investments from a universe of funds or benchmarks. However, the
data series will reflect the investments and allocations entered in the universe
allocation window. If your allocations change over time, or if you hire or fire
managers over time, the Convert Portfolio to Investment option will not reflect
all of those changes. You would continue to overwrite the original investment
wiping out prior period adjustments to the portfolio. The Portfolio Builder
feature on the other hand was designed to build portfolios taking into account
all of the changes you make to the portfolio over time. This tool can be utilized
to create portfolios of investments or benchmarks.
1. Select Portfolio Builder from the Tools menu.
2. When the Portfolio Builder Window opens, click the Select
Universe button and choose an existing universe file. Ideally, this
universe should contain every investment that you want to use to build
your portfolio, even investments that are no longer used within your
current allocation.
3. Once the universe is open, the first column in the spreadsheet will be
labeled “Date” and the last column in the spreadsheet will be labeled
“Total Allocation”. Between these columns will be a column for each
item in your universe – you may need to use the scrollbars to view the
entire spreadsheet. Enter the date on which you would like your
portfolio to begin in Row 1 of the Date column.
4.
Enter the desired allocations using either percentage or decimal
numbers; (i.e. “15%” and “.15” are interchangeable). It is not
necessary to enter an allocation if you wish to exclude an item from the
portfolio. As you enter your allocations, the Total Allocation column
will display the sum of the current month’s allocation.
5. Your allocations can be
entered on a monthly basis if
you know the allocations at
the end of each month. Your
other option would be to
allocate only when you wish
to rebalance the portfolio.
For example, if you begin
with Jan-1990 on Row 1, and
178
Portfolio Construction
want to either rebalance back to that allocation or change the
allocation for May-1990, it is not necessary to enter allocation values
for February, March, and April. The February, March and April
allocations will change based on what the asset performance, basically
no rebalancing. In this case, the date for Row 2 would be May-1990.
Note: If you create portfolios using the universe allocation window you
will have the option to rebalance your portfolio Never, Monthly,
Quarterly or Annually. However, the Portfolio Builder does not have
those options. Rebalancing will only take place if you enter a new row
of allocations.
6. Continue to enter allocations in this way for each change in the
portfolio. Since the Date column contains the date of the first month of
each new allocation, the final allocation will require an end date to be
entered in the Ending Date box, located near the bottom right of the
Portfolio Builder Window.
7. Before converting this information into a single investment, you can
save the allocation settings as a spreadsheet by clicking Save
Allocation and entering a name for the “.vts” file. This can be loaded
in the future by clicking Load Allocation and selecting the saved file.
8. If, for any time period, the total allocation is less than 100%, the
portfolio builder will assume this to be cash and will apply a percentage
rate of return to the remaining money based on the value in the
Interest Rate box, located at the bottom right of the Portfolio Builder
Window. You can change this value by entering a new percentage or
decimal number.
NOTE: if you do have an allocation to cash, you can either enter an
interest rate here to represent cash or add a cash benchmark (for
example: ML 3 month t-bill) to your universe and allocate to that
benchmark.
9. On the other hand, if the total allocation is greater than 100% for a
given time period, the portfolio builder assumes you are using leverage
and will adjust the net asset value based on the value in the Loan
Rate box, on the borrowed funds , located above the Interest Rate
box.
10. The Initial Investment defaults to 10,000,000. You can change this
number based on your needs.
11. The Portfolio Builder Window allows you to Remove Investment or
Add Investment right from the current window. This comes in handy
when you are changing monthly allocations due to hiring/firing
managers over time.
12. Once you have made all the necessary entries, click Build Portfolio.
179
PerTrac User Manual v.19 1
13. When the Convert Portfolio To Investment Window opens, enter a
name and select a data source for your new investment and click
Enter.
In addition to creating a new investment in your database, the Portfolio
Builder will generate a spreadsheet that displays both total and individual net
asset values of the portfolio for each month in the data stream. Double-rightclicking over this spreadsheet will transfer the spreadsheet to the Formula
One Workbook Designer, where it can be edited, formatted, and saved as a
“.vts” file.
NOTE – You must re-load the master universe (all.unv) by clicking the Load
Master Universe button before the Current Universe Window will list the
new investment.
Command Buttons
Reset Alloc - Clears all values in the Allocation column.
Reset Lev - Clears all values in the Leverage column.
Cancel - Closes the Asset Allocation Window.
Convert Portfolio to Investment - Allows you to convert a portfolio of
investments or benchmarks into a single investment.
Save Settings - Allows you to save the investment names, allocation
percentages, and leverage values as a separate universe.
NOTE – The following buttons initiate commands that will be discussed
later
Statistics - Opens the Universe Statistics Window, allowing you to
display a variety of statistics for each investment in your portfolio.
Correlation Analysis – Allows you to create correlation analysis
tables, providing an indication of the diversification of your portfolio.
Charts - Opens the Universe Charts Window, allowing you to quickly
create, edit, and save a wide variety of charts for the current portfolio
and the underlying investments.
Pro Forma - Opens the Pro Forma Window, allowing you to view a
variety of historical performance and summary data based on the
allocation settings for your portfolio.
Efficient Frontier Optimizer - Opens the Efficient Frontier Setup
Window, displaying an Efficient Frontier Plot, along with a
180
Portfolio Construction
corresponding Risk Table, Allocation Table, Allocation pie chart, and
tracking error pie chart that displays a Markowitz risk/return
optimization.
Linear Optimizer - Opens the Linear Optimization Setup Window,
allowing you to display optimal portfolios targeting a specific statistic.
181
PerTrac Investment Summary Reports
4.01 - Print Investment Summary Reports - View online
tutorial!
PerTrac contains three Investment Summary Reports: Print Investment
Summary Report, Print Multiple Investment Summary Reports, and Print
Investment Information and Statistics Tables.
1. To produce the Summary Reports click the
Reports tab located on the upper menu bar.
Then select Print Investment Summary
Reports.
2. The Report Setup Window will appear.
There are three investment report options. One
Page Statistics, One Page with Charts, Two
Page with Charts. The report date range is
shown below the report options. By default, the date range is set to cover the
entire data history of the fund. The Starting Date and Ending Date can be
changed if you want to run the report over specific time periods or market
cycles.
3. If you select One Page with Charts or Two Page with Charts, there is a
Chart Options button on the right side of the setup window to format the
charts. The output for each report consists of the following:
a. One Page Statistics- This one page report contains the qualitative
information from the General Investment Information page as
well as the tables from the Investment Statistics page;
b. One Page with Charts- This one page report contains the
qualitative information from the General Investment Information
page and a few of the tables from the Investment Statistics page;
c. Two Page with Charts- This two page report is the most
comprehensive of the three report options and it contains the
qualitative data from the General Investment Information page
and all of the tables and quick charts from the Investment
Statistics page.
182
PerTrac Investment Summary Reports
NOTE: The report will be displayed in the Summary Report Window, where
you will have several options for editing, printing, and page layout.
Double-right-clicking over the report opens the Workbook Designer, where
you will have more advanced editing capabilities. The file can also be saved
as an Excel file (using the “Save As” button) which can then be edited in
Excel.
4.02 - Print Multiple Investment Summary Reports
Investment Summary Reports can also
be printed for each item in a universe as
a batch.
1. From the Reports menu, select
Print Multiple Investment
Reports.
2. When the Print Universe window
opens, click Locate to select the
desired universe.
3. Choose the type of report you
wish to create.
4. Using the Start Date and End
Date boxes, designate a fixed or
specify that the report should
cover the full history of each fund.
5. If the date range of an investment is less than the fixed date range, you
can select either to exclude it from the reports or print the report using the
available data.
6. Click Print to finish.
You do not have to format charts every time you print a new report. You can
store your chart settings by clicking Chart Options from any of the
Investment Reports setup windows. This will allow you to use the Chart
Designer to edit the chart to your liking. When finished, click the Save
Settings button.
NOTE: There is only one option to produce the universe reports, Print
Report, which will spool the reports to the printer.
183
PerTrac User Manual v.19 1
4.03 - Print Investment Information & Statistical Tables
You can also create single investment reports that include only the
information or statistical tables that you select over a time frame that you
specify. Selecting Print Investment Information and Statistical Tables from
the Reports menu opens the Investment Tables Setup Window. The
Investment Tables Setup Window allows you to check off all the information
you would like to include, as well as the date range for the tables. Once you
have made your selections, click Print to display the report.
Investment Tables Window
The tables will be displayed in the Summary Report Window, where you will
have several options for editing, printing, and page layout. Double-rightclicking over the report opens the Workbook Designer, where you will have
more advanced editing capabilities.
Command Buttons
Print - Prints the report.
Print Preview – Displays a preview of how the report will look.
Print Setup - Allows selection of printing properties such as printer,
paper source, and page orientation.
Page Setup - Allows specification of margins, headers, footers, etc.
Print Titles - Allows you to highlight a field in the report that will be
used as the report title.
184
PerTrac Investment Summary Reports
Save As - Saves the report for future use. When saving the report,
you can choose a different file type, such as Excel, which will allow you
to view the report in a different program later.
Select Information - Opens the Report Setup Window, allowing you
to change either the date range or the report type.
Previous - Shows the report for the previous investment in the
universe.
Next - Shows the report for the next investment in the universe.
4.04 - Workbook Designer
The Workbook Designer is used to display and edit most reports created within
PerTrac. It gives you tremendous flexibility when it comes to formatting, editing,
or saving reports. The Workbook Designer can be activated by placing your
cursor over the report and double-right-clicking. This action will opens an
editable copy of the report in the Workbook Designer and allows you to save the
report for future use.
NOTE:You can also open the Workbook Designer program directly by selecting
Programs/PerTrac/Spreadsheet Designer from the Start menu.
Workbook Designer
Workbook Designer Functions
Most of the functions in the workbook designer are very similar to functions in
widely used spreadsheet programs. Some of the more common functions are
listed below.
185
PerTrac User Manual v.19 1
Saving a Workbook Designer file
Selecting Write from the File menu opens the Write File dialog box, where you
can name and specify the location of the new file. When saving a worksheet, you
can choose a different file type, such as Excel, which will allow you to view the
report in a different program later.
Opening a Previously Saved Workbook Designer File
Selecting Read from the File menu opens the Read File dialogue box, where
you can select a file you wish to view. You will see a message warning that the
contents of the existing workbook will be erased in order to read in the new
workbook. Clicking Yes allows you to proceed.
Cut, Copy and Paste
Highlight the range of cells you want to cut or copy then select either Cut or
Copy from the pop-up menu. To paste the contents of the clipboard, select the
cell that represents the upper left corner of the range in which you want to paste
and select Paste from the pop-up menu.
Inserting or Deleting Rows, Columns or Cells
To insert a row or column, click on the row number or column letter just below (in
the case of rows) or just to the right (in the case of columns) of where you want
the new row or column to go. Select Insert from the Edit menu. To insert a cell,
highlight the cell where you want the new cell to go and select Insert from the
Edit menu. The current cell and all cells to the right will be shifted right to
accommodate the new cell.
To delete a row, column or cell, click on the row number, column letter, or cell
you want to delete and select Delete from the Edit menu.
Adding a Chart To a Report
From the Workbook Designer, click the chart icon at the far right of the icon bar.
The chart tool will be activated. Click and drag on the sheet to define the size of
the chart and where you want it placed. Once the chart area is defined, the
Chart Wizard will open, giving you a variety of charting options.
Help Index
The Workbook Designer also has a Help index to guide you through various
tasks. The online help can be accessed from the Help menu.
186
PerTrac Publisher Reports
4.05 - PerTrac Publisher Reports - View the online
tutorial!
PerTrac Publisher is a comprehensive report generator which enables you to
quickly create customized client and prospect performance reports, investment
committee documents, and more. There are three benchmark report options and
two custom report options. The Benchmark Reports include pre-built
Performance, Style, and Peer Analysis reports that can be run on a single fund
or multiple funds. The two Custom Report generators, Generate Custom
Reports and Generate Combination Reports, give users a powerful tool for
creating their own custom report templates.
4.06 - Performance Measurement Report - View the
online tutorial!
This report is a comparative performance and risk analysis of an investment
versus one or two benchmarks.
NOTE: All publisher reports can be generated on a single fund or a universe of
funds.
This report contains the following tables and charts:
Period Return Performance Table: This
table contains the 1 Month, 3 Month, 6
Month, YTD, 1, 2, 3, 5, 7, & 10 year
annualized returns for the selected
investment and benchmarks. The table
also contains the differential time period
performance between the investment and
the benchmarks.
Calendar Year Performance: This table
contains the last 10 years of calendar year
returns for the investment and the
187
PerTrac User Manual v.19 1
benchmarks. The table also contains the differential calendar year
performance between the investment and the benchmarks.
Historical Standard Deviation Chart: This chart contains the 1, 3, 5,
7, & 10 year annualized standard deviation for the investment and the
benchmarks.
Historical Sharpe Ratio Chart: This chart contains the 1, 3, 5, 7, & 10
year annualized Sharpe Ratio for the investment and the benchmarks.
Risk/Return Scatterplot Chart: This chart shows an annualized
Risk/Return scatterplot for the investment and benchmarks.
Combination Chart: This chart shows the VAMI (Value Added
Monthly Index or Growth of $1,000) and the monthly returns for the
investment only.
Correlation Table: This table contains the correlation analysis
statistics of the investment relative to the benchmarks.
Capture Ratio Table: This table contains the capture ratios of the
investment relative to the benchmarks.
How do I Generate the Performance Measurement Report On A
Single Fund?
1. Select an investment by highlighting the
investment in the PerTrac Home window.
2. Click the Reports button located on the
upper menu bar and select PerTrac Publisher.
3. The PerTrac Publisher report selection
window will open. On the left hand side you will
see two gray buttons labeled Benchmark
Reports and Custom Reports. Click
Benchmark Reports. There will be a report icon labeled Performance
Measurement Report.
4. To run the report, double click on the report icon. A setup window will
appear.
188
PerTrac Publisher Reports
There are five sections of inputs that must be selected prior to generating the
performance measurement report. The sections are numbered on the screenshot
above.
1. Fund Selection: The first step is to select a fund on which to generate a
report. The Use Investment option should be selected on the upper left. If you
are generating the report for one fund, and you highlighted that fund on the home
window prior to opening this setup window, the fund will be automatically listed in
the Use Investment window.
TIP: If the fund is not listed in the Use Investment window, click Locate
Universe to open the universe that contains the fund. If the universe contains
numerous funds, click Expand on the left to see an expanded view of the
universe. When you find the fund that you want in this list, double-click on it and it
will appear in the Use Investment window.
NOTE: Next to the fund name is a box that contains the risk free rate of return for
the Sharpe ratio, Downside Deviation and Sortino ratio calculations. You may
change the risk free return to reflect the value most appropriate for the time
period being reported. This risk free return setting is independent from the one
used on the Investment Statistics page back in PerTrac.
2. Benchmark Selection: One or two benchmarks may be selected for this
report. Click Locate Benchmarks to locate the universe that contains your
benchmarks. This could be the “Correl.unv” universe or any universe of
benchmarks you have created. When the benchmark universe has been
selected, click the Down Arrow at the end of the Benchmark 1 window to select
189
PerTrac User Manual v.19 1
the first benchmark. Then click the Down Arrow at the end of the Benchmark 2
window and select the second benchmark.
NOTE: The second benchmark can be a composite of two benchmarks. Click
both Down Arrows at the end of the window to select the two benchmarks, then
click the Down Arrows in the windows to the left of the Benchmark names to
select the allocations to each benchmark.
4. Template Selection: Click the
Locate Template button. The custom
reports folder will appear with a list of
Excel template files. There are two prebuilt files for this report that should be
used initially. The
MasterPerformanceReport is
designed for funds with monthly return
streams, and the
MasterPerformanceReportQuarterly
is designed for funds with monthly or
quarterly return streams.
NOTE: when the Save Reports in Folder option is selected you must click the
Locate Folder button to select the folder in which the reports will be saved.
NOTE: You also have the option, just below the folder window, to Overwrite
Existing Files. When the report is saved to a folder, the name of the file will be
the name of the fund if you choose this option.
4. Date Range Selection: Set your report Starting and Ending date range.
Inception to End of Data is the default setting. When the Specific Dates option
is selected you can type a start and end date in the Starting and Ending date
boxes. Under the date range option you can elect to Use Common Start and
End Dates (the common start and end dates for the fund(s) and benchmark(s),
to run the report Quarterly, or to Limit report to the last 10 years of data.
TIP: If you elect to run the report Quarterly, you must select the
MasterPerformanceReportQuarterly Excel template.
5. Click Generate Reports. This will open the report in Excel. The report will
be a read-only file, so you must save the newly generated report with a
190
PerTrac Publisher Reports
different name. For example you might want to save the file with the report
date in the file name.
There are three output options for generating your reports: Print, which will send
the report directly to the printer; Save Reports in Folder, which saves the file(s)
in a folder of your choosing; Leave Template Open (Single Investments Only)
which will open the report in Excel.
There are three output options for generating your reports: Print, which will send
the report directly to the printer; Save Reports in Folder, which saves the file(s)
in a folder of your choosing; Leave Template Open (Single Investments Only)
which will open the report in Excel.
TIP: You may make formatting changes to the report prior to saving. You can
add your logo to the report, change the colors, or format the report in any way
using Excel’s formatting functions. You would then save the template under a
new name. This would be your new template, which you could select for future
reports in Step 3 of this process.
How do I Generate the Performance Measurement Report on a
Universe of Funds?
The process for generating the Performance Measurement Report on a universe
of funds is the same as the process listed above for a single fund with the
following exceptions:
191
PerTrac User Manual v.19 1
1. In section 1 of the setup window select Use Universe.
2. Click the Locate Universe button to select the universe of funds.
3. If the universe contains funds with different strategies or asset classes, and
you have assigned specific benchmarks to the funds in the universe, check the
Use Assigned Benchmarks option. If you have not assigned benchmarks the
two benchmarks shown in the select benchmark windows will apply to all funds in
the universe. Please refer to section 2.13 for instructions on assigning
benchmarks.
4. When generating the report on a universe of funds there are two options for
outputting the reports: Print, which will send the reports to the printer; and Save
Reports in Folder, which will save the reports in a folder.
5. If you would like to overwrite existing reports, select Overwrite Existing Files.
TIP: If you elect to save the reports in a folder, click Locate Folder to locate the
folder where the reports will be saved. The reports will be saved under the
names of each of the funds in your universe.
4.07 - Style Analysis Report - View the online tutorial!
The Style Analysis Report is a pre-built, three-page report containing
comparative performance and risk analysis of a fund versus a style benchmark
and market benchmark, followed by two pages containing the fund’s style
analysis output.
Page 1: The first
page of the report is
the Performance
Measurement Report
seen above.
However, in this
version of the report,
the two benchmarks
for comparison are
the style/blended
benchmark and the market benchmark.
Page 2: Contains a bar chart showing the allocations of the
style/blended benchmark, correlation statistics relative to the style and
market benchmarks, capture ratios relative to the style and market
benchmarks, a cumulative return chart and cumulative differential
relative to the style and market benchmarks.
Page 3: A style history chart showing the style drift over time and
rolling Beta, Correlation-R, R-squared, Alpha and Tracking Error
relative to the style benchmark.
192
PerTrac Publisher Reports
How do I Generate the Style Analysis Report On A Single Fund?
1. Select the investment for the report by highlighting
the investment in the PerTrac Home window.
2. Click the Reports button located on the upper
menu bar and select PerTrac Publisher.
3. The PerTrac Publisher report selection window
will open. On the left hand side you will see two gray
buttons, Benchmark Reports and Custom
Reports. Click the Benchmark Reports button.
There will be a report icon labeled Style Analysis Report.
4. To run the report, double click your left mouse button on the icon. A gray
setup window will appear.
There are six sections of inputs that must be selected prior to generating the
Style Analysis Report. The sections are numbered on the screenshot below.
1. Selection: If you are generating a report for one fund, and you highlight
that fund on the home window prior to opening this setup window, the fund
will be automatically listed in the Use Investment window.
TIP: If the fund is not listed in the Use Investment window, click Locate
Universe to open the universe that contains the fund. If the universe contains
numerous funds, click Expand on the left to see an expanded view of the
universe. When you find the fund that you want in this list, double-click on it and it
will appear in the Use Investment window.
193
PerTrac User Manual v.19 1
2. Style Universe Selection: Click the Locate Universe button to select the
universe of benchmarks for style analysis.
3. To the left of the benchmark names you will find a Rolling Period (in
Months) window. The rolling periods selected here will be used to create
the Style History and Rolling Beta, Correlation-R, R-Squared, Alpha and
Tracking Error charts. Below the Rolling Period window is an option to
Include Risk Free Rate in Style Universe. Enter the appropriate risk free
rate in the Risk Free ROR window.
TIP: Rather than using the Include Risk Free Rate option to represent cash, you
could add a cash investment (i.e. ML 3-Month T-Bills) to the style universe to
represent the cash component. You should also enter a risk free return in the
Risk Free ROR, which will be used for the Sharpe Ratio, Sortino Ratio and
Downside Deviation statistics.
4. Benchmark Selection: There will be two comparative benchmarks on this
report. The Style Benchmark, which will be created as a result of the style
analysis regression, and a Market Benchmark. To select the Market
Benchmark click the Locate Benchmarks button in section three. This could be
the “Correl.unv” universe or any universe of benchmarks you have created.
When the universe has been selected, click the Down Arrow at the end of the
Market Benchmark window to select the benchmark.
NOTE: The Market Benchmark can be a composite of two benchmarks. Click
both Down Arrows at the end of the window to select the two benchmarks, and
then click the Down Arrows in the windows to the left of the Benchmark names
to select the allocations to each benchmark.
5. Template Selection: Click the
Locate Template button and the
custom reports folder will appear
with a list of Excel template files.
There are two pre-built files for this
report that should be used initially.
The MasterStyleReport designed
for funds with monthly return
streams, and the
MasterStyleReportQuarterly
designed for funds with monthly or
quarterly return streams.
194
PerTrac Publisher Reports
NOTE: when the Save Reports in Folder option is selected you must click the
Locate Folder button to select the folder in which the reports will be saved.
NOTE: You also have the option, just below the folder window, to Overwrite
Existing Files. When the report is saved to a folder, the name of the file will be
the name of the fund if you choose this option.
6. Date Range Selection: Set your report Starting and Ending date range.
Since Inception to End of Data are the default settings. When the Specific
Dates option is selected you can type a start and end date in the Starting and
Ending date boxes. Under the date range option you can elect to Use Common
Start and End Dates (the common start and end dates for the fund(s) and
benchmark(s), to run the report Quarterly, or Limit report to the last 10 years
of data.
TIP: If you choose to run the report Quarterly, you must select the
MasterStyleReportQuarterly template.
7. Click Generate Reports. This will open the report in Excel. The report will be
a read-only file, so you must save the newly generated report with a different file
name.
NOTE: There are three output options for generating the reports: Print, which will
send the report directly to the printer; Save Reports in Folder which will save
the file(s) in a folder of your choosing; Leave Template Open (Single
Investments Only) which will open the report in Excel.
TIP: You may make formatting changes to the report prior to saving. You can
add your logo to the report, change the colors, or format the report in any way
using Excel’s formatting functions. You would then save the template under a
new name. This would be your new template, which you could select for future
reports Step 4 of this process.
195
PerTrac User Manual v.19 1
How do I Generate the Style Analysis Report on a Universe of
Funds?
The process for generating the Style Analysis Report on a universe of funds is
the same as the process listed above with the following exceptions:
Step 1: In section 1 of the setup window select the Use Universe option.
Step 2: Click Locate Universe to select the universe of funds for which reports
will be generated.
Step 3: If the universe contains funds with different strategies or asset classes,
and you have assigned specific benchmarks to the funds in the universe, check
the Use Assigned Benchmarks option. If you have not assigned benchmarks
the two benchmarks shown in the select benchmark windows will apply to all
funds in the universe. Please refer to section 2.13 for instructions on assigning
benchmarks.
Step 4: When generating the report on a universe of funds there are two options
for outputting the reports: Print, which will send the reports to the printer; and
Save Reports in Folder, which will save the reports in a designated folder.
Step 5: If you have previously saved files from a prior period, you can select
Overwrite Existing Files.
TIP: If you choose to save the reports in a folder, click Locate Folder to locate
the folder where the reports will be saved. The reports will be saved under the
names of each of the funds in your universe.
196
PerTrac Publisher Reports
4.08 - Peer Group Analysis Report - View the online
tutorial!
The Peer Group Analysis Report
is a pre-built, six-page report that
contains comparative performance
and risk analysis of a fund versus
two benchmarks followed by five
pages that show the fund’s
rankings relative to its peers on
numerous risk and return
measures.
Page 1: The first page
of the report is the
Performance Measurement Report.
Page 2: This page shows the fund’s peer ranking for a 1, 3, 5, 7, & 10
year Sharpe ratio, as well as, a peer universe Risk/Return scatterplot.
Pages 3 through 6: These pages provide additional measures of the
fund’s performance relative to its peer group.
How do I Generate the Peer Group Report?
Step 1: Select the investment for the report by
highlighting the investment at the PerTrac Home
window.
Step 2: Click the Reports button located on the
upper menu bar and select PerTrac Publisher.
Step 3: The PerTrac Publisher report selection
window will open. On the left hand side you will
see two gray buttons, Benchmark Reports and
Custom Reports. Click the Benchmark
Reports button. There will be a report icon labeled Peer Group Report.
Step 4: To run the report, double click on the icon. A gray setup window will
appear.
197
PerTrac User Manual v.19 1
There are six sections of inputs that must be selected prior to generating the
Peer Group Report. The sections are numbered on the screenshot below.
1. Fund Selection: The first step is to select a fund on which to generate the
report. If you are generating the report for one fund, and you highlighted that fund
on the home window prior to opening this setup window, the fund will
automatically be listed in the Use Investment window.
TIP: If the fund is not listed in the Use Investment window, click Locate
Universe to open the universe that contains the fund. If the universe contains
numerous funds, click Expand to see an expanded view of the universe. When
you find the fund that you want in this list, double-click on it and it will appear in
the Use Investment window.
2. Peer Group Universe Selection: Click Locate Peer Group to select the peer
universe to which your fund will be compared. To the left of the peer universe
window you will find two options for the universe Risk/Return Scatter Plot date
range. The default option is set to Use Investment Date Range. This can be
changed by clicking the down arrow on the Years for Risk/Return Scatter Plot
window giving you the option of producing the chart on a 1, 2, 3, 5, 7, or 10 year
basis.
NOTE: If you select a specific year for the chart versus Use Investment Date
Range, you must also click Use Above just below the year selection window.
198
PerTrac Publisher Reports
3. Benchmark Selection: This report requires the user to select two
comparative benchmarks. If you select only one benchmark, you will receive an
error message when the report is generated that two benchmarks must be
selected. Click the Locate Benchmarks button in the third section to locate the
universe that contains your benchmarks. This could be the “Correl.unv” universe,
or any universe of benchmarks that you have created. When the universe has
been selected, click the Down Arrow at the end of the Benchmark 1 window to
select the first benchmark. Then click the Down Arrow at the end of the
Benchmark 2 window and select the second benchmark.
NOTE: The second benchmark can be a composite of two benchmarks. Click
both Down Arrows at the end of each benchmark window to select the two
benchmarks, and then click the Down Arrows in the windows to the left of the
benchmark names to select the allocations to each benchmark.
4. Template Selection: Click the Locate Template button. The custom reports
folder will appear with a list of template files. There are two pre-built files for this
report that should be used
initially. The
MasterPeerReport designed
for funds with monthly return
streams, and the
MasterPeerReportQuarterly
designed for funds with either
monthly or quarterly return
streams.
NOTE: when the Save Reports in Folder option is selected you must click the
Locate Folder button to select the folder the report will be saved to. You also
have the option just below the folder window to Overwrite Existing Files. When
the report is saved to a folder, the name of the file will be the name of the fund.
This report has an additional option in section 4, Export Peer Statistics. If this is
checked the Peer Group Data tab in the report will show the fund names in the
peer universe and their values for each performance and risk measure shown in
the report. To access this data when the report is generated, click
Format\Sheet\unhide, on the Excel menu bar. Then select Peer Group Data to
unhide this sheet.
199
PerTrac User Manual v.19 1
5. Date Range Selection: set your report Starting and Ending date range.
Since Inception to End of Data is the default setting provided the data series
does not exceed 10 years. This report is has a 10 year maximum date range.
There is a Use Common Start and End Dates option that will run the report
over a common date range between the fund and the benchmarks. There is also
a Quarterly check box if you are running the report on funds with quarterly data
streams, or if you want to run funds with monthly data streams on a quarterly
basis.
NOTE: If you change the start date to reflect a date range longer than 10 years,
Publisher will automatically adjust the date range to a 10 year date range.
TIP: If you elect to run the report Quarterly by checking that option, you must
select the MasterStyleReportQuarterly Excel template.
6. The last step is to click the Generate Reports button. This will open the
report in Excel. The report will be a read only file, which means you will have to
save the generated report with a different name. For example you might want to
save the file with the report date in the file name.
TIP: You may make formatting changes to the report prior to saving. You can
add your logo to the report, change the colors, or format the report in any way
using Excel’s formatting functions. You would then save the template under a
new name. This would be your new template, which you could select for future
reports Step 4 of this process.
How do I Generate the Peer Analysis Report on a Universe of
Funds?
The process for generating Peer Group Reports on a universe of funds is the
same as the process
listed above for a
single fund with the
following exceptions:
200
PerTrac Publisher Reports
1. In section 1 of the setup window select the Use Universe option.
2. Click Locate Universe to select the universe on which the reports will be
generated.
3. If the universe contains funds with different strategies or asset classes, and
you have assigned specific Peer Groups to the funds in the universe, check the
Use Assigned Peer Universe option. . If you have not assigned benchmarks the
two benchmarks shown in the select benchmark windows will apply to all funds in
the universe. Please refer to section 2.13 for instructions on assigning
benchmarks.
4. When generating the report on a universe of funds there are two options for
outputting the reports: Print, which will send the reports to the printer; and Save
Reports in Folder, which will save the reports in a designated folder.
5. If you would like to overwrite existing reports, select Overwrite Existing Files.
6. When you generate the report you can elect to Export Peer Statistics which
creates a table listing the funds in the peer group universe and their values for
each performance measure and statistic in the Peer Group Report. To access
this data once the report is generated, click Format\Sheet\Unhide, on the Excel
menu bar. Then select Peer Group Data to display this sheet.
TIP: If you choose to save the reports in a folder, click Locate Folder to locate
the folder where the reports will be saved. The reports will be saved under the
names of each of the funds in your universe.
4.09 - PerTrac Publisher – Generate Custom Report
The Generate Custom Report option is the first of two powerful PerTrac
Publisher custom reporting tools. These reports were designed to give the user
tools to create their own custom report templates, which, once created, can be
generated at any time on any number of funds. Listed below are some of the
benefits of the Generate Custom Report option.
The report is generated in Excel to give you maximum flexibility when
formatting your report. For example, you can add you logo to the
report, use color schemes that match your company color schemes,
change chart types, etc.
The export to Excel contains over 1,000 statistics and performance
measures, all of the single investment charts that PerTrac calculates,
all of the qualitative data from the investment information pages, and
pre-built performance and statistics tables. This will give you maximum
flexibility with regards to the amount of data contained in your report
template.
201
PerTrac User Manual v.19 1
The report template can be a simple one page report or
comprehensive multi-page report, depending on the amount of
exported information you choose to use.
There are only three Excel functions used to build a template: cut,
copy\paste, & copy\paste special\paste link.
You have access to 15 pre-built templates that can be downloaded
from our website and populated with your fund data.
NOTE: The custom report options are designed for a single investment
compared to one or two benchmarks only!
How do I Create a Custom Report?
1. Select a fund you want to use while building your template by highlighting the
investment in the PerTrac Home window.
2. Click the Reports button located on the upper menu bar and select PerTrac
Publisher.
3. The PerTrac Publisher report selection window will open. On the left hand side
you will see two gray buttons, Benchmark Reports and Custom Reports. Click
the Custom Reports button. There will be a report icon labeled Generate
202
PerTrac Publisher Reports
Custom Report.
To run the report, double click on the Generate Custom Reports icon. A gray
setup window will appear.
There are six sections of inputs that must be made prior to generating a Custom
Report. The sections are numbered on the screenshot above.
1. Fund Selection: the first step is to select the fund to use as your sample fund
when creating the report. The Use Investment option should be selected on the
upper left. If you are generating the report for one fund, and you highlight that
fund on the home window prior to opening this setup window, the fund will be
automatically listed in the Use Investment window.
TIP: If the fund you want to run the report on is not listed in the Use Investment
window, click Locate Universe to open the universe that contains the fund. If the
universe contains numerous funds, click the Expand button on the left to see an
expanded view of the universe. When you find the fund that you want in this list,
double-click on it and it will appear in the Use Investment window.
2. Benchmark Selection: One or two benchmarks may be selected for this
report. Click the Locate Benchmarks button in the second section to locate the
universe containing your benchmarks. This could be the “Correl.unv” universe or
any universe of benchmarks you have created. When the universe has been
selected, click the Down Arrow at the end of the Benchmark 1 window to select
the first benchmark. Then click the Down Arrow at the end of the Benchmark 2
window and select the second benchmark.
203
PerTrac User Manual v.19 1
NOTE: The second benchmark can be a composite of two benchmarks. Click
both Down Arrows at the end of each benchmark’s selection windows to select
the two benchmarks, and then click the Down Arrows in the windows to the left
of the benchmark names to select the allocations to each benchmark.
3. Template Selection: Click Locate
Template. The custom reports folder
will appear with a list of Excel
template files. Select the
MasterChartLibrary.xls file.
TIP – At this point, no custom report has been created. Select the Leave
Template Open (Single Investments Only) option, which will open the report in
Excel when generated. That is where you will start building your report.
4. Date Range Selection: Set your report Starting and Ending date range.
Since Inception to End of Data are the default settings. When the Specific
Dates option is selected you can type a start and end date in the Starting and
Ending date boxes. Under the date range option you can elect to Use Common
Start and End Dates (the common start and end dates for the fund(s) and
benchmark(s), to run the report Quarterly, Hide Worksheets (which is an option
to use only after the template has been built), and Remove Textboxes.
NOTE – Textboxes are PerTrac’s way of exceeding Excel’s 256 characters per
cell limitation. If you enter large amounts or text in the Investment Information
fields, creating text boxes when the data is exported will allow you to include that
data on your template by cutting the textbox and pasting it to your template. If
you do not need textboxes for your qualitative data, choosing the Remove
Textboxes option will speed up your report generation.
5. Select Information Pages – Click the Select
Information Pages to select the investment
information you want to export into the report.
204
PerTrac Publisher Reports
Set Charting Options – The second option in step 5 is to set your charting
options. When creating a custom report you will have access to all of PerTrac’s
single investment charts. They will be located on the Library sheet in the
MasterChartLibrary.xls template. Whether some of those charts get populated,
and with what data, will be determined by your selections on Set Charting
Options page.
Rolling Statistics -There
are 5 rolling statistics
charts. Click the down
arrow to select your
statistic, and then enter
the rolling period.
Rolling Correlations There are 5 rolling
correlation charts. Click
the down arrow to select
your correlation statistic,
and then enter the rolling
period.
The Risk-Free
Benchmark – This option will allow you to select a benchmark to
represent the risk-free rate when calculating the Sharpe Ratio. This in
lieu of entering an annualized risk-free rate.
Volatility Bands - Enter the moving average.
Distribution of Returns – For the distribution of returns chart you can
set both the Increments and Range for the graph.
Risk-Return Scatter Plot Universe – There is universe risk-return
scatter plot chart on the report’s Library tab. Use this option to select
the universe you want to plot and the number of years to plot.
NOTE – There is a Use box for each of the options. The data for that option will
not be exported if the box is left unchecked.
6. Click the Generate Reports. This will open the report in Excel. The report will
be a read only file. You should save the file under a new name prior to building
your template. For example you could name the file “Our Company Custom
Report Template”.
NOTE: There are three output options in section 3 when generating the reports.
Print, which will send the report directly to the printer; Save Reports in Folder
which will save the file in a folder of your choosing; Leave Template Open
(Single Investments Only) which will open the report in Excel when generated.
205
PerTrac User Manual v.19 1
TIP: There are no limits on the number of templates you can create.
How do I Build The Custom Report Template?
When the steps above have been completed you will have an Excel spreadsheet
that contains numerous sheets of data.
TIP – Prior to getting started, click on the Instructions sheet to read the template
building instructions.
Step 1 – Build the template. The Template sheet shown on the screenshot
above, is your blank canvas. This is the starting point. Treat this like a blank
sheet of paper. If you are going to create a multiple page report, either insert
additional worksheets or build your report vertically down the Template page.
Determine whether the report will be Landscape or Portrait. From there start
tagging where your qualitative data, statistics, charts and tables will be
located. Once you have determined where the data will go, must get the data
from the other sheets in the workbook. As mentioned above there are only
three basic Excel functions to be used when moving data to your template:
Cut\Paste, Copy\Paste, Copy\Paste Special\Paste Link.
Library: This tab contains all of the charts available for the template.
Find the chart or charts you wish to include on the template, and then
cut and paste them in the appropriate place on your template.
NOTE – The charts MUST be cut, not copied. If you copy and paste a chart, the
macros will not update when the report is generated in the future.
Statistics: This tab contains over 1,000 statistics and performance
measures. If you want to include statistics from this page Copy the cell,
or range of cells, and go back to the Template sheet. Click into the
cell(s) where the data will be located, then click the Edit button on the
menu bar, click Paste Special, then click the Paste Link.
Information, Information 2 & Categories: These sheets contain the
qualitative data from the Investment Information pages in PerTrac.
To include information from these pages you should Copy, Paste
Special & Paste Link as above.
NOTE: The Information 2 sheet contains the data being exported from the
System and User Information pages. If you export fields with a lot a text, and
you leave the Remove Textboxes option on the setup window unchecked, the
data will be exported to individual cell textboxes. To add a text box to your
template, Cut it from the Information 2 sheet and paste it on your template.
206
PerTrac Publisher Reports
Tables: The Tables sheet contains a variety performance and risk
statistics tables. To add the tables to you template, Copy the table(s)
from the Tables sheet and Paste it on to your template.
TIP: User Data and Leverage Data are available if you enter that
information on the appropriate section of the Investment Data
window in PerTrac. Further explanation is available in the
Instructions sheet in your template workbook.
Step 2 – Format your report. Now that your template has the data, use Excel’s
formatting capabilities to format the report. Add your company logo, change the
colors to reflect your company color schemes, add headers, add disclaimers and
then Save the template.
Step 3 – Generate the report. Follow the instructions listed above to generate
your report, substituting your new template for the MasterChartLibrary.xls
template.
207
PerTrac User Manual v.19 1
How do I Generate My Custom Template on a Universe of Funds?
The process for generating your custom template on a universe of funds is the
same as the process listed above for a single fund with the following exceptions:
1. In section 1 of the setup window select the Use Universe option.
2. Click the Locate Universe to select the universe of funds on which the reports
will generated.
3. If the universe contains funds with different strategies or asset classes, and
you have assigned specific benchmarks to the funds in the universe, check the
Use Assigned Benchmarks option. This will insure your funds are compared to
the appropriate benchmarks when the reports are generated. If you have not
assigned benchmarks the two benchmarks shown in the select benchmark
windows will apply to all funds in the universe. Please refer to section 2.13 for
instructions on assigning benchmarks.
4. When generating the report on a universe of funds there are two options for
outputting the reports: Print, which will send the reports to the printer; and Save
Reports in Folder, which will save the reports in a designated folder.
5. If you would like to overwrite existing reports, select Overwrite Existing Files.
TIP – If you elect to save the reports in a folder, click Locate Folder to locate the
folder where the reports will be saved. The reports will be saved under the
names of each of the funds in your universe.
208
PerTrac Publisher Reports
4.10 - PerTrac Publisher – Generate Combination Report
The Generate Combination Report option is the second of the two powerful
PerTrac Publisher custom reporting tools. This report output is similar to the
Generate Custom Report output; however this report contains more charts,
tables and statistics. The Generate Combination Report template contains all
of the data the Generate Custom Report contains, as well as charts and tables
from the three Benchmark Reports: Performance Measurement Report,
Style Analysis Report and the Peer Group Report.
The report is generated in Excel to give you maximum flexibility when
formatting your report. For example, you can add you logo to the
report, use color schemes that match your company color schemes,
change chart types, etc.
The report contains over 1,000 statistics and performance measures,
all of the single investment charts that PerTrac calculates, all of the
qualitative data from the investment information pages, and pre-built
performance and statistics tables. In addition this report includes the
charts and tables from the three Benchmark Reports: Performance
Measurement Report, Style Analysis Report and the Peer Group
Report.
The report template can be as simple as a one page report or a
comprehensive multi-page report.
There are only three Excel functions you need to know to build your
template: cut, copy\paste, & copy\paste special\paste link.
You have access to 15 pre-built templates that can be downloaded
from our website and populated with your fund data, or used as the
basis for a custom report.
NOTE: The custom report options are designed for a single investment
compared to one or two benchmarks only!
How do I Create a Combination Report?
1. Select a fund you want to use while building your
template by highlighting the investment in the PerTrac
Home window.
2. Click the Reports button located on the upper
menu bar and select PerTrac Publisher.
3. The PerTrac Publisher report
selection window will open. On the left
hand side you will see two gray
209
PerTrac User Manual v.19 1
buttons, Benchmark Reports and Custom Reports.
Click the Generate Combination Report button. There will be a report icon
labeled Generate Custom Report.
To run the report, double click your left mouse button on the Generate
Combination Reports icon. A gray setup window will appear.
This report contains the data from the three Benchmark Reports, so the report
generation setup window is a little more complex. There are 11 sections of inputs
that must be made prior to generating the Combination Report option. The
sections are numbered on the screenshot above.
1. Fund Selection: the first step is to select the fund to use as your sample fund
when creating the report. The Use Investment option should be selected on the
upper left. If you are generating the report for one fund, and you highlight that
fund on the home window prior to opening this setup window, the fund will be
automatically listed in the Use Investment window.
210
PerTrac Publisher Reports
TIP: If the fund you want to run the report on is not listed in the Use Investment
window, click Locate Universe to open the universe that contains the fund. If the
universe contains numerous funds, click the Expand button on the left to see an
expanded view of the universe. When you find the fund that you want in this list,
double-click on it and it will appear in the Use Investment window.
2. Benchmark Selection: One or two benchmarks may be selected for this
report. Click the Locate Benchmarks button in the second section to locate the
universe containing your benchmarks. This could be the “Correl.unv” universe or
any universe of benchmarks you have created. When the universe has been
selected, click the Down Arrow at the end of the Benchmark 1 window to select
the first benchmark. Then click the Down Arrow at the end of the Benchmark 2
window and select the second benchmark.
NOTE: The second benchmark can be a composite of two benchmarks. Click
both Down Arrows at the end of each benchmark’s selection windows to select
the two benchmarks, and then click the Down Arrows in the windows to the left
of the benchmark names to select the allocations to each benchmark.
3. Benchmark Universe: Click on this tab to select the benchmarks explained in
Section 2 (Benchmark Selection).
4. Peer Universe: Click Locate Peer Group to select the peer universe to
which your fund will be compared to for the peer analysis charts and tables. On
the left side of the window, click the down arrow to select the number of years for
the peer risk/return scatter plot chart. Use Investment Date Range is the default
setting.
5. Peer Benchmarks: Click this tab to select the benchmarks for the peer
analysis charts and tables.
211
PerTrac User Manual v.19 1
6. Style Universe: Click the Locate Universe button to select the universe of
benchmarks for style analysis.
TIP: Rather than using the Include Risk Free Rate option to represent cash, you
could add a cash investment (i.e. ML 3-Month T-Bills) to the style universe to
represent the cash component. You do want to enter a risk free return in the Risk
Free ROR, which will be used for the Sharpe Ratio, Sortino Ratio and Downside
Deviation statistics.
7. Style Benchmarks: There will be two comparative benchmarks on this report.
The Style Benchmark, which will be created as a result of the style analysis
regression, and a Market Benchmark. To select the Market Benchmark click
the Locate Benchmarks button in section three. This could be the “Correl.unv”
universe or any universe of benchmarks you have created. When the universe
has been selected, click the Down Arrow at the end of the Market Benchmark
window to select the benchmark.
212
PerTrac Publisher Reports
8. Template Selection: Click
Locate Template. The custom
reports folder will appear with a list
of template files. There are two
files for this report. The
MasterPublisherLibrary,
designed for funds with monthly
return streams, and the
MasterPublisherLibraryQuarterly
designed for funds with monthly or
quarterly return streams. There
are three output options in section
8 when generating the reports.
Print, which will send the report directly to the printer; Save Reports in Folder,
which will save the file in a folder of your choosing; Leave Template Open
(Single Investments Only) which will open the report in Excel.
TIP: At this point, no custom report has been created. Select the Leave Template
Open (Single Investments Only) option, which will open the report in Excel when
generated. That is where you will start building your report.
9. Date Range Selection: Set your report Starting and Ending date range.
Since Inception to End of Data are the default settings. When the Specific
Dates option is selected you can type a start and end date in the Starting and
Ending date boxes. Under the date range option you can elect to Use Common
Start and End Dates (the common start and end dates for the fund(s) and
benchmark(s), to run the report Quarterly, Hide Worksheets (which is an option
to use only after the template has been built), and Remove Textboxes.
213
PerTrac User Manual v.19 1
NOTE: Textboxes are PerTrac’s way of exceeding Excel’s 256 characters per
cell limitation. If you enter large amounts or text in the Investment Information
fields, creating text boxes when the data is exported will allow you to include that
data on your template by cutting the textbox and pasting it to your template. If
you do not need textboxes for your qualitative data, choosing the Remove
Textboxes option will speed up your report generation.
10. Select Information Pages, Set Charting
Options, Style Map Setup: These three
tabs will determine the amount of qualitative
data that PerTrac exports, the statistics for
certain charts, and style mapping for style
analysis charts.
Select Information Pages – Click Select
Information Pages to select the investment information you wish to export when
the report is generated. Click on each of the System and User
information/categories that you want to export.
Set Charting Options – When
creating your custom report you will
have access to all of the PerTrac
single investment charts. They will
be located on the Library sheet in
the MasterChartLibrary.xls
template. The selections you make
on the Set Charting Options tab will
determine whether some of those
charts get populated, and with what
data.
Rolling Statistics -There
are 5 rolling statistics
charts. Click the down
arrow to select your statistic, and then enter the rolling period.
Rolling Correlations -There are 5 rolling correlation charts. Click the
down arrow to select your correlation statistic, and then enter the
rolling period.
The Risk-Free Benchmark - Option will allow you to select a
benchmark to represent the risk-free rate when calculating the Sharpe
Ratio. This in lieu of entering an annualized risk-free rate.
Volatility Bands - Enter the moving average.
Distribution of Returns – For the Distribution of Returns chart you
can set the Increments and Range.
214
PerTrac Publisher Reports
Risk-Return Scatter Plot Universe – There is universe risk-return
scatter plot chart on the report’s Library tab. Use this option to select
the universe you want to plot and the number of years to plot.
NOTE: There is a Use box for each of the options. The data for that option will
not be exported if the box is left unchecked.
Style Map Setup – Use this tab to
setup the Style Map-Dominant and
Style Map-Traditional style analysis
charts. Use the down arrows at the end
of each option to select the appropriate
benchmark. The
MasterPublisherLibrary.xls files also
contain Style Map-Dominant and Style
Map-Traditional charts designed for a
universe of funds. There is an option
on the lower left of the setup window to elect to Use Multiple Style Universe. If
this option is checked, Locate next to that window to select the universe of funds
to be plotted on the chart.
NOTE: The chart is designed to plot five funds only. If your universe contains
more than five investments, only the first five will be plotted on the chart.
11. Click Generate Reports. This will open the report in Excel. The report will be
a read only file. You should save the file under a new name prior to building your
template. For example you could name the file “Our Company Custom Report
Template”.
TIP: There are no limits on the number of templates you can create.
4.11 - How do I Build a Custom Report Template?
When the steps above are completed you will have an Excel spreadsheet.
MasterPublisherLibrary.xls – READ ONLY. This Excel file contains numerous
sheets of data. The only difference between the MasterPublisherLibrary.xls
and the MasterChartLibrary.xls are the number of sheets in the workbook. The
Combination Report includes the performance, peer group and style analysis
report data.
215
PerTrac User Manual v.19 1
TIP: Prior to getting started click on the Instructions sheet to read the template
building instructions or view our online tutorials. PerTrac Publisher Tutorials
Step 1 – Build the template. The Template sheet shown on the screenshot
above, is your blank canvas. This is the starting point. Treat this like a blank
sheet of paper. If you are going to create a multiple page report, either insert
additional worksheets or build your report vertically down the Template page.
Determine whether the report will be Landscape or Portrait. From there start
tagging where your qualitative data, statistics, charts and tables will be
located. Once you have determined where the data will go, must get the data
from the other sheets in the workbook. As mentioned above there are only
three basic Excel functions to be used when moving data to your template:
Cut\Paste, Copy\Paste, Copy\Paste Special\Paste Link.
Library: This tab contains all of the charts that PerTrac exported,
including the Peer Group and Style Analysis Report charts. Find the
chart or charts you wish to include on the template and cut and paste
them where you would like them to appear.
NOTE: The charts MUST be cut, not copied. If you copy and paste a chart, the
macros will not update when the report is generated in the future.
Statistics: This tab contains over 1,000 statistics and performance
measures. If you want to include statistics from this page Copy the cell,
or range of cells, and go back to the Template sheet. Click into the
216
PerTrac Publisher Reports
cell(s) where the data will be located, then click the Edit button on the
menu bar, click Paste Special, then click the Paste Link.
Information, Information 2 & Categories: These sheets contain the
qualitative data from the Investment Information pages in PerTrac.
To include information from these pages you should Copy, Paste
Special & Paste Link as above.
NOTE: The Information 2 sheet contains the data being exported from the
System and User Information pages. If you export fields with a lot a text, and
you leave the Remove Textboxes option on the setup window unchecked, the
data will be exported to individual cell textboxes. To add a text box to your
template, Cut it from the Information 2 sheet and paste it on your template.
Perf-Stats Table: the Perf-Stats Tables sheet contains a variety
performance and risk statistics tables. To add the tables to you
template, Copy the table(s) from the Tables sheet and Paste it on to
your template.
TIP: User Data and Leverage Data are available if you enter that
information on the appropriate section of the Investment Data
window in PerTrac. Further explanation is available in the
Instructions sheet in your template workbook.
Peer Report Tables: This sheet contains the data tables for the Peer
Group charts on the Library sheet. To add these tables to your report,
Copy the table, and Paste it on to your template.
Style Report Tables: This sheet contains the data tables for the Style
Analysis charts on the Library sheet. To add these tables to your
report, Copy the table, and Paste it on to your template.
Step 2: Format your report. Now that your template has the data, use Excel’s
formatting capabilities to format the report. Add your company logo, change the
colors to reflect your company color schemes, add headers, add disclaimers and
then Save the template.
Step 3: Generate the report. Follow the instructions listed above to generate
your report, substituting your new template for the MasterChartLibrary.xls
template.
217
PerTrac User Manual v.19 1
4.12 - How do I Generate My Custom Template on a
Universe of Funds?
The process for generating your custom template on a universe of funds is the
same as the process listed above for a single fund with the following exceptions:
1. In section 1 of the setup window select the Use Universe option.
2. Click the Locate Universe to select the universe of funds on which the reports
will generated.
3. If the universe contains funds with different strategies or asset classes, and
you have assigned specific benchmarks to the funds in the universe, check the
Use Assigned Benchmarks option. This will insure your funds are compared to
the appropriate benchmarks when the reports are generated. If you have not
assigned benchmarks the two benchmarks shown in the select benchmark
windows will apply to all funds in the universe. Please refer to section 2.13 for
instructions on assigning benchmarks.
4. When generating the report on a universe of funds there are two options for
outputting the reports: Print, which will send the reports to the printer; and Save
Reports in Folder, which will save the reports in a designated folder.
5. If you would like to overwrite existing reports, select Overwrite Existing Files.
218
PerTrac Publisher Reports
6. When you generate the report you can elect to Export Peer Statistics which
will create a table listing the funds in the peer group universe and their values for
each performance measure and statistic in the Peer Group Report. To access
this data when the report is generated, click Format\Sheet\Unhide, on the Excel
menu bar. Then select Peer Group Data to unhide this sheet.
7. If the universe contains funds with different strategies or asset classes and you
have included the Peer Group charts in your template, and have assigned
specific Peer Group Universes to your funds, check the Use Assigned
Benchmarks option. This will insure your funds are ranked in the appropriate
Peer Groups when the reports are generated.
TIP – If you elect to save the reports in a folder, click Locate Folder to locate the
folder where the reports will be saved. The reports will be saved under the
names of each of the funds in your universe.
4.13 - How do I Generate the Pre-Contructed Publisher
Report Templates?
The sections above walk you through the process of
creating your own custom templates with the Generate
Custom and Generate Combination Reports options.
You also have access to 15 pre-constructed one-page
templates that can be downloaded from the PerTrac
support site. To view the templates within PerTrac, click the
Help tab on the menu bar. Then select Download
Updates. This will take you directly to the PerTrac main
support page.
When the support site opens, click the PerTrac Publisher
Templates link on the upper left navigation bar. A form will
appear prompting you to enter your name, e-mail address
and license number.
219
PerTrac User Manual v.19 1
TIP: If you don’t know your license number, click the Help tab in PerTrac and
select About PerTrac. There will be an alpha-numeric license number located on
the left side of the window.
When all information has been entered, click Submit Form. The following
window will appear.
TIP – There are 5 rows of reports with 3 reports in each row. To the left of each
row you will find a brief description of the data contained in the reports in that
row. To view a full-sized screenshot of a report, click on the report thumbnail.
Step 1: Downloading the
Reports. Under each of the
thumbnails you will see two links.
You should select Custom Report,
if you wish to generate the report
with the PerTrac Publisher
Generate Custom Reports option.
If you wish to use PerTrac
Publisher Generate Combination
Reports to generate the template,
select Combination Report.
NOTE: The template files are quite large and have been compressed with
WinZip.
Click on the Custom Report link. A file download window will appear. The file
name is listed in this window. Click Save to download this file to your desktop.
After the file is downloaded, locate the file and double click on it to launch
220
PerTrac Publisher Reports
WinZip. Extract the file to the PerTrac\Custom Reports folder, or some other
folder that you have created for your report templates.
TIP: If you are using Windows XP, click the Open button when the file download
window appears to view the Excel file. Then use the Extract or Copy options to
move the file to the PerTrac\Custom Reports folder.
Step 2: Generating the Reports. Refer to the section on Generate
Custom Reports above for instructions on generating these pre-constructed
reports. When you get to section three of the instructions, click Locate
Template, and rather than selecting the MasterChartLibrary.xls file, select the
template you downloaded from the website. Use this same process if you are
generate the report with the Generate Combination Report option.
Step 3: Formatting & Saving the Report. Now that your template has
the data, use Excel’s formatting capabilities to format the report. Add your
company logo, change the colors to reflect your company color schemes, add
headers, add disclaimers and then Save the template.
PerTrac Publisher Tips & Tricks:
PerTrac Publisher Custom & Combination Reports: Select Information
Pages, Set Charting Options and Style Map Setup options.
PerTrac Publisher, has two custom report options, “Generate Custom Reports”
and “Generate Combination Reports”. These two reports are Excel workbooks
that contain a large amount of PerTrac data on numerous worksheets within the
workbook. There is a Library tab in both workbooks which contains all of the
single investment charts available in PerTrac. Whether or not some of these
charts get populated, and with what data, depends on the choices made prior to
running the report. Both reports also contain an Information and Information2
worksheet that contains the investment qualitative data exported from PerTrac.
The qualitative information available for your template will also be determined by
selections you make prior to running the report. In addition to the single
investment charts and investment qualitative information, the “Generate
Combination Report” also contains style analysis charts that also require a setup
prior to running the report.
221
PerTrac User Manual v.19 1
When you double click the publisher report icon to run either the “Generate
Custom Report” or the “Generate Combination Report” a gray input window
appears where the user selects the fund(s) and benchmarks for the report. This
sheet also contains two options for the Custom Report, three for the Combination
Report, that are often overlooked prior to running the report. The Custom Report
input sheet contains two buttons at the lower right, Select Information Pages and
Set Charting Options. The Combination Report input sheet contains those two
options and a third button labeled Style Map Setup. We frequently receive calls
indicating that the client’s report contains no qualitative data or that some of the
charts are blank.
TIP: Prior to running the reports click on each of these options to select the data
you wish to have exported. The Select Investment Pages button will allow you to
select the System and User qualitative information to be exported. The Set
Charting Options tab contains a number of selections for charts on the Library
tab which include, rolling statistics, rolling correlations, the selection of a RiskFree benchmark for the Sharpe calculation found on the template Statistics tab,
Volatility Bands, Distribution of Return’s chart increments and range, and
universe selection for the universe risk/return scattergram chart. The
Combination Report input sheet contains a third button “Style Map Setup”. This
option will allow you to setup up the benchmarks for the “Style Map – Traditional”
and “Style Map – Dominant” style analysis charts.
222
PerTrac Reports (Universe Reports)
4.14 - PerTrac Reports - View the online tutorial!
PerTrac Reports is a powerful universe (multi-fund) level report generator. You
can create an unlimited variety of custom reports by selecting qualitative
information or performance and statistical data. You have access to all of the
qualitative investment information fields the data vendors supply, as well as
every performance measure and statistic that PerTrac calculates. You can
generate reports on up to every investment in your database at one time. With
PerTrac Reports, you can also create templates that generate identical reports
on a periodic basis for continuing analysis and presentation. The following steps
will walk you through creating a report template and generating the report.
Step 1: Open PerTrac Reports - In the PerTrac
Home window click the Reports tab located on the
upper menu bar. Then select PerTrac Reports.
PerTrac Reports will open as a separate program from
PerTrac.
NOTE: When you launch PerTrac Reports for the first time you will be prompted,
as you were with PerTrac, to select an active database.
TIP – This is a universe-level report generator. As such, the database in which
the universe was created must be opened. If you have a database open in
PerTrac Reports, and attempt to generate a report on a universe of investments
not in that database, PerTrac Reports will indicate that you have made an error.
To open the correct database, click on File and select Open New Database.
When PerTrac Reports is first opened, the Main Window appears.
223
PerTrac User Manual v.19 1
Preliminary Settings
Selecting a Database
Selecting Open New Database from the File menu opens the Select Active
Database Window, where you can find the database you wish to use. Selecting
Default Database from the Preferences menu also opens the Select Active
Database Window and allows you to choose which database opens
automatically when PerTrac Reports starts.
Selecting a Universe
Selecting Change Universe from the Universe menu opens the Select New
Universe Window. You can also select a default universe by selecting Default
Universe from the Preferences menu.
Default Data Source
Each data source uses its own set of field labels. When using PerTrac Reports,
you can select which set of field labels you wish to use by selecting Default Data
Source from the Preferences menu.
Risk Free Return & Minimal Acceptable Return
Certain statistics make use of variables that you can re-define to best suit your
needs. Selecting Default Risk Free and Minimal Acceptable Return from the
Preferences menu opens the Default Returns Window. For the downside
deviation and Sortino ratio calculations, enter an annualized Minimal Acceptable
Return. Enter an annualized risk free rate for Sharpe ratio calculations.
224
PerTrac Reports (Universe Reports)
Step 2: Creating the
Template - PerTrac
Reports uses templates to
generate reports. You
select the qualitative or
quantitative criteria for the
report template column by
column. The selection
process begins in column B
in the empty cell to the right
of the label Column Heading (1). Double left click in this empty cell.
The Column Selection window will appear.
There are 7 main tabs across the top. Each main tab contains numerous subtabs. The Investment Information & System and User Pages contain the
qualitative investment information, which, as you know, changes depending
on the data source. You can change the source by clicking the down arrow in
the lower left corner of the Column Selection window. The Statistics-Recent
Returns, Annualized Returns, Time Windows, Correlations and Data-Rolling
Statistics tabs contain the performance measures and statistics that PerTrac
calculates.
225
PerTrac User Manual v.19 1
In column B select the Investment Master
Name as your first field. This will display
the names of the funds in your universe in
the first column when the report is
generated. After you select that option,
you will return to the template window with
the Investment Master Name label now
shown in column B.
Double click in column C to open the Column Selection window again to
select your next field. Every time you select a field label it will be displayed in
the template column and your curser will move to the next column.
226
PerTrac Reports (Universe Reports)
NOTE: The maximum number of columns per sheet in the template is 256.
TIP: Working within the template is similar to working with Excel. You can add
more sheets to the template to select additional report statistics. Click Edit on
the menu bar and select Insert Sheet. In column B of the new sheet select the
Investment Master Name as you did on sheet one, and then proceed to
column C to add additional statistics to the report.
The labels to the left of Column B will not appear in the report, nor will the
information contained in the Report Type or Column Separator rows. These
headings serve the following purposes:
Report Type – Shows whether the report will be Columnar or Peer
Group Analysis.
Column Separator – Allows you to format the borders that separate
the column headings from the column data or information. To change
the border, select Border from the Format menu.
Report Title – You can use this space to give your report a name.
Start and End Dates – This cell will display the date range you select
in the From and To boxes at the top right of your screen.
Column Heading – These three rows are reserved for the names of
the information fields or statistics that you choose to include in your
report. Some headings do not use the entire allotted space.
Data Font and Format – Displays the formatting style of the data to be
placed in that column.
Sort Key Number – You can use this row to enter sorting instructions
that will take effect when you run your report.
Report Type
You must choose between a Columnar Report or a Peer Group Analysis Report.
Both reports display statistics and information in a table format. The Peer Group
Analysis Report also provides percentile rankings and other statistics that provide
a comparison to investments in another universe. Also, the Peer Group Analysis
Report creates a chart that plots the peer group values within a percentile bar
chart.
Once the report type has been selected from the pull down menu, the name of
the selected report will appear next to the Report Type label.
Specifying Date Range
You may then enter a date range for the analysis in the From and To boxes at
the top right of your screen. Initially, these boxes will contain the words Start
227
PerTrac User Manual v.19 1
Date and End Date. Erasing these words and leaving the boxes blank will cause
the date ranges to default to “Inception” and “End of Data”, meaning that each
investment’s full history will be analyzed. To use a specific range of dates,
however, enter the dates in month/year format in the appropriate box. When
creating a template for a Peer Group Analysis Report, a specific date range is
required.
NOTE: If you have multiple sheets in your template, each sheet can have the
same date range or different date range.
Data Series Reports
Certain fields in the Column Selection Window represent a series of data that
consist of more than one value and therefore require more than one column in
which to be displayed. For this reason, all data series must have their own
worksheet within a report template. Once you have added a worksheet, as
explained above, use Column B to display the investment name and Column C to
display the data series (the series will extend to the right as needed).
Sorting Data within a Report
Each column in PerTrac Reports contains a Sort Key Number, which allows you
to assign a sorting level to the field. Entering “1” for a column’s Sort Key Number
designates that column as the primary sort column. “2” designates a secondary
sort column. “3” designates a tertiary sort column, etc. Keep in mind that Sort
Key Numbers are not required to run a report. Also, if you place negative sign (-)
in front of the Sort Key Number, the sort will be performed in ascending order.
Otherwise, the sort will be performed in descending order.
When your template is complete, select Save Template As from the File menu.
When the Save as Window opens, select a name for your new template,
ensuring it ends with a “.tpl” extension.
Step 3: Running the Report - Now that you have a template, you can
create single use or consistent periodic reports using various universes or
various databases.
228
PerTrac Reports (Universe Reports)
1) If you need to change
databases, select Open New
Database from the File menu
and select the appropriate
database.
2) Click Universe on the upper
right of the menu bar. The
Universe Selection window will
open. To select your universe
click Open Universe. If you want
the report to run on the entire
database, click Load Master
Database. Once you have
selected the universe, you can use the Move Up and Move Down buttons to reorder your universe. If you do choose to change the order of the investments,
click Save Universe to save the new order. Click OK to exit this window.
3) Click Generate Report. Select Standard if you
want to keep the report in PerTrac Reports
format. Select Excel if you want to generate the
report in Excel format, which is the more common
selection. When you click Generate Report to
Excel, a window will appear prompting you to select the universe for which the
report will be generated. The default universe in this window is the “All.unv”. That
universe is your entire database. If you want to generate the report on your entire
database click Yes, if not click No. Typically, you will be running the report on a
smaller universe than the entire database. When you click No the Universe
Selection window will open so you may select a different universe. Select your
universe by clicking Open Universe, and then click OK.
TIP: When you select the universe, prior to clicking OK, you can sort the
investments in the universe if you wish to send the data to Excel in a certain
order.
4) When you have selected your universe click Generate Report . Select Excel
to export the report to Excel. The Generate Report window will reappear with the
name of the universe you just selected. Click Yes and an Excel Export Setup
window will appear. Select Empty Excel Workbook, Leave Excel Open and
Format Output. Click Generate Report.
5) When you click Generate Report an Excel workbook will open that contains
the report output. Use Excel functions to format, save or print the report.
229
PerTrac User Manual v.19 1
NOTE: All reports created in PerTrac Reports (not exported to Excel) contain
standard formatting, editing, and printing options. Selecting Save Report As from
the File menu allows you to save the report for future use. You can edit a report
with the Workbook Designer by clicking the Designer button at the top right of
your screen (See “Using the PerTrac Workbook Designer” for more information).
Multiple Benchmark Reports
PerTrac Reports features a Multiple Benchmark option, which allows you to
simultaneously create a report for an investment universe and each item in a
selected benchmark universe.
1. Create a template in PerTrac Reports.
2. Select either Multiple Benchmarks – Standard, or Multiple Benchmarks
– Excel from the Generate Report menu.
3. You will be asked to verify that the current universe.
4. When the Select Benchmark Universe window opens, click Select
Universe, locate an existing benchmark universe, and click Open.
5. When the Select Benchmark Universe window displays the items in the
benchmark universe, click OK. In the future, unless you want to switch
benchmark universes, step 4 may be skipped.
6. In addition to the original report, an identical report will be created for
each benchmark, using the same date range per row as in the original
report.
230
Style Analysis (Single Fund)
5.01 - Selecting Your Default Style Universe
The style analysis model is a performance (returns) based multiple-regression.
The single investment represents the dependent variable and a universe of
appropriate benchmarks represent the independent variables.
Prior to entering the style analysis module, you must select two default settings:
A default style universe and a default market benchmark for comparative
analysis.
To select a default style universe, you must first create a style universe or
universes. The goal is to select benchmarks that will best explain the style of the
investment being analyzed. For instance if you perform style analysis on a U.S.
equity manager, you might want to create a style universe of Russell, Wilshire or
Barra indices that would include small, mid and large cap value; and small, mid
and large cap growth. It is also a good idea to add a cash benchmark to your
style universe such as the Merrill Lynch 3-month T-bill. If you perform style
analysis on hedge funds, you should select an appropriate universe of hedge
fund benchmarks such as the CSFB Tremont or HFRI indices. Again, the goal is
to create a style universe that best explains the style of the investment being
analyzed.
1. Once you have created a Style Universe, click the Preferences tab on
the menu bar, click Style Analysis Options, and select Default Style
Universe.
2. When the Select Default Style Universe Window opens, locate the
desired universe and click Open.
5.02 - Selecting Your Default Market Benchmark
1. Add the Market Benchmark you wish to use to your correlations
universe (correl.unv).
2. Click the Preferences tab, select Style Analysis Options, and select
Default Market Benchmark.
3. When the Select Market Benchmark Window opens, select the
desired benchmark
from the dropdown
menu and click OK.
231
PerTrac User Manual v.19 1
NOTE – Although you are required to set a default benchmark, you may change
that benchmark at any time once you have entered the style analysis module.
5.03 - Performing Single Investment Style Analysis - View
the online tutorial!
To launch the style module, click the Style and Benchmark Analysis tab
located on the lower left of the home window.
TIP: You may receive the following error message when the Style Analysis
Setup window opens: “Error Reading Style Map Setup File – Please set up the
style map benchmarks.
Click OK. Each Style Universe must have a corresponding Style Map Setup file
that PerTrac uses when creating Style Map Dominant and Style Map Traditional
charts. This file is created from the Style Analysis Setup Window. Please refer
to section 5.05 below.
Starting in the upper left of the screenshot above, you will find the name of the
selected investment, the name of the selected market benchmark, the
benchmarks in your style universe.
232
Style Analysis (Single Fund)
To the right of the investment and benchmark names you will see the start and
end dates for the investment and benchmarks.
Moving to the upper right you will see the start and end dates for the style
analysis. Because we will be performing a multiple regression, the date range will
have to be the common date range for the investment and the benchmarks.
You can run style analysis on a monthly, quarterly or annual basis. You can also
enter the number of rolling periods to create the rolling style charts.
You may elect to include a risk free rate to represent a cash component. The
alternative to using a risk free rate would be to include an index representing a
cash investment.
There are a number of buttons down the right hand side of the window:
1. Select style universe: Allows you to change the style
universe.
2. Select Investment: Allows you to select a different
investment for style analysis.
3. Style map setup: Pertains to the style map dominant
charts and must be setup prior to creating those charts
4. Advanced setup: Allows you to apply upper and lower
bounds to style indexes and define constraints for the
sum of the style allocations.
5. Build a style database: Allows you to perform style
analysis on multiple funds at one time. This function will
be covered in the second style analysis tutorial,
performing style analysis on multiple funds.
6. Style Search: A powerful PerTrac search engine that allows you to
search for investments by style. Once the style database has been built,
you can search the style database on a number of statistics and style
criteria
7. Compute style: Computes the style output for a single fund.
8. Rolling style: Computes the style characteristics over multiple rolling
periods. The number of rolling periods will be entered in the Rolling Period
box.
9. Cancel/Exit.
233
PerTrac User Manual v.19 1
5.04 - Style Map Setup
Each style universe must have a corresponding Style Map Setup file that PerTrac
uses when creating style map charts. While it is necessary to go through this
procedure only once per style universe, changing the name of, or removing
investments from your style universe will make it necessary to recreate the Style
Map Setup file.
Click the Style Map Setup
button from the Style
Analysis Setup Window.
1. When the Style Map
Setup Form opens,
select either a 2x2 or a
3x3 map style.
2. Each dropdown
menu contains a list of
the indexes in your style
universe. Depending on your map dimensions, select two to three value
indexes for the x-axis and two to three growth indexes for the y-axis.
3. Click Save.
4. When the Save Window opens, keep the default file name and click
Save. PerTrac will store these settings in your Universe folder with an “.smf”
extension. With the exception of the extension, the file name must be
identical to that of your style universe so it can be recognized by PerTrac.
5.05 - Style Analysis Advanced Setup
The Advanced Setup allows you to apply upper and lower bounds to your
indexes, as well as define constraints for the sum of the style allocations.
1. Click Advanced Setup from the Style Analysis Setup Window.
2.
When the Advanced Style
Analysis Setup Window opens,
adjust the upper and lower
bounds for each index as
needed. You can assign a value
to all the indexes at once by
entering a percentage in either the
Set Minimum or Set Maximum
boxes.
3. In the lower left corner of the window, set the sum of the style allocations
to be greater than, less than, or equal to a given number.
234
Style Analysis (Single Fund)
4. Click OK.
5. Back in the Style Analysis Setup Window, ensure that the Use
Advanced Settings checkbox is checked prior to clicking Compute Style.
5.06 - Compute Single Investment Style Analysis
Now that the setup is complete, click Compute Style to produce the style
analysis output. The goal of style analysis is to determine the style bias and style
drift of the selected fund. Let’s examine the output.
1. Remember
that this
method of style
analysis is not
designed to
find a style that
makes a fund
look good or bad. The goal is to infer as much as possible about the
exposures to variations in the returns of the asset classes during the time
period being analyzed. The allocation table shows how the fund is allocated
to the benchmarks in the style universe. We can see that over the date range
computed, the fund shows a small allocation to cash, small allocation to small
and large growth, and the majority of the allocation to mid-cap value and large
cap value.
2. The window on the lower left contains a pie
chart and correlation statistics of the investment
to the style benchmark. The style benchmark is
the composite benchmark comprised of the
allocations listed in the allocation window. It is
important to NOTE that the style identified in such
an analysis is, in a sense, an average of
potentially changing styles over the period
covered. Month to month deviations of the fund’s
return from that of style itself can arise from
selection of specific securities within one or more asset classes, rotation
among asset classes, or both security selection and asset class rotation. The
term SELECTION in the pie chart is used to cover all such sources of tracking
differences.
3. The charts to the right of the pie chart show the
cumulative return for the selected investment, the
style or blended benchmark and the market index,
and a differential performance chart between the
investment and the style and market benchmarks.
235
PerTrac User Manual v.19 1
4. To view additional style analysis charts click the charts tab located on the
menu bar. The charts can be seen below.
a. The style attribution chart contains the style and selection
relative to the style and market benchmarks.
b. The correlation statistics chart contains the annualized return,
annualized Alpha, Beta, correlation, r-squared, tracking error, Treynor
ratio, Jensen alpha, active premium, and information ratio relative to
the style and market benchmarks.
c. The capture ratio chart contains the up and down capture ratios
relative to the style and market benchmarks: the percent up months in
up markets; percent of down months in down markets relative to the
style and market benchmarks; the percent of the time the style and
market benchmarks were outperformed in up markets, down markets
and all markets; and the profitable months ratio.
d. The next two charts show the style allocation as a bar or pie
chart.
e. The style history chart shows the style drift over a number of
rolling periods. You may change the number of rolling periods in
the rolling periods box. For instance, if you want to view shorterterm style movement, enter 6-12 months. For longer rolling periods
where there will be a smoothing out effect select 36-60.
f. The style map dominant chart plots a single point that represents
the dominant style for each rolling period. The style dominant chart
markers are blue plus signs of different sizes. The smaller plus
signs represent the earlier rolling periods of the analysis and the
larger plus signs represent the more current rolling periods.
g. The style map multiple dominant will produce the dominant
style chart for multiple funds. This chart is useful if you are
comparing managers with the same stated style category. The last
chart is a style vs. growth matrix.
236
Style Analysis (Multiple Funds)
5.07 - Multiple Investment Style Analysis - View the
online tutorial!
This section will walk you through performing style analysis on multiple funds at
one time. We will also walk through performing style searches, once a style
database has been built. When building a style database you can regress
hundreds or thousands of funds against the style universe at one time. This is
useful if you wish to use the style module as a search engine or if you wish to
create style specific peer groups to be used when performing peer group
analysis.
5.08 - Building a Style Database - View the online
tutorial!
To perform a Style Search, you must first build a Style Database, which
calculates all the necessary statistics for each record in your original database.
1. From the Style Analysis
Setup Window, click Build Style
Database.
2. When the Build Style
Database Setup Window opens,
enter a date range using the Start
Date and End Date boxes.
3. If applicable, determine how to
handle a record that has a date
range less than the fixed date
range.
4. Determine how to handle a
record that has a date range
greater than the common date
range of the Style Universe.
5. Decide whether to include investments with unreliable style analysis
regressions.
6. Click Build.
7. When the Save Window opens, enter a name for your Style Database
and click Save.
8. When the build is complete, you can view the error log by clicking Log
from the tool bar in the Master Window.
237
PerTrac User Manual v.19 1
5.09 - Style Search - View the online tutorial!
Once the Style Database has been built, you are ready to perform a Style
Search.
Style Search Window
1. From the Style Analysis Setup Window, click Style Search.
2. When the Style Search Setup Form opens, click Select Database and
open a Style Database. The number of records in the database will be
displayed in the Investments in Database box located at the bottom of the
Style Search Setup Form.
3. Checking the Use Greater/Less Than Search checkbox activates the Style
Universe table in the upper left corner of the Style Search Setup Form. This
table contains a list of each index in the Style Universe. After entering the
desired percentages in the Greater Than and Less Than columns, find the
dropdown menu to the right of the Use Greater/Less Than Search
checkbox. Select AND to search for investments that meet all of the criteria
in the Greater Than and Less Than columns; select OR to search for
investments that meet at least one criterion in the Greater Than and Less
Than columns.
4. Checking Use Additive Search activates the “+ or -” column in the Style
Universe table. Placing a “+” or a “-” in this column will add or subtract the
allocations to the benchmarks you have entered “+” or “-“. The total value
will be entered in the Sum of Allocations box located to the right of the Use
Additive Search checkbox. The dropdown menu between the Use Additive
Search and Sum of Allocations allows you to select “>”, “<”, “=”, or a
combination of these symbols, to complete the additive search argument.
5. Checking any one of the Statistics Search checkboxes will activate the
corresponding row of controls. From here, you can select the desired statistic
and comparative symbol, and then enter a value with which to compare each
investment.
6. To search by start date or end date, check either the Start Date or End Date
checkboxes (or both), select the desired comparative symbol, and enter a
date with which to compare each investment.
7. Once all desired criteria have been entered, you may save the settings by
clicking Save Search and entering a name for the saved search. The saved
238
Style Analysis (Multiple Funds)
search criteria will be stored in the Style Database and can be loaded in the
future by clicking Load Search. A search can also be deleted by clicking
Delete Search.
8. To perform the Style Search, click Execute Search.
Style Search Results
When the search is complete, the Status box at the bottom left of the Style
Search Setup Form will change from “Searching” to “Search Complete” and the
Progress box will read “100%”. To the right of the Investments in Database
box, the Investments in Search Result box will display the number of
investments that meet your criteria. A scrollable list of the search results is
displayed in the upper right corner and can be saved immediately as a universe
by clicking Save As Universe.
Viewing the Style Database
All the statistics in your Style Database can be viewed in a spreadsheet by
clicking View Database from the Style Search Setup Form. When the View
Style Database window opens, select Open Style Database from the File menu
and open the desired
database.
Once the data has
loaded, you can rank the
investments by
highlighting the column
of statistics by which
you wish to rank and
selecting either Sort
Ascending or Sort
Descending from the
Sort menu. To work
with the data of a
particular universe,
select Display Universe Only from the Universe menu and open the desired
universe.
At any time, you can open the Workbook Designer, which will transfer all the
current data to a worksheet that can be formatted and edited. This is done by
either double-right-clicking over the worksheet or by selecting Open Workbook
Designer from the File Menu.
239
Peer Group Analysis
6.01 - Building a Peer Group Database
1.
Once you have created the peer universe, click Peer Group Analysis
(located on the bottom of
the Home window).
2. When the Build Peer
Group Database
Window opens, click
Select Peer Universe to
select a Peer Universe
and then click Open.
3. Click Select Market
Universe and select a
universe of benchmarks
that you wish to use in
the peer group analysis.
4. Enter a date range by
filling in the End Date
and Number of Years Back boxes.
5. Select whether to use Monthly or Quarterly periods.
6. Decide whether to compute year-to-date and annual performance data for
investments that do not have the full period data.
7. Click the Build Peer Group button.
8. When the Save Window opens, the Save in box defaults to the peer
folder and the Save as type box defaults to ".pdb", for “Peer Database”.
Keep these settings, and enter a name for your peer database. Click Save.
The Step box and Progress box at the bottom of the Build Peer Group
Database Window will allow you to monitor the progress of each of the 10
steps in the database building process. When the build is complete, the
Status box will read “Peer Database Build Complete”.
NOTE – The peer module output includes the ability to create floating quartile bar
charts on 145 statistics and performance measures, as well as rolling period
analysis. Building the peer database calculates and produces rankings on each
of these measures for every fund in the peer universe and the benchmarks in the
market universe.
240
Peer Group Analysis
TIP – Once a peer database has been built, you can open that peer database at
any time in the peer analysis window by clicking Open Existing Peer Group.
6.02 - Building a Multiple Peer Group Databases
Since each Peer Group Database is time specific, you must re-run them
whenever new data is made available. Also, if you wish to have PerTrac build
more than one peer database at a time, the Build Multiple Peer Groups
option should be used. The Build Multiple Peer Groups option can be found
in the lower left of the Build Peer Group Window and is a useful timesaving
function that allows PerTrac to calculate or recalculate multiple peer groups
simultaneously.
1. From the
Build Peer Group Database window select the Build Multiple Peer Groups
option in the lower left.
2. Select all of the universes (peer groups) for which you wish to build peer
databases and decide if you would like to overwrite any prior existing peer
databases.
3. Select a Market Universe.
4. Locate the Peer Folder that will contain the peer databases after they
have been calculated (PerTrac\Peer).
5. Select the end date and number of years back for the calculations.
6. Make a decision about computing YTD and annual performance for any
managers that do not have returns through the end date that you entered.
7. When you have finished all of the above steps, click Build Peer Groups.
PerTrac will then compute and build all of the peer groups and place them
into the Peer folder as ".pdb" files. To access any of these peer databases,
return to the Build Peer Group Database Window and select Open
Existing Peer Group.
241
PerTrac User Manual v.19 1
6.03 - View Peer Group Data - View the online tutorial!
Clicking View Peer Group Data opens the Peer Data Window, which allows
you to easily view tables from your Peer Group Database. This series of
spreadsheets contain the data underlying the peer group analysis charts.
The
dropdown menu at the top left of the window contains a list of each available
table. There are three options for each chart type:
1. Statistics/Data: These spreadsheets contain the actual values for the
selected statistic, for each of the investments in the universe.
2. Ranking/Statistics Ranking: These spreadsheets contain the ranking for
the selected statistic, for each of the investments in the universe.
3. Statistics Ranking/Statistics_Ranking_Stats: These spreadsheets
contain the rankings for the universe broken down by deciles for the selected
statistic.
TIP: Once the table is loaded, you can use the File, Print, and Edit menus
for basic saving, printing, and editing functions. For more advanced
capabilities, select Open Workbook Designer from the Workbook Designer
menu.
6.04 - IntelliStatTM Search - View the online tutorial!
The IntelliStatTM Search allows the user to create universes by
running a search on any peer database you have created. To
access the search window click IntelliStatTM Search (in the peer
242
Peer Group Analysis
analysis window). The search criteria selection window includes
53 performance measures and 9 risk measures. When your search
criteria have been selected, click the down arrow at the end of
each statistic to select the percentile requirement. For example,
you could search for all funds that fall within the top 25% of the
peer universe for the last 3 Year Annualized Return and 3 Year
Annualized Sharpe Ratio.
NOTE: If you select multiple criteria for the IntelliStat™ search, the funds
must meet all of the criteria to be included in the output. In the example
above, the funds must fall in the top 25% on the 3 Year Annualized Return
and 3 Year Annualized Sharpe Ratio, not 3 Year Annualized Return or 3 Year
Annualized Sharpe Ratio.
When your selections have been made, click Execute Search The results will be
displayed in the column on the right side of the window. The IntelliStat™ figure
that is displayed is the average ranking of each fund for each of the statistics on
which you searched.
IntelliStat™ Status Bar
The IntelliStat™ bar, from left to right, will provide the name of the peer group
being analyzed, the number of funds in that peer database, the number of funds
that met your search criteria, and the current date and time.
View Search Report
The View Search Report option creates a detailed report of each of the
funds that met your search criteria. This report displays the statistics for each
of the funds, as well as the fund’s ranking within the peer group for that
statistic. IntelliStat™ will then average the rankings and sort your funds in an
ascending order.
243
PerTrac User Manual v.19 1
IntelliStat™ Search Window Option Buttons
Save Universe As: This button will allow you to save your search results as a
new universe (.unv file) for futher analysis in PerTrac.
Clear Search: This option will clear all previously selected criteria from the
search window.
Save Search: Use this option to save your search criteria for further searches.
Load Search: Use this option to load your previously saved search criteria.
Cancel/Exit: This option will exit the IntelliStat™ window.
6.05 - Find Better Funds Search - View the online
tutorial!
The Find Better Funds
Search, similar to the
IntelliStat™ search, allows the
user to create new universes
by searching a peer database.
To access this search window
click Find Better Funds on the
peer analysis window. The
search criteria selection
window contains the same 53
performance measures and 9
risk measures as IntelliStat™.
However, when the search
criteria have been selected, the search will not find the funds that fall within a
certain percentile of the peer group, but rather those funds that outperform an
244
Peer Group Analysis
investment or benchmark in the peer database. For example, you could
search for all funds that outperformed a fund listed under Investments or a
benchmark listed under the Benchmarks label for the last 3 Year Annualized
Return and 3 Year Annualized Sharpe Ratio.
6.06 - Peer Group Charts and Reports - View the online
tutorial!
Once you have created and selected a Peer Group Database, you can proceed
to creating Peer Group Charts and Reports by clicking Peer Group Charts and
Reports.
Creating a Peer Group Chart
The top of the Create Peer Charts Window contains a list of investments in the
Peer Universe on the left and a list of the benchmarks in the Market Universe on
the right. Below these lists are controls for selecting chart type, format, and other
available settings.
1. From the scrollable lists at the top of the Create Peer Charts Window,
select investments and benchmarks for your chart by checking the box next to
the name.
2. Enter a date range in the
From and To boxes, or click the
Default Dates button to select
the widest possible date range.
3. Select a chart type from the
Select Chart Type box. If you
wish to sample the available
charts, select the All Charts
option.
4. For Period Return or Rolling
Return charts, choose either
Percentile Ranking or Return
vs. Universe from the Chart Format box.
5. For Custom Statistics charts, click Locate Template and select a
previously created Peer Group Statistics Template file (discussed later in this
section). The Custom Statistics chart also allows you to generate a report
that displays a table of data related to the specified chart. To activate this
feature, check the box labeled “Create a report when a chart is created”.
The default increment for the report is deciles. To change this to quartiles,
check the box labeled “Report Quartiles”.
245
PerTrac User Manual v.19 1
6. For risk-return charts, select the desired risk statistic and the number of
years from the dropdown menus in the Risk-Return Scatter box.
7. When all the options have been entered, click Create Chart.
Chart Options
Clicking Custom Chart Options from the Peer Charts Window opens the Set
Chart Defaults Window, where you can select default colors, styles, and sizes
for various objects in your charts.
1. The four large boxes along the left side of the window display the current
colors for each of the quartile bars used in Return vs. Universe charts.
Clicking on one of these boxes opens the Color Window, where you can
either choose from the existing colors or create
your own color by clicking the Define Custom
Colors button. Click OK once a color is selected.
2. To the right of the Bar Colors are the Marker
settings, where you can set the colors for 7
investment markers and 7 benchmark markers
using the same method described above.
3. The Marker Style dropdown menus allow you to
assign a particular style (3D-Ball, Square, Circle,
Diamond, or Triangle) to each marker. Selecting
Null will hide that particular marker.
4. The Size dropdown menus allow you to adjust the size of each marker,
with sizes ranging from 4 through 12.
5. The Floating Bar Width can be adjusted from 1 through 12.
6. The Floating Bar Style can be either Bar or Area.
7. The Plot Color box allows you to select a color for the background of the
chart in the same way that the other color settings were selected.
8. Once all the settings have been entered, click OK.
Creating a Custom Statistics Template
As mentioned earlier, the Custom Statistics chart type requires that you create a
Peer Group Statistics Template file. To open the Create Chart Template
Window, click Create Custom Template from the Create Peer Charts
Window.
The left side of the window contains a scrollable list of available statistics. The
right side of the window will display the statistics you select for the chart.
246
Peer Group Analysis
1. Add statistics to the Selected Statistics list either by double clicking on a
statistic in the Available Statistics list or by clicking on a statistic in the
Available Statistics list and clicking Add Field.
2. Remove any unwanted statistics, if necessary, either by double clicking on
a statistic in the Selected Statistics list or by clicking on a statistic in the
Selected Statistics list and clicking
Remove Field.
3. To adjust the order of a selected
statistic, click on the statistic you
wish to move in the Selected
Statistics list and click either Move
Up or the Move Down button until
the statistic is in the desired
location.
4. When all statistics have been
selected, click Save.
5. When the Save Window opens,
enter a name in the File name box
and click Save. The file will be
saved with a “.pst” extension.
6. To edit a template in the future, click Edit Existing Template, and open
the desired “.pst” file.
7. To put the Custom Statistics Template in use, set the chart type to either
Custom Statistics in the Create Peer Charts Window, then click Locate
Template and open the desired “.pst” file.
NOTE: There are 145 performance and risk measures from which to choose
when creating custom quartile bar charts.
247
Portfolio Simulation and Stress Testing
7.01 - Simulation Methodology
Simulation Procedure: The Monte Carlo module is designed to perform K
Monte Carlo replications. In each Monte Carlo replication the module generates a
return stream of length N periods for each asset in the portfolio (i.e., the time
series of returns). The Monte Carlo module then calculates fourteen portfolio
metrics.
Simulation Models
Bootstrap
The first approach is a bootstrapping procedure that treats the time series data
as a discrete sample space. This can be simply described in the following
manner: The simulation takes your portfolio’s historical return data series based
on your specified date range and creates N time series (N = Number of
Simulations) by randomly sampling the historical return data. For example, let’s
suppose your portfolio date range is from 1/99 to 6/04 using monthly data and
you want to simulate 3 years for your analysis using 1,000 for the Number of
Simulations. This example is using 66 historical time series periods (1/99 to
6/04). The simulation makes a random draw from these 66 dates to produce the
first month of the simulated results. To create one, three-year “simulation”, there
would be 36 such draws. In this example, this process would then be repeated
until 1000 three-year track records had been created.
The advantages of the bootstrapping approach are its simplicity and implicit
assumption about the distribution of returns. The disadvantage of this approach
is if your data has some skewed data points that you don’t necessarily believe
will likely occur again, the random draw could pick them and again skew the
result.
Normal
The normal method takes its random draws from a normal distribution fitted to
the actual return time series. This method is similar to the Bootstrap except it
redraws the sample based on a normal distribution. For example: If your
portfolio distribution is negatively skewed and peaked at the mean, this method
will smooth out the distribution of returns. This normal distribution essentially
limited the skewness and peaked distribution to a “normal” fit.
The advantage of the normal approach is allowing you to limit the impact of data
displaying significant skewness and/or kurtosis; however this could be viewed
as a disadvantage, since few investments display normal distributions over time.
248
Portfolio Simulation and Stress Testing
Mod Normal (Lognormal)
The mod normal method takes its random draws from a normal distribution
calculated from the logarithm of the actual return time series. This method forms
a flatter distribution with fatter tails, emphasizing positive skewness. For
example, if your portfolio distribution is positively skewed and peaked at the
mean, this method will smooth out the distribution but preserve the positive
skewness.
The advantage of the lognormal approach is allowing you to preserve the
positively skewed data. The disadvantage is incorrectly using this method for a
distribution that is either negatively or slightly skewed which would distort the
results.
GARCH (Generalized Autoregressive Conditionally
Heteroskedastic)
This is the most complex model available in the Monte Carlo module. It
hypothesizes that volatility is time varying and serially correlated. Returns are
uncorrelated from period to period. This pattern is stronger in daily returns and
diminishes for monthly or quarterly returns. Historical returns typically do not
exhibit any significant autocorrelation, but the squares of the returns often do.
This behavior is the motivation for stochastic volatility models. GARCH models
are a class of stochastic volatility models that exhibit the typical fat tails of return
distributions together with serial correlation in volatility.
7.02 - Portfolio Simulation and Stress Testing Setup View the online tutorial!
PerTrac contains a Value at Risk, Monte Carlo portfolio simulator that builds
probability distribution outcomes for several risk measures. To access the
simulation module click Portfolio Simulation and Stress Testing located at the
bottom of the PerTrac Home window.
Portfolio Simulation Setup
While setting up a portfolio simulation, you will use the settings along the right
side of the window, as well as the buttons at the bottom right of the window that
take you through the four basic steps.
1. Click Select Market Benchmark (“Step 1”). When the Select Market
Benchmark Window opens, select a benchmark from the dropdown menu,
which lists each benchmark in your Correlation Universe (Correl.unv).
249
PerTrac User Manual v.19 1
2. Click Select Portfolio (“Step 2”). When the Select Universe Window
opens, select the desired universe and click Open.
3. The Start Date and End Date boxes will now display the common date
range among the Market
Benchmark and each item
in the Portfolio Investments
table. Using these boxes,
you can enter either a new
Start Date (which must be
later than the initial Start
Date) or a new End Date
(which must be earlier than
the initial End Date).
4. Enter the desired Allocation for each item in the portfolio as either a
decimal or a percentage value. The last cell in the Allocation column
calculates the total allocation. Once entered, the allocation can be saved by
clicking Save Allocation and entering a name for the “.saf” file. The
allocation can then be loaded in the future by clicking Load Allocation.
NOTE: The simulation module requires you to have at least 12 months of
data for the portfolio or investment being simulated.
TIP – If want to equally weight the portfolio, don’t enter any allocations.
When you click Simulate a window will appear asking you if you want to
equally weight the portfolio.
5. Using the buttons at the right, specify whether you are using monthly or
quarterly data.
6. Enter a Risk Free Rate of Return and a Minimal Acceptable Return to use
for calculating risk statistics.
7. Enter the number of simulations you wish to generate. Each simulation
consists of a random data stream that represents just one possible future
outcome. Thousands of these simulations can be pooled together in what is
similar to a peer group, giving you an indication of the probability of various
outcomes.
8. Enter the number of years you wish to simulate. This represents the
length of each random data stream and must be at least one year.
9. Select one of the four random simulation methods from the dropdown
menu.
10. Choose Monthly, Quarterly, Annually, or None from the Re-Balancing
dropdown menu.
250
Portfolio Simulation and Stress Testing
11. When checked, the Use fixed random sequence checkbox will maintain
a consistent randomness throughout several simulation setups.
12. Once all settings have been made, click Simulate.
13. The time required to complete the simulation will vary depending on the
options selected and the speed of your computer. If you decide the
simulation is taking too long, the only way to exit is by pressing Ctrl, Alt, and
Delete simultaneously, then clicking the End Task button from the Close
Program Window. You will then have to restart PerTrac to continue.
Otherwise, when the Simulation Complete message appears, click OK.
14. To view the results, click Simulation Reports.
7.03 - Simulation Reports - View the online tutorial!
The Portfolio Simulation Reports Window allows you to view a simulation
report. If you would like to view the annualized return report, begin by
selecting “Annualized Return” from the dropdown menu.
The first few rows display the number of simulations (1,000 in this example),
along with the mean, median, and standard deviation for both the portfolio
and the benchmark. Below these are the Maximum (Portfolio #1) and
Minimum (Portfolio # 1,000) values for each statistic selected, which
represent the best case and worst case scenarios.
NOTE: – Columns C (Portfolio Historical) and F (Benchmark Historical)
show the actual historical result for each of the statistics selected from the
drop-down window, and will repeated throughout that column.
The results of the simulation (Probability Distributions) are listed in Column
B. Just below the Maximum and Minimum outcomes will be the outcome
distributions from the 99th Percentile down to the 1st Percentile. There is a 1%
chance of achieving the 99th Percentile outcome and a 99% chance of
achieving the 1st percentile outcome.
7.04 - Simulation Charts - View the online tutorial!
In addition to the Simulation Report shown above, you may also create
Simulation Charts. Simulation Reports allow you to simulate on only one period
at a time (i.e. 3 year). The Simulation Charts, on the other hand, will allow you
251
PerTrac User Manual v.19 1
simulate on multiple time periods (i.e. 1 year through 10 years). Follow the steps
below to create simulation charts.
Click Simulation Charts in the PerTrac Portfolio
Simulation window.
1. When the Simulation Wealth Charts window
opens, select a statistic from the dropdown menu.
2. Set the upper and lower percentiles from the
corresponding menus.
3. If applicable, check the Minimum Acceptable
Return checkbox and enter a value.
4. Enter the number of years to plot. In this example
we are plotting 10 years. If you are running 1,000
simulations, a total of 10,000 simulations will take
place. (1,000 simulations on a 1, 2, 3, 4, 5, 6, 7, 8, 9,
10 basis)
NOTE: When Annualized Return is selected from the drop-down box, there are
two types of charts that can be created. One chart shows the ranges of outcomes
for the annualized returns, while the other is a wealth chart in which the Y-axis
will be in dollar terms rather than annualized percentage return.
5. If you are running a wealth chart, enter a starting amount.
Checkboxes are available to plot Cumulative Return, or Annualized
Statistics.
NOTE: The Plot Cumulative Return & Plot Annualized check boxes will only
be visible when Annualized Return is selected from the drop-down box. If you
select statistics other than Annualized Return, these options will be grayed out.
6. Select either the Line Chart or Bar Chart option.
TIP – When plotting statistics from the drop down list, the bar chart is the better
option. When creating the wealth chart described below, the line chart looks
better.
7. Click Simulate and Plot to display the chart.
252
Portfolio Simulation and Stress Testing
Creating the Wealth Chart
1. To create the Wealth Chart click Simulation Charts on the
simulation setup window. As mentioned above, Annualized
Return must be selected in the drop-down box.
2. Set your Upper and Lower Percentiles.
3. Elect to plot the Median or not.
4. Enter the Number of Years to Plot.
5. Enter your starting dollar amount in the Starting Amount
window.
6. Uncheck both the Plot Cumulative and Plot Annualized
boxes
7. Select Line Chart.
8. Click Simulate and Plot. The Y-Axis will contain dollar values.
253
Data Manager
8.01- Data Manager - View the online tutorial!
Data Manager is a powerful multi-task utility program located within PerTrac.
Data Manager has a built-in Automated Update feature for updating your
databases from within PerTrac. Data Manager also contains utilities for merging
databases together, merging just a universe from one database to another,
import and export functions, as well as utilities to help prevent database
corruption. Each of these functions will be explained below. To launch the Data
Manager, click the Tools tab on the PerTrac menu bar. Click Data Manager. The
Data Manager window will open.
TIP: The center of this window contains links to online tutorials that will walk you
through each of the four main functions, Data Manager Overview, Automated
Data Update, Merging Data and Database Maintenance, discussed below.
The bottom of the window contains three quick launch options: Automated Data
Update will open the Database Download window; Quick Merge will open the
Database Merge window; Just Launch Here will open the main Data Manager
window shown above.
254
Data Manager
8.02 - Merging Your Data: Quick Merge
The Quick Merge option is a tool for manually merging a database with another
database or merging a universe with a database.
Merging Databases
Step 1: From the Home window in PerTrac,
click the Tools tab on the upper menu bar.
Click Data Manager. When the Data
Manager window appears, click Quick
Merge. The Quick Merge window will open.
Step 2: Click Source to locate the database
you want to merge to another database.
Step 3: Click Add to locate the database you
are merging with.
Step 4: Click Merge to merge.
TIP: You only have to click the Add button once for each database to which you
merge. These databases will be added to a list that can be accessed by clicking
the down arrow in the destination database window. When you merge at a
future date, click the down arrow to select the database with which to merge.
Merging a Universe with a
Database
Step 1: From the Home window in
PerTrac, click the Tools tab on the
upper menu bar. Click Data Manager.
When the Data Manager window
appears, click Quick Merge. The
Quick Merge window will open.
Step 2: Click Source to locate the
database in which the Universe was
created.
Step 3: Check the box under the
255
PerTrac User Manual v.19 1
Source button, Merge by Universe, to locate the universe you want to merge.
Step 4: Click Add, or click the down arrow in the Destination window, to locate
the database into which you will merge the universe.
Step 5: Click Merge to.
8.04 - Validate Database
The Validate Database feature allows you to
scan a database for structural or referential
errors. You should back up your database prior
using this feature.
Step 1: Click Validate Database on the menu
bar. This will open the Data Manager –
Validate Database window.
Step 2: Locate the Source Database: click
Add to select the database to validate.
TIP: Once a database has been added, click the down arrow in the Source
Database window to select a previously validated database.
Step 3: Check Box
Options:
Fix Duplicate Dates in the Performance Stream: This feature will allow you to
automatically delete duplicate dates in the database. For example, if an
investment has two performance entries for April 2000, PerTrac will display an
error message that states the investment has either duplicate dates or dates
missing from the performance steam.
Backup Source database Before Fixing Duplicate Dates:
This check box will allow Data Manager to back up the original database prior to
the validation with the same name in the same folder, adding “backup” to the file
name. It will also compact the database to fix any data corruption issues.
256
Data Manager
Delete Orphaned Records:
If data has been deleted from the Master Name or Information database tables
orphaned records could be created, which might lead to errors. This option will
delete all orphaned records.
Step 4: Click Finish.
8.05 - Compacting Your Database
Validation is a data maintenance tool, while Compacting is a file
maintenance tool. It is very important that you compact your
database at least once a week, if not more often. This is even
more important if you have a lot of users on a network. The
compacting process will keep the database file structure from
becoming corrupt.
Step 1: Click Compact on the menu bar. This will open the Compact Utility –
Select Database window.
Step 2: Click Locate to select a database to compact.
Step 3: Click Next. The Compact Utility – Finish window opens. Click Finish to
start the compact process.
!!! NOTE: Do not use Ctl-Alt-Del while the database compacting is in
process. This action will corrupt your database to the point that all data will
be lost. Let the process finish even if your task manager says it is not
responding.
TIP: For more technical preventive and repair measures, have your IT
department review this Microsoft Access Database site.
http://support.microsoft.com/default.aspx?scid=kb;en-us;Q306204
257
PerTrac User Manual v.19 1
Error Log
The Error Log will keep a list of Data Manager errors that are encountered when
using the utility.
File Tab Options
Refer to the section: Updating Your Database –
Automated Update
Refer to the section: Merging Your Data – Quick Merge.
Refer to the section: Merging Your Data – Quick Merge.
However, there is one main difference between the Quick Merge and Advanced
Merge. Quick Merge will not merge User data located on the User Information,
User Category or User Memo investment information pages. To merge your
user data while performing the Quick Merge, check the box Merge All User
(Description,
Information,
Checks, Data,
Memo).
Selecting Import from the File menu starts the Import Wizard,
which allows you to import your previously exported data into a
blank PerTrac database. When you install PerTrac, a blank
database, “\PerTrac\Database\PerTrac Blank(v3.0).mdb”, is
installed which acts as a template for this operation. Before you
import, make a copy of this blank database and save it with a
new name so that you may re-use the original blank database in
the future.
1. In Windows Explorer, open the PerTrac/Database folder and make a copy of
“PerTrac Blank.mdb”.
2. Re-name copy of the blank database so you will remember it later.
258
Data Manager
3. Back in the Import Wizard, if you have performed this operation before and
have saved your original settings, you may select Restore Previous Settings
and click Finish. Otherwise, select Choose New Settings and click Next.
4. In the Locate Database box, click Locate to select the database to which
information will be written. Click Next.
5. In the Choose Output Format box, select either Tab Delimited or Comma
Delimited.
6. The next six windows allow you to select the various tables to import and the
files from which they will be read.
7. If you wish to save these merge settings for future use, click Save Settings
and save the “.is” file.
8. Click Finish to begin the export process.
9. Once the import is complete, you will be given the option of viewing the error
log, allowing you to verify that no errors occurred during the import.
Selecting Export from the File menu starts the Export Wizard,
which allows you to export a PerTrac database to either a Tab
Delimited or Comma Delimited (CSV) file for easy integration
between spreadsheet applications, such as Excel.
1. If you have performed this operation before and have saved your settings, you
may select Restore Previous Settings in the Select Settings Option box and
click Finish. Otherwise, select Choose New Settings and click Next.
2. In the Locate Source Database box, click Locate to select the database from
which information will be read.
3. In the Select Investment Source box, select either All Investments, to merge
the entire database, or Universe to merge only a particular universe that you
have created. If you select Universe, click Locate to select the universe you wish
to use. Click Next.
4. In the Choose Output Format box, select either Tab Delimited or Comma
Delimited.
5. The next six windows allow you to select the various tables to export and the
files to which they will be written. Each table you wish to export will be saved as
its own file with either a (.txt) or (.csv) extension. If you choose to export your
performance table, you are given the option to export by column or by row. If you
plan to use these files in a spreadsheet program, exporting by column will
provides a more convenient display of the data. Also, if you plan to import this
data back into a PerTrac database, you must export the information table by
checking the Information Table box and selecting an output file name.
6. In the Enter Date Range box, enter the range of dates you wish to include.
Click Next.
7. If you wish to save these merge settings for future use, click Save Settings
and save the “.esf “file.
8. Click Finish to begin the export process.
259
PerTrac User Manual v.19 1
9. Once the export is complete, you will be given the option of viewing the error
log, allowing you to verify that no errors occurred during the merge.
Refer to the section: Compacting Your Database.
Occasionally, you or your data provider
may change the name of an investment
in your database. If your data provider
has changed one of the Master Names,
you will receive specific prompts during
the merge process. Once the merge is
complete, however, you will want to
update the corresponding universes to
reflect the changes.
1. Select Rename Investment in
Universe Files from the File menu (this
option is also available in the Tools menu in PerTrac).
2. Once open, this window will display the contents of
InvestmentRenameLog.txt. The log file will create a list in the left hand window
showing the investment’s Old Name [New Name].
3. Select the corresponding universes located in the right hand window.
4. Click Rename Investment in Selected Universes to update the name in the
selected universes.
5. When finished, it is a good idea to remove the updated Old Name [New
Name] investments from the log, unless you think you might need them later. To
do so, highlight the names located in the left hand window and click Delete
Selected Investments.
Refer to the section: Validate Database.
The maximum
number of investments you can place in
a PerTrac database is 32,766. If your
database exceeds this limit you will
receive the following error message:
“error in database list, subscript out
of range”. Exceeding the 32,766 limit
does not happen often, however if you
merge numerous large databases
together there is a chance you will
exceed the limit. If you exceed the limit
260
Data Manager
and receive the error message, the Delete Excess Investments options in Data
Manager will allow you to delete records.
1. Open Data Manager by clicking Start\Program Files\PerTrac 6.0\Data
Manager.
2. When the Data Manager window opens, click File\Delete Excess
Investments. The Delete Excess Investments window will open.
3. The first step is to open the database that exceeds 32,766 investments. Click
Locate to select your database.
NOTE: When you select your database, Data Manager will count the number of
funds in that database. If your database contains less than 32,766 you will not be
allowed to delete investments with this utility.
4. Provided your database exceeds the limit there are three Excess Investment
Removal Options:
Data Vendor – This option allows you to delete records specific to a
particular data vendor in your merged database.
Investment Performance Date –This option allows you to delete
investments by Start or End dates.
Universe – This option allows you to delete investments by universe.
8.05 - Data Manager Options Tab
The
Dat
a Manager Options consist of three tabs: Merge/Validation, Proxy/Firewall and
Automated Data Download.
To access the Data Manager Options click the Options tab on the menu bar
then select Data Manager Options. The Proxy/Firewall Settings window will
appear.
261
PerTrac User Manual v.19 1
Merge/Validation Tab
Data Validation: Contains two validation options for the Validate Database
utility:
Clear Orphaned Leverage Records – If you have added leverage data
for an investment to the leverage table located on the investment data
window, and subsequently deleted the investment from the database, the
leverage data may still exist as an orphaned record. Checking this
validation option will remove the orphaned leverage data.
Clear Orphaned Invalid Benchmark Universes – If you have assigned
benchmark universes to your funds and then removed either a benchmark
from the assigned benchmark universe, or removed the investment the
benchmarks were assigned to, you may have created orphaned
investments. This option will remove these orphaned records during the
validation process.
Data Merge: Contains four data merge options using the Quick Merge function.
1. Always synchronize all destination performance records with
source- If your source database contains the same funds as your
destination database, but the source contains longer performance
histories or different data streams for any reason, you can synchronize the
destination database with the source. The destination database data
streams will be wiped out and replaced with the data streams from the
source database. Select this option if you always want to synchronize with
the source database.
2. Always Merge User Information – If you merge a source database
that contains information that you entered in the User Information, User
Categories or User Memo fields, and you always want to merge this data
with the destination database, check this box.
NOTE: When you check this box on this Data Manager Options tab, it will
automatically be checked in the Quick Merge window.
3. Always Back-up the Destination Database – Check this option if you
want to backup your destination database (as a preventive measure) prior
to merging. If something goes wrong during the merge you will have a
backup of the original.
4. Always Merge Benchmarks – When you assign a benchmark universe
to an investment that assigned benchmark universe and the investment
become linked from a database standpoint. When you merge the
database whose investments have assigned benchmark universes, this
option will also merge your assigned benchmarks.
262
Data Manager
NOTE – This option should only be selected if all potential users who will
be merging data, and want to merge benchmarks, are on the same
network. There are files associated with assigning benchmark universes,
and for this option to work between users, they must be sharing and
mapped to the same network folders.
Proxy/Firewall
When updating your
database with the
Automated Data
Update feature the
Data Manager will
access your server
prior to downloading
the data from our
website. You may
receive a Data
Manager error that
will prevent the process from completion due to your Firewall Security Settings or
Proxy Settings. If you receive an error message, have your System Administrator
enter the Firewall and/or Proxy Settings in this options window.
Automated Data Download
PerTrac’s Data Manager contains an automated database update utility. To
access the database update utility click the Tools tab on the PerTrac menu bar,
and select the Update Database option. This will open the Auto Update and
Merge window, which allows you to select up to five databases to download.
263
PerTrac User Manual v.19 1
However, when you click the down arrow at the end of each database window,
42 database options appear in the list. These are the complimentary and
subscription databases available for download.
We have added an option to the Data Manager Options tab that allows you to
customize the drop-down list to show only the database(s) you download on a
regular basis. If you purchase additional databases at some time in the future,
those databases can easily be added to your list. To access the new optionclick
the Tools tab and select Update Database. The Auto Data Update and Merge
window will open. Click the Options tab on the menu bar and click Data
Manager Options. Click on third tab to the right, Automated Data Download.
This will open a window with a list of the 42 available databases for download.
Each database has a check box located to the left of the name. Check the boxes
for each of the databases you want in your custom list, then click OK. When you
update your databases in the future, the only database names in the drop-down
window will be the databases you selected in the options window.
Data Manager Help Tab
The help tab contains one option: About Data Manager. This window will
indicate the current version of Data Manager. It also contains a link to the Data
Manager online tutorials.
264
PerTrac Online Tutorials
PerTrac Online Tutorials:
PerTrac 6.0 Upgrade: PerTrac 6.0 - Please Review Our New Features (28:29)
Section 1: Getting Started
1. Setting Your Default Folders (2:07)
2 Updating Your Software: Software Upgrades (3:41)
3. How to Create a Master Database (3:47)
4. Updating Your Data: Automated Update (9:27)
5. Merging Data with Data Manager (7:45)
6. How Do I Add an Investment? (Monthly Data Streams) (3:28)
7. How Do I Add an Investment? (Quarterly Data Streams) (7:18)
8. How Do I Update Investments I Have Added?: Monthly Data Entry Form
(3:30)
9. Database Maintenance: Compacting and Validating (7:06)
10. Data Manager 6.0 Overview (3:20)
Section 2: Single Investment Analysis Tools
1. Single Investment Analysis Tools & Reports Overview (3:33)
2. Single Investment Information (6:55)
3. Single Investment Data (6:00)
4. Single Investment Statistics (12:40)
5. Single Investment Charts (7:15)
Section 2a: Single Investment Reports
6. Investment Summary Reports (4:13)
7. PerTrac Publisher Overview (4:39)
8. PerTrac Publisher: Performance Measurement Report (6:47)
Section 3: Universe (Multiple-Investment) Analysis Tools
265
PerTrac User Manual v.19 1
1. Universe Analysis Tools and Reporting Overview (3:18)
2. How Do I Create a Universe? (6:13)
3. Performing Manager Searches (12:43)
4. The Correlation Universe (4:41)
5. Assigning Benchmark Universes to Investments (11:04)
6. How Do I Create A Composite Portfolio or Policy Index?
a. Convert Portfolio to Investment (7:08)
b. Portfolio Builder (9:07)
7. Universe Statistics (6:39)
8. Creating a Correlation Matrix (7:02)
9. Universe Charts (8:37)
Section 3a: Universe (Multiple-Investment) Reports
1. PerTrac Reports (21:41)
Section 4: Efficient Frontier & Linear Optimization
1. Efficient Frontier Optimization - PerTrac 6.0 New Features (12:59)
2. Efficient Frontier Optimization - Overview (7:06)
3. Efficient Frontier Optimization - Setup (9:05)
4. Linear Optimization (13:48)
Section 5: Financial Planning & Simulation
1. Planning & Simulation - PERTRAC 6.0 NEW FEATURE (25:09)
Section 6: Value At Risk Analysis - Monte Carlo Simulation
1. Value at Risk Analysis - Monte Carlo Simulation (26:33)
Section 7: Peer Group Analysis
266
PerTrac Online Tutorials
1. Peer Group Charts & Reports - View Peer Group Data (25:23)
2. IntelliStat Search & Find Better Funds Search - PERTRAC 6.0 NEW
FEATURE (9:13)
3. PerTrac Publisher – Peer Group Report (20:32)
Section 8: Style Analysis
1. Single Investment Style Analysis (21:17)
2. Multiple Investment Style Analysis - Performing Style Searches (27:10)
3. PerTrac Publisher - Style Analysis Report (20:13)
267
Statistics Definitions
268
Statistics Definitions
269
PerTrac User Manual v.19 1
270
Statistics Definitions
271
PerTrac User Manual v.19 1
272
Statistics Definitions
273
PerTrac User Manual v.19 1
274
Statistics Definitions
275
PerTrac User Manual v.19 1
276
Statistics Definitions
277
PerTrac User Manual v.19 1
278
Statistics Definitions
279
PerTrac User Manual v.19 1
280
Statistics Definitions
281
Frequently Asked Questions (FAQ)
What do statistics shown in the color blue signify?
The color blue is somewhat of a red flag. Statistics and performance measures
shown in blue indicate a situation the user must be made aware of. There are
two areas in PerTrac where you might find statistics in blue: Investment Statistics
and Universe Statistics.
(1) Investment Statistics: There are two tables located in the Investment
Statistics window where you will frequently see statistics in blue: (a) “Date”,
“Return”, “Vami” and “To Date” table located in the upper right. The color blue in
this table indicates that the monthly return(s) are coded as estimates; (b)
Benchmark Analysis table on the lower right. The Benchmark Analysis table
contains correlation statistics and capture ratios relative to selected benchmarks.
The color blue in this table indicates the statistics are not being calculated over
the date range shown at top of the Investment Statistics window.
TIP: To see the date range on which the statistics in blue are being calculated
on, use the Benchmark Analysis table scroll bar. If you scroll to the right you will
find two columns labeled “Start” and “End” indicating the date range.
(2) Universe Statistics-Correlation Analysis: The universe statistics window
contains a number functions to analyze a universe of investments. When utilizing
these functions, PerTrac by defaut, will set the start and end dates to equal the
common start and end dates for each of the investments. However, there may be
instances where the user will change the start and end dates beyond the
common date range. When the date ranges are changed and the user then
selects Convert Portfolio to Investment, Statistics, Charts, Pro Forma, Efficient
Frontier Optimizer or Linear Optimizer, a window appears prompting you to make
a decision as to how you want PerTrac to handle the uneven date ranges.
TIP: There is one tab, Correlation Analysis, which will calculate the statistics over
any date range you select. The Correlation Analysis will create a matrix, such as
a correlation matrix, on many statistics. To calculate these statistics, a common
date range between each of the investments must be used for the regression.
When the matrix has been generated the color blue is used to indicate the
correlations are not being calculated over the date range shown on the universe
allocation page, but the common date range between the pairs of investments
being correlated.
How do I optimize funds with short performance histories?
An issue that arises frequently with PerTrac users is that of optimizing a universe
of investments that contain funds with a short date range. The Efficient Frontier
Optimizer requires a common start and end for the investments being optimized.
282
Frequently Asked Questions (FAQ)
When your universe contains new funds with short date ranges, your optimization
period will be restricted to the shorter date range. For example, if you had a
universe of ten funds, nine of which have five years of data and one with six
months of data, the optimization period will be restricted to six months. If you
wish to proceed with the optimization you will have to make a decision regarding
this issue. There are five possible solutions to this situation.
1. Replace the investment restricting the date range with an appropriate
benchmark proxy that has a longer data history.
2. Back-fill the investment data stream with a benchmark’s data. This option
would keep the short history of data for the investment and back-fill the
remaining history with an appropriate, highly correlated benchmark.
Note: To back-fill the investment data make a duplicate of the original, click
Investment Data to open the investment’s data sheet, insert rows above the
investment’s first data point, and then enter the dates and performance for the
benchmark.
3. Select the PerTrac option to automatically back-fill the investment data
with zeros or a risk free rate. This option will have the greatest impact on
skewing the return, standard deviation and correlation of the investment
when generating the efficient frontier.
4. Select a PerTrac option to back-fill the data with a zero prior to generating
the efficient frontier and then change the inputs when you enter the efficient
frontier setup window.
Note: This option willl, initially, back-fill the investment’s data with zeros or a risk
free rate which will be reflected in the annualized return, standard deviation, and
correlation to the other investments. However, you can then change the three
inputs when the efficient frontier setup winodw opens. To do so, click the
Advanced Setup button on the lower left. When the Advanced Setup window
appears, click the Risk/Return and Allocations tab to change the return and
standard deviation for the investment. You could enter the return and standard
deviation the investment actually achieved over its short data range, or enter a
return and standard deviation that more closely represents the strategy or asset
class over a longer term date range. Next, click the Correlation Matrix tab to
change the correlations between the investment and the other investments in the
universe.
283
PerTrac User Manual v.19 1
Tip: To locate the actual return and standard deviation for the investment over its
date range, highlight the investment and click Investment Statistics at the Home
window. The return and standard deviation can be found in the Risk Table. To
view the correlations over the investment’s date range, click the Correlation
Analysis tab on the universe statistis window. The default date range will be the
date range of this investment. When the correlation analysis window opens the
default setting is Correlation R. Click OK. Once you have the return, standard
deviation and correlation numbers, enter them on the efficient frontier advanced
setup window.
5. Remove the investment from the universe.
Data Manager: Most Frequently Asked Question (FAQ)
We receive numerous calls regarding a message that appears after you update
your data with the Updated Database feature. The message: “Automated Data
Update could not compact your database which could be because you
have that database open in PerTrac or in MS Access. Please compact your
database on a regular basis through PerTrac. If you have the database
open in PerTrac then please reload your Master Universe to see the
changes”. This message is not an error, but a notification message that the
database could not be compacted because it is open in PerTrac when the
download is taking place. The update has completed. Close the message
window down, as well as the data manager window. When you are back to the
PerTrac home window click the Load Master Universe button located on the left.
That will reset your database to reflect the update.
Note: If, however, there is a critical error below that message, the download did
not take place. The common causes generating the critcial errors include proxy
settings, firewall settings or an incorrect license number. If you receive an error
message contact our tech support at (775) 851-5880.
The "View" button
We are frequently asked by clients for the quickest way to export a fund name,
contact name, contact phone number, and email address on a universe of funds.
This can be achieved by way of the View button located on the PerTrac tool bar.
The View button has two drop-down options: View Universe & View Database.
Selecting the View Universe option will allow you to produce four columns of
fields on any universe currently open in the Home window. This would also
include the entire database. The View Universe option will allow you to export a
total four information fields from the Investment Information General tab. To
284
Frequently Asked Questions (FAQ)
export the information fields, open the universe at the PerTrac Home window.
Click View on the menu bar and select View Universe. The Universe View
window contains four boxes with a drop-dwon arrow at the end of each window.
Click the down arrow to select the information fields. Once your selections have
been made, double right-click on the table. The workbook designer window will
open. Highlight the table, copy it, and paste it to Excel.
Tip: The View Universe option will allow you to export one to four information
fields only. If you wish to export more than four information page fields on a
universe of funds, create and export a PerTrac Reports template to Excel.
Note: The View Database option will allow you to view all of the fields on the
Investment Information General tab in a Microsoft Access table for your entire
database. However, unlike the View Universe option which can be exported to
Excel, the View Database option is just that, a table for viewing only. You do not
have the ability export this data to Excel.
285
PerTrac Tips & Tricks
How do I optimize funds with short performance histories?
An issue that arises frequently with PerTrac users is that of optimizing a universe
of investments that contain funds with a short date range. The Efficient Frontier
Optimizer requires a common start and end for the investments being optimized.
When your universe contains new funds with short date ranges, your optimization
period will be restricted to the shorter date range. For example, if you had a
universe of ten funds, nine of which have five years of data and one with six
months of data, the optimization period will be restricted to six months. If you
wish to proceed with the optimization you will have to make a decision regarding
this issue. There are five possible solutions to this situation.
1. Replace the investment restricting the date range with an appropriate
benchmark proxy that has a longer data history.
2. Back-fill the investment data stream with a benchmark’s data. This option
would keep the short history of data for the investment and back-fill the
remaining history with an appropriate, highly correlated benchmark.
Note: To back-fill the investment data make a duplicate of the original, click
Investment Data to open the investment’s data sheet, insert rows above the
investment’s first data point, and then enter the dates and performance for the
benchmark.
3. Select the PerTrac option to automatically back-fill the investment data
with zeros or a risk free rate. This option will have the greatest impact on
skewing the return, standard deviation and correlation of the investment
when generating the efficient frontier.
4. Select a PerTrac option to back-fill the data with a zero prior to generating
the efficient frontier and then change the inputs when you enter the efficient
frontier setup window.
Note: This option willl, initially, back-fill the investment’s data with zeros or a risk
free rate which will be reflected in the annualized return, standard deviation, and
correlation to the other investments. However, you can then change the three
inputs when the efficient frontier setup winodw opens. To do so, click the
Advanced Setup button on the lower left. When the Advanced Setup window
appears, click the Risk/Return and Allocations tab to change the return and
standard deviation for the investment. You could enter the return and standard
deviation the investment actually achieved over its short data range, or enter a
return and standard deviation that more closely represents the strategy or asset
class over a longer term date range. Next, click the Correlation Matrix tab to
change the correlations between the investment and the other investments in the
universe.
286
PerTrac Tips & Tricks
Tip: To locate the actual return and standard deviation for the investment over its
date range, highlight the investment and click Investment Statistics at the Home
window. The return and standard deviation can be found in the Risk Table. To
view the correlations over the investment’s date range, click the Correlation
Analysis tab on the universe statistis window. The default date range will be the
date range of this investment. When the correlation analysis window opens the
default setting is Correlation R. Click OK. Once you have the return, standard
deviation and correlation numbers, enter them on the efficient frontier advanced
setup window.
5. Remove the investment from the universe.
PerTrac Reports - Peer Group Analysis
The Advanced version of PerTrac contains a very robust peer group analysis
module for analyzing and ranking funds relative to their peers and benchmarks.
The Standard version of PerTrac does not include the peer analysis module,
however, that does not necessarily mean you can’t perform peer group analysis.
All versions of PerTrac include the PerTrac Reports universe report generator.
What most users are not aware of is that PerTrac Reports has the ability to
create peer analysis charts on any performance and risk statistic available in the
column selection window. The following steps will walk you through creating peer
analysis charts with PerTrac Reports.
Step 1: Launch PerTrac Reports from the Reports tab on the PerTrac menu bar.
Step 2: The PerTrac Reports upper menu bar contains a window to select the
report type. The default selection is “Columnar-Multi Manager”. If you click the
down arrow on that window a second report option “Peer Group Analysis” can be
selected.
Step 3: Open an existing template or create a new template of statistics the peer
group analysis chart will contain. Enter the date range. Note: the peer group
analysis option requires a fixed start and end date. The “Since inception” & “End
of Data” options are not available for this chart.
Step 4: Locate the peer universe. Click the “Universe” button located on the right
hand side of the upper menu bar. When the Universe Selection window appears,
select the Peer Universe you will be ranking your fund against and click OK.
Step 5: Select the “Comparative Investments” universe to plot on the peer chart.
After the peer universe has been selected, click “Generate Report” located on the
upper right hand side of the upper menu bar, and then select Excel. The
Generate Report window will appear verifiying the universe you just selected.
Click Yes. The Peer Group Analysis window will open which contains the “Enter
287
PerTrac User Manual v.19 1
Universe Name for Comparative Investments” universe selection. This is the
universe of investments that will be plotted on the bar chart. Click “Locate” on
the upper right to select your universe. Now locate the default chart file. The
window below the “Enter Chart Template for Comparative Investment Plot”
should contain the path to the default chart file. If the window is blank, click the
Locate button at the end of the window. The correct file path is
C:\PerTrac\PeerGroupTemplate[Defalut].vtc. The last option is to “Enter
Percentile Chart Preference”. The options include: Decile, Quintile, Quartile and
Quartile [95%-5%], which will determine how the bar chart is formatted. When all
selections have been made, click OK.
Step 6: Generate the report. After clicking OK in Step 5, the Excel Export Setup
window will appear. Select Empty Excel Workbook, Leave Excel Open and check
the Fomat Output option. Then click Generate Report. An Excel spreadsheet will
open which will contain the output for each fund in the two universes. In addition
to the Excel spreadsheet a Peer Analysis bar chart, plotting your investments
relative to the peer universe, will also be created.
What do statistics shown in the color blue signify?
The color blue is somewhat of a red flag. Statistics and performance measures
shown in blue indicate a situation the user must be made aware of. There are
two areas in PerTrac where you might find statistics in blue: Investment Statistics
and Universe Statistics.
(1) Investment Statistics: There are two tables located in the Investment
Statistics window where you will frequently see statistics in blue: (a) “Date”,
“Return”, “Vami” and “To Date” table located in the upper right. The color blue in
this table indicates that the monthly return(s) are coded as estimates; (b)
Benchmark Analysis table on the lower right. The Benchmark Analysis table
contains correlation statistics and capture ratios relative to selected benchmarks.
The color blue in this table indicates the statistics are not being calculated over
the date range shown at top of the Investment Statistics window.
TIP: To see the date range on which the statistics in blue are being calculated
on, use the Benchmark Analysis table scroll bar. If you scroll to the right you will
find two columns labeled “Start” and “End” indicating the date range.
(2) Universe Statistics-Correlation Analysis: The universe statistics window
contains a number functions to analyze a universe of investments. When utilizing
these functions, PerTrac by defaut, will set the start and end dates to equal the
common start and end dates for each of the investments. However, there may be
instances where the user will change the start and end dates beyond the
common date range. When the date ranges are changed and the user then
selects Convert Portfolio to Investment, Statistics, Charts, Pro Forma, Efficient
Frontier Optimizer or Linear Optimizer, a window appears prompting you to make
a decision as to how you want PerTrac to handle the uneven date ranges.
288
PerTrac Tips & Tricks
TIP: There is one tab, Correlation Analysis, which will calculate the statistics over
any date range you select. The Correlation Analysis will create a matrix, such as
a correlation matrix, on many statistics. To calculate these statistics, a common
date range between each of the investments must be used for the regression.
When the matrix has been generated the color blue is used to indicate the
correlations are not being calculated over the date range shown on the universe
allocation page, but the common date range between the pairs of investments
being correlated.
The "View" button
We are frequently asked by clients for the quickest way to export a fund name,
contact name, contact phone number, and email address on a universe of funds.
This can be achieved by way of the View button located on the PerTrac tool bar.
The View button has two drop-down options: View Universe & View Database.
Selecting the View Universe option will allow you to produce four columns of
fields on any universe currently open in the Home window. This would also
include the entire database. The View Universe option will allow you to export a
total four information fields from the Investment Information General tab. To
export the information fields, open the universe at the PerTrac Home window.
Click View on the menu bar and select View Universe. The Universe View
window contains four boxes with a drop-dwon arrow at the end of each window.
Click the down arrow to select the information fields. Once your selections have
been made, double right-click on the table. The workbook designer window will
open. Highlight the table, copy it, and paste it to Excel.
Tip: The View Universe option will allow you to export one to four information
fields only. If you wish to export more than four information page fields on a
universe of funds, create and export a PerTrac Reports template to Excel.
Note: The View Database option will allow you to view all of the fields on the
Investment Information General tab in a Microsoft Access table for your entire
database. However, unlike the View Universe option which can be exported to
Excel, the View Database option is just that, a table for viewing only. You do not
have the ability export this data to Excel.
Increased Speed: The Linear Optimization module has been completely
rewritten for increased efficiency and will now complete the optimization in a
fraction of the time it took in previous versions of PerTrac. In the past, if you were
optimizing seven or more assets a message appeared stating that the
optimization could take forever. That message will no longer appear. You will
also no longer have to set tight constraints or increase the allocation increment,
both of which helped speed up the optimization. You can now run the
optimization unconstrained, select the allocations to change in increments of 25
bps and have the results in seconds.
289
PerTrac User Manual v.19 1
Custom Reports: We have added a PerTrac Publisher style report generator to
the linear optimizer. There is now a “Report” tab located on the Linear Optimizer
setup window. If you are running the most current version of PerTrac you will
now have a new template, “MasterLinearOptimizationReport.xls”, in the
C:\PerTrac\Custom Reports folder. This is similar to the PerTrac Publisher
master reports that allow the user to create custom templates. This new file will
contain the linear optimization allocation table, scatterplot chart, inputs and all
other optimization output.
290
Technical support & Training
PerTrac Financial Solutions provides complimentary
technical support and training to all PerTrac clients. You
may contact our technical support staff by email or
phone.
Email: [email protected]
Phone:
(775) 851-5880 (USA)
+44 (0)20 7651 0800 (UK)
291