1
Copyright © NETASQ 2008
Page 1 sur 136
ENUG0810-V1.0_NEREPORTER-V8.0
NETASQ EVENT REPORTER V. 8.0
USER MANUAL
Reference: ENUG0810_NEREPORTER-V8.0
Created: January 2007
Modifed: October 2008
Copyright © NETASQ 2008
Page 2 sur 136
ENUG0810-V1.0_NEREPORTER-V8.0
USER GUIDE
Copyright © NETASQ 2008. All rights reserved.
Any reproduction, adaptation or translation of this current document without prior written permission is
prohibited, except where expressly allowed by copyright laws.
NETASQ applies a method of continual development and as such reserves the right to modify and improve
any product described in the document without prior notice.
Under no circumstances shall NETASQ be held liable for any loss of data or revenue, or any special damage
or incident, resulting from or indirectly caused by the use of the product and its associated documentation.
The contents of this document relate to the developments in NETASQ’s technology at the time of its writing.
With the exception of the mandatory applicable laws, no guarantee shall be made in any form whatsoever,
expressly or implied, including but not limited to implied warranties as to the merchantability or fitness for a
particular purpose, as to the accuracy, reliability or the contents of the document. NETASQ reserves the
right to revise this document, to remove sections or to remove this whole document at any moment without
prior notice.
To ensure the availability of products, which may vary according to your geographical locations, contact your
nearest NETASQ distributor.
Publication Information
Reference: ENUG0810_NEREPORTER-V8.0
Version 8.0
October 2008
Products concerned
U30, U70, U120, U250, U450, U1100, U1500 and U6000.
.
Copyright © NETASQ 2008
Page 3 sur 136
ENUG0810-V1.0_NEREPORTER-V8.0
USER GUIDE: FOREWORD
FOREWORD
Copyright
© Copyright NETASQ 2007. All rights reserved. Under copyright law, any form of reproduction
whatsoever of this user manual without NETASQ's prior written approval is prohibited. NETASQ
rejects all liability arising from the use of the information contained in these works.
Liability
This manual has undergone several revisions to ensure that the information in it is as accurate as
possible. The descriptions and procedures herein are correct where NETASQ firewalls are
concerned. NETASQ rejects all liability directly or indirectly caused by errors or omissions in the
manual as well as for inconsistencies between the product and the manual.
Notice
WEEE Directive
All NETASQ products that are subject to the WEEE directive will be marked with the mandated
"crossed-out wheeled bin" symbol (as shown above) for items shipped on or after August 13,
2005. This symbol means that the product meets the requirements laid down by the WEEE
directive with regards to the destruction and reuse of waste electrical and electronic equipment.
For further details, please refer
http://www.netasq.com/recycling.html
to
NETASQ's
website
at
this
address:
License Agreement
Introduction
The information contained in this document may be changed at any time without prior notification.
Despite the care taken in preparing this document, it may contain some errors. Please do not
hesitate to contact NETASQ if you notice any.
NETASQ will not be held responsible for any error in this document or for any resulting
consequence.
Acceptance of terms
By opening the product wrapping or by installing the administration software you will be agreeing to
be bound by all the terms and restrictions of this License Agreement.
License
NETASQ hereby grants, and you accept, a non-exclusive, non-transferable license only to use the
object code of the Product. You may not copy the software and any documentation associated with
the Product, in whole or in part. You acknowledge that the source code of the Product, and the
concepts and ideas incorporated by this Product, are valuable intellectual property of NETASQ. You
agree not to copy the Product, nor attempt to decipher, reverse translate, de-compile, disassemble
Copyright © NETASQ 2008
Page 4 sur 136
ENUG0810-V1.0_NEREPORTER-V8.0
USER GUIDE: FOREWORD
or create derivative works based on the Product or any part thereof, or develop any other product
containing any of the concepts and ideas contained in the Product. You will be held liable for
damages with interests therein in favor of NETASQ in any contravention of this agreement.
Limited warranty and limitation of liability
a - Hardware
NETASQ warrants its Hardware products ("Hardware") to be free of defects in materials and
workmanship for a period of one year, in effect at the time the Purchaser order is accepted. This
period begins with effect from the date on which the product is activated.
b - Software
NETASQ Software products ("Software") are warranted for a period of 90 days (unless otherwise
stated at purchase) from the date of the product’s activation to be free from defects and to operate
substantially according to the manual, as it exists at the date of delivery, under the operating system
versions supported by NETASQ.
NETASQ does not warrant its software products for use with operating systems not specifically
identified.
c - Default
NETASQ’s entire liability and your exclusive remedy shall be, at NETASQ’s option, either a return of
the price paid for this License or Product resulting in termination of the agreement, or repair or
replacement of the Product or media that does not meet this limited warranty.
d - Warranty
Except for the limited warranties set forth in the preceding paragraph, this product is provided "as is"
without warranty of any kind, either expressed or implied. NETASQ does not warrant that the product
will meet your requirements or that its operation will be uninterrupted or error free. NETASQ
disclaims any implied warranties or merchantability or fitness for particular purpose, or noninfringement.
e - Recommendations
In no event will NETASQ be liable to you or any third party for any damages arising out of this
agreement or the use of the product, including lost profit or savings, whether actual, indirect,
incidental, or consequential, irrespective of whether NETASQ has been advised of the possibility of
such damages. NETASQ’s maximum liability for damages shall be limited to the license fees
received by NETASQ under this license for the particular product(s) which caused the damages.
Any possible legal action relating to the alleged defectiveness of the software will come under the
jurisdiction of NETASQ’s headquarters, French law being the binding authority.
WARNING
1) Certain NETASQ products enable gathering and analyzing logs. This log information allows the
activity of internal users to be tracked and may provide nominative information. The legislation in
force in the destination country may impose the application of certain measures (namely
administrative declarations, for example) when individuals are subject to such monitoring.
Ensure that these possible measures have been applied before any use of the product.
2) NETASQ products may provide cryptographic mechanisms which are restricted or forbidden by
the legislation in force in the destination country. Despite the control made by NETASQ before
Copyright © NETASQ 2008
Page 5 sur 136
ENUG0810-V1.0_NEREPORTER-V8.0
USER GUIDE: FOREWORD
exportation, ensure that the legislation in force allows you to use these cryptographic
mechanisms before using NETASQ products.
3) NETASQ disclaims all liability for any use of the product deemed illegal in the destination
country.
Copyright © NETASQ 2008
Page 6 sur 136
ENUG0810-V1.0_NEREPORTER-V8.0
USER GUIDE: CONTENTS
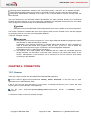
CONTENTS
FOREWORD
4 CONTENTS
7 PART 1: INTRODUCTION
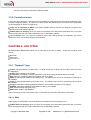
10 CHAPTER 1: BASIC PRINCIPLES
1.1.1. WHO SHOULD READ THIS USER GUIDE?
1.1.2. TYPOGRAPHICAL CONVENTIONS
1.1.3. VOCABULARY
1.1.4. GETTING HELP
1.1.5. INTRODUCTION TO NETASQ EVENT REPORTER
CHAPTER 2: CONNECTION
1.2.1. ACCESS
1.2.2. CONNECTION
1.2.3. ADDRESS BOOK
10 10 10 12 12 12 13 13 14 18 PART 2: GETTING FAMILIAR WITH REPORTER
21 CHAPTER 1: PRESENTATION OF THE INTERFACE
2.1.1. MAIN WINDOW
2.1.2. MENU BAR
2.1.3. MENU DIRECTORY
2.1.4. DATE AND FILTER SELECTION BAR
2.1.5. RESULT DISPLAY ZONE
2.1.6. STATUS BAR
2.1.7. ACTION BAR
CHAPTER 2: DESCRIPTION OF THE MENU BAR
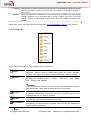
2.2.1. FILE MENU
2.2.2. TOOLS MENU
2.2.3. AUTOREPORT MENU
2.2.4. APPLICATIONS MENU
2.2.5. WINDOWS MENU
2.2.6. ? MENU (HELP)
CHAPTER 3: OPTIONS
2.3.1. GENERAL TAB
2.3.2. LOG TAB
2.3.3. TOOLS TAB
2.3.4. ADDRESS BOOK TAB
21 21 22 22 24 25 25 25 26 26 26 27 27 27 28 28 28 29 31 32 PART 3: USING NETASQ EVENT REPORTER
33 CHAPTER 1: SOURCES
3.1.1. FIREWALL
3.1.2. DATABASE
CHAPTER 2: GRAPHS
3.2.1. INTRODUCTION
3.2.2. CUSTOMIZING
CHAPTER 3: CUSTOMIZING COLUMNS AND HEADERS
Copyright © NETASQ 2008
Page 7 sur 136
33 33 33 35 35 35 38 ENUG0810-V1.0_NEREPORTER-V8.0
USER GUIDE: CONTENTS
3.3.1. HEADERS
3.3.2. COLUMNS
3.3.3. SORTING BY COLUMNS
3.3.4. CONTEXTUAL MENU
CHAPTER 4: LOG TYPES
3.4.1. "NETWORK" LOGS
3.4.2. "SERVICES" LOGS
3.4.3. “STATISTICS" LOGS
3.4.4. MISCELLANEOUS
CHAPTER 5: FILTER CONSTRUCTOR
3.5.1. ADDING A FILTER
CHAPTER 6: DATA EXPORT
3.6.1. EXPORT
3.6.2. LOG FORMAT
CHAPTER 7: NETASQ LOG COLLECTOR
3.7.1. LOG COLLECTOR SERVICE
3.7.2. ADMINISTRATION
3.7.3. NETASQ LOG COLLECTOR ACTIVITY
CHAPTER 8: UNIX SYSLOG
CHAPTER 9: AUTOREPORT
3.9.1. INTRODUCTION
3.9.2. INTRODUCTION TO OPTIONS
3.9.3. SETTING UP THE SERVICE
3.9.4. CREATING REPORTS
39 40 42 43 43 43 45 50 53 54 56 58 58 60 60 60 62 69 70 72 72 73 73 79 PART 4: NETASQ SYSLOG
91 CHAPTER 1: INSTALLATION
4.1.1. PROCEDURE
4.1.2. SYSLOG SERVICE
CHAPTER 2: CONFIGURATION
4.2.1. CONFIGURING NETASQ UNIFIED MANAGER
4.2.2. CONFIGURING NETASQ SYSLOG
CHAPTER 3: USING LOGS
4.3.1. LOCATION OF LOGS
91 91 92 93 93 94 96 96 APPENDICES
98 98 98 99 100 101 101 102 103 104 104 105 106 107 107 108 109 109 110 111 112 112 116 APPENDIX A: NETASQ LOG FILES
ALARM
AUTH
CONNECTION
COUNT
FILTER
FILTERSTAT
FTP
MONITOR
NATSTAT
PLUGIN
POP3
PVM
SERVER
SMTP
SYSTEM
VPN
WEB
XVPN
FORMAT OF LOG FILES
EXCEPTIONS ON TOKENS
APPENDIX B: LIST OF FILTERS BY LOG FILE
Copyright © NETASQ 2008
Page 8 sur 136
ENUG0810-V1.0_NEREPORTER-V8.0
USER GUIDE: CONTENTS
GLOSSARY
Copyright © NETASQ 2008
120 Page 9 sur 136
ENUG0810-V1.0_NEREPORTER-V8.0
USER GUIDE: PART 1: INTRODUCTION
PART 1: INTRODUCTION
CHAPTER 1: BASIC PRINCIPLES
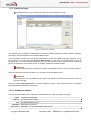
1.1.1. Who should read this user guide?
This manual is intended for network administrators or for users with the minimum knowledge of IP.
In order to configure your NETASQ Firewall in the most efficient manner, you must be familiar with these
protocols and their specific features:
ICMP (Internet Control Message Protocol).
IP (Internet Protocol).
TCP (Transmission Control Protocol).
UDP (User Datagram Protocol).
Knowledge of the general operation of the major TCP/IP services is also preferable:
HTTP.
FTP.
Messagerie (SMTP, POP3, IMAP).
Telnet.
DNS.
DHCP.
SNMP.
NTP.
If you do not possess this knowledge, don't worry: any general book on TCP/IP can provide you with the
required elements.
The better your knowledge of TCP/IP, the more efficient will be your filter rules and the greater your IP
security.
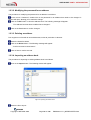
1.1.2. Typographical conventions
1.1.2.1. Abbreviations
For the sake of clarity, the usual abbreviations have been kept. For example, VPN (Virtual Private Network).
Other acronyms will be defined in the glossary.
Copyright © NETASQ 2008
Page 10 sur 136
ENUG0810-V1.0_NEREPORTER-V8.0
USER GUIDE: PART 1: INTRODUCTION
1.1.2.2. Display
Names of windows, menus, sub-menus, buttons and options in the application will be represented in the
following fonts:
Menu Interfaces
1.1.2.3. Indications
Indications in this manual provide important information and are intended to attract your attention. Among
these, you will find:
NOTES/REMARKS
These messages provide a more detailed explanation on a particular point.
WARNING/RECOMMENDATION
These messages warn you about the risks involved in performing a certain manipulation or about
how not to use your appliance.
TIP
This message gives you ingenious ideas on using the options on your product.
DEFINITION
Decribes technical terms relating to NETASQ or networking. These terms will also be covered in te
glossary.
1.1.2.4. Messages
Messages that appear in the application are indicated in double quotes.
Example: "Delete this entry?"
1.1.2.5. Examples
Example
This allows you to have an example of a procedure explained earlier.
1.1.2.6. Commands lines
Command lines
Indicates a command line (for example, an entry in the DOS command
window).
Copyright © NETASQ 2008
Page 11 sur 136
ENUG0810-V1.0_NEREPORTER-V8.0
USER GUIDE: PART 1: INTRODUCTION
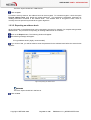
1.1.2.7. Reminders
Reminders are indicated as follows:
Reminder.
1.1.2.8. Access to features
Access paths to features are indicated as follows:
Access the menu File\Options.
1.1.3. Vocabulary
Appliance
Dialup
UTM Fxx
Firewall
Intrusion
prevention
Configuration
slot
Logs
Refers to the security device (firewall) that NETASQ develops.
Interface on which the modem is connected.
Refers to the NETASQ product range. Other terms also used: NETASQ Fxx, Fxx
appliance.
NETASQ UTM device /product
Unified Threat Management is also used in its place.
(or policy.). Configuration files which allow generating filter and NAT policies, for
example.
A record of user activity for the purpose of analyzing network activity.
1.1.4. Getting help
To obtain help regarding your product and the different applications in it:
website: www.netasq.com. Your secure-access area allows you to access a wide range of documentation
and other information.
user manuals: NETASQ UNIFIED MANAGER, NETASQ REAL-TIME and NETASQ EVENT REPORTER.
1.1.5. Introduction to NETASQ EVENT REPORTER
The NETASQ EVENT REPORTER is a module of the NETASQ Firewall Administration Suite. This
application program enables the display of log files generated by NETASQ Firewalls.
This data can be used to analyze your network activity, access to your computer systems, staff use of the
Internet (web sites visited, email use…) in order to diagnose hacking attempts detected and blocked by the
Firewall.
The data is displayed either in the form of tables, enabling a precise and detailed analysis, or in the form of
graphs, thus providing a consolidated, global display of the data.
NETASQ EVENT REPORTER’s logging functions enable displaying the events stored in each log file in one
of the following ways:
Copyright © NETASQ 2008
Page 12 sur 136
ENUG0810-V1.0_NEREPORTER-V8.0
USER GUIDE: PART 1: INTRODUCTION
selecting periods predefined in relation to the current date (“today”, “this weel”, etc.) or defined manually,
sorting (ascending/descending) by the value in each field in which a security event has been captured
hierarchical classifications according to the value of one or several fields in which a security event has
been captured.
The logs analyzed by the NETASQ EVENT REPORTER are either retrieved directly from the desired
Firewall, upon each request, or from the Syslog files, supplied by the NETASQ SYSLOG service. In the latter
case, the log files are stored locally on the administration machine.
REMARK
NETASQ SYSLOG and NETASQ EVENT REPORTER have to be installed on the same workstation.
This version retrieves the desired data upon each request, either from the Firewall or from the files supplied
by the Syslog service. It can also use PostgreSQL database.
(See Part 3\Chapter 1\point1).
DEFINITIONS
1) PostgreSQL (pronounced "post-grez-Q-L") is an object-relational database management system
that operates on UNIX and Windows systems.
PostgreSQL uses graphical interfaces to manage tables and libraries for many languages in
order to access files saved from programs such as Java, C and C++, Perl...It allows any
application that supports this type of interface to access PostgreSQL databases.
PostgreSQL works on a client-server architecture.
2) The Collector, when used together with a database that can collate and consolidate logs from
several Firewalls, can be used in conjunction with a Syslog or can collect logs directly on the
firewall. Administration of this Collector can be carried out in the meu Outils, which allows
connecting to the database.
CHAPTER 2: CONNECTION
1.2.1. Access
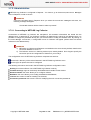
There are 2 ways to launch the NETASQ EVENT REPORTER application:
Via the shortcut Applications\Launch NETASQ EVENT REPORTER in the menu bar on other
applications in the Administration Suite.
If this is your very first time connecting to your product, a message will prompt you to confirm the serial
number (found on the underside of the appliance).
Via the
Reporter.
menu
Start\Programs\NETASQ\Administration
Suite
7.0\NETASQ
Event
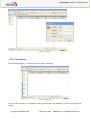
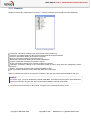
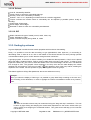
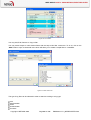
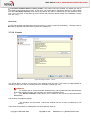
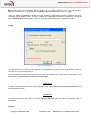
A connection window or the main window will open:
Copyright © NETASQ 2008
Page 13 sur 136
ENUG0810-V1.0_NEREPORTER-V8.0
USER GUIDE: PART 1: INTRODUCTION
Figure 1: Connection
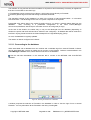
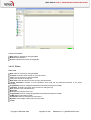
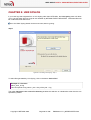
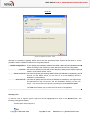
1.2.2. Connection
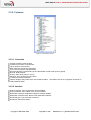
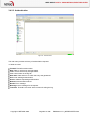
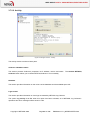
In the following window, you can select how you wish to view data:
Figure 2: Viewing data
You can either connect to a Firewall, use the log files saved in the database, or look up the Syslog files
directly.
Copyright © NETASQ 2008
Page 14 sur 136
ENUG0810-V1.0_NEREPORTER-V8.0
USER GUIDE: PART 1: INTRODUCTION
When NETASQ EVENT REPORTER is executed from the "Windows" menu, Windows will check whether
there is an address book. This address book, which is common to all NETASQ applications, may or may not
be encrypted. If it is encrypted, or does not yet exist, there will be an additional step before connecting
NETASQ EVENT REPORTER to the Firewall.
1.2.2.1. Direct connection to a NETASQ Firewall
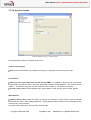
REMARK
This connection is recommended if you have only one firewall and the amount of logs generated is
fairly small.
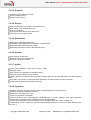
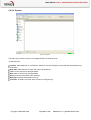
If the address book exists and is encrypted (see the section Part1/Chapter 2: Address Book for more
information on address book options), its password will be requested before every connection to Reporter on
each registered Firewall.
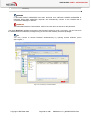
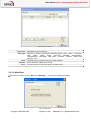
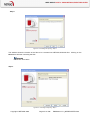
Figure 3: Address book - Password
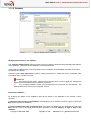
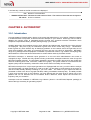
Next, NETASQ EVENT REPORTER will display a log grid and a connection popup which allow you to enter
connection information for a Firewall. This connection window can be accessed if the option Connect to
firewall has been selected. (See section Options).
To connect to a Firewall, use the menu Firewall in the tab Sources in the menu directory and select a
firewall. The following window will then open:
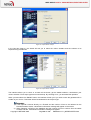
Figure 4: Connection
Address
NETASQ Firewall’s IP address or host name on the internal network
Username
User name for the configuration
Password
Password for the user.
Read only
Enables connecting to the Firewall in read-only mode. In this way, you can connect to
the firewall without modification privileges using an account that ordinarily has these
privileges. This allows avoiding the use of modification privileges if they are not
Copyright © NETASQ 2008
Page 15 sur 136
ENUG0810-V1.0_NEREPORTER-V8.0
USER GUIDE: PART 1: INTRODUCTION
necessary.
REMARK
If NETASQ EVENT REPORTER has been launched from NETASQ UNIFIED MANAGER or
NETASQ REAL-TIME MONITOR, Reporter will automatically connect to the Firewall that is
connected to Manager or Monitor.
WARNING
The NETASQ Firewall is case-sensitive, both for the user name as well as for the password.
The option Read Only enables connecting to the Firewall in read-only mode. In this way, you can connect to
the firewall without modification privileges using an account that ordinarily has these privileges.
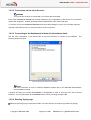
TIP
You may connect to several Firewalls simultaneously by opening several windows (menu
File\Open.).
Figure 5: Connecting to several firewalls
Copyright © NETASQ 2008
Page 16 sur 136
ENUG0810-V1.0_NEREPORTER-V8.0
USER GUIDE: PART 1: INTRODUCTION
1.2.2.2. Connection via the menu Sources
REMARK
This connection mode is recommended if you have a fleet of firewalls.
If the option Connect to firewall has not been selected in the configuration of the service, the connection
window will not appear. Instead, NETASQ EVENT REPORTER’s main window will open.
To connect, click on the tab Sources\Firewall, then select the firewall(s) on which you would like reporting.
(See the CHAPTER Sources for more information on this connection)
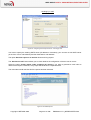
1.2.2.3. Connecting to the database(s) indicated in the address book
Use the menu Database in the Source tab of the menu directory to connect to the database. The
following window will open:
Figure 6: Selecting the firewall from a database
NOTE
For more information on how to install the database, please refer to the NETASQ Administration
Suite installation manual.
A window will allow you to select the Firewalls in the database in order to view logs from one or several
Firewalls. You may also select all the Firewalls from the list by checking the option All.
1.2.2.4. Reading Syslog logs
Select the menu Syslog in the Sources tab in the menu directory to analyze logs retrieve by Syslog.
Copyright © NETASQ 2008
Page 17 sur 136
ENUG0810-V1.0_NEREPORTER-V8.0
USER GUIDE: PART 1: INTRODUCTION
1.2.3. Address book
The address book can be accessed from the menu File\Address book.
Figure 7: Address book - Database
The address book centralizes all passwords for access to different modules (Firewall, Collector database,
Autoreport) and other application in the Administration Suite.
This information is stored on the same client workstation on which the interface has been installed. It may
be encrypted if you check the option Encrypt address book. In this case, you will be asked to enter an
encryption key. For each Firewall, indicate a name (you can select any name, which does not necessarily
have to correspond to the Firewall’s name), IP address, password and serial number.
WARNING
You are strongly advised to activate the encryption of the address book for obvious security reasons.
Once this information has been entered, you may save it using the “Save” button.
WARNING
If you modify the “Encrypt address book” option, the address book has to be saved once more to
apply the changes.
Check the option Show passwords to check the passwords used for each Firewall saved in the address
book (passwords are displayed in plaintext).
1.2.3.1. Adding an address
Click on the button Add to add an address to the address book. Other information to supply:
Name
The name of the firewall
Address
IP address of the firewall
User
Password
Description
The administrator account.
Administrator password
Description or comments regarding the firewall.
Copyright © NETASQ 2008
Page 18 sur 136
ENUG0810-V1.0_NEREPORTER-V8.0
USER GUIDE: PART 1: INTRODUCTION
1.2.3.2. Modifying the password for an address
The procedure for modifying the password for an address is as follows:
In the column “Password”, double-click on the password for an address that needs to be changed. A
window will open, allowing you to make the change.
Click on the OK button or close the address book. The following message will appear:
"The address book has been modified. Save changes?"
Click on the Yes button to confirm changes.
1.2.3.3. Deleting an address
Pour supprimer un firewall du carnet d’adresses, suivez la procédure ci-dessous:
Select the firewall to delete.
Click on the Delete button. The following message will appear:
"Confirm removal of these items?"
Click on Yes to confirm removal.
1.2.3.4. Importing an address book
The procedure for importing an existing address book is as follows:
Click on the Import button. The following window will appear:
Figure 8: Importing an address book
Select the file to import.
REMARK
Copyright © NETASQ 2008
Page 19 sur 136
ENUG0810-V1.0_NEREPORTER-V8.0
USER GUIDE: PART 1: INTRODUCTION
The file to import should be in .CSV format.
Click on Open.
For obvious security reasons, the address book can be encrypted. To activate encryption, check the option
Encrypt address book, then define the related password. This password is absolutely necessary for
reading information contained in the address book. The address book is encrypted in AES, which is
currently the most powerful symmetrical encryption algorithm.
1.2.3.5. Exporting an address book
All the information in the address book can be exported to be used, for example, for complementing another
address book. The procedure for exporting an existing address book is as follows:
Click on the Export button. The following window will appear:
The following message will appear:
"Encrypt address book? (highly recommended)"
If you click on Yes, you will be asked to enter the password for the address book before the save window
appears:
Figure 9: Exporting an address book
REMARK
The file to export should be in.dat format.
Click on Save.
Copyright © NETASQ 2008
Page 20 sur 136
ENUG0810-V1.0_NEREPORTER-V8.0
USER GUIDE: PART 2: GETTING FAMILIAR
PART 2: GETTING FAMILIAR WITH
REPORTER
CHAPTER 1: PRESENTATION OF THE INTERFACE
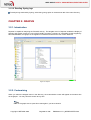
2.1.1. Main window
Once you are connected to the Firewall, Reporter’s main window appears.
Figure 10: Main window
It comprises six parts:
A menu bar.
A menu directory (to the left of the screen)
A date and filter selection bar (allowing only the analysis of data in the chosen period).
A result display zone.
An action bar
A status bar.
Copyright © NETASQ 2008
Page 21 sur 136
ENUG0810-V1.0_NEREPORTER-V8.0
USER GUIDE: PART 2: GETTING FAMILIAR
2.1.2. Menu bar
The main window contains the following menu bar:
Figure 11: Menu bar
File
Tools
AutoReport
Applications
Windows
? (Help)
Allows you to connect to the firewalls and to access options in the application.
Allows you to Manager Collector and to access UNIX Syslog.
Allows you to access reports, filters and the service configuration.
Allows you to directly launch the two other applications that make up the NETASQ
Administration Suite – NETASQ UNIFIED MANAGER et NETASQ REAL-TIME.
Position of the windows and icons in the application.
Allows access to the current help file and to find out Reporter’s version.
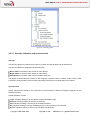
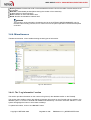
2.1.3. Menu directory
The menu directory consists of 2 tabs:
Sources
Logs
Enables specifying the source of the viewed logs (firewall, Syslog, database).
Concentrates all the operations in order to analyze data.
2.1.3.1. Sources tab
Figure 12: "Sources" tab
The Sources tab enables connection to different log sources provided by NETASQ for the analysis of logs
and events raised by the Firewall.
Firewall
When directly connected to the Firewall, this log retrieval method makes it possible to
dispense with the use of log centralization tools. However, it does not allow centralizing
the logs of several Firewalls, which is usually essential for analyzing an event that is
spreading on several company sites. Furthermore, this method is only available for
appliances that have a hard disk, as without it, logs cannot be saved directly on the
Firewall.
Copyright © NETASQ 2008
Page 22 sur 136
ENUG0810-V1.0_NEREPORTER-V8.0
USER GUIDE: PART 2: GETTING FAMILIAR
Syslog
Database
Log retrieval tool, which is available for all products. It is essential for appliances that do
not have hard disks in order to save their logs. By default, it is configured to listen on
UDP port 514.
When associated with a database that can combine and consolidate logs from several
Firewalls, Collector can be associated with a syslog or gather logs on its own on the
Firewall. Collector is administered in the Tools menu, which allows connection to the
database.
(These three actions in the Sources tab are explained in the Part 3/Chapter 1: Sources in this manual).
2.1.3.2. Logs tab
Figure 13: "Logs" tab
This tab contains five options, each distinguished by a colored icon:
Graphs
Network
Enables you to display - in the form of on-line graphs, vector graphs or
histograms - different types of Firewall data (security and system indicators,
processor consumption, throughput on different interfaces, quality of service).
Enables you to display – in the form of tables – all types of Firewall logs, which
are divided into 8 tables: Filter, alarms, connection, web, SMTP,
POP3, plugin and SEISMO.
REMARK
A ninth table appears whenever the user uses the Collector database: it lists the
fields to be found in WELF (WebTrend Enhanced Log Format) files.
Services
Statistics
Miscellaneous
Enables viewing different types of information and messages (administration on
the Firewall, authentication information and errors or IPSec and SSL VPN
information and errors) in the form of tables.
Enables you to display - in the form of tables - different types of statistics
(counters, filter rules created and address translation).
Enables you to retrieve various log data (amount of logs on the Firewall and on
the database). It is also possible to generate a file containing the addresses of
all the Internet sites consulted.
TIP
Copyright © NETASQ 2008
Page 23 sur 136
ENUG0810-V1.0_NEREPORTER-V8.0
USER GUIDE: PART 2: GETTING FAMILIAR
Selecting an entry that is already displayed will refresh data.
2.1.4. Date and filter selection bar
2.1.4.1. Selecting the date
Figure 14: Selecting the date
This bar enables you to define the period over which you wish to retrieve data. You may choose from among
a number of pre-defined periods:
manual selection (you may define any period whatsoever). This option enables you to extract personalized
data
last hour,
last six hours,
today,
yesterday,
this week,
this month,
this year,
last week,
last month,
last year,
all
last lines
Filters
You can select the filters to be applied on the columns and perform multi-criteria searches using the
selection button (see the section Part 3/Chapter 5: “Filter Constructor in this manual).
Figure 15: Filters
The selection of this option enables you to constitute data filters on each column. When you activate this
) appears at the far right of the columns. By selecting one of the
option, an arrow pointing downwards (
pre-entered values or entering a value of your own choice, you automatically limit the table data to those
corresponding to the filter on the selected column.
Then the arrow turns navy blue and the actual filter appears at the bottom of the table. A white cross enables
you to delete all the active filters at once.
Copyright © NETASQ 2008
Page 24 sur 136
ENUG0810-V1.0_NEREPORTER-V8.0
USER GUIDE: PART 2: GETTING FAMILIAR
2.1.5. Result display zone
Data and options from the selected menus appear in this zone, in the form of graphs or tables.
NOTE
These windows will be explained in further detail in the corresponding chapters.
2.1.6. Status bar
Figure 16: Status bar
This bar comprises 5 information zones:
A text zone displaying Reporter’s activity in real time,
A progress bar allowing an estimate of the duration of the operation,
A zone displaying the application’s status (whether processing is in progress or not, respectively
blue or green).
An icon displaying the status of the connection with the firewall,
An icon displaying the status of the connection with the database.
2.1.7. Action bar
Figure 17: Action bar
2.1.7.1. Columns
Customize
Reset
The columns of the table may be moved around, removed or. This option enables you to
select the columns you wish to display. A window comprising two tabs then appears,
enabling you to manage column headers and the columns. To add or delete a column
from the table, all you have to do is select the group of columns or column and drag it
either into the table or into the tools window.
Enables you to restore the original column display
Best fit
Enables you to adapt the width of the columns to the width of the application
Fit to screen
Enables you to adapt the width of the columns to the width of the application
Show totals
Subtotaling of packet volumes (sent, received, duration) for all logs viewed. When you
perform a sort (by dragging and dropping a column), a sub-total per sort may be viewed.
2.1.7.2. Print
With this option, you are able to access a print preview menu.
2.1.7.3. Export
Copyright © NETASQ 2008
Page 25 sur 136
ENUG0810-V1.0_NEREPORTER-V8.0
USER GUIDE: PART 2: GETTING FAMILIAR
Displayed data may be exported for it to be used in other environments. A Wizard will assist you in this
process. See Chapter 6: Data Export.
2.1.7.4. Import a WELF file
This option enables ordering Collector to load a log file in WELF format into the database.
2.1.7.5. See time
This option allows you to automatically calculate the date and time of the logs displayed in Reporter
according to different time zones depending on:
Your computer’s time zone,
The Firewall’s time zone,
GMT
Thus the date and time vary according to the option selected from those indicated above. Logs from a
firewall in London (GMT) can therefore be consulted on a workstation in Paris (GMT+1).
Example
An “antispam update" event was detected at midnight (London time). If the user selects the option “Your
computer’s time zone”, he will see this event at 1.00 a.m. (Paris time). However, if he selects the option
“The Firewall’s time zone”, at midnight he will see whether the firewall has been configured as it should
be in the London timezone.
CHAPTER 2: DESCRIPTION OF THE MENU BAR
2.2.1. File menu
The File menu allows the following:
Open
Enables connecting directly to a Firewall via its protocol.
REMARK
In the case of an U30 ou U70 Firewall, data is retrieved from files generated by Syslog (a
Firewall’s logs are retrieved by the Syslog service and transferred to the selected storage
unit).
Address
book
Options
Quit
Access to the NETASQ Administration Suite’s address book.
General configuration of the application, database and log options.
Closes all connections and exits the application.
2.2.2. Tools menu
Copyright © NETASQ 2008
Page 26 sur 136
ENUG0810-V1.0_NEREPORTER-V8.0
USER GUIDE: PART 2: GETTING FAMILIAR
The Tools menu allows the following:
Enables obtaining information on the status of NETASQ Log Collector and relaunching
it. NETASQ Log Collector is fully configured through this menu.
If you have logs from a Unix Syslog other than NETASQ’s, the Unix Syslog menu
wizard allows converting these logs to files that NETASQ Reporter can read.
Manage
Collector
Unix Syslog
2.2.3. AutoReport menu
The AutoReport menu allows the following:
Reports
Report
sections
Filters
Configuration
of the
service…
Date and interval at which reports are to be generated, the Firewalls concerned, sections
of the report and comments relating to the report.
Contents of the section, presentation of information and comments relating to the
section.
Definition of SQL Filters and log types. Examples: minor alarms only, major alarms only
logs coming only from the IP address x.x.x.x
Parameters of the database and location of the generated report.
2.2.4. Applications menu
The Applications menu enables connecting to other applications in the NETASQ Administration Suite.
Use these shortcuts instead of having to re-authenticate each time on each application.
Launch NETASQ
REAL-TIME
MONITOR…
Launch NETASQ
UNIFIED
MANAGER…
Enables opening the NETASQ REAL-TIME MONITOR application from the NETASQ
Administration Suite.
Enables opening the NETASQ UNIFIED MANAGER application from the NETASQ
Administration Suite, in Global Administration mode.
2.2.5. Windows menu
Arrange
icons
Cascade
Tile vertical
Tile
horizontal
Enables the organization of icons representing the Firewalls.
Cascades the windows connected to Firewalls or databases.
Enables vertically organizing windows which have not been reduced to icons.
Enables horizontally organizing windows which have not been reduced to icons.
Copyright © NETASQ 2008
Page 27 sur 136
ENUG0810-V1.0_NEREPORTER-V8.0
USER GUIDE: PART 2: GETTING FAMILIAR
2.2.6. ? menu (help)
Help
License
About
Displays a screen that accesses documentation in your secure-access area on
NETASQ’s website.
Enables retrieving a new downloaded license from a directory.
Displays the "about" box, indicating the software version of NETASQ EVENT
REPORTER. In the professional version, information on the REPORTER license is
found here: license version, organization name, contact name, e-mail address, and
unique user identification for technical support.
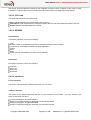
CHAPTER 3: OPTIONS
The Options sub-menu allows configuring the application, the database and logs.
Go to the menu File\Options to configure these options.
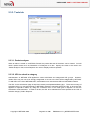
2.3.1. General tab
Figure 18: General options - General
Copyright © NETASQ 2008
Page 28 sur 136
ENUG0810-V1.0_NEREPORTER-V8.0
USER GUIDE: PART 2: GETTING FAMILIAR
2.3.1.1. Default language
The NETASQ EVENT REPORTER application is multilingual. Select the language required for the graphical
interface.
2.3.1.2. At startup
2 options are possible:
Open a grid: opens up a log grid when the application is opened.
Connection to the firewall: Authorizes a direct connection to the firewall.
2.3.1.3. Miscellaneous
Keep connection logs in a file: Enables you to generate logs concerning the application’s behavior.
Empty the log file each time the application is started: Enables you to have a file of limited volume and
to keep active logs only for the purpose of the application in progress.
2.3.1.4. Grid font
This option allows you to specify the font and font size of the text which appears in the log grid.
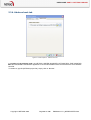
2.3.2. Log tab
Figure 19: General options - Log
Copyright © NETASQ 2008
Page 29 sur 136
ENUG0810-V1.0_NEREPORTER-V8.0
USER GUIDE: PART 2: GETTING FAMILIAR
2.3.2.1. When downloading from firewall
Local log cache: this option allows you to speed up log information searches which have already been
performed. Data is no longer sent from the Firewall when this option is selected and when data has already
been sent (data is then stored in an XML database). This option is inactive when working on the current day.
Keep local copy of WELF files from the firewall: Locally stores all the log files downloaded from the
Firewall.
The Clear local cache button, as its name implies, allows you to purge the local cache of downloaded logs.
2.3.4.2. Maximum number of downloaded lines
This option allows you to specify the maximum number of lines downloaded for a connection to the database
or to the Firewall. In order to facilitate loading and transforming logs, they can be displayed in 15,000 lines
per page when you select the option Download by page. If the specified period contains more than the
maximum number of lines, the logs will be loaded in cache, and a browsing system will enable the display of
15,000 lines per page each time (only in the case of logs directly downloaded from a Firewall).
Example
You have indicated that you wish to load a maximum of 500 log lines per page for the firewall. If the
number of lines exceeds this number, the button will become Page 1/2.
REMARK
This only applies to logs that have been directly downloaded from a Firewall.
2.3.4.3. Syslog file folder
REPORTER retrieves logs in files generated by Syslog.
The Modify button allows looking for a directory in which to save Syslog files.
Copyright © NETASQ 2008
Page 30 sur 136
ENUG0810-V1.0_NEREPORTER-V8.0
USER GUIDE: PART 2: GETTING FAMILIAR
2.3.3. Tools tab
Figure 20: General options - Tools tab
2.3.3.1. Packet analyser
When an alarm is raised on a NETASQ Firewall, the packet that set off the alarm can be viewed. You will
need a packet viewer such as Wireshark or Packetyzer to do this. Specify the viewer to be used in the
“Packet analyzer” field, so that Reporter can use it to display malicious packets.
2.3.3.2. URL to submit a category
Administrators of NETASQ UTM appliances cannot edit listed and categorized URL groups. However,
certain URLs may turn out to be wrongly categorized or are not in the list of URLs categorized by NETASQ.
To add URLs to the list of NETASQ URLs, administrators can submit these URLs to NETASQ’s website.
The URL for this submission page is http://www.netasq.com/updates/urlfiltering.php. There are two ways of
submitting URLs: by connecting directly to NETASQ’s website to manually specify the URL, or when the URL
appears in Reporter’s tables, by using the contextual menu of the Web grid in Reporter so that the
submission will be automatic. In order to do this, the URL to be submitted has to be specified in the “URL to
submit a category” field in Reporter.
Copyright © NETASQ 2008
Page 31 sur 136
ENUG0810-V1.0_NEREPORTER-V8.0
USER GUIDE: PART 2: GETTING FAMILIAR
2.3.4. Address book tab
Figure 21: General options - Address book tab
Location of the address book: the NETASQ UNIFIED MANAGER, NETASQ REAL-TIME MONITOR
and NETASQ EVENT REPORTER applications use the same address book and therefore the same address
book file.
To retrieve a .gap file (NETASQ project file), simply click on “Browse”.
Copyright © NETASQ 2008
Page 32 sur 136
ENUG0810-V1.0_NEREPORTER-V8.0
USER GUIDE: PART 3: USING NETASQ EVENT REPORTER
PART 3: USING NETASQ EVENT
REPORTER
CHAPTER 1: SOURCES
The Sources tab in the menu directory enables specifying the source of logs viewed (Firewall, Syslog and
database).
The Sources tab enables connection to different log sources provided by NETASQ for the analysis of logs
and events raised by the Firewall.
3.1.1. Firewall When directly connected to the Firewall, this log retrieval method makes it possible to dispense with the use
of centralization tools. However, it does not allow centralizing the logs of several Firewalls, which is usually
essential for analyzing an event that is spreading on several company sites. Furthermore, this method is
only available for appliances that have a hard disk, as without it, logs cannot be saved directly on the
Firewall. (See the section Connection for more information.)
3.1.1.1. Ways of connecting to the Firewall
A Firewall connection in the Sources tab enables performing three connection-related actions:
New: By clicking on this option, the address book opens automatically on the list of registered
Firewalls. This enables saving the address book of a new Firewall.
Connect to the Firewall: By clicking on this option, the connection window appears and allows
connections to the Firewall without the need to register it.
REMARKS
1) If a firewall was already connected, the following message will appear before the connection
screen appears: "Confirm disconnection?".
2) If you wish to remain connected while connecting to another firewall, access the menu bar and
select File\Open. A connection window will open, allowing you to authenticate in order to
access another firewall. You can be connected simultaneously to as many firewalls as you wish.
Firewall_xx: lastly, This option provides direct access to the list of registered Firewalls, allowing quick
connection to the selected Firewall.
3.1.2. Database Copyright © NETASQ 2008
Page 33 sur 137
ENUG0810-V1.0_NEREPORTER-V8.0
USER GUIDE: PART 3: USING NETASQ EVENT REPORTER
This software is a log retrieval tool that is available on all products and is absolutely necessary for appliances
that have no hard disk to save their logs.
The database gets its contents from Collector, which looks for logs directly on Firewalls.
Collector gathers logs from files that belong to NETASQ SYSLOG.
The operating principle of this database is to work in the manner of interconnected tables – it is therefore
less voluminous. The advantage for the user is a quicker response to his requests.
PostgreSQL also allows data to be rotated, therefore there is no need to manually delete data from the
database.
Now, according to a predefined configuration in the menu Tools\Manager
Collector\Database, data is kept for a duration that can be configured (in days).
At the end of this duration, the tables may or may not be destroyed from the database (depending on
whether the option had been selected when Collector was configured). All deleted data will be retrieved in
text files in Syslog format located in the folder Netasq\AS\7.0\*LogCollRel\Syslog_Dump.
As such, the database is regularly updated.
The rotation of data is configured via Collector.
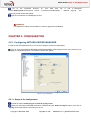
3.1.2.1. Connecting to the database
When associated with a database that can combine and consolidate logs from several Firewalls, Collector
can be associated with a syslog or gather logs on its own on the Firewall. Collector is administered in the
Tools\Manager Collector menu, which allows connection to the database.
Use the sub-menu Database in the Sources tab to connect to the NETASQ LOG COLLECTOR
database.
Figure 22: Selecting the firewall from a database
A window proposes the selection of Firewalls in the database in order to view the logs of one or several
Firewalls. You may also select all the Firewalls in the list by checking All.
Copyright © NETASQ 2008
Page 34 sur 137
ENUG0810-V1.0_NEREPORTER-V8.0
USER GUIDE: PART 3: USING NETASQ EVENT REPORTER
3.1.2.2. Reading Syslog logs
To analyze logs retrieved by Syslog, select the Syslog option in the Sources tab of the menu directory.
CHAPTER 2: GRAPHS
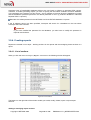
3.2.1. Introduction Reporter is capable of analysing the Firewall’s activity. The Graphs menu in Reporter enables the display of
Security and System events, the use of the firewall’s processor, indicaors of vulnerability levels supplied by
NETASQ SEISMO, throughput on the appliance’s interfaces as well as the use of each QoS rule.
Figure 23: Graphs
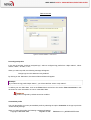
3.2.2. Customizing When you select the Graphs menu in the directory, the customization screen will appear at the same time
as the graphs. You may close this screen at any time.
TIP
Click on the graph zone to open this screen again if you have closed it.
Copyright © NETASQ 2008
Page 35 sur 137
ENUG0810-V1.0_NEREPORTER-V8.0
USER GUIDE: PART 3: USING NETASQ EVENT REPORTER
Figure 24: Customizing graphs
3.2.2.1. Security indicators and system events
Security
The security indicator is linked to the monitoring of alarm and events relating to the ASQ kernel.
The security indicator is weighted in several elements:
Minor alarms: indicators of the number of minor alarms.
Major alarms: indicators of the number of major alarms.
ASQ memory: indicators of the amount of ASQ memory left.
The display of these indicators is based on the weighting of system events in relation to each other in order
to present a coherent status of the Firewall (major alarms will have more weight than minor alarms).
System events
System indicators are linked to the monitoring of events relating to Ethernet interfaces supported by the
Firewall processor.
System indicators concern:
Logs: indicators relating to the occupation of space allocated to logs.
Ethernet: indicators relating to interface connectivity.
CPU: indicators relating to the load of the Firewall processor.
HA: indicators relating to the high availability set-up, if this is present on the Firewall.
Server: Indicators relating to some of the Firewall’s critical servers
Copyright © NETASQ 2008
Page 36 sur 137
ENUG0810-V1.0_NEREPORTER-V8.0
USER GUIDE: PART 3: USING NETASQ EVENT REPORTER
The display of these indicators is based on the weighting of system events in relation to each other in order
to present a coherent status of the Firewall (major alarms will have more weight than minor alarms).
3.2.2.2. CPU load
This graph represents the processor’s load.
User: load attributable to processes that the user executes
Interruptions: load represented by exchanges between the kernel and processes executed by the user
System events: load attributable to the kernel
3.2.2.3. SEISMO
Vulnerabilities
Vulnerability indicators concern the following:
Total
Remote: refers to vulnerabilities that can be exploited remotely (via the network).
Target server: vulnerability that affects a server application.
Critical
Minor
Major
Fixed: refers to vulnerabilities for which a fix is available.
Information
Information indicators concern the following:
Total info
Minor info
Major info
Monitored
3.2.2.4. Interfaces
List of interfaces
This section sets out the list of different interfaces (In, Out, Dmz).
Traffic by interface:
This section of the graphs represents the use of each interface on the Firewall. For every interface, four
types of information are given:
Incoming throughput: At a given moment.
Maximum incoming throughput: Observed over the defined period.
Outgoing throughput: At a given moment.
Maximum outgoing throughput: Observed over the defined period.
Copyright © NETASQ 2008
Page 37 sur 137
ENUG0810-V1.0_NEREPORTER-V8.0
USER GUIDE: PART 3: USING NETASQ EVENT REPORTER
3.2.2.5. QoS
List of QoS rules
This section sets out the list of different Qos (Qualities of service) defined on the firewall.
DEFAULT
HTTP
DNS
CIFS
SSH_priq
SSH_Ext
Squid
FTP
Traffic by QoS
Incoming bandwidth: At a given moment.
Maximum incoming bandwidth: Observed over the defined period.
Outgoing bandwidth: At a given moment.
Maximum outgoing bandwidth: Observed over the defined period.
3.2.2.6. Graphs options
Full precision for longs periods
When this option is checked, all the points in the period are taken into account. However, for very long
periods, only certain significant points are taken in order to prevent the graph from getting too crammed.
Percentage of CPU up to 100%
When this option is selected, the scale at which the processor’s load is plotted is dynamic. Therefore, if the
processor’s load is light, graphs (scale) will be adapted so that the administrator can read them. Otherwise,
the maximum value of the scale will remain at 100% regardless of the maximum value obtained up until then.
CHAPTER 3: CUSTOMIZING COLUMNS AND HEADERS
The names of the following columns correspond to the data that may be consulted in Network logs. These
columns are grouped according to the type of data, under headers.
To start customizing your headers and columns, open a log file in the Logs tab, click on the Columns
button (in the action bar)\Customize.
Figure 25: Button bar
Copyright © NETASQ 2008
Page 38 sur 137
ENUG0810-V1.0_NEREPORTER-V8.0
USER GUIDE: PART 3: USING NETASQ EVENT REPORTER
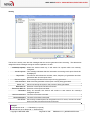
3.3.1. Headers Headers are thematic classifications of columns. Columns under the same header are place adjacently.
Figure 26: Customizing headers
Lines-date: Information relating to the line and time of the packet’s log
Interface: Information relating to the interface through which the packet passed.
Protocol: Information relating to the packet’s protocol.
Source: Information relating to the packet source.
Destination: Information relating to the packet’s destination
Volume: Information relating to the packet’s volume.
Action: Information relating to the volumes of data in the packet.
Operation: Information relating to the commands carried out when using protocols managed by plugins
and proxies.
Seismo: Information relating to the NETASQ SEISMO module.
SIP: Information relating to media, caller and callee of the SIP plugin.
When you deselect an option that is linked to a header in the grid, the column will be deleted for that grid.
Example
For “Alarm” logs, you have deselcted the header Line-date. The header adn the options associated with it
will be removed from the grid. The other log files will nonetheless maintain this header.
If you disconnect and reconnect to the firewall, changes to the customization will be saved.
Copyright © NETASQ 2008
Page 39 sur 137
ENUG0810-V1.0_NEREPORTER-V8.0
USER GUIDE: PART 3: USING NETASQ EVENT REPORTER
3.3.2. Columns
Figure 27: Customizing columns
3.3.2.1. Lines-date
Firewall: Firewall’s serial number
Firewall name: Name of the firewall.
Ligne: Number of the log line.
Date: Date the log line was generated
Time: Time the log line was generated.
Slot level: Number corresponding to the classification of filter rules (local or global).
Rule ID: Rule identifier.
Priority: Alamr level (major or minor).
Saved at: Time at which log was saved.
Timezone: Firewall’s timezone.
Packet: Displays the packet which had raised the alarm. This feature has to be configured on Monitor in
the Administration Suite.
3.3.2.2. Interface
Source interface: Source interface’s network adapter.
Source interface name: Name of the source interface.
Destination interface: Destination interface’s network adapter.
Destination interface name: Name of the destination interface.
Movement type: Type of packet movement.
Movement: Packet movement.
Copyright © NETASQ 2008
Page 40 sur 137
ENUG0810-V1.0_NEREPORTER-V8.0
USER GUIDE: PART 3: USING NETASQ EVENT REPORTER
3.3.2.3. Protocol
Internet Protocol: Internet Protocol
Protocol: Base protocol.
Group: Protocol group.
3.3.2.4. Source
Source name: Source IP address or resolved name.
User: Name of the authenticated user.
Source: IP address.
Source port name: Name of the source port.
Source port: Source port number.
3.3.2.5. Destination
Destination: Destination IP address.
Destination name: Destination IP address or resolved name.
Destination port: Destination port number.
Destination port name: Name of the destination port.
3.3.2.6. Volume
Sent: Amount of data sent.
Received: Amount of data received.
Duration: Connection duration
3.3.2.7. Action
Action: Filter rule action: “none”, “pass”, “block”, “reset”.
Message: Alarm.
Help: Links to an explanation of the alarm raised.
Alarm ID: Alarm’s identifer on the Firewall.
Repeat: Number of times the alarm has been repeated within the duration specified in the Administration
Suite.
Rule name: This column contains the value specified in the “Name” field in the filter rule editor.
Class: Class to which the raised alarm belongs.
3.3.2.8. Operation
Category: Category to which the URL having caused the generation of logs belongs.
Operation: Protocol’s identified command.
Result: Error message return code.
Argument: Operation’s parameter.
Spam level: Spam level: 0 (message not considered spam) 1, 2 and 3 (spam) x (error when processing
message) and ? (the nature of the message could not be determined).
Virus: Indicates whether the e-mail contains a virus. Possible values are “safe”, “infected”, etc
Classification: Generic category in which the alarm belongs (Examples: Protocol, Content_filtering, Web,
Mail, FTP…)
Copyright © NETASQ 2008
Page 41 sur 137
ENUG0810-V1.0_NEREPORTER-V8.0
USER GUIDE: PART 3: USING NETASQ EVENT REPORTER
3.3.2.9. Seismo
Vuln ID: Vulnerability identifier.
Family: Family to which the vulnerability belongs.
Severity: Level of the vulnerability’s criticality.
Solution: “Yes” or “no”, depending on whether there is a solution suggested.
Exploit: Indicates the location where a vulnerability can be exploited (2 possible options: locally or
remotely).
Client target: Client target.
Server target: Server target.
Detected on: Date on which the vulnerability was detected.
3.3.2.10. SIP
Media: Indicates the type of media (control, audio, video, etc)
Caller: Indicates the caller
Callee: Indicates the party being called, ie, callee
3.3.3. Sorting by columns Logs are displayed in a table that has certain properties which enhance data reading.
Firstly, it is possible to sort the data according to type (alphabetical, date, bytes etc.), in ascending or
descending order. In order to do so, click on the header of the column selected. An arrow pointing upwards
or downwards enables you to confirm that the sorting has been carried out.
A grouping system, in the form of nodes, enables you to isolate the data requested. A "drop" zone is placed
above the table; it reads as follows: "Drag a column header here to group by that column". In order to group
together the data of any one column, select the header of the column and drag it into this zone. The table will
then change its form. The grouped column appears in the drop zone and the table displays the values
sign appears in front of the group values, enabling the
resulting from this grouping, in the form of nodes. A
expansion of the nodes. It is thus possible to group data together within the groups.
This feature applies to all logs files (Network, Services and Statistics).
Example
When you select the display of Web logs, it is possible to group data firstly according to the user and
then according to the destination, in order to highlight the Internet consultations carried out by internal
users.
Figure 28: Sorting columns
TIP
The order of the table columns may be customized using the "drag and drop" mechanism. This can
be done by right-clicking and keeping the mouse button depressed on the column whose order you
wish to modify, then dropping it to its desired location. Two green arrows will help you to locate this
new location.
Copyright © NETASQ 2008
Page 42 sur 137
ENUG0810-V1.0_NEREPORTER-V8.0
USER GUIDE: PART 3: USING NETASQ EVENT REPORTER
Columns cannot be moved under a different header.
3.3.4. Contextual menu In each log grid in Reporter, contextual menus (accessible by right-clicking with the mouse) enable the quick
execution of specific actions. A maximum of three options are defined for the contextual menu (depending
on the information on which you right-click):
Copy line to clipboard as WELF: This option enables rewriting a line in the Reporter log grid to the
clipboard to be used outside Reporter.
Submit URL to a category: when you open the contextual menu after having selected a URL, this option
allows sending the URL to the URL submission form on NETASQ’s website.
Go to xxxxxx: when you open the contextual menu after having selected a destination, this option
enables an HTTP connection attempt to this destination
CHAPTER 4: LOG TYPES
NETASQ EVENT REPORTER allows you to view logs in the form of tables. These files comprise three
menus:
Network
Services
Statistics
3.4.1. "Network" logs
Filters: logs generated by the filter rules. To obtain these logs, at least one of the filter rules must have
the Log option.
Alarms: alarms raised by the firewall.
Connections: information on all the authorized connections having passed through the Firewall.
Web: logs from visited web sites (HTTP plugin and HTTP proxy).
SMTP: e-mail logs generated by the SMTP proxy. The SMTP proxy has to be activated for these logs to
be available.
POP3: e-mail logs generated by the POP3 proxy. The POP3 proxy has to be activated for these logs to
be available.
Plugins: information regarding plugins activated on your Firewall (except the HTTP plugin).
SEISMO: information regarding vulnerabilities found on your network.
FTP: Transferred log files (FTP proxy).
WELF files: visible in the database.
(See Customizing columns and header, Part 3, CHAPTER to get a better description of the table).
3.4.1.1. Web
Right-clicking on a destination name will display the contextual menu that allows you to:
Submit URL to a category: when you open the contextual menu after having selected a URL, this option
allows sending the URL to the URL submission form on NETASQ’s website.
Copyright © NETASQ 2008
Page 43 sur 137
ENUG0810-V1.0_NEREPORTER-V8.0
USER GUIDE: PART 3: USING NETASQ EVENT REPORTER
This form will also enable putting a URL into a category and to submit a new URL category.
Figure 29: URL category form
3.4.1.2. SEISMO
21 fields are used:
Line: Line number in the logs.
Date: Date on which recorded logs were generated.
Time: Time at which recorded logs were generated.
Internet Protocol: Name of the internet protocol used.
Protocol: Name of the protocol used.
User: Connection identifier.
Source name: source address of the connection.
Source port name: source port of the connection.
Message: command line sent to the firewall.
Argument: complementary information associated with the log line (contacted web page).
Vuln ID: Vulnerability identifier
Family: Family type to which the vulnerability belongs.
Severity: Level of criticality of the vulnerability.
Solution: Indicates with a “yes” or “no” whether a solution is offered.
Exploit: The solution may be accessed locally or remotely (via the network). It allows exploitation
of the vulnerability.
Product: Name of the client application.
Service: Name of the server application.
Detail: self-explanatory
Client target: Client target
Server target: Server target
Detected: Date on which the vulnerability was detected.
3.4.1.3. FTP
11 fields are used:
Copyright © NETASQ 2008
Page 44 sur 137
ENUG0810-V1.0_NEREPORTER-V8.0
USER GUIDE: PART 3: USING NETASQ EVENT REPORTER
Line: Line number in the logs.
Date: Date on which recorded logs were generated.
Time: Time at which recorded logs were generated.
User: Connection identifier.
Source name: source address of the connection.
Destination name: destination address of the connection.
Destination port name: destination address port of the connection.
Received: Volume received.
Action: Action to perform – “Pass”, “Block” or “Scan”.
Message: command line sent to the firewall.
Operation: Indicates FTP commands (LIST, RETR, QUIT…)
Virus: Indicates the name of the detected virus.
3.4.2. "Services" logs
3.4.2.1. Introduction
5 services are available:
Administration.
Authentication.
System.
IPSec VPN
SSL VPN.
Copyright © NETASQ 2008
Page 45 sur 137
ENUG0810-V1.0_NEREPORTER-V8.0
USER GUIDE: PART 3: USING NETASQ EVENT REPORTER
3.4.2.2. Administration
Figure 30: Administration
A history of all commands transmitted to the Firewall is given in this sub-menu.
11 fields are used:
Firewall: Firewall’s serial number.
Date: Date on which the entry was generated
Time: Time at which the entry was generated.
Line: Line number in the log file.
Date-time: Date and time on which the entry was generated.
Result: error message.
User: connection identifier,
Source: connection’s source address
Session id: 00.0000 format. The first two digits correspond to the number times the Firewall has been
reinitialized, the following 4 correspond to the number of connections on the Firewall
Message: command line sent to the Firewall.
Timezone: Firewall’s time zone at the moment of writing the log.
Copyright © NETASQ 2008
Page 46 sur 137
ENUG0810-V1.0_NEREPORTER-V8.0
USER GUIDE: PART 3: USING NETASQ EVENT REPORTER
3.4.2.3. Authentication
Figure 31: Authentication
This sub-menu provides a history of authentication requests.
11 fields are used:
Firewall: Firewall’s serial number
Date: Date on which entry was generated
Time: Time at which entry was generated.
Line: Line number in the log file.
Date-time: Date and time on which the entry was generated.
User: user seeking authentication,
Source: address requesting authentication
Method: Authentication method
Result: Error message.
Message: return message for the request.
Timezone: Firewall’s time zone at the moment of writing the log.
Copyright © NETASQ 2008
Page 47 sur 137
ENUG0810-V1.0_NEREPORTER-V8.0
USER GUIDE: PART 3: USING NETASQ EVENT REPORTER
3.4.2.4. System
Figure 32: System
This sub-menu provides a history of messages linked to Firewall services.
7 fields are used:
Firewall: When Reporter is connected to Collector, this field indicates the firewall that the displayed log
line concerns,
Date-time: Date and time on which the entry was generated.
Time: Time at which entry was generated.
Date: Date on which entry was generated
Service: service associated to the message,
Message: message associated to the log.
Timezone: Firewall’s time zone at the moment of writing the log.
Copyright © NETASQ 2008
Page 48 sur 137
ENUG0810-V1.0_NEREPORTER-V8.0
USER GUIDE: PART 3: USING NETASQ EVENT REPORTER
3.4.2.5. IPSec VPN
Figure 33: IPSec VPN
This sub-menu provides a history of events concerning IPSec VPN.
16 fields are used:
Firewall: When Reporter is connected to Collector, this field indicates the firewall that the displayed log
line concerns,
Line: Line number in the log file.
Date-time: Date and time on which the entry was generated.
Date: Date on which entry was generated
Time: Time at which entry was generated.
Result: Error message.
Phase: SA negotiation phase (Corresponds to a VPN tunnel endpoint)
Source: connection’s source address
Destination: connection destination address,
Message: Message regarding the attempt to set up a tunnel
Timezone: Firewall’s time zone at the moment of writing the log.
User: user identifier (in the context of an anonymous tunnel),
Initiator Cookie: “Initiator” identifier for the negotiation session in progress,
Receiving Cookie: “Responder” identifier for the negotiation session in progress.
Spi in: identifier for the ingoing SA.
Spi out: identifier for the outgoing SA.
3.4.2.6. SSL VPN
This sub-menu provides a history of events concerning SSL VPN.
Copyright © NETASQ 2008
Page 49 sur 137
ENUG0810-V1.0_NEREPORTER-V8.0
USER GUIDE: PART 3: USING NETASQ EVENT REPORTER
15 fields are used:
Firewall: When Reporter is connected to Collector, this field indicates the firewall that the displayed log
line concerns,
Line: Line number in the log file.
Date-time: Date and time on which the entry was generated.
Date: Date on which entry was generated
Time: Time at which entry was generated.
Timezone: Firewall’s time zone at the moment of writing the log.
Result: Result of the SSL VPN connection to the selected server
Port: server connection port.
Port name: protocol generally associated with a given port,.
Source: connection’s source address
Destination: connection destination address,
Destination name
Message: Message relating to the SSL VPN connection.
User: user identifier.
Argument: additional information regarding the log line (web page contacted)..
3.4.3. “Statistics" Logs 3.4.3.1. Introduction
3 types of statistical analyses are available:
Counters,
Filters,
Address translation.
3.4.3.2. Counters
This table corresponds to the number of times a rule has been activated. To display information in this zone,
the Count option must have been activated in the filter rules.
Copyright © NETASQ 2008
Page 50 sur 137
ENUG0810-V1.0_NEREPORTER-V8.0
USER GUIDE: PART 3: USING NETASQ EVENT REPORTER
Figure 34: Count
3 fields are available:
Date: Date on which entry was generated
Rule ID: Rule identifier.
Count: Indicates the number of megabytes.
3.4.3.3. Filters
Filter stats
Date: Date on which entry was generated
Firewall: Firewall’s serial number or name (if known).
Time: Time at which entry was generated.
Line: Line number in the log file.
Date-Time: Date and time on which the entry was generated.
Saved evaluation: Number of rule evaluations that could not be performed because of the ASQ
technology.
Fragmented: Number of fragmented packets transmitted through the firewall.
Timezone: Firewall’s time zone at the moment of writing the log.
Slot: Number of the activated policy.
Real host
Host: Memory allocated to a host.
Fragmented: Number of fragmented packets transmitted through the firewall.
ICMP: Memory allocated to ICMP.
Connection: Memory allocated to connections.
Dynamic: Percentage of ASQ memory being used
Track: -
Copyright © NETASQ 2008
Page 51 sur 137
ENUG0810-V1.0_NEREPORTER-V8.0
USER GUIDE: PART 3: USING NETASQ EVENT REPORTER
Memory
Logged: Number of log lines generated
Log overflow: Number of log lines lost.
Accepted: Number of packets matching “Pass” rules
Blocked: Number of packets matching “Block” rules
Rules
Rule (n:nn): Number of times that a rule has been applied to a packet. In brackets, the first number
indicates the number of the policy and the second refers to the number of the rule in this policy.
Bytes
TCP: Number of bytes from TCP packets transmitted through the firewall.
UDP: Number of UDP packets transmitted through the firewall.
ICMP: Number of ICMP packets transmitted through the firewall.
Packets
TCP: Number of TCP packets transmitted through the firewall.
UDP: Number of UDP packets transmitted through the firewall.
Connections
Rule ID: Rule identifier.
Filtered: -
Filtered
Facts: Overflow: Number of log lines lost.
TIP
If you select a line from a developed node, an explanation appears in the button bar situated below
the table.
3.4.3.4. Address translation
10 fields are available:
Date: Date on which entry was generated
Mapped to (mappedin): Number of incoming packets translated.
Mapped to (mappedout): Number of outgoing packets translated.
Added: Number of new active sessions.
Expired: Number of expired sessions.
Copyright © NETASQ 2008
Page 52 sur 137
ENUG0810-V1.0_NEREPORTER-V8.0
USER GUIDE: PART 3: USING NETASQ EVENT REPORTER
Memory failure: Packets that could not be translated because the limit for the table of active sessions had
been reached.
Bad NAT: Untranslated packets (failure during the creation of new sessions).
In use: Number of active sessions.
Rules: Number of active translation rules.
Wilds: Number of translations marked "wild".
REMARK
The frequency of the calculation of statistics can be set in NETASQ UNIFIED MANAGER, only for
the filter rules including counters; this is carried out over the period specified in the advanced options
of the slot.
3.4.4. Miscellaneous The Miscellaneous menu enables viewing several types of information.
Figure 35: Miscellaneous
3.4.4.1. The "Log information" section
This section provides information on the number of log lines (in the database and/or on the Firewall).
This section also enables viewing the difference between logs saved on the Firewall and logs saved in the
database (when a “connect to Firewall and database simultaneously” connection has been selected. A color
system will highlight the lines on which there are delays.
To update information, click on the “Get info” button.
Copyright © NETASQ 2008
Page 53 sur 137
ENUG0810-V1.0_NEREPORTER-V8.0
USER GUIDE: PART 3: USING NETASQ EVENT REPORTER
If you possess modification privileges, an additional column will appear, enabling the selection of logs to be
deleted on the Firewall using the “Clear on firewall” button. Archived logs will then be deleted.
Delete
The selected line will be deleted if this option is checked.
Name
Name given to the table. This name always begins with “Log”.
Lines
Total number of lines for a given table. The number of lines per day is indicated
in brackets.
Date on which lines started being generated.
Start
End
Date on which lines stopped being generated.
3.4.4.2. The “Generate URLs” section
This section generates a list of web addresses visited by users in an HTML file in the case URL filtering has
been activated. This list can be used to indicate to NETASQ UNIFIED MANAGER new URLs to filter.
Click on the “Generate” button to generate this HTML file. A screen will appear, allowing you to name the
file and save it in a folder of your choice.
3.4.4.3. The “Firewall information” section
This section provides information on the Firewall to which Reporter is connected: Firewall identifer (serial
number), Firewall name, username, logs sent by Syslog (if data had been retrieved via Syslog), HA: high
availability status and timezone.
3.4.4.4. The “Firewall DB session list” section
REMARK
This section becomes visible when several firewalls are selected in the database.
Only if Reporter is connected to the database.
CHAPTER 5: FILTER CONSTRUCTOR
NETASQ EVENT REPORTER allows you to apply filters on columns and to carry out multi-criterion
searches.
Users benefit (for search options) from the advantages of the SQL language in the database.
Example
Filtering on major alarms enables the retrieval of logs indicated as major alarms.
The “Filters” button in the date and filter selection barwill be enabled when you are in the database. SQL
queries are built from these filters.
When you click on this button, the filter configuration screen will appear:
Copyright © NETASQ 2008
Page 54 sur 137
ENUG0810-V1.0_NEREPORTER-V8.0
USER GUIDE: PART 3: USING NETASQ EVENT REPORTER
Figure 36: List of filters
You may Add, Edit, Remove or Copy a filter.
You may create simple or multi-criterion filters with the help of this filter constructor. To do so, click on the
“Add” button to open a contextual menu which will allow you to create a simple filter or a metafilter.
Figure 37: Filter constructor
The type of log filter can be selected in order to search according to a log type:
<All>
Administration
Alarm
Authentication
Counters
Copyright © NETASQ 2008
Page 55 sur 137
ENUG0810-V1.0_NEREPORTER-V8.0
USER GUIDE: PART 3: USING NETASQ EVENT REPORTER
Connection
Filter stats
Filters
FTP
Monitor
NATt stats
Plugins
POP3
Seismo
SMTP
NAT stats
Filter stats
System
IPSec VPN
SSL VPN
WEB
It is possible to apply the following operators for each field:
=: the value of the field is strictly equal
like: the value of the field contains a defined character chain
>=: the value of the field is greater than or equal
<=: the value of the field is smaller than or equal
not like: the value of the field does not contain a defined character chain
<>: the value of the field is strictly different
starts with: the value of the field begins with a defined character chain
ends with: the value of the field ends with a defined character chain
does not start with: the value of the field does not begin with the character chain
does not end with: the value of the field does not end with the character chain
The “Value” chain allows the value, which may be a character chain or a digital value, to be written.
Filters may be added and therefore multi-criterion searches may be created with the help of the Add, Edit,
and Remove buttons, and the Operator with the “OR” or “AND” values.
Once the filter has been created, select the option Active to activate the filter, then refresh the log display.
3.5.1. Adding a filter
3.5.1.1. Simple filter
From the list of filters, click on “Add” then “Simple filter”. The following window will appear:
Copyright © NETASQ 2008
Page 56 sur 137
ENUG0810-V1.0_NEREPORTER-V8.0
USER GUIDE: PART 3: USING NETASQ EVENT REPORTER
Figure 38: Filter constructor
Filter name
Filter type
Fields
Operator
Value
Indicates the name of the filter
Selection of the filter type from the following options: “web”, “alarm”, “connection”,
“filter”, “SMTP”, “Plugin”, “POP3”, “SSL VPN”, “SEISMO”, “Authentication”,
“Administration”, “NAT stats”, “filter stats”, “Counters”, “System”, “IPSec VPN”,
“Monitor”, “FTP”.
The fields vary according to the type of filter selected.
List of operators to apply to each field.
The value may be a character string or a digital value.
3.5.1.2. Meta-filter
From the list of filters, click on “Add” then “Meta-filter”. The following window will appear:
Figure 39: Meta-filter
Copyright © NETASQ 2008
Page 57 sur 137
ENUG0810-V1.0_NEREPORTER-V8.0
USER GUIDE: PART 3: USING NETASQ EVENT REPORTER
Meta filter name
Indicates the name of the meta filter
CHAPTER 6: DATA EXPORT
3.6.1. Export Click on the “Export” button in the action bar of the Logs tabs to export data.
A wizard will guide you in exporting your data. Data can be exported in 4 formats:
Figure 40: Export wizard - Step 1
TXT.
XML.
HTML.
XLS.
If you select the TXT format, during Step 2, the assistant will prompt you to choose a field separator as
shown in the example below:
Copyright © NETASQ 2008
Page 58 sur 137
ENUG0810-V1.0_NEREPORTER-V8.0
USER GUIDE: PART 3: USING NETASQ EVENT REPORTER
Figure 41: Export wizard - Step 2
In the last step (Step 3), the wizard will ask you to select the column headers and the columns to be
exported using checkboxes.
Figure 42: Export wizard - Step 3
The interface allows you to check or uncheck all the boxes, get the default selection, save/restore your
column selection. Each export type has its own backup. By checking a box, you automate this operation.
When you later select the “Finish” button, the interface will ask you if you wish to save the generated file in
a folder of your choice. This folder will be remembered for each export type.
REMARKS
1) If the Reporter connects directly to a Firewall and the number of lines to be retrieved on the
Firewall exceeds 10,000, a download confirmation message will appear on the screen.
2) When Reporter connects to the database and the number of lines to retrieve from the tables
exceeds 100,000, a download confirmation message will appear.
Copyright © NETASQ 2008
Page 59 sur 137
ENUG0810-V1.0_NEREPORTER-V8.0
USER GUIDE: PART 3: USING NETASQ EVENT REPORTER
3.6.2. Log format The logs are in WELF (WebTrends Enhanced Log Format) format.
id (undetermined type): Firewall identifier or its name when the Firewall’s logs are gathered by Syslog,
line (whole type): number of the Firewall log line (alphabetical type): Firewall serial number,
time (Log_Time, type date): date of the log line,
pri (whole type): priority of the event (alarm ref.),
srcif (alphabetical type): source interface,
srcifname (alphabetical type): interface name,
dstif (alphabetical type): destination interface,
dstifname (alphabetical type): destination interface name,
movement (whole type): direction of movement (in to in, in to out, out to out, out to in),
MoveTypeMS (whole type): direction of movement (Server to Server, Server to Client, Client to Client,
Client to Server),
ipproto (alphabetical type): Internet protocol,
proto (alphabetical type): protocol,
src (alphabetical type): source address (IPV6 ready),
srcport (alphabetical type): source port,
srcportname (alphabetical type): source port name,
srcname (alphabetical type): name of the source,
dst (alphabetical type): destination address (IPV6 ready),
dstport (alphabetical type): destination port,
dstportname (alphabetical type): name of destination port,
dstname (alphabetical type): destination name,
user (luser, alphabetical type) ,
ruleid (whole type): filter rule identifier,
action (chain type): action, reserved word for interbase,
msg (alphabetical type): ,
sent (whole type): amount of data sent,
rcvd (whole type): amount of data received,
duration(real type): duration,
op(alphabetical type): operation,
result(alphabetical type): ,
arg (alphabetical type): command parameters (of a web page).
CHAPTER 7: NETASQ LOG COLLECTOR
NETASQ Log Collector is a utility that retrieves all logs stored on NETASQ appliances or gathered by a
NETASQ SYSLOG, and stores them in a PostgreSQL database.
3.7.1. Log Collector service Copyright © NETASQ 2008
Page 60 sur 137
ENUG0810-V1.0_NEREPORTER-V8.0
USER GUIDE: PART 3: USING NETASQ EVENT REPORTER
NETASQ Log Collector is installed as a service: "NETASQLogCollector". For the user, this mode has the
advantage of running transparently (as a background task). In addition, the service continues to run even
without having to open the Windows session.
NOTE
Only in Windows NT, 2000 or XP.
3.7.1.1. Installing theservice
The Log Collector service will automatically be installed upon the installation of NETASQ Log Collector if you
have selected Server or Full during installation. However, it is possible to install it by launching an
application
found
in
the
menu
Start\Programs\NETASQ\Administration
Suite
7.0\Services\Install – Launch the Collector.
Otherwise, the complete procedure is as follows:
Go to the NETASQ directory on
Files\NETASQ\Administration Suite 7.0\
your
hard
disk
(as
a
rule
C:\Program
Open InstallLaunchFwLogCollector.bat. The command prompt window will appear.
Type the following installation command:
START /WAIT LogCollRel.exe /INSTALL /SILENT
Type the
following service start-up command:
NET START NETASQLogCollector
Once the service has been installed, it will be executed at each reboot even if no session has been opened.
3.7.1.2. Uninstalling the service
The NETASQ Log Collector service may be uninstalled with the help of an application found in the menu
Start\Programs\NETASQ\Administration
suite
7.0\Services\Shutdown –
remove
Collector.
Otherwise the complete procedure is as follows:
Go to the NETASQ directory on
Files\NETASQ\Administration Suite 7.0\
your
hard
disk
(as
a
rule
C:\Program
Open UninstallFwLogCollector.bat. The command prompt window will appear.
Type the following shutdown command:
START /WAIT NET STOP NETASQLogCollector
Type the command for uninstalling the service:
LogCollRel.exe/UNINSTALL/SILENT
REMARK
You are advised to shut down and restart the PostgreSQL service with the help of the Service
Manager included in Windows NT, 2000 and XP.
Copyright © NETASQ 2008
Page 61 sur 137
ENUG0810-V1.0_NEREPORTER-V8.0
USER GUIDE: PART 3: USING NETASQ EVENT REPORTER
3.7.2. Administration NETASQ Log Collector is configured in Reporter. You have to go to the Tools\Collector Manager
menu in Reporter in order to do this.
WARNING
If there are windows open in Reporter when you select the Collector Manager sub-menu, the
following message will appear:
"Connected windows will be closed in order to proceed."
3.7.2.1. Connecting to NETASQ Log Collector
Connections to NETASQ Log Collector are transparent. All connetion informations are stored into the
address book. A password for Log Collector is defined by default and is stored in the address book. It is
possible to change this password directly but you will have also to modify the address book. By clicking on
the menu Manage Collector, a configuration menu for Collector will appear (unless there are several
collectors in the address book):
WARNING
1) NETASQ Log Collector and Reporter are installed on the same host by default, therefore the
connection address is 127.0.0.1
2) The Collector service is in listening mode on port 1380 by default. Don’t forget to specify the
connection port in the configuration of Collector if you modify it
The configuration menu of NETASQ Log Collector comprises two sections:
On the left, a directory of the various features in the NETASQ Log Collector menu
On the right, all options that can be configured
The following sub-menus are found in the NETASQ Log Collector configuration menu:
Activity: this screen offers a view of NETASQ Log Collector’s activity,
Firewalls and logs: logs can be directly downloaded from firewalls via this window.
Advanced mode: this menu allows you to configure collector,
Database: this menu allows you to modify passwords and databases,
License: this screen is used for inserting new licenses,
Connection password: this screen is used for modifying the main connection passwords.
Copyright © NETASQ 2008
Page 62 sur 137
ENUG0810-V1.0_NEREPORTER-V8.0
USER GUIDE: PART 3: USING NETASQ EVENT REPORTER
3.7.2.2. Activity
Figure 43: Manage Collector - Activity
The activity window consists of three parts:
Collector & database status
This section presents Collector’s properties, its IP address, version and status. The Activate NETASQ
Collector button allows you to refresh NETASQ Collector if it is on standby.
Database
This section provides information on the volume of the database and the available space left.
Logs treated
This section provides information on how logs are treated by NETASQ Log Collector.
The option Log activity in a file: when this option has been activated, all of NETASQ Log Collector’s
operations and error messages will be stored in a file.
Copyright © NETASQ 2008
Page 63 sur 137
ENUG0810-V1.0_NEREPORTER-V8.0
USER GUIDE: PART 3: USING NETASQ EVENT REPORTER
3.7.2.3. Firewalls and logs
In this window, you can directly download logs on firewalls.
Figure 44: Manage Collector - Firewalls and logs
For NETASQ Log Collector to be able to connect to Firewalls to upload logs, it is necessary to create a user
who possesses log reading privileges, and to provide the connection parameters of the Firewalls from which
logs are to be retrieved, in the address book. The therefore following needs to be done:
Create a user in each Firewall using NETASQ UNIFIED MANAGER and assign administration privileges
on the Firewall to this user: Minimum privileges for Log and Monitor.
Enter the IP address as well as the login name and password of the user created earlier in the NETASQ
Log Collector address book
The address book is displayed as follows. It can be accessed through the “Collector Address book” button.
This address book contains a list of the firewalls to which Collector will connect.
Copyright © NETASQ 2008
Page 64 sur 137
ENUG0810-V1.0_NEREPORTER-V8.0
USER GUIDE: PART 3: USING NETASQ EVENT REPORTER
Figure 45: Address book - Firewall
When the address book is saved, the data will be encrypted in AES on your computer. In order to apply
these changes, you have to send this information to Collector by using the “Apply” button.
REMARK
It is not necessary to provide information in the address book regarding the Firewalls on which the
NETASQ SYSLOG log sending function has been activated. In fact, when NETASQ Log Collector
connects to a Firewall, it checks if this option has been activated before downloading logs.
If the option has been activated, NETASQ Log Collector will not download the logs locally but directly
in the Syslog directory. Therefore, the connection parameters do not have to be entered in the
address book.
WARNING
If a firewall sends its logs via Syslog, logs will not be collected from this firewall.
The option Bypass Syslog verification: if this option has been selected, the gathering of logs will be forced
on firewalls that send their logs to their Syslog. Syslog files are always inserted into the database if they are
located in the local directory.
Copyright © NETASQ 2008
Page 65 sur 137
ENUG0810-V1.0_NEREPORTER-V8.0
USER GUIDE: PART 3: USING NETASQ EVENT REPORTER
3.7.2.4. Advanced mode
Figure 46: Manage Collector – Advanced mode
Several parameters may be configured in this menu:
Collector listening port
Port: specify the NETASQ Log Collector’s listening port. By default, the listening port is 1380.
Performances
Buffer for lines read (10000 lines by step average 3MB): it is possible to adjust the size of the buffer
the NETASQ Log Collector uses to send logs, before their insertion into the database. The minimum size is
3 MB, i.e., 10,000 lines of log data, and the maximum size is 15 MB, i.e., 50,000 lines of log data
Process priority level: Choose between Idle, Lowest, Below normal, Normal, Above normal, Highest.
Miscellaneous
Bypass Syslog check: When this option is selected, the collection of logs will be forced on firewalls
which send their logs in their Syslog applications. Syslog files are always inserted into the database if they
can be found in the local folder.
This option allows Collector to avoid sending duplicate logs.
Copyright © NETASQ 2008
Page 66 sur 137
ENUG0810-V1.0_NEREPORTER-V8.0
USER GUIDE: PART 3: USING NETASQ EVENT REPORTER
3.7.2.5. Database
Figure 47: Manage Collector - Database
Modifying passwords for the database
The “Collector address book” button provides access to Collector’s address book and displays the address
of the database. Passwords for the database can be specified here.
Once inside the address book, only the password can be modified, as the database is located on the same
workstation as Collector.
Select the option Show passwords in order to modify a password, or double-click on the “Password” field.
In the latter case, a window will open.
WARNING
1)
As indicated in this screen, Collector has to be shut down in order to apply the changes and
passwords are transmitted over the network in plaintext.
2)
You are highly advised to modify your passwords the very first time you use Reporter. The
default password is “netasq” for the reporter account.
Rotating the database
By enabling the rotation of the database, data will be stored in the database for the number of days
specified.
Number of days to keep in the database: this field allows you to define the number of days for which the
logs will be stored in the database.
Drop outdated tables after generating them: This option will delete from the database logs that have
been kept for more of days than what had been specified in the field “Number of days to keep in the
database”.
Copyright © NETASQ 2008
Page 67 sur 137
ENUG0810-V1.0_NEREPORTER-V8.0
USER GUIDE: PART 3: USING NETASQ EVENT REPORTER
Converted outdated tables to Syslog format: If this option has been enabled, the oldest logs will be
converted to NETASQ Syslog format. In this case, you will be able to indicate the directory in which tables
from the Table dump directory will be stored. By default, this option is selected as you are advised to keep
logs. (The conversion of files takes up more volume than when the tables remain in the database, ranging
from 5 to 10%).
Data cache
This field enables managing links saved to memory in order to speed up embedding. Changes made to
this field are applied when NETASQ Log Collector is started up.
3.7.2.6. License
Figure 48: Manage Collector - License
You will be able to insert a new license in your Collector with this menu. This license is indispensable for
activating options you wish to activate (number of Firewalls, Firewall type, etc.).
WARNING
1)
To manage logs for several Firewalls simultaneously, and to guarantee better administration
of the traffic passing through your Firewalls, you need an unlimited license.
2)
The “Send to Collector” button allows you to validate a new license for NETASQ EVENT
REPORTER.
The following message will appear:
"The operation was successful. Reboot the Collector service in order to validate your new
license ".
The license will therefore be validated the next time Collector starts up.
Copyright © NETASQ 2008
Page 68 sur 137
ENUG0810-V1.0_NEREPORTER-V8.0
USER GUIDE: PART 3: USING NETASQ EVENT REPORTER
3.7.2.7. Connection password
Figure 49: Manage Collector – Set connection password
This menu is used only when modifying the master password, which is used for connecting to NETASQ Log
Collector as well as for encrypting database passwords.
The Set connection password button will open the window in which the new password will be entered.
Activating the option Save connection password will automatically run Collector whenever the server starts
up.
WARNING
1) The default password is "NETASQ".
2) You are strongly advised to change this password the first time you use Reporter
3.7.3. NETASQ LOG COLLECTOR activity NETASQ Log Collector collects logs sequentially: it connects in turn to each Firewall. Between each
complete rotation (connection to all the Firewalls), NETASQ Log Collector goes into standby. Standby
duration depends on the Firewall’s activity (therefore on the number of lines of log generated). The greater
the Firewall activity, the shorter the NETASQ Log Collector’s standby duration will be. The standby duration
may be anything between 5 seconds and 30 minutes.
Copyright © NETASQ 2008
Page 69 sur 137
ENUG0810-V1.0_NEREPORTER-V8.0
USER GUIDE: PART 3: USING NETASQ EVENT REPORTER
CHAPTER 8: UNIX SYSLOG
If you have logs that originate from a Unix Syslog other than NETASQ’s, the Unix Syslog menu will allow
you to convert these logs into logs tat are readable by NETASQ EVENT REPORTER. Generated files will
be in NETASQ SYSLOG format.
Go to the UNIX Syslog wizard via the menu Tool\Unix Syslog.
Step 1
Figure 50: Converting Unix Syslog - Step 1
To select files generated by Unix Syslog, click on the button “Select files”..
Example of a file name
Alarm_2007_81.log
This corresponds to log name + year + day of the year + .log
The option Generate in the source file directory enables the selection of a destination other than the one
specified by default.
Copyright © NETASQ 2008
Page 70 sur 137
ENUG0810-V1.0_NEREPORTER-V8.0
USER GUIDE: PART 3: USING NETASQ EVENT REPORTER
Step 2
Figure 51: Converting Unix Syslog – Step 2
This window shows the location of the files to be converted into NETASQ SYSLOG files. Clicking on the
Next button will start converting the files.
REMARK
Conversion time varies.
Step 3
Figure 52: Converting UnixSyslog - Step 3
Copyright © NETASQ 2008
Page 71 sur 137
ENUG0810-V1.0_NEREPORTER-V8.0
USER GUIDE: PART 3: USING NETASQ EVENT REPORTER
In the last step, results of the file conversion are displayed.
File
Number of lines and
file names
Names of converted files.
Indicates the total number of lines. The number of lines that are not logs are
shown in brackets.
CHAPTER 9: AUTOREPORT
3.9.1. Introduction Logs generated by Firewalls paint a picture of the events that take place on your network. Behavior patterns
in monitored traffic are exposed, as well as intrusion attempts on your network. While logs can be used for
adapting the security policy to perpetually-evolving threats, they represent sensitive information which
compile a comprehensive history of traffic passing through your Firewall.
Handling these logs can sometimes prove to be a daunting and tedious task, especially if the right tools are
not employed. The price to pay for exhaustive log files is the sheer volume they occupy. Nonetheless,
these log files very often hold the key to identifying problems on the network, and if the right tools are not
used, these problems may easily go unnoticed once they are lost in the flood of information. NETASQ’s
range of log management tools (Reporter in standard or professional version, Log Collector and Syslog) help
administrators to extract the desired information to achieve better reactivity and better results.
NETASQ’s Autoreport, or automatic report generator is a new tool which administrators can access to
manage their logs. Flexible and fully capable of being customized, Autoreport makes the most of logs that
NETASQ Firewalls generate. The information gathered is structured in HTML reports which are divided into
sections containing each a title, comments, a table and a graph). The system’s flaws or inconsistencies thus
appear quickly and the necessary measures to take can be worked out swiftly and accurately.
NETASQ’s Autoreport is a unique report generation tool. Equipped with this tool, you will be able to analyze
only the information you want to analyze. In order to do this, you first have to create sections in the report (or
use the models already defined) according to your own needs. The results of your request will then be
presented in HTML in the form of a graph and table, making consultation extremely easy. The table provides
a quick and accurate view of the indicators you have defined and the graph gives a global view of the
patterns that can be deduced from the monitored factors. Moreover, these reports are launched at a
frequency that you can define.
Autoreport uses the database in NETASQ Log Collector (found in the NETASQ Reporter package) to
retrieve the logs necessary for generating reports
Copyright © NETASQ 2008
Page 72 sur 137
ENUG0810-V1.0_NEREPORTER-V8.0
USER GUIDE: PART 3: USING NETASQ EVENT REPORTER
3.9.2. Introduction to options
Figure 53: Autoreport menu
There are three configuration menus for AutoReport:
Reports: date and frequency of report generation, the affected Firewalls, sections in the report and
comments associated with the report.
Sections: contents of the section, presentation of information and comments associated with the section.
Filters: definition of SQL filters, by log type. Examples: selection of minor alarms only, selection of major
alarms, logs from IP address x.x.x.x
Configuring the service: database parameters and location of the generated report.
3.9.3. Setting up the service The first step in using the NETASQ AutoReport tool consists of setting up the service and launching it. To
ensure ease in using AutoReport, the NETASQ installation package installs and sets up the service at the
same time that it installs the other selected software programs on installation.
As such, once the installation of AutoReport is complete, the service would already have been launched.
You are, hwoever, free to install/uninstall and start/shut down the service.
3.9.3.1. Installing the service
While the "AutoReport Log Reporter" service is automatically installed, it can also be manually installed by
launching the executable program Install – Launch AutoReport found in the menu:
Start\Programs\NETASQ\Administration
AutoReport.
Copyright © NETASQ 2008
Suite
Page 73 sur 137
7.0\Services\Install-Launch
ENUG0810-V1.0_NEREPORTER-V8.0
USER GUIDE: PART 3: USING NETASQ EVENT REPORTER
Otherwise, the full procedure is as follows:
Go to the NETASQ directory on your
Files\NETASQ\Administration Suite 7.0\
hard
disk
(as
a
rule
C:\Program
Open InstallLaunchAutoReport.bat. The command prompt window will appear.
Type the following installation command:
START /WAIT servAutoReport.exe /INSTALL /SILENT
Type the following service start-up command:
NET START NETASQAutoReport
Once the service has been installed, it will be rebooted at each startup even if no session has been opened.
3.9.3.2. Uninstalling the service
The AutoReport Log Reporter service may be uninstalled by launching the executable program
found in the menu
Shutdown –
Remove AutoReport
Start\Programs\NETASQ\Administration
AutoReport.
Go to the NETASQ directory on
Files\NETASQ\Administration Suite 7.0\
suite
your
7.0\Services\Shutdown –
hard
disk
(as
a
rule
remove
C:\Program
Open UnInstallAutoReport.bat. The command prompt window will appear.
Type the following shutdown command:
START /WAITNET STOP NETASQAutoReport.exe /UNINSTALL /SILENT
Type the command for uninstalling the service:
servAutoReport.exe /UNINSTALL /SILENT
You are advised to shut down and restart the PostgreSQL service with the help of the Service Manager
included in Windows NT, 2000 and XP.
3.9.3.3. Configuring the service
Go to the menu AutoReport\Configure service... to configure the service
Copyright © NETASQ 2008
Page 74 sur 137
ENUG0810-V1.0_NEREPORTER-V8.0
USER GUIDE: PART 3: USING NETASQ EVENT REPORTER
Activity
Figure 54: Configuring the Autoreport service
The service’s activity zone lists the messages that the service generates when executing. The table below
categorizes these messages and gives a brief explanation of each.
Loaded (x reports)
List all reports
Report No…
Execute report
Last executed
From…to…
Execution ok
Execution NOT ok
Reloaded
Service Launched
Service Stopped
FTP errors
When the service starts up, it will search for reports which are currently
configured.
This message indicates that the information concerning each report found will
be displayed.
The service will indicate the number, name, frequency of generation and last
generation date of each report found.
This message indicates that the report is being generated.
Date of the last generation of the report currently being generated.
Period concerning the report in the process of being generated.
Execution of the report has been successful.
Execution of the report has failed.
Every 30 seconds, the service will conduct a new search for currently
configured reports.
The service has been executed.
The service has been interrupted.
Since newly-created reports can be placed on an FTP server, the service sends
back errors that it receives from the FTP server.
Example
23/03/2007 09:44:09: -----> Reloaded (17 reports)
23/03/2007 09:44:09: Report N° 1 "Email activity"
Copyright © NETASQ 2008
Page 75 sur 137
ENUG0810-V1.0_NEREPORTER-V8.0
USER GUIDE: PART 3: USING NETASQ EVENT REPORTER
23/03/2007 09:44:09:
23/03/2007 09:44:09:
23/03/2007 09:44:09:
23/03/2007 09:44:09:
Last execution date 23/03/2007 01:02:43
Next execution date 23/03/2007 01:00:00
Reference date time 23/03/2007 09:44:09
Nothing to do.
This is what appears when a report is generated
23/03/2007 09:44:09: Report N° 7 "P2P Messenger and Multimedia activity"
23/03/2007 09:44:09: Last execution date 30/12/1899
23/03/2007 09:44:09: Next execution date 23/03/2007 01:00:00
23/03/2007 09:44:09: Reference date time 23/03/2007 09:44:09
23/03/2007 09:44:09: Execution: Reference date > Next date & Last date < Next date
23/03/2007 09:44:09:
Start Report N° 7 "P2P Messenger and Multimedia activity"
23/03/2007 09:44:09:
Last executed sam. 30/12/1899
23/03/2007 09:44:09:
Period is from lun. 12/03/2007 to dim. 18/03/2007
23/03/2007 09:44:19:
23/03/2007 09:44:19:
23/03/2007 09:44:19:
Files copied in directory D:\netasq-TRUNK\firewall\reporter\binAutoreport\Result\
--> Generation ok
End generation
Configuration
Autoreport allows you to define the location of generated reports. NETASQ offers three possibilities:
Local file
Figure 55: Configuring the Autoreport Service - Configuration
You have to specify the full path of the destination directory in the “Directory” field.
REMARK
A relative name can always be given. If the name field is left blank, reports will be saved in a subfolder named “result”.
Copyright © NETASQ 2008
Page 76 sur 137
ENUG0810-V1.0_NEREPORTER-V8.0
USER GUIDE: PART 3: USING NETASQ EVENT REPORTER
Sending by e-mail
Figure 56: Configuring the Autoreport service – Sending by mail
You have to specify the sending SMTP server (IP address or hostname), your account on this SMTP server
(in the form of an e-mail address) and the destination e-mail address.
The option Send the report as an archive allows archiving reports.
The “Send test e-mail” button allows you to check whether the configuration of the account is correct.
Select the option Create master index containing all reports if you wish to generate a main index to
reference the reports. Othewsie, every report will be saved in a separate folder.
The main index would look like this if the option has been selected:
Figure 57: Available Reports
Copyright © NETASQ 2008
Page 77 sur 137
ENUG0810-V1.0_NEREPORTER-V8.0
USER GUIDE: PART 3: USING NETASQ EVENT REPORTER
Sending via FTP
Figure 58: Configuring the Autoreport Service - Sending by FTP
You have to specify the FTP server (IP address or hostname), your login name and password on this FTP
server, and the destination directory on this FTP server.
The “Test” button allows you to test the information you have provided.
Database
Figure 59: Configuring the Autoreport service - Database
Copyright © NETASQ 2008
Page 78 sur 137
ENUG0810-V1.0_NEREPORTER-V8.0
USER GUIDE: PART 3: USING NETASQ EVENT REPORTER
Autoreport uses a PostGreSQL database similar to the one found in Collector to generate HTML reports.
Therefore, to enable generating reports, you have to specify the information needed to access a database.
Two parameters are necessary for this access – the IP address of the host where the database is located
and the database’s password (reminder: the default password for the Log Collector database in NETASQ
Reporter PRO is “reporter”).
Reminder: the default password in the NETASQ LOG COLLECTOR database is "reporter".
If the IP address 127.0.0.1 has been specified, Autoreport will search for a database on the host where
Autoreport has been executed.
WARNING
If you have modified the password for the database, you also have to modify this password in
Reporter and Collector.
3.9.4. Creating reports Reports are created in two steps – defining sections in the reports and then assigning these sections to a
report.
3.9.4.1. List of sections
When you click the menu AutoReport\Report sections the following window will appear:
Figure 60: List of sections
The buttons on the right side of the window enable you to add, modify, delete, import or export report
sections.
Adding or modifying report sections
Copyright © NETASQ 2008
Page 79 sur 137
ENUG0810-V1.0_NEREPORTER-V8.0
USER GUIDE: PART 3: USING NETASQ EVENT REPORTER
If you click on on the Add or Modify buttons, the window showing the list of report sections will appear.
REMARK
The window title indicates whether you are creating or modifying a section.
To identify your report section, specify a title for it. Three tabs define each section:
Data source.
Contents.
Comments.
Copyright © NETASQ 2008
Page 80 sur 137
ENUG0810-V1.0_NEREPORTER-V8.0
USER GUIDE: PART 3: USING NETASQ EVENT REPORTER
Data source tab
Figure 61: Section definition – Data source
Preconfigured profile
In the pop-up window “Profile of analyzed logs”, select a configured log profile from: “Major alarms”, “Minor
alarms”, "Web", "E-mails", "FTP".
When you select a profile, the following message will appear:
"Assign logs from this data source by default?"
By clicking on the Yes button, the relevant files and filters will appear.
Example
If you select the log profile “Major alarms”, you will see the filter “alarm: major alarms”.
To define your own SQL filters, click on the Filters button and refer to the section Filter Constructor in this
document for more information on how to create SQL filters.
WARNING
Log profiles configured by default cannot be modified.
Customized profile
You may also define your own personalized profile by selecting the option Customize in the pop-up window
“Profile of analyzed logs”.
When you select this profile, the following message will appear:
Copyright © NETASQ 2008
Page 81 sur 137
ENUG0810-V1.0_NEREPORTER-V8.0
USER GUIDE: PART 3: USING NETASQ EVENT REPORTER
"Assign logs from this data source by default?"
By clicking on the Yes button, the filter “Connection” and the protocol “Any” will appear by default. If you
click on the option “Connection”, a triangle will appear, allowing you to select a file, among "Administration",
"Alarm", "Authentication", "Counters", "Connection", "Filters", "Monitor", "Plugin", "Pop3", "SEISMO",
"SMTP", “NAT Stats”, “Filter stats”, "System", "IPSec VPN", "SSL VPN" and "Web".
Next, select the filter you wish to match to the selected file. Filters vary according to the chosen file. Go to
Appendix B to see this list.
To add another customized profile, click on the Add button
To delete a log profile, select it and click on the Delete button. The following message will appear.
"Delete <Log> <Filter>?"
Select the associated SQL filters. Add different filters by clicking on Add.
Contents tab
Figure 62: Section definition - Contents
Presentation of period
Data analysis from
Sort by
This option enables defining how the horizontal data scale is to be presented
from the following options: day of the period, day of the week, hour of the
day, week number, month.
Defines how data is to be grouped. If you have selected a customized log
profile, analyzed criteria will be possible on all fields.
If you have chosen another log profile, the possible analyzed criteria are as
follows: source IP hosts, destination IP hosts, users, Protocol or Alarm
ID.
(does not apply to alarms) Sort according to a number of items – traffic
Copyright © NETASQ 2008
Page 82 sur 137
ENUG0810-V1.0_NEREPORTER-V8.0
USER GUIDE: PART 3: USING NETASQ EVENT REPORTER
volume, volume sent, volume received or number of items.
Number of elements
Number of groupings displayed. This enables generating “Top 5 largest” or
“Top 10 largest” type of reports.
The last drop-down menu enables choosing whether you wish to generate
graphs in the report and in what form (bar charts, pie charts).
Furthermore, each graph can be displayed as a bar chart or as a pie chart.
Below is a preview of the bar charts and pie charts in a generated report:
Copyright © NETASQ 2008
Page 83 sur 137
ENUG0810-V1.0_NEREPORTER-V8.0
USER GUIDE: PART 3: USING NETASQ EVENT REPORTER
Comments tab
In this comments zone, you can provide explanations on the report which will be displayed. Thus, you can
fully customize your reports.
Figure 63: Section definition - Comments
Delete
To remove a section from the list, select it (the line will be highlighted) then click on the Delete button. The
following message will appear:
"Delete the section <Section name>? The section <Section name> is included in x reports"
TIP
Several lists may be deleted simultaneously if you use the Ctrl and Shift keys.
Import
To import a list of sections, click on the Import button. Select the file (.txt format).
Export
To export a list of sections, click on the Export button. Give your export file a title and select the destination
folder. This file will be saved in .txt format.
The report should look like this:
Copyright © NETASQ 2008
Page 84 sur 137
ENUG0810-V1.0_NEREPORTER-V8.0
USER GUIDE: PART 3: USING NETASQ EVENT REPORTER
Figure 64: Report
3.9.4.2. List of reports
This list contains 15 pre-configured reports. However, you can create reports at any time and configure
them.
When you select the menu AutoReport\Reports, the following window will appear:
Figure 65: List of reports
Copyright © NETASQ 2008
Page 85 sur 137
ENUG0810-V1.0_NEREPORTER-V8.0
USER GUIDE: PART 3: USING NETASQ EVENT REPORTER
The action buttons to the right of the window allow you to add, modify, delete, import or export a list of
reports.
The Generate button will generate the report and send it according to the configuration regarding how
reports are sent.
Number
Name
Enabled
Line number of the report.
Report name.
By selecting this option, you will enable the generation of reports.
Adding or modifying reports
Click on the Add or Modify buttons to add or modify reports.
Specify a name for your report in order to identify it. Each report is further defined by four tabs:
General
Comment
Sections
Send
General tab
Figure 66: Definition of reports - General
Period analyzed on
Execute every
This option enables specifying the period to analyze by selecting the relevant
time slot (by day, by week or by month).
This option enables defining the day for generating the report, either daily,
weekly or monthly.
The dynamic zone below the option Execute every summarizes the
Copyright © NETASQ 2008
Page 86 sur 137
ENUG0810-V1.0_NEREPORTER-V8.0
USER GUIDE: PART 3: USING NETASQ EVENT REPORTER
Firewalls analyzed
configuration. The date of the last execution can be reset using the Reset
button of the same name.
The list of Firewalls that the report concerns is taken from the database. As
long as Autorport is unable to connect to the database, this list will not appear.
Comments tab
In this comments zone, you can provide explanations on the report which will be displayed. Thus, you can
fully customize your reports.
Figure 67: Definition of reports - Comments
Sections tab
This tab enables defining the sections presented in the report from the sections previously defined. (see the
List of report sections in this manual).
Figure 68: Definition of reports - Sections
You will be able to:
Copyright © NETASQ 2008
Page 87 sur 137
ENUG0810-V1.0_NEREPORTER-V8.0
USER GUIDE: PART 3: USING NETASQ EVENT REPORTER
Add one or several sections in the report.
Modify the report section in the list.
Delete a report section from the list.
The Add button will open the window showing the list of section. As such, you will define the section that will
go into the report.
The screen captures below show you the sections in a report generated in html and the configuration made
in AutoReport.
Figure 69: Reports
Before adding a section to a report, elements in its configuration can be added or modified (data sources,
contents or comments).
TIP
The list of sections can be reorganized by dragging and dropping items.
Copyright © NETASQ 2008
Page 88 sur 137
ENUG0810-V1.0_NEREPORTER-V8.0
USER GUIDE: PART 3: USING NETASQ EVENT REPORTER
Send tab
Figure 70: Definition of reports - Send
Although it is possible to globally define where and how generated HTML reports will be saved, it is also
possible to define a different method from the global method.
Global configuration
Local file
Send via e-mail
Send via FTP
If you specify this sending method, the HTML report will be generated and
saved according to the method you have defined in the service configuration.
You have to specify the full path of the directory, failing which reports will be
saved in a sub-folder named “result”.
You have to specify the sending SMTP server (IP address or hostname), your
account on this SMTP server (in the form of an e-mail address) and the
destination e-mail address.
You have to specify the FTP server (IP address or hostname), your login name
and password on this FTP server, and the destination directory on this FTP
server. You may archive your report by checking the option Archive report.
The Test button allows you to check the FTP server’s configuration.
Deleting a list
To remove a list of reports, select it (the line will be highlighted) then click on the Delete button. The
following message will appear:
"Delete report <title of report>?"
TIP
Copyright © NETASQ 2008
Page 89 sur 137
ENUG0810-V1.0_NEREPORTER-V8.0
USER GUIDE: PART 3: USING NETASQ EVENT REPORTER
Several lists may be deleted simultaneously if you use the Ctrl and Shift keys.
Importing a list
To import a list of reports, click on the Import button. Select the file (.txt format).
Exporting a list
To export a list of reports, click on the Export button. Give your export file a title and select the destination
folder.
This file will be saved in .txt format.
The report should look like this:
Figure 71: Report
Executing
The Generate button allows you to generate the selection of reports according to the configuration selected
for sending reports (locally, by e-mail or via FTP).
Copyright © NETASQ 2008
Page 90 sur 137
ENUG0810-V1.0_NEREPORTER-V8.0
USER GUIDE: PART 4: NETASQ SYSLOG
PART 4: NETASQ SYSLOG
The NETASQ Firewall administration graphical interface is complemented by a log retrieval utility. This utility,
NETASQ Syslog, allows you to retrieve logs generated by the Firewall in order to use them later.
The advantage of NETASQ SYSLOG
Some NETASQ products have no hard disk (U30 and U70), so logs cannot be stored locally on the Firewall.
The logs must be redirected to external equipment.
When NETASQ SYSLOG is installed on the administration machine, logs are recovered and stored on this
machine.
WARNING
If you attempt to install a new version of NETASQ SYSLOG while an older version is still installed as
a service, you have to shut down the service and uninstall it (via the command line procedure, see
Syslog Service section).
If this is not done the Windows installation management database and registry database may be corrupted.
WARNING
The administration host must be well protected as logs are stored in plaintext on the administration
host (likewise for logs in a classic Syslog). The encryption key for traffic between NETASQ SYSLOG
and the Firewall is also stored in plaintext on the host. Access to the administration host therefore
has to be highly restricted and any Windows session must be locked when not in use.
CHAPTER 1: INSTALLATION
Given that the software has to be installed on the same workstation as the Firewall’s administration interface,
the same software and hardware conditions as for the NETASQ Unified Manager are required.
4.1.1. Procedure Retrieve the Administration Suite setup file from NETASQ’s website or from the CD-ROM delivered with
the Firewall, and execute this file. When you are offered a choice of installation, select “full installation” (in
this case, all the Administration Suite software will be installed) or select a customized installation and select
NETASQ SYSLOG from the list of applications.
Execute this file on the administration host in order to launch the installation.
Installation takes place in the same way as a standard software installation.
NETASQ SYSLOG will run by default each time a Windows NT or 2000 session is opened and every time
Windows 95 or 98 is rebooted (NETASQ SYSLOG therefore behaves like a service). Under Windows NT
and 2000, you can install NETASQ SYSLOG as a service (see Syslog Service section).
Copyright © NETASQ 2008
Page 91 sur 137
ENUG0810-V1.0_NEREPORTER-V8.0
USER GUIDE: PART 4: NETASQ SYSLOG
WARNING
If you attempt to install a new version of NETASQ SYSLOG while an older version is still installed as
a service, you have to shut down the service and uninstall it (via the command line procedure, see
Syslog Service section below). If this is not done the Windows installation management database
and registry database may be corrupted.
4.1.2. SYSLOG Service NETASQ SYSLOG can be installed as a service. This mode has the advantage of total transparency for the
user (as a background task). In addition the Syslog service keeps running even without opening a Windows
session
WARNING
The following procedures only concern Windows NT, XP and 2000 platforms. In Windows 95 and 98,
NETASQ SYSLOG is installed by default as a service which is launched each time the host is
rebooted (without opening a session)
4.1.2.1. Service installation procedure
The Syslog service can simply be installed by launching the executable file Install – Launch Syslog
via the menu Start\Programs\NETASQ\Administration Suite 7.0\Services\Install Launch Syslog.
Otherwise, the complete procedure is as follows:
Go to the NETASQ directory on your hard disk (as a rule C:\Program
Files\NETASQ\Administration Suite 7.0\Services\Install – Launch Syslog. The
command prompt window will appear.
Type the following installation command:
START /WAIT FwSyslog. /INSTALL /SILENT
The service will start running automatically.
You are advised to reboot the workstation after installing the Syslog service.
Once installed, the service will start up every time the machine is booted, even if no session is open.
WARNING
Remember to change the NETASQ SYSLOG options so that it does not run automatically every time
a session is opened (see Configuration section).
4.1.2.2. Shutting down the service mode
The Syslog service may be uninstalled simply by selecting Shutdown – remove Syslog found in the
menu Start\Programs\NETASQ\Administration suite 7.0\Services\ Shutdown – remove
Syslog.
Otherwise the complete procedure is as follows:
Copyright © NETASQ 2008
Page 92 sur 137
ENUG0810-V1.0_NEREPORTER-V8.0
USER GUIDE: PART 4: NETASQ SYSLOG
Go to the NETASQ directory
Files\NETASQ\Administration Suite
command prompt window will appear
on your hard disk (as a rule C:\Program
7.0\Services\Shutdown – Remove Syslog. The
Type the command for uninstalling the service:
START /WAIT NET STOP NETASQSyslogFwSyslog.exe /UNINSTALL /SILENT
WARNING
It is important to reboot the workstation in order to apply this uninstallation.
CHAPTER 2: CONFIGURATION
4.2.1. Configuring NETASQ UNIFIED MANAGER In order to use NETASQ SYSLOG, you must first configure a number of parameters.
To do so, open the application NETASQ UNIFIED MANAGER, select Logs from the menu directory, then
Syslog in the window that opens. The following window will appear:
Figure 72: Log configuration
4.2.1.1. Steps of the configuration
Activate the option Forward log to an external syslog server.
Specify the host where NETASQ SYSLOG is installed using the “Select an object” button, then click on
“Syslog” and check that the connection port is 514.
Copyright © NETASQ 2008
Page 93 sur 137
ENUG0810-V1.0_NEREPORTER-V8.0
USER GUIDE: PART 4: NETASQ SYSLOG
Specify the log types which will be sent from the Firewall to NETASQ SYSLOG (Filter, Server, Alarm,
Web, SMTP, VPN, Connection, Authentication, System events, Plugins, SSL VPN, POP3, Monitor,
SEISMO).
The Log facility has to be set at none.
Traffic encryption: Traffic passing between the Firewall and NETASQ SYSLOG may be encrypted in
AES. To activate encryption, select the option Traffic encryption, then click on the Encryption key button.
Enter the encryption key used (the same key value will be configured on NETASQ SYSLOG). Encryption
must be activated on NETASQ SYSLOG.
4.2.2. Configuring NETASQ SYSLOG NETASQ SYSLOG is configured via the graphical interface installed with the other applications in the
Administration Suite. NETASQ SYSLOG is not installed by default, so to install it, the administration suite
has to be installed in Full, Server or Customized modes.
Once this has been installed, the NETASQ SYSLOG configuration interface will be available in program
menus by default:
Start\All programs\NETASQ\Administration Suite no. xx\Configure NETASQ SYSLOG
service.
4.2.2.1. Configuring NETASQ SYSLOG
The NETASQ SYSLOG configuration window consists of two menus:
Service: Launch service, Shut down service, Activity and Quit.
Options: configuration options for the syslog software, consists of three menus Preferences, Sizing
and Parsing.
Options
Figure 73: Sizing options
If you have activated log encryption on the administration console (NETASQ UNIFIED MANAGER) you must
activate the option Logs have to be decrypted and enter the encryption key used (password).
Copyright © NETASQ 2008
Page 94 sur 137
ENUG0810-V1.0_NEREPORTER-V8.0
USER GUIDE: PART 4: NETASQ SYSLOG
You may specify the log storage directory path in the “Log target directory” field. Logs are stored by
default in the directory: C:\program files\NETASQ\Administration Suite x.x\Log.
When the option Log activity in a file has been activated, all NETASQ SYSLOG operations and error
messages will be stored in a file. This file is located in the NETASQ file directory (by default C:\program
files\NETASQ\Administration Suite x.x) by the SyslogToFile.FRA or SyslogToFile.ENG.
Sizing
Figure 74: Sizing options
This tab allows you to determine the maximum size allocated to log files on the administration machine’s
hard disk so as to prevent flooding it.
You may choose a relative or absolute maximum size. The relative size is expressed in percentage of disk
space used, while absolute size is expressed in Megabytes.
Relative size
To define a relative amount of disk space used, select the option Syslog’s percent of total disk size and
select the desired value.
Absolute size
To define an absolute size, select the option Syslog’s absolute size and enter the absolute value in
Megabytes.
Parsing
Copyright © NETASQ 2008
Page 95 sur 137
ENUG0810-V1.0_NEREPORTER-V8.0
USER GUIDE: PART 4: NETASQ SYSLOG
Figure 75: Parsing options
Logs are saved in the file whose name has been defined by the value of the “logtype=” lexeme. For logs that
have been gathered from non-NETASQ equipment (in WELF format), the file can be specified according to
what is detected in the log line. Therefore, add probable keywords to each log line by associating them to a
NETASQ log file, allowing logs from non-NETASQ equipment to be included in the tables presented in
Reporter.
If a log line does not correspond to any configured lexeme, NETASQ SYSLOG will not be able to interpret it
and it thereforewill not be taken into account in the Reporter tables.
Report and Collector can read logs if they are in WELF format. If not, these logs can only be read in Syslog.
CHAPTER 3: USING LOGS
NETASQ EVENT REPORTER analyzes the logs retrieved by NETASQ SYSLOG without the need for a
connection to a Firewall.
4.3.1. Location of logs
Logs are stored in text files, in the directory chosen by the administrator. By default, if the administrator
has not specified a particular directory, the log directory is in the following path: C:\program
files\NETASQ\Administration Suite x.x\log.
Everyday, a new text file is created for each log type (filter, connection, alarm, SMTP and URL). The name
of each file is constructed in the following way:
<log type>_<year>_<day of the year>
Copyright © NETASQ 2008
Page 96 sur 137
ENUG0810-V1.0_NEREPORTER-V8.0
USER GUIDE: PART 4: NETASQ SYSLOG
Examples
alarm_2003_295.log
connection_2003_291.log
filter_2003_25.log
web_2003_360.log
smtp_2003_360.log
Copyright © NETASQ 2008
Page 97 sur 137
ENUG0810-V1.0_NEREPORTER-V8.0
USER GUIDE: APPENDICES
APPENDICES
Appendix A: NETASQ Log Files
The treatment of traffic passing through Firewalls requires the generation of logs containing descriptions of
all events that arose. Depending on the type of event encountered, these logs will be recorded in specific
NETASQ log files.
There are 17 types of log files available on NETASQ Firewalls: "Alarm", "Auth", "Connection", "Count",
"Filter", "Monitor", "Natstat", "Plugin", "Filterstat", "POP3", "PVM", "Server", "SMTP", "System", "VPN",
"Web", "XVPN".
The names used for these log files are rather self-explanatory:
Alarm
Is used for alarms generated by ASQ in Firewalls (filter rules and “System” events which have a “minor” or
“major” attribute are logged in this file), and its source is NETASQ’s IPS engine – ASQ,
Example
The Firewall’s ASQ logs an attempted FTP bounce on an FTP server protected by the Firewall (this traffic
is blocked by default and raises a minor alarm).
The information saved in this log file is as follows:
Identifier (ID)
Date Time (Time)
Firewall (Fw)
Timezone (Tz)
Saved at (Start
time)
Priority (Pri)
Slotlevel
Source interface
(Srcif)
Rule ID (Rule ID)
Source interface
name (Srcifname)
Internet Protocol
(Ipproto)
Protocol (Proto)
Firewall’s identifier.
Date and time on which the line in the log file was generated at the firewall’s local
time.
Firewall’s serial number or name (if known).
Firewall’s timezone at the moment of writing the log
Time at which event was recorded
The level of the alarm (minor or major).
Number of the filter policy.
Interface of the firewall on which the alarm was raised (Network card of the source
interface.
Rule identifier.
Name of the source interface (only if it is known).
IP
Analyzed protocol or Destination Port.
Source (Src)
IP address of the source.
Source Port
Port number of the source (only if it is TCP/UDP)
Copyright © NETASQ 2008
Page 98 sur 137
ENUG0810-V1.0_NEREPORTER-V8.0
USER GUIDE: APPENDICES
(Srcport)
Source name
(Srcname)
Source port name
Destination (Dst)
Destination Port
(Dstport)
Dst Port name
(Dstportname)
Destination name
(Dstname)
Action (Action)
Message (Msg)
Class (Class)
Classification
(Classification)
Packet length
(Pktlen)
(Pktdump)
(AlarmID)
(Repeat)
Name of the source (only if it is known).
Name of the source (only if it is known)
IP address of the destination
Port number of the destination (only if it is TCP/UDP)
Name of the destination port (only if it is known)
Name of the destination (only if it is known)
Filter rule action. (Example: Block, Pass).
Additional information about the alarm
Detailed category in which the alarm is found (Examples: Filters, Protocol, System,
Pattern…)
Generic category in which the alarm is found (Examples: Protocol,
Content_filtering, Web, Mail, FTP…).
Length of the captured network packet.
Available network packet.
Alarm identifier.
Number of times this alarm has been repeated within a given duration.
Auth
Is used for processing authentication on Firewalls, and its source is the authentication daemon,
Example
The Firewall’s authentication module logs the authentication of the user “john.smith” for a period of four
(4) hours.
The information saved in this log file is as follows:
Identifier (ID)
Firewall’s identifier.
Date Time Date and time on which the line in the log file was generated at the firewall’s local time.
(Time)
Firewall (Fw) Firewall’s serial number or name (if known).
Timezone (Tz)
Saved at
(Start time)
User
Source (Src)
Method
Error
Message
(Msg)
Firewall’s timezone at the moment of writing the log
Time at which event was recorded
Identifier of the user requesting authentication
Source address of the connection.
Authentication method used (cf. see authentication document).
Request return error code. (0 means OK and 2 means FAILED).
Indicates the number of hours allocated.
Copyright © NETASQ 2008
Page 99 sur 137
ENUG0810-V1.0_NEREPORTER-V8.0
USER GUIDE: APPENDICES
Connection
Is used for connections made to and from the Firewall, and its source is NETASQ’s IPS engine – ASQ,
Example
The Firewall’s ASQ kernel logs the connection from the host 192.168.0.2 and from port 1672 to the
host 192.168.1.2 to port 1840.
The information saved in this log file is as follows:
Identifier (ID)
Date Time (Time)
Firewall (Fw)
Timezone (Tz)
Saved at (Start
time)
Priority (Pri)
Slotlevel
Rule ID (Rule ID)
User
Source interface
(Srcif)
Source interface
name (Srcifname)
Internet Protocol
(Ipproto)
Dst Interface
(Dstif)
Dst Interface
name
(Dstifname)
Protocol (Proto)
Firewall’s identifier.
Date and time on which the line in the log file was generated at the firewall’s local
time.
Firewall’s serial number or name (if known).
Firewall’s timezone at the moment of writing the log
Time at which event was recorded
The level of the alarm (minor or major).
Number of the filter policy.
Rule identifier.
Identifier of the user requesting authentication
Network card of the source interface.
Name of the source interface (only if it is known).
IP
Network card of the destination interface
Name of the destination interface (only if it is known)
Analyzed protocol or Destination Port
Source (Src)
Source address of the connection.
Source Port
(Srcport)
Port number of the source (only if it is TCP/UDP)
Source name
(Srcname)
Destination (Dst)
Destination Port
(Dstport)
Destination name
(Dstname)
Sent
User’s hostname.
IP address of the destination
Port number of the destination (only if it is TCP/UDP)
Name of the destination (only if it is known)
Number of bytes sent.
Received (Rcvd)
Number of bytes received.
Duration
Duration of the connection.
Copyright © NETASQ 2008
Page 100 sur 137
ENUG0810-V1.0_NEREPORTER-V8.0
USER GUIDE: APPENDICES
Count
Is used for displaying count statistics (mainly in the case of filter rules with the “Count” attribute), and its
source is the firewall process:
Example
The Firewall’s system logs the use of filter rule 4 (which has the “Count” attribute) 68501 times during the
selected period. By default, this period lasts 15 minutes.
The information saved in this log file is as follows:
Identifier (ID)
Firewall’s identifier.
Date Time Date and time on which the line in the log file was generated at the firewall’s local time.
(Time)
Firewall (Fw) Firewall’s serial number or name (if known).
Timezone (Tz)
Saved at (Start
time)
Rule (n:nn)
Firewall’s timezone at the moment of writing the log
Time at which event was recorded
Number of times that a rule has been applied to a packet. In brackets, the first number
indicates the number of the policy and the second refers to the number of the rule in this
policy.
Filter
Is used for filter-generated logs (an entry is recorded each time a filter rule set to “Log” applies to the traffic
passing through the Firewall), and its source is NETASQ’s IPS engine – ASQ:
Example
The Firewall’s ASQ kernel logs the event of filter rule 3 (which has been set to “Log”) being used for the
treatment of a packet passing through the Firewall.
The information saved in this log file is as follows:
Identifier (ID)
Date Time (Time)
Firewall (Fw)
Timezone (Tz)
Saved at (Start time)
Priority (Pri)
Slotlevel
Rule ID (Rule iD)
User
Source interface
(Srcif)
Firewall’s identifier.
Date and time on which the line in the log file was generated at the firewall’s
local time.
Firewall’s serial number or name (if known).
Firewall’s timezone at the moment of writing the log
Time at which event was recorded
The level of the alarm (minor or major).
Number of the active filter policy.
Rule identifier.
Identifier of the user requesting authentication
Interface of the firewall on which the alarm was raised (Network card of the
source interface.
Copyright © NETASQ 2008
Page 101 sur 137
ENUG0810-V1.0_NEREPORTER-V8.0
USER GUIDE: APPENDICES
Source interface name
(Srcifname)
Internet Protocol
(Ipproto)
Protocol (Proto)
Source (Src)
Source Port (Srcport)
Source name
(Srcname)
Destination (Dst)
Destination Port
(Dstport)
Dst Port name
(Dstportname)
Destination name
(Dstname)
Name of the source interface (only if it is known).
IP
Analyzed protocol or Destination Port.
IP address of the source.
Port number of the source (only if it is TCP/UDP)
Name of the source (only if it is known).
IP address of the destination
Port number of the destination (only if it is TCP/UDP)
Name of the destination port (only if it is known)
Name of the destination (only if it is known)
Filterstat
Is used for displaying statistics on filtering, and its source is the firewall process,
Example
The Firewall’s system logs the passage of 1205 bytes of UDP traffic, 52 bytes of ICMP traffic and 4879
bytes of TCP traffic through the Firewall between 5 July 2004 at 00:00:00 and 15 August 2004 at 23:59:59.
Identifier (ID)
Date Time (Time)
Firewall (Fw)
Timezone (Tz)
Saved at (Start time)
Rule (n:nn)
SavedEvaluation
Dynamic memory
(DynamicMem)
Host Memory (HostMem)
Fragment Memory
(FragMem)
ICMP Memory (ICMPMem)
Connection Memory
(ConnMem)
DTrackMem
Logged
Copyright © NETASQ 2008
Firewall’s identifier.
Date and time on which the line in the log file was generated at the firewall’s
local time.
Firewall’s serial number or name (if known).
Firewall’s timezone at the moment of writing the log
Time at which event was recorded
Number of times that a rule has been applied to a packet. In brackets, the
first number indicates the number of the policy and the second refers to the
number of the rule in this policy.
Number of rule evaluations that could not be performed because of the ASQ
technology.
Percentage of ASQ memory being used.
Memory allocated to a host.
Number of fragmented packets transmitted through the firewall.
Memory allocated to ICMP.
Memory allocated to connections.
Number of log lines generated by ASQ.
Page 102 sur 137
ENUG0810-V1.0_NEREPORTER-V8.0
USER GUIDE: APPENDICES
Number of log lines lost (could not be generated by ASQ).
LogOverflow
Basic information (banners, HTTP user agent, mail client...) that ASQ has
sent to SEISMO for vulnerability analysis.
Number (higher than 0) indicating that vulnerabilities will be rejected in the
event network traffic gets too heavy (if the event does not arise again later,
or if it has not yet been encountered.
Number of packets matching “Pass” rules
SEISMO Events
(PvmFacts)
SEISMO Overflow
(PvmOverflow)
Accepted
Number of packets matching “Block” rules.
Blocked
Number bytes transmitted through the firewall.
Byte
Number of fragmented packets transmitted through the firewall.
Fragmented
Number of TCP packets transmitted through the firewall.
TCP Packet (TCPPacket)
Number of bytes from TCP packets transmitted through the firewall.
TCP Bytes
(incoming/outgoing)
(TCPByte (i/o))
TCP Connections
(TCPConn)
UDP Packets (UDPPacket)
Number of TCP connections transmitted through the firewall.
Number of UDP packets transmitted through the firewall.
Number of bytes from UDP packets transmitted through the firewall.
UDP Bytes (UDPByte)
Number of UDP connections transmitted through the firewall.
UDP Connections
(UDPConn)
ICMP Packet
(ICMPPacket)
ICMP Bytes (ICMPByte)
Number of ICMP packets transmitted through the firewall.
Number of bytes from ICMP packets transmitted through the firewall.
FTP
Identifier (ID)
Firewall identifier
Firewall (Fw)
Name or serial number of the firewall (if known).
Timezone (Tz)
Start time (Start Time)
Priority (Pri)
Protocol (proto)
Source (src)
Source port (srcport)
Destination (dst)
Destination port (dstport)
Duration (duration)
Sent (Sent)
Received (rcvd)
Action (action)
Firewall’s timezone.
Time at which event was recorded.
For alarms, level of the alarm (major or minor).
Analyzed protocol or destination port.
Source address of the connection.
Source port number (only if TCP/UDP).
IP address of the destination.
Destination port number (only if TCP/UDP).
Duration of the connection.
Number of bytes sent.
Number of bytes received
Rule action (example: Block, Pass).
Message (msg)
Indicates whether the e-mail contains a virus.
“safe”, “infected”, etc.
Description of the FTP activity.
Argument (arg)
Action obtained (example: /gi-bin/uploadjs.cgi/)
Virus (virus)
Operation (op)
User (User)
(Groupid)
Some possible values are
FTP command performed.
Authenticated user
Session identifier (link between the commands and data transfer).
Copyright © NETASQ 2008
Page 103 sur 137
ENUG0810-V1.0_NEREPORTER-V8.0
USER GUIDE: APPENDICES
Monitor
The information saved in this log file is as follows:
Identifier (ID)
Date Time (Time)
Firewall (Fw)
Timezone (Tz)
Saved at (Start
time)
Security
System
SEISMO CPU
Pvm
Source Interface
(Srcif)
QoS ID (Qid)
Firewall’s identifier.
Date and time on which the line in the log file was generated at the firewall’s local
time.
Firewall’s serial number or name (if known).
Firewall’s timezone at the moment of writing the log
Time at which event was recorded
Indicator (in percentage) of security problems. The criteria are: minor alarm, major
alarm and ASQ memory).
Indicator (in percentage) of system problems. (The criteria are: Log, Ethernet, CPU,
HA and Daemon).
Indicates the firewall’s use of the CPU.
SEISMO indicators (for vulnerabilities and information). Vulnerability indicators are:
total, remote, target server, critic, minor, major, fixed. Information indicators and:
info total, info minor, info major, monitored.
Network card of the source interface. Ethernet from 0 to 20.
Indicates the number of bytes transmitted through Quality of Service rules.
Natstat
Is used for displaying statistics on address translation, and its source is the firewall process.
Example
The Firewall’s system logs the number of address translations carried out to the internal network, outside
the network and the translation rule used.
Identifier (ID)
Date Time (Time)
Firewall (Fw)
Timezone (Tz)
Saved at (Start
time)
Mapped to
(mappedin)
Mapped to
(mappedout)
Added
Expired
Firewall’s identifier.
Date and time on which the line in the log file was generated at the firewall’s local
time.
Firewall’s serial number or name (if known).
Firewall’s timezone at the moment of writing the log
Time at which event was recorded
Number of incoming packets translated.
Number of outgoing packets translated.
Number of new active sessions.
Timeout, number of expired sessions.
Copyright © NETASQ 2008
Page 104 sur 137
ENUG0810-V1.0_NEREPORTER-V8.0
USER GUIDE: APPENDICES
Memory failure
(Memfail)
Bad NAT (Badnat)
Used (Inuse)
Rules
Dynamic lists
(wilds)
Packets that could not be translated because the limit for the table of active
sessions has been reached.
Untranslated packets (failure during the creation of new sessions).
Number of active sessions
Number of active NAT rules.
Number of translations marked “wild”.
Plugin
Is used for the treatment of ASQ plugins, and its source is NETASQ’s IPS engine – ASQ:
Example
The Firewall’s ASQ kernel logs a malformed HTTP request (number of characters allowed in the request
URL exceeded).
The information saved in this log file is as follows:
Identifier (ID)
Date Time (Time)
Firewall (Fw)
Timezone (Tz)
Saved at (Start
time)
Priority (Pri)
Slotlevel
Rule ID
Source interface
(Srcif)
Source interface
name (Srcifname)
Internet Protocol
(Ipproto)
Protocol (Proto)
Source (Src)
Source Port
(Srcport)
Source name
(Srcname)
Destination (Dst)
Destination Port
(Dstport)
Destination name
(Dstname)
(Sent)
Firewall’s identifier.
Date and time on which the line in the log file was generated at the firewall’s
local time.
Firewall’s serial number or name (if known).
Firewall’s timezone at the moment of writing the log
Time at which event was recorded
The level of the alarm (minor or major).
Number of the active filter policy.
Rule identifier.
Network card of the source interface.
Name of the source interface (only if it is known).
IP
Analyzed protocol or Destination Port.
IP address of the source.
Port number of the source (only if it is TCP/UDP)
Name of the source (only if it is known).
IP address of the destination
Port number of the destination (only if it is TCP/UDP)
Name of the destination (only if it is known)
Number of bytes sent.
Copyright © NETASQ 2008
Page 105 sur 137
ENUG0810-V1.0_NEREPORTER-V8.0
USER GUIDE: APPENDICES
Received (rcvd)
Number of bytes received.
Duration
Duration of the connection.
Operation (Op)
Result
Argument (Arg)
Keywords used in protocols (Example: GET: operation sent to the http server).
Result of the operation in the protocol (Example: 404 which indicates and
error).
Action obtained (Example: /gi-bin/uploadjs.cgi/)
POP3
Is used for sending messages.
Example
The proxy has saved the connection to the POP3 server.
The information saved in this log file is as follows:
Identifier (ID)
Date Time (Time)
Firewall (Fw)
Timezone (Tz)
Saved at (Start
time)
Priority (Pri)
Protocol (Proto)
Operation (Op)
User
Firewall’s identifier.
Date and time on which the line in the log file was generated at the firewall’s
local time.
Firewall’s serial number or name (if known).
Firewall’s timezone at the moment of writing the log
Time at which event was recorded
The level of the alarm (minor or major).
Analyzed protocol or Destination Port.
Keywords used in protocols.
Identifier of the user requesting authentication
Source (Src)
Source address of the host.
Source Port
(Srcport)
Port number of the source (only if it is TCP/UDP)
Destination (Dst)
IP address of the destination
Destination Port
(Dstport)
Source name
(Srcname)
Sent
Port number of the destination (only if it is TCP/UDP)
Received (Rcvd)
Number of bytes received.
Duration
Duration of the connection.
Spam Level
Virus
Action
Message (Msg)
User’s hostname.
Number of bytes sent.
Spam level: 0 (message not considered spam) 1, 2 and 3 (spam) x (error when
processing message) and ? (the nature of the message could not be
determined).
Indicates whether the e-mail contains a virus. Possible values are “safe”,
“infected”, etc.
Filter rule action. (Example: Block, Pass).
Description of the activity on POP3.
Copyright © NETASQ 2008
Page 106 sur 137
ENUG0810-V1.0_NEREPORTER-V8.0
USER GUIDE: APPENDICES
PVM (Proactive Vulnerability management)
Issues all the vulnerabilities viewed by the SEISMO module, and its source is NETASQ’s IPS engine – ASQ:
Example
The vulnerability scanner has detected a vulnerability on the FTP server. The vulnerability is detected in
the hours after it has appeared.
The information saved in this log file is as follows:
Identifier (ID)
Date Time (Time)
Firewall (Fw)
Timezone (Tz)
Saved at (Start
time)
Priority (Pri)
Source (Src)
Source name
(Srcname)
Internet Protocol
(Ipproto)
Protocol (Proto)
Port
Firewall’s identifier.
Date and time on which the line in the log file was generated at the firewall’s local
time.
Firewall’s serial number or name (if known).
Firewall’s timezone at the moment of writing the log
Time at which event was recorded
The level of the alarm (minor or major).
Source address of the connection.
Name of the source (only if it is known).
IP
Analyzed protocol or Destination Port.
Number of the port on which the vulnerability was detected.
Port name
(Portname)
Vulnerability ID
(vulnid)
Message (Msg)
Name of the port on which the vulnerability was detected.
Argument (arg)
Action obtained (Example: PHP_5.1.2)
Family
Vulnerability identifier.
Explanation of the vulnerability or additional information.
Type of family to which the vulnerability belongs.
Severity
The vulnerability’s level of criticality.
Solution
Indicates with a “yes” or “no” if a workaround has been suggested.
Access (Remote)
Target client
(Targetclient)
Target server
(Targetserver)
Discovered on
(Discovery)
The workaround can be accessed locally or remotely (via the network) and allows
exploiting the vulnerability.
Target client.
Target server.
Date on which the vulnerability was discovered.
Server
Copyright © NETASQ 2008
Page 107 sur 137
ENUG0810-V1.0_NEREPORTER-V8.0
USER GUIDE: APPENDICES
Is used for running the administration server on Firewalls – serverd (in this file, all commands sent to serverd
for the configuration of Firewalls are listed. Potentially, all commands for configuring Firewalls can be found
here. These commands are also used for the online configuration of Firewall commands), and its source is
the serverd administration server.
Example
The Firewall’s administration module logs the command “config asq alarm show” whose purpose is to
display the ASQ alarm configuration.
The information saved in this log file is as follows:
Identifier (ID)
Date Time (Time)
Firewall (Fw)
Timezone (Tz)
Saved at (Start
time)
Error
User
Address
Session ID
(Sessionid)
Message (Msg)
Firewall’s identifier.
Date and time on which the line in the log file was generated at the firewall’s local
time.
Firewall’s serial number or name (if known).
Firewall’s timezone at the moment of writing the log
Time at which event was recorded
A whole number beginning with 0 expressing respectively: OK, LAST (last
command), FAILED (command failure), AUTH_FAILED (authentication failure),
LEVEL_DENIED (user privileges do not allow this command to be executed).
The user connected via serverd (not an authenticated user).
IP address used in the connection to the firewall via serverd.
Whole number that corresponds to a number given during a session. When there
are several simultaneous connections, this enables distinguishing the different
sessions.
This displays each command that the client has executed. Sensitive information
(such as passwords) is removed.
SMTP
Is used for SMTP traffic logs, and its source is the SMTP proxy,
Example
The Firewall’s proxy logs the event of an e-mail sent from the user “[email protected]” to
[email protected].
The information saved in this log file is as follows:
Identifier (ID)
Date Time (Time)
Firewall (Fw)
Timezone (Tz)
Saved at (Start
time)
Priority (Pri)
Firewall’s identifier.
Date and time on which the line in the log file was generated at the firewall’s local
time.
Firewall’s serial number or name (if known).
Firewall’s timezone at the moment of writing the log
Time at which event was recorded
The level of the alarm (minor or major).
Copyright © NETASQ 2008
Page 108 sur 137
ENUG0810-V1.0_NEREPORTER-V8.0
USER GUIDE: APPENDICES
Protocol (Proto)
User
Source
Source Port
(Srcport)
Analyzed protocol or Destination Port.
Sender of the e-mail.
Source address of the connection.
Port number of the source (only if it is TCP/UDP)
Destination (Dst)
IP address of the destination
Destination Port
(Dstport)
Source name
(Srcname)
(Sent)
Port number of the destination (only if it is TCP/UDP)
Received (Rcvd)
Number of bytes received.
Duration
Duration of the connection.
Spam level
(spamlevel)
Action
Destination name
(Dstname)
Message (Msg)
Name of the source (only if it is known).
Number of bytes sent.
Spam level.: 1, 2; 3, x (corresponds to an error) and ? (corresponds to N/A).
Rule action (Example: Block, Pass).
Name of the e-mail recipient.
Description (Example: "Error when transmitting data ".
System
Is used for running certain Firewall processes (“System” events with a “System” attribute are logged in this
file). This file has several sources – various Firewall processes (DNS, DHCP, etc services).
Example
The Firewall logs the startup of the Firewall authentication module.
The information saved in this log file is as follows:
Identifier (ID)
Date Time (Time)
Firewall (Fw)
Timezone (Tz)
Firewall’s identifier.
Date and time on which the line in the log file was generated at the firewall’s local
time.
Firewall’s serial number or name (if known).
Firewall’s timezone at the moment of writing the log
Saved at (Start
time)
Service
Time at which event was recorded
Message (Msg)
Explains the action of the service that generated this log.
Name of the writing service.
VPN
Is used for events related to IPSec VPN policies.
Copyright © NETASQ 2008
Page 109 sur 137
ENUG0810-V1.0_NEREPORTER-V8.0
USER GUIDE: APPENDICES
Example
The VPN module logs the creation of an IPSec VPN tunnel between the gateways 192.168.12.35 and
47.89.69.215.
The information saved in this log file is as follows:
Identifier (ID)
Date Time (Time)
Firewall (Fw)
Timezone (Tz)
Saved at (Start
time)
Error message
(Error)
Phase
Source (Src)
Source name
(Srcname)
Destination (Dst)
Destination name
(Dstname)
Initiating cookie
(Cookie_i)
Receiving cookie
(Cookie_r)
Incoming SPI
(Spi_in)
Outgoing SPI
(Spi_out)
Message (Msg)
Firewall’s identifier.
Date and time on which the line in the log file was generated at the firewall’s local
time.
Firewall’s serial number or name (if known).
Firewall’s timezone at the moment of writing the log
Time at which event was recorded
Error message.
SA negotiation phase
Source address of the connection
Name of the source (only if it is known).
IP address of the destination
Name of the destination (only if it is known)
Initiator’s temporary identity marker.
Responder’s temporary identity marker
SPI number of the negotiated incoming SA (in hexadecimal).
SPI number of the negotiated outgoing SA
Description of the negotiation phase (Example: "Phase established”).
Web
Is used for web traffic logs, and its source is the HTTP proxy,
Example
The Firewall’s proxy logs the request from user “john.smith” to consult the website “www.netasq.com”.
The information saved in this log file is as follows:
Identifier (ID)
Date Time (Time)
Firewall (Fw)
Firewall’s identifier.
Date and time on which the line in the log file was generated at the firewall’s
local time.
Firewall’s serial number or name (if known).
Copyright © NETASQ 2008
Page 110 sur 137
ENUG0810-V1.0_NEREPORTER-V8.0
USER GUIDE: APPENDICES
Timezone (Tz)
Saved at (Start time)
Priority (Pri)
Firewall’s timezone at the moment of writing the log
Time at which event was recorded
The level of the alarm (minor or major).
Rule ID (Ruleid)
Rule identifier.
Protocol (Proto)
Analyzed protocol or Destination Port.
Operation (Op)
Result
User
Source (Src)
Source Port (Srcport)
Destination (Dst)
Destination Port
(Dstport)
Source name (Srcname)
Destination name
(Dstname)
Sent
Keywords used in protocols.
Result of the operation performed.
Identifier of the user requesting authentication
Source address of the connection.
Port number of the source (only if it is TCP/UDP)
IP address of the destination
Port number of the destination (only if it is TCP/UDP)
Name of the source (only if it is known).
Name of the destination (only if it is known)
Number of bytes sent.
Received (rcvd)
Number of bytes received.
Duration
Duration of the connection.
Action
Site category (Cat_site)
Argument (arg)
Rule action (Example: Block, Pass).
Category under which a website is placed.
Action obtained (Example: //1/master8.md5)
XVPN
Is used for events related to SSL VPN policies.
Example
The VPN module logs the creation of an SSL VPN tunnel between the gateways 192.168.12.35 and
47.89.69.215.
The information saved in this log file is as follows:
Identifier (ID)
Date Time (Time)
Firewall (Fw)
Timezone (Tz)
Saved at (Start
time)
User
Argument (Arg)
Destination name
(Dstname)
Firewall’s identifier.
Date and time on which the line in the log file was generated at the firewall’s
local time.
Firewall’s serial number or name (if known).
Firewall’s timezone at the moment of writing the log
Time at which event was recorded
Identifier of the user requesting authentication
Action obtained
Name of the destination (only if it is known)
Copyright © NETASQ 2008
Page 111 sur 137
ENUG0810-V1.0_NEREPORTER-V8.0
USER GUIDE: APPENDICES
Destination Port
(Dstport)
Source (Src)
Error message
(Error)
Message (Msg)
Source name
(Srcname)
Dst Port name
(Dstportname)
Port number of the destination (only if it is TCP/UDP)
Source address of the connection.
Error message.
SA negotiation phase
Name of the source (only if it is known).
Name of the destination port (only if it is known)
As indicated above, ASQ, the central process of all NETASQ Firewalls, supplies the four main log files with
the relevant data. Of all these files, the one that seems most important is without a doubt the “alarm” file
which takes into account illegal events (not related to filters), which constitute attacks against the system.
WARNING
The classification of logs here is from a “System” point of view, although certain changes are made
via the NETASQ administration suite for the display of logs.
Example
Logs corresponding to web traffic are displayed in the section File > Web in Reporter. These logs
correspond to the “web” file and to the logs associated with the HTTP plugin in the “plugin” file.
Format of log files
Log files are text files. A log corresponds to a line ending with the characters “0D” and “0A” (in
hexadecimal).
The lines are in WELF format. Documentation on this format can be found on Webtrends’ website:
http://www.webtrends.com/library/prtnr_welf.doc.
Blocked packets and allowed packets
In each log line, it is important to locate the “Action” token, as it enables identifying packets which have been
allowed (by the filter policy or because they had not been blocked by the ASQ analyses) when the “Action”
has been set to “Pass”, and packets which have been blocked (which are either uneventfully deleted by the
Firewall or deleted after a reinitialization has been sent to the packet’s source host – this information is not
available to Firewall administrators) when the “Action” has been set to “Block”.
Logs regarding the change of time on Firewalls
When the Firewall’s time is reset, a special line will be written in all log files, according to the example below:
id=firewall time="2003-12-29 16:35:32"fw="U70XXA0Z0899020"tz=+0100
startime="2003-12-29 16:30:10"datechange=1 duration=322
The “datechange=1” token means that the time was reset and “duration” refers to the lag in seconds.
Exceptions on tokens
Copyright © NETASQ 2008
Page 112 sur 137
ENUG0810-V1.0_NEREPORTER-V8.0
USER GUIDE: APPENDICES
Certain log files do not exactly follow the WELF format. These exceptions will be listed in the following
section.
Exceptions that are common to all logs
“rule” is replaced with “ruleid”,
the “time” token refers to the time (firewall’s local time) at which the line in the log file was saved,
“tz” indicates the time difference from the firewall’s time at the moment the log was written. Therefore it is
possible to find out the time of the log in international time and to analyze attacks launched simultaneously
on equipment in different countries,
“startime” states the time at which a connection started. If the connection lasts for an hour, the “time”
would be roughly equal to “startime” plus one hour,
“groupid” represents a full FTP session – this notion is revisited in plugin logs,
“dstif”, “srcif”, “dstifname”, and “srcifname” refer to the firewall’s source and destination interfaces with their
names,
“user” in several logs corresponds the names of persons authenticated via “authd”,
“icmptype” and “icmpcode” correspond respectively to the ICMP type and code in alarm logs.
ALARM log
Internet Protocol (ipproto): IP.
Source Port (srcport): Port number of the source (only if it is TCP/UDP).
Source port name (Srcportname): Name of the source (only if it is known).
Port Destination (dstport): Port number of the destination (only if it is TCP/UDP).
Dst Port Name (dstportname): Name of the destination port (only if it is known).
Action (action): Filter rule action. (Example: Block, Pass).
Class (class): Detailed category in which the alarm is found (Examples: Filters, Protocol, System,
Pattern…
Classification (classification): Generic category in which the alarm is found (Examples: Protocol,
Content_filtering, Web, Mail, FTP…)
Packet length (Pktlen): Length of the captured network packet.
(Pktdump): Available network packet.
(AlarmID): Alarm identifier.
(Repeat): Number of times this alarm has been repeated within a given duration.
AUTH log
In “user”, the person who has attempted to or has authenticated,
“Method” corresponds to the method used for authentication – please refer to the section on
authentication,
“Message (Msg)” contains text expanding on the number of hours allocated,
“Error” is a whole number – 0 for “OK” and “2” for “FAILED” (authentication failure).
COUNT log
Tokens that begin with “Rule” followed by a whole number correspond to the rule index. The associated
value represents the number of times the rule matched.
Example
Rule0=1661: Rule 0 matched 1661 times.
FILTER log
Slotlevel: number of the active filter policy.
Copyright © NETASQ 2008
Page 113 sur 137
ENUG0810-V1.0_NEREPORTER-V8.0
USER GUIDE: APPENDICES
FILTERSTAT log
Tokens that begin with “Rule” followed by a whole number correspond to the rule index. The associated
value represents the number of times the rule matched.
Example
Rule0=1661: Rule 0 matched 1661 times.
Saved Evaluation (SavedEvaluation): number of rule evaluations that could not be performed because of
the ASQ technology.
Host Memory (HostMem): Memory allocated to a host.
Fragment Memory (FragMem): Memory allocated to fragments.
ICMP Memory (ICMPMem): Memory allocated to ICMP.
Dynamic memory (Dynamicmem): percentage of ASQ memory in use.
Connection Memory (ConnMem): Memory allocated to connections.
Logged: Number of log lines generated by ASQ.
Log Overflow (LogOverflow): Number of log lines lost (could not be generated by ASQ).
SEISMO events (PvmFacts): Basic information (banners, HTTP user agent, mail client...) that ASQ has
sent to SEISMO for vulnerability analysis.
SEISMO Overflow (PvmOverflow): Number (higher than 0) indicating that vulnerabilities will be rejected in
the event network traffic gets too heavy (if the event does not arise again later, or if it has not yet been
encountered).
Accepted: Number of packets matching “Pass” rules.
Blocked: Number of packets matching “Block” rules.
Byte: Number of bytes transmitted through the firewall.
Fragmented: Number of fragmented packets transmitted through the firewall.
TCP Packet (TCPPacket): Number TCP packets transmitted through the firewall.
TCP Byte (TCPByte): Number of bytes from TCP packets transmitted through the firewall.
TCP Conn (TCPConn): Number of TCP connections made through the firewall.
UDP Packet (UDPPacket): Number of UDP packets transmitted through the firewall.
UDP Byte (UDPByte): Number of bytes from UDP packets transmitted through the firewall.
UDP Connection (UDPConn): Number of UDP connections made through the firewall.
ICMP Packet (ICMPPacket): Number of ICMP packets transmitted through the firewall.
ICMP Byte (ICMPByte): Number of bytes from ICMP packets transmitted through the firewall.
DTrackMem: Percentage of memory used. If it is at 100%, this means that it is fully used, and 0% means
it is fully available.
Copyright © NETASQ 2008
Page 114 sur 137
ENUG0810-V1.0_NEREPORTER-V8.0
USER GUIDE: APPENDICES
MONITOR log
Security (Security): Indicator (in percentage) of security problems. The criteria are: minor alarm, major
alarm and ASQ memory)..
System (system): Indicator (in percentage) of system problems. (The criteria are: Log, Ethernet, CPU, HA
and Daemon ).
CPU: Indicates the firewall’s use of the CPU .
SEISMO (Pvm): SEISMO indicators (for vulnerabilities and information). Vulnerability indicators are: total,
remote, target server, critic, minor, major, fixed. Information indicators and: info total, info minor, info major,
monitored.
QoS ID (Qid): Indicates the number of bytes transmitted through Quality of Service rules.
NATSTAT log
The specific tokens are:
Mapped to (Mappedin): number of incoming packets translated.
Mapped to (Mappedout): number of outgoing packets translated.
Added: number of new active sessions.
Expired: timeout, number of expired sessions
Memory failure (Memfail): packets that could not be translated because the limit for the table of active
sessions has been reached.
Bad NAT (Badnat): untranslated packets (failure during the creation of new sessions).
Used (Inuse): number of active sessions.
Dynamic lists (Wilds): Number of translations marked “wild”.
POP3 log
Spamlevel: Spam level: 0 (message not considered spam) 1, 2 and 3 (spam) x (error when processing
message) and ? (the nature of the message could not be determined).
Virus (virus): Indicates whether the e-mail contains a virus. Possible values are “safe”, “infected”, etc.
PVM log
Family (family): Type of family to which the vulnerability belongs.
Severity (severity): The vulnerability’s level of criticality.
Solution (solution): Indicates with a “yes” or “no” if a workaround has been suggested.
Access (Remote): The workaround can be accessed locally or remotely (via the network) and allows
exploiting the vulnerability.
Target client (Targetclient): Target client.
Target server (Targetserver): Target server.
Detected on (Discovery): Date on which the vulnerability was discovered.
SERVER log
"Error" is a whole number beginning with 0 expressing respectively: OK, LAST (last command), FAILED
(command failure), AUTH_FAILED (authentication failure), LEVEL_DENIED (user privileges do not allow this
command to be executed.
"User" corresponds to the user connected via serverd (NOT authenticated user).
"Address" is the IP address used in the connection to the firewall via serverd.
"Sessionid" is a whole number that corresponds to a number given during a session. When there aer
several simultaneous connection, this enables distinguishing the different sessions.
Message (Msg): this displays each command that the client has executed. Sensitive information (such as
passwords) is removed.
Copyright © NETASQ 2008
Page 115 sur 137
ENUG0810-V1.0_NEREPORTER-V8.0
USER GUIDE: APPENDICES
Journal SYSTEM
Proxies also write events particular to their operation in this log.
"Service" corresponds to the name of the writing service.
Message (Msg) explains the action of the service that generated this log.
VPN log
Initiating cookie (Cookie_i): Initiator’s temporary identity marker.
Receiving cookie (Cookie_r): Responder’s temporary identity marker
Incoming SPI (Spi_in): SPI number of the negotiated incoming SA (in hexadecimal)..
Outgoing SPI (Spi_out): SPI number of the negotiated outgoing SA.
Web log
Site category (Cat_site): Category under which a website has been placed.
Appendix B: List of filters by log file
Administration
<Any>
Result_cmd_failed
Result_cmd_success
User_admin
Alarm
<Any>
Configuration modification
Configuration validation
Flooding alarms
Incoming
Info requests
Major alarms
Major and block
Messenger
Minor alarms
Multimedia
P2P
P2P/Messenger/Multimedia
Pattern alarm
Protocol class
Copyright © NETASQ 2008
Page 116 sur 137
ENUG0810-V1.0_NEREPORTER-V8.0
USER GUIDE: APPENDICES
Spoofing alarms
System class
Wrong or strange packets
Authentication
<Any>
Auth_failed
Method_null
Method_TRANSPARENTSSL
Counters
<Any>
Connection
<Any>
Email_traffic
HTTP protocol
HTTPS protocol
More than 1 hour
More than 10 MB
received
More than 10 MB
sent
SMTP protocol
Filter stat
<Any>
Filters
<Any>
Blocked actions
Monitor
Copyright © NETASQ 2008
Page 117 sur 137
ENUG0810-V1.0_NEREPORTER-V8.0
USER GUIDE: APPENDICES
<Any>
Nat stat
<Any>
Plugin
<Any>
Operation is retr
Operation is stor
Plugin_ftp
Plugin_http
Proto_HTTP
POP3
<Any>
Mail virus detected
(received)
Pop3_infected
Spam (pop)
SEISMO
<Any>
Critical_severity
High_severity
Info_severity
Local_exploit
Indicates the location where a vulnerability can be exploited (2
possible options: locally or remotely).
Low_severity
Medium_severity
More_than_info_sev
erity
OS_detected
Remote_exploit
Target_client
Target_server
Vuln_with_solution
_more_than_info
Vuln_without_soluti
on_more_than_info
Vulnerability_with_s
Copyright © NETASQ 2008
Page 118 sur 137
ENUG0810-V1.0_NEREPORTER-V8.0
USER GUIDE: APPENDICES
olution
Vulnerability_witho
ut_solution
SMTP
<Any>
Mail virus detected
(sent)
Smtp_infected
Spam (smtp)
System
<Any>
Service_proxy
Service_sld
Service_sysevent
IPSec VPN
<Any>
Error_result
Information_result
Msg_monitoring
Phase1
SSL VPN
<Any>
Access_denied_xvpn
Auth_success_xvpn
Web
<Any>
Action is block
Anonymous
Proxies
Virus detected
Virus detected (not
corrupted)
Copyright © NETASQ 2008
Page 119 sur 137
ENUG0810-V1.0_NEREPORTER-V8.0
USER GUIDE: GLOSSARY
GLOSSARY
The terms found in this glossary are related to the subjects covered in this manual.
100BaseT
Also known as "Fast Ethernet," 100BaseT is Ethernet in 100 Mbps instead of the standard 10 Mbps.
Like regular Ethernet, Fast Ethernet is a shared media network in which all nodes share the 100
Mbps bandwidth.
A
Active Update
The Active Update module on NETASQ firewalls enables updating antivirus and ASQ contextual
signature databases as well as the list of antispam servers and the URLs used in dynamic URL
filtering.
Address book
A centralized tool for several NETASQ applications. This address book can contain all the
necessary information for connecting to a list of firewalls, simplifying the administrator’s access as he
no longer has to remember all the different passwords this entails.
Address translation
Changing an address into another. For example, assemblers and compilers translate symbolic
addresses into machine addresses. Virtual memory systems translate a virtual address into a real
address (address resolution)
Advanced mode (Router)
Configuration mode in which the firewall acts as a router between its different interfaces. This
involves changes in IP addresses on routers or servers when you move them to a different network
(behind an interface on a different network)
AES (Advanced Encryption Standard)
A secret key cryptography method that uses keys ranging from 128 to 256 bits. AES is more
powerful and secure than Triple DES, until recently the de facto standard.
Alias IP
A supplementary address associated with an interface.
Antispam
System that allows the reduction of the number of unsolicited and occasionally malicious electronic
messages that flood mail systems and attempt to abuse users.
Copyright © NETASQ 2008
Page 120 sur 136
ENUG0810-V1.0_NEREPORTER-V8.0
USER GUIDE: GLOSSARY
Antispyware
System that enables detecting and/or blocking the spread of spy software (which gathers personal
information about the user in order to transmit it to a third party) on client workstations.
Antivirus
System that detects and/or eradicates viruses and worms.
Antivirus (Kaspersky)
An integrated antivirus program developed by Kaspersky Labs which detects and eradicates viruses
in real time. As new viruses are discovered, the signature database has to be updated in order for
the antivirus program to be effective
Appliance
Hardware that embeds the software as well as its operating system.
Asic (Application-Specific Integrated Circuit)
Specially-designed technology for a handful of specific features. These features are directly
managed by the circuit instead of the software. ASICs cannot be reprogrammed.
ASQ (Active Security Qualification)
Technology which offers NETASQ Firewalls not only a very high security level but also powerful
configuration help and administration tools. This intrusion prevention and detection engine integrates
an IPS which detects and gets rid of any malicious activity in real time.
Asymmetrical cryptography
A type of cryptographic algorithm that uses different keys for encryption and decryption.
Asymmetrical cryptography is often slower than symmetrical cryptography and is used for key
exchange and digital signatures. RSA and Diffie-Hellman are examples of asymmetrical algorithms.
Authentication
The process of verifying a user's identity or origin of a transmitted message, providing the assurance
that the entity (user, host, etc.) requesting access is really the entity it claims to be. Authentication
can also refer to the procedure of ensuring that a transaction has not been tampered with.
Authentication header (AH)
Set of data allowing verification that contents of a packet have not been modified and also to validate
the identity of a sender.
B
Backup appliance
Formerly known as a "slave", a backup appliance is used in high availability. It transparently takes
over the master appliance's operations when the former breaks down, thereby ensuring the system
to continue functioning with minimum inconvenience to the network's users.
Copyright © NETASQ 2008
Page 121 sur 136
ENUG0810-V1.0_NEREPORTER-V8.0
USER GUIDE: GLOSSARY
Bandwidth
The transmission capacity of an electronic pathway (e.g. communications lines). It is measured in
bits per second or bytes per second in a digital line and in an analog line, it is measured in Hertz
(cycles per second).
Blowfish
A secret key cryptography method that uses keys ranging from 32 to 448 bits as a free replacement
for DES or IDEA.
Bridge
Device connecting 2 LAN segments together, which may be of similar or dissimilar types (eg,
Ethernet and Token Ring). The bridge is inserted into a network to segment it and keep traffic
contained within segments to improve performance. Bridges learn from experience and build and
maintain address tables of the nodes on the network. By keeping track of which station
acknowledged receipt of the address, they learn which nodes belong to the segment.
Bridge or transparent mode
The transparent mode, also know as "bridge", allows keeping the same address range between
interfaces. It behaves like a filtering bridge, meaning that all the network traffic passes through it.
However, it is possible to subsequently filter traffic that passes through it according to your needs
and to therefore protect certain portions of the network
Brute force attack
An exhaustive and determined method of testing all possible combinations, one by one, to find out a
password or secret key by trial and error. This method only works when the sought after password
contains very few characters.
This attack can be thwarted simply by choosing longer passwords or keys, which the intruder will
take longer to find out.
Buffer
Temporary storage zone.
Buffering
Temporary storage of information for the purpose of processing it at one go, instead of as and when
it is received.
Buffer overflow
An attack which usually works by sending more data than a buffer can contain so as to make a
program crash (a buffer is a temporary memory zone used by an application). The aim of this attack
is to exploit the crash and overwrite part of the application's code and insert malicious code, which
will be run after it has entered memory.
C
CA Certificate (or Certification)
Authority - A trusted third-party company or organization which issues digital certificates. Its role is to
guarantee that the holder of the certificate is indeed who he claims to be. CAs are critical in data
security and electronic commerce because they guarantee that parties exchanging information are
really who they claim to be.
Copyright © NETASQ 2008
Page 122 sur 136
ENUG0810-V1.0_NEREPORTER-V8.0
USER GUIDE: GLOSSARY
Certificate
(see digital certificate)
Certificate Revocation List (CRL)
A list of expired (revoked) certificates or of those that are no longer considered trustworthy. It is
published and regularly maintained by a CA to ensure the validity of existing certificates.
Challenge/response
An authentication method for verifying the legitimacy of users logging onto the network wherein a
user is prompted (the challenge) to provide some private information (the response). When a user
logs on, the server uses account information to send a "challenge" number back to the user. The
user enters the number into a credit-card sized token card that generates a response which is sent
back to the server.
Chassis
Also called a case, it is a physical structure that serves as a support for electronic components. At
least one chassis is required in every computer system in order to house circuit boards and wiring.
Context
The current status, condition or mode of a system.
Common criteria
The common criteria, an international standard, evaluate (on an Evaluation Assurance Level or EAL
scale of 1 to 7) a product’s capacity to provide security functions for which it had been designed, as
well as the quality of its life cycle (development, production, delivery, putting into service, update).
Contextual signature
An attack signature, ie, the form that an attack takes. ASQ relies on a database of contextual
signatures to detect known attacks in a short time.
CPU (Central Processing Unit)
Better known as a processor, this is an internal firewall resource that performs the necessary
calculations.
Cryptography
The practice of encrypting and decrypting data.
D
Daemon
An application that runs permanently in the background on an operating system.
Datagram
An information block sent over a communication line within a network.
Data Encryption Standard (DES)
Cryptographic algorithm for the encryption of data. In particular, it allows encrypting data by blocks.
Copyright © NETASQ 2008
Page 123 sur 136
ENUG0810-V1.0_NEREPORTER-V8.0
USER GUIDE: GLOSSARY
Data evasion
Also known as IDS evasion, it is a hacker's method of tricking an intrusion detection system by
presenting to it packets formed from similar headers but which contain data different from what the
client host will receive.
Denial of service (DoS) attack
An attack which floods a network with so many requests that regular traffic is slowed down or
completely interrupted, preventing legitimate requests from being processed.
DHCP (Dynamic Host Configuration Protocol)
Protocol that allows a connected host to dynamically obtain its configuration (mainly its network
configuration). DHCP finds its own IP address. The aim of this protocol is to simplify network
administration.
Dialup
Interface on which the modem is connected.
Diffie-Hellmann key exchange algorithm
An algorithm that enables parties to exchange public keys securely in order to arrive at a shared
secret key at both ends, without ever having to transmit the secret key, thereby avoiding the risk of
the secret key being intercepted. It does not carry out data encryption, and can even be used over
untrusted channels.
Digital certificate
The digital equivalent of an identity card for use in a public key encryption system, these are mainly
used to verify that a user sending a message is who he claims to be, and to provide the receiver of a
message with a way to encrypt his reply. The X.509 format is most typically used and contains
information regarding the user and the certification authority.
Digital signature
Method of verifying identities on a network based on public key encryption.
DMZ (DeMilitarized Zone)
Buffer zone of an enterprise's network, situated between the local network and the internet, behind
the firewall. It corresponds to an intermediary network grouping together public servers (HTTP,
SMTP, FTP, etc.) and whose aim is to avoid any direct connection with the internal network in order
to warn it of any external attack from the web.
DNS (Domain Name System)
Distributed database and server system which ensures the translation of domain names used by
internet users into IP addresses to be used by computers, in order for messages to be sent from one
site to another on the network.
Copyright © NETASQ 2008
Page 124 sur 136
ENUG0810-V1.0_NEREPORTER-V8.0
USER GUIDE: GLOSSARY
Dynamic quarantine
An imposed quarantine following a specific event, eg, when a particular alarm is raised.
Dynamic routing
Routing that adapts automatically to changes that arise on a network so that packets can be
transported via the best route possible.
E
Encapsulation
A method of transmitting multiple protocols within the same network. The frames of one type of
protocol are carried within the frames of another.
Encryption
The process of translating raw data (known as plaintext) into a seemingly meaningless version
(ciphertext) to protect the confidentiality, integrity and authenticity of the original data. A secret key is
usually needed to unscramble (decrypt) the ciphertext.
Ethernet
Packet switching information network protocol, a technology that allows all hosts on a local network
to connect to the same communication line.
Ethernet port
(see Ethernet).
F
Filtering router
Router which implements packet filters.
Filter policy
One of the more important aspects in the security of the resources that the firewall protects – the
creation of filter rules that allow avoiding network flaws.
Filter rule
A rule created to perform several possible actions on incoming or outgoing packets. Possible actions
include blocking, letting through or disregarding a packet. Rules may also be configured to generate
alarms which will inform the administrator of a certain type of packet passing through.
Firewall
A basic feature in peripheral information security, a firewall can be a hardware or software that
allows filtering access to and from the company network.
Firmware
Software that allows a component to run before the drivers.
Copyright © NETASQ 2008
Page 125 sur 136
ENUG0810-V1.0_NEREPORTER-V8.0
USER GUIDE: GLOSSARY
FTP (File Transfer protocol)
Common internet protocol used for exchanging files between systems. Unlike other TCP/IP
protocols, FTP uses two connections – one for exchanging parameters and another for the actual
data.
Full duplex
Two-way communication in which sending and receiving can be simultaneous.
G
Gateway
Host which acts as an entrance or connection point between two networks (such as an internal
network and the internet) which use the same protocols.
Gigabit Ethernet
An Ethernet technology that raises transmission speed to 1 Gbps (1000Mbps).
H
Half-duplex
One-way communication mode in which data can only be sent in one direction at a time.
Hash function
An algorithm that converts text of a variable length to an output of fixed size. The hash function is
often used in creating digital signatures.
Header
A temporary set of information that is added to the beginning of the text in order to transfer it over the
network. A header usually contains source and destination addresses as well as data that describe
the contents of the message.
High availability
A solution based on a group of two identical Firewalls which monitor each other. If there is a
malfunction in the Firewall software or hardware during use, the second Firewall takes over. This
switch from one Firewall to the other is wholly transparent to the user.
Hot swap
The ability to pull out a device from a system and plug in a new one while the power is still on and
the unit is still running, all while having the operating system recognize the change automatically.
HTTP
Protocol used for transferring hypertext documents between a web server and a web client.
HTTP Proxy
A proxy server that specializes in HTML (Web page) transactions.
Hub
A central connection point in a network that links segments of a LAN.
Copyright © NETASQ 2008
Page 126 sur 136
ENUG0810-V1.0_NEREPORTER-V8.0
USER GUIDE: GLOSSARY
Hub and spoke
Any architecture that uses a central connecting point that is able to reach all nodes on the periphery
(“spokes”).
Hybrid mode
Mode which combines two operation modes - transparent mode (bridge principle) and advanced
mode (independent interfaces). The purpose of the hybrid mode is to operate several interfaces in
the same address class and others in different address classes.
Hypertext
Term used for text which contains links to other related information. Hypertext is used on the World
Wide Web to link two different locations which contain information on similar subjects.
I
ICMP (Internet Control Message Protocol)
A TCP/IP protocol used to send error and control messages and for exchanging control information.
IDS (Intrusion Detection System)
Software that detects attacks on a network or computer system without blocking them.
IKE (Internet Key Exchange)
A method for establishing an SA which authenticates the encryption and authentication algorithms to
be applied on the datagrams that it covers, as well as the associated keys.
Implicit filter rule
Filter rule that the firewall implicitly generates after the administrator has modified its configuration.
For example, when the http proxy is activated, a set of implicit filter rules will be generated in order to
allow connections between the client and the proxy as well as between the proxy and the server.
Interface
A zone, whether real or virtual, that separates two elements. The interface thus refers to what the
other element need to know about the other in order to operate correctly.
Internet Protocol
Protocol used for routing packets over networks. Its role is to select the best path for conveying
packets through the networks.
IP Address
(IP being Internet Protocol). An IP address is expressed in four sets of numbers (from 0 to 255)
separated by dots, and which identify computers on the internet
IPS (Intrusion Prevention System)
System that enables detecting and blocking intrusion attempts, from the Network level to the
Application level in the OSI model.
IPSEC
Copyright © NETASQ 2008
Page 127 sur 136
ENUG0810-V1.0_NEREPORTER-V8.0
USER GUIDE: GLOSSARY
A set of security protocols that provides authentication and encryption over the internet and supports
secure exchanges. It is largely used for the setup of VPNs (Virtual Private Networks).
ISAKMP (Internet Security Association and Key Management Protocol)
A protocol through which trusted transactions between TCP/IP entities are established.
K
Kernel
The core of the operating system.
L
LAN (Local Area Network)
A communications network that is spread out over a limited area, usually a building or a group of
buildings and uses clients and servers - the "clients" being a user's PC which makes requests and
the "servers" being the machine that supplies the programs or data requested.
LDAP (Lightweight Directory Access Protocol)
A protocol or set of protocols used to access directory listings.
Leased line
A permanent telephone connection between two points, as opposed to dialup. Typically used by
enterprises to connect remote offices.
Load balancing
Distribution of processing and communications activity across a computer network to available
resources so that servers do not face the risk of being overwhelmed by incoming requests.
Logs
A record of user activity for the purpose of analyzing network activity.
M
MAC address (Media Access Control Address)
A hardware address that physically identifies each node of a network and is stored on a network
card or similar network interface. It is used for attributing a unique address at the data link level in
the OSI model.
Copyright © NETASQ 2008
Page 128 sur 136
ENUG0810-V1.0_NEREPORTER-V8.0
USER GUIDE: GLOSSARY
Man-in-the-middle attack
Also known as a "replay attack", this consists of a security breach in which information is stored
without the user's authorization and retransmitted, giving the receiver the impression that he is
participating in an authorized operation. As a result of this, an attacker can intercept keys and
replace them with his own without the legitimate parties' knowledge that they are communicating
with an attacker in the middle.
MAP
This translation type allows converting an IP address (or n IP addresses) into another (or n IP
addresses) when going through the firewall, regardless of the connection source.
Modularity
Term describing a system that has been divided into smaller subsystems which interact with each
other.
MSS (Maximum Segment Size)
MSS value represents the largest amount of data (in bytes) that a host or any other communication
device van contain in a single unfragmented frame. To get the best yield possible, the size of the
data segment and the header have to be lower than the MTU.
N
NAT (Network address Translation)
Mechanism situated on a router that allows matching internal IP addresses (which are not unique
and are often unroutable) from one domain to a set of unique and routable external addresses. This
helps to deal with the shortage of IPv4 addresses on the internet as the IPv6 protocol has a larger
addressing capacity.
NETASQ EVENT REPORTER
Module in NETASQ’s Administration Suite that allows viewing log information generated by firewalls.
NETASQ REAL-TIME MONITOR
Module in NETASQ’s Administration Suite that allows viewing the firewall’s activity in real time.
NETASQ Shield
Security agent that protects Microsoft Windows® workstations and servers by integrating NETASQ’s
ASQ technology.
NETASQ UNIFIED MANAGER
Module in NETASQ’s Administration Suite that allows configuring firewalls.
Non-repudiation
The capacity of parties involved in a transaction to attest to the participation of the other person in
the said transaction.
Copyright © NETASQ 2008
Page 129 sur 136
ENUG0810-V1.0_NEREPORTER-V8.0
USER GUIDE: GLOSSARY
NTP (Network Time Protocol)
Protocol that allows synchronizing clocks on an information system using a network of packets of
variable latency.
O
Object
Objects used in the configuration of filter or address translation. These may be hosts, users,
address ranges, networks, service, protocols, groups, user groups and network groups.
OS detection
A method of determining the operating system and other characteristics of a remote host, using tools
such as queso or nmap.
OSI
International standard defined by ISO describing a generic 7-layer model for the interconnection of
heterogeneous network systems. The most commonly-used layers are the “Network” layer, which is
linked to IP, the “Transport” layer, linked to TCP and UDP and the “Application” layer, which
corresponds to application protocols (SMTP, HTTP, HTTPS, IMAP, Telnet, NNTP…).
P
Pack
Rfers to a unit of information transported over a network. Packets contain headers (which contain
information on the packet and its data) and useful data to be transmitted to a particular destination.
Packet analyzer
When an alarm is raised on a NETASQ Firewall, the packet that caused this alarm to be raised can
be viewed. To be able to do so, a packet viewing tool like “Ethereal” or “Packetyzer” is necessary.
Specify the selected tool in the Packet analyzer field, which Reporter will use in order to display
malicious packets.
Partition
A section of disk or memory that is reserved for a particular application.
PAT (Port Address Translation)
Modification of the addresses of the sender and recipient on data packets. Changes in IP address
involve the PAT device's external IP address, and port numbers, instead of IP addresses, are used
to identify different hosts on the internal network. PAT allows many computers to share one IP
address.
Peer-to-peer
Workstation-to-workstation link enabling easy exchange of files and information through a specific
software. This system does not require a central server, thus making it difficult to monitor.
Copyright © NETASQ 2008
Page 130 sur 136
ENUG0810-V1.0_NEREPORTER-V8.0
USER GUIDE: GLOSSARY
Ping (Packet INternet Groper)
An internet utility used to determine whether a particular IP address is accessible (or online). It is
used to test and debug a network and to troubleshoot internet connections by sending out a packet
to the specified address and waiting for a response.
PKI (Public Key Infrastructure)
A system of digital certificates, Certificate Authorities and other registration authorities which verify
and authenticate the validity of parties involved in an internet transaction.
Plugin
An auxiliary program that adds a specific feature or service to a larger system and works with a
major software package to enhance its capacity.
Port redirection (REDIRECT)
The use of a single IP address to contact several servers.
Port scanning
A port scan is a technique that allows sending packets to an IP address with a different port each
time, in the hopes of finding open ports through which malicious data can be passed and discovering
flaws in the targeted system. Administrators use it to monitor hosts on their networks while hackers
use it in an attempt to compromise it.
PPP (Point-to-Point Protocol)
A method of connecting a computer to the internet. It provides point-to-point connections from router
to router and from host to network above synchronous and asynchronous circuits. It is the most
commonly used protocol for connecting to the internet on normal telephone lines.
PPPoE (Point-to-Point Protocol Over Ethernet)
A protocol that benefits from the advantages of PPP (security through encryption, connection control,
etc). Often used on internet broadband connections via ADSL and cable.
PPTP (Point-to-Point Tunnelling Protocol)
A protocol used to create a virtual private network (VPN) over the Internet. The internet being an
open network, PPTP is used to ensure that messages transmitted from one VPN node to another are
secure.
Private IP Address
Some IP address ranges can be used freely as private addresses on an Intranet, meaning, on a local
TCP/IP network. Private address ranges are
172.16.0.0 to 172.31.255.255
192.168.0.0 to 192.168.255.255
10.0.0.0 to 10.255.255.255
Private key
One of two necessary keys in a public or asymmetrical key system. The private key is usually kept
secret by its owner.
Protocol analysis
A method of analysis and intrusion prevention that operates by comparing traffic against the
standards that define the protocols.
Copyright © NETASQ 2008
Page 131 sur 136
ENUG0810-V1.0_NEREPORTER-V8.0
USER GUIDE: GLOSSARY
Protocols
A set of standardized rules which defines the format and manner of a communication between two
systems. Protocols are used in each layer of the OSI model.
Proxy
System whose function is to relay connections that it intercepts, or which have been addressed to it.
In this way, the proxy substitutes the initiator of the connection and fully recreates a new connection
to the initial destination. Proxy systems can in particular be used to carry out cache or connection
filter operations.
Proxy server
(see Proxy).
Public key
One of two necessary keys in a public or asymmetrical key cryptography. The public key is usually
made known to the public.
Q
QID
QoS queue identifier.
QoS (Quality of Service)
A guaranteed throughput level in an information system that allows transporting a given type of traffic
in the right condition, ie, in terms of availability and throughput. Network resources are as such
optimized and performance is guaranteed on critical applications.
R
RADIUS (Remote Authentication Dial-In User Service)
An access control protocol that uses a client-server method for centralizing authentication data. User
information is forwarded to a RADIUS server, which verifies the information, then authorizes or
prohibits access.
RAID (Redundant array of independent disks)
Hardware architecture that allows accelerating and securing access to data stored on hard disks
and/or making such access reliable. This method is based on the multiplication of hard disks.
Replay
Anti-replay protection means a hacker will not be able to re-send data that have already been
transmitted.
RFC (Request for Comments)
A series of documents which communicates information about the internet. Anyone can submit a
comment, but only the Internet Engineering Task Force (IETF) decides whether the comment should
become an RFC. A number is assigned to each RFC, and it does not change after it is published.
Any amendments to an original RFC are given a new number.
Copyright © NETASQ 2008
Page 132 sur 136
ENUG0810-V1.0_NEREPORTER-V8.0
USER GUIDE: GLOSSARY
Router
A network communication device that enables restricting domains and determining the next network
node to which the packet should be sent so that it reaches its destination fastest possible.
Routing protocol
A formula used by routers to determine the appropriate path onto which data should be forwarded.
With a routing protocol, a network can respond dynamically to changing conditions, otherwise all
routing decisions have to be predefined.
S
SA (Security Association)
VPN tunnel endpoint.
SCSI (Small computer system interface)
standard that defines an interface between a computer and it(s) storage peripherals, known for its
reliability and performance.
Security policy
An organization's rules and regulations governing the properties and implementation of a network
security architecture.
SEISMO
Module that allows the network administrator to collect information in real time and to analyze it in
order to weed out possible vulnerabilities that may degrade the network. Some of its functions
include raising ASQ alarms and maintaining an optimal security policy.
Session key
A cryptographic key which is good for only one use and for a limited period. Upon the expiry of this
period, the key is destroyed, so that if the key is intercepted, data will not be compromised.
Signature
A code that can be attached to a message, uniquely identifying the sender. Like a written signature,
the purpose of a digital signature is to guarantee that the individual sending the message really is
who he claims to be.
Single-use password
A secure authentication method which deters the misuse of passwords by issuing a different
password for each new session.
Slot
Configuration files in the NETASQ UNIFIED MANAGER application, numbered from 01 to 10 and
which allow generating filter and NAT policies, for example.
SMTP (Simple Mail Transfer Protocol)
TCP/IP communication protocol used for electronic mail exchange over the internet.
Copyright © NETASQ 2008
Page 133 sur 136
ENUG0810-V1.0_NEREPORTER-V8.0
USER GUIDE: GLOSSARY
SMTP Proxy
A proxy server that specializes in SMTP (mail) transactions.
SNMP (Simple Network Management Protocol)
Communication protocol that allows network administrators to manage network devices and to
diagnose network incidents remotely.
SSH (Secure Shell)
Software providing secure logon for Windows and UNIX clients and servers.
SSL (Secure Socket Layer)
Protocol that secures exchanges over the internet. It provides a layer of security (authentification,
integrity, confidentiality) to the application protocols that it supports.
Star topology / Network
A LAN in which all terminals are connected to a central computer, hub or switch by point-to-point
links. A disadvantage of this method is that all data has to pass through the central point, thus raising
the risk of saturation.
Stateful Inspection
Method of filtering network connections invented by Check Point, based on keeping the connection
status. Packets are authorized only if they correspond to normal connections. If a filter rule allows
certain outgoing connections, it will implicitly allow incoming packets that correspond to the
responses of these connections.
Static quarantine
A quarantine that the administrator sets when configuring the firewall.
Symmetrical key cryptography
A type of cryptographic algorithm in which the same key is used for encryption and decryption. The
difficulty of this method lies in the transmission of the key to the legitimate user. DES, IDEA, RC2
and RC4 are examples of symmetrical key algorithms.
T
TCP (Transmission Control Protocol)
A reliable transport protocol in connected mode. The TCP session operates in three phases –
establishment of the connection, the transfer of data and the end of the connection.
Copyright © NETASQ 2008
Page 134 sur 136
ENUG0810-V1.0_NEREPORTER-V8.0
USER GUIDE: GLOSSARY
Throughput
The speed at which a computer processes data, or the rate of information arriving at a particular
point in a network system. For a digital link, this means the number of bits transferred within a given
timeframe. For an internet connection, throughput is expressed in kbps (kilobits per second).
Trace route
Mechanism that detects the path a packet took to get from one point to another.
Trojan horse
A code inserted into a seemingly benign programme, which when executed, will perform fraudulent
acts such as information theft.
TTL (Time-to-Live)
The period during which information has to be kept or cached.
U
UDP (User Datagram Protocol)
One of the main communication protocols used by the internet, and part of the transport layer in the
TCP/IP stack.
This protocol enables a simple transmission of packets between two entities, each of which has
been defined by an IP address and a port number (to differentiate users connected on the same
host).
Unidirectional translation (MAP)
This translation type allows you to convert real IP addresses on your networks (internal, external or
DMZ) into a virtual IP address on another network (internal, external or DMZ) when passing through
the firewall.
URL filter
Service that enables limiting the consultation of certain websites. Filters can be created in
categories containing prohibited URLs (eg. Porn, games, webmail sites, etc) or keywords.
URL (Uniform Resource Locator)
Character string used for reaching resources on the web. Informally, it is better know as a web
address.
User enrolment
When an authentication service has been set up, every authorized user has to be defined by creating
a “user” object. The larger the enterprise, the longer this task will take. NETASQ’s web enrolment
service makes this task easier. If the administrator has defined a PKI, “unknown” users will now
request the creation of their accounts and respective certificates.
UTM (Unified Threat Management)
Concept that consists of providing the most unified solution possible to counter multiple threats to
information security (viruses, worms, Trojan horses, intrusions, spyware, denials de service, etc).
Copyright © NETASQ 2008
Page 135 sur 136
ENUG0810-V1.0_NEREPORTER-V8.0
USER GUIDE: GLOSSARY
V
VLAN (Virtual Local Area Network)
Network of computers which behave as if they are connected to the same network even if they may
be physically located on different segments of a LAN. VLAN configuration is done by software
instead of hardware, thereby making it very flexible.
VPN (Virtual Private Network)
The interconnection of networks in a secure and transparent manner for participating applications
and protocols – generally used to link private networks to each other through the internet.
VPN keep alive
The artificial creation of traffic in order to remove the latency time which arises when a tunnel is
being set up and also to avoid certain problems in NAT.
VPN Tunnel
Virtual link which uses an insecure infrastructure such as the internet to enable secure
communications (authentication, integrity & confidentiality) between different network equipment.
W
WAN (Wireless Area Network)
Local wireless network.
Wifi (Wireless Fidelity)
Technology allowing wireless access to a network.
Copyright © NETASQ 2008
Page 136 sur 136
ENUG0810-V1.0_NEREPORTER-V8.0