1
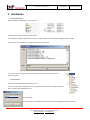
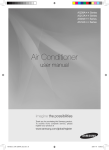
E-Race v3 – User Manual
15/06/2015
ML-0001-R1-EN
E-Race v3
User Manual
Original Author:
Bruno CELDRAN
Last Editor:
Bruno CELDRAN
Revision:
1
ML-0001-R1-EN
XAP Technology - 298, rue des Entrepreneurs - 30420 Calvisson - France
Tél +33 (0)4 66 02 94 94 - Fax +33 (0)4 66 02 94 90
http://www.xap.fr - [email protected]
Page 1 of 17
E-Race v3 – User Manual
15/06/2015
ML-0001-R1-EN
1. INSTALLATION ....................................................................................................................................................................... 3
1.1. DISTRIBUTION KIT ..........................................................................................................................................................................................3
1.2. DIRECTORIES ................................................................................................................................................................................................3
1.3. FIRST USE ....................................................................................................................................................................................................3
2. DATA MANAGER ................................................................................................................................................................... 5
3. CHANNELS ............................................................................................................................................................................ 6
3.1. CHANNELS DISPLAY .......................................................................................................................................................................................6
3.2. CHANNELS PROPERTIES...................................................................................................................................................................................6
3.3. CHANNEL TOOLS ...........................................................................................................................................................................................7
4. DATA ANALYSIS .................................................................................................................................................................... 8
4.1. MAIN MENU ................................................................................................................................................................................................8
4.2. DISPLAY INTERFACE .......................................................................................................................................................................................8
CHANNELS TABLE.............................................................................................................................................................................................. 8
TRACED CHANNELS ........................................................................................................................................................................................... 8
ZOOM ........................................................................................................................................................................................................... 9
TIME/DISTANCE TOGGLE .................................................................................................................................................................................... 9
FLOATING PANELS ............................................................................................................................................................................................ 9
SCREEN CONFIGURATIONS................................................................................................................................................................................... 9
LAPS ........................................................................................................................................................................................................... 10
KEYBOARD SHORTCUTS .................................................................................................................................................................................... 10
4.3. TABS .........................................................................................................................................................................................................10
OVERVIEW.................................................................................................................................................................................................... 10
TIME/DISTANCE GRAPHS .................................................................................................................................................................................. 10
X/Y GRAPHS ................................................................................................................................................................................................. 11
STATISTICS GRAPHS ......................................................................................................................................................................................... 11
5. MAPS ................................................................................................................................................................................ 12
5.1. OVERVIEW .................................................................................................................................................................................................12
5.2. MAP OPTIONS ............................................................................................................................................................................................12
5.3. MAP CREATION ..........................................................................................................................................................................................12
5.4. MAP SELECTION .........................................................................................................................................................................................12
6. LAPS.................................................................................................................................................................................. 14
6.1. LAPS DISPLAY .............................................................................................................................................................................................14
6.2. LAP TOOLS .................................................................................................................................................................................................14
SPLIT........................................................................................................................................................................................................... 14
MERGE ........................................................................................................................................................................................................ 14
SHIFT .......................................................................................................................................................................................................... 14
RESTORE ...................................................................................................................................................................................................... 14
7. OPTIONS ............................................................................................................................................................................ 15
7.1. USER INTERFACE .........................................................................................................................................................................................15
7.2. LANGUAGE .................................................................................................................................................................................................15
7.3. GRAPHS .....................................................................................................................................................................................................15
8. SESSION INFORMATION ........................................................................................................................................................ 16
9. USER INTERFACE CUSTOMIZATION .......................................................................................................................................... 17
9.1. GENERAL ...................................................................................................................................................................................................17
9.2. TABS .........................................................................................................................................................................................................17
9.3. LAYOUTS ....................................................................................................................................................................................................17
ML-0001-R1-EN
XAP Technology - 298, rue des Entrepreneurs - 30420 Calvisson - France
Tél +33 (0)4 66 02 94 94 - Fax +33 (0)4 66 02 94 90
http://www.xap.fr - [email protected]
Page 2 of 17
E-Race v3 – User Manual
15/06/2015
ML-0001-R1-EN
1. Installation
1.1.Distribution kit
E-Race software is distributed as a set of 6 files :
Launch the setup.exe program to install E-Race.
The installation software will detect if E-Race is already installed, and automatically upgrade what’s needed.
At the end of the installation, the following window should appear:
This is the report of the directory creation utility. If at this point you have any error,
please contact us.
1.2.Directories
E-Race uses the C:\XAP DATA\ directory as root.
Each track and session created with E-Link are placed under this root. The Maps extracted
will be saved under the MAP directory.
1.3.First Use
At the first use of the software you have to choose the language of the user interface.
ML-0001-R1-EN
XAP Technology - 298, rue des Entrepreneurs - 30420 Calvisson - France
Tél +33 (0)4 66 02 94 94 - Fax +33 (0)4 66 02 94 90
http://www.xap.fr - [email protected]
Page 3 of 17
E-Race v3 – User Manual
15/06/2015
ML-0001-R1-EN
You’ll be able to change the language later using the Options\Language Menu.
Then you have to select the default user interface you’ll use.
These are a set of tabs used for displaying data.
Now the software is ready for use.
ML-0001-R1-EN
XAP Technology - 298, rue des Entrepreneurs - 30420 Calvisson - France
Tél +33 (0)4 66 02 94 94 - Fax +33 (0)4 66 02 94 90
http://www.xap.fr - [email protected]
Page 4 of 17
E-Race v3 – User Manual
15/06/2015
ML-0001-R1-EN
2. Data Manager
When E-Race is started the only available menu is the Data Manager, which allows you to open
the data files.
It presents the Tracks and Session on the left, in a tree form.
Items legend:
Track/Session
Data File
Lap
The following actions can be taken:
- Left single click on a line selects a file or a specific lap.
- Left double click on a file: opens the file in single or compare mode (depending on the chosen option).
- Left double click on a lap: open the corresponding file and points on the selected lap.
- Right click on a line: shows the following popup menu
Open file : Opens the selected file.
Select for compare : Opens twice the selected file for comparison.
Select for Pilot A : Adds the selected file as Pilot A.
Select for Pilot B : Adds the selected file as Pilot B.
When either a Pilot A, or a Pilot A and a Pilot B are selected, you can click on OK to open the files.
ML-0001-R1-EN
XAP Technology - 298, rue des Entrepreneurs - 30420 Calvisson - France
Tél +33 (0)4 66 02 94 94 - Fax +33 (0)4 66 02 94 90
http://www.xap.fr - [email protected]
Page 5 of 17
E-Race v3 – User Manual
15/06/2015
ML-0001-R1-EN
3. Channels
3.1.Channels Display
Once at least one file is opened, the
Sessions\Channels menu is available. You can
display the channel table of a specific file (Pilot A or
Pilot B).
This reflects exactly the channel table as it appears
in the file.
For each channel, you can edit the linear conversion
(or enter a specific conversion table), change the
filtering level, and Min/Max values.
Every channel is computed from its original binary
value to its real value with the formula:
Y = A*X + B.
To enter a specific conversion table :
- First change the “Conv.” Option to “By Parts”.
It will make the “Edit” button available and the
edition of A and B impossible.
- Click on the “Edit” button (8th column).
This panel appears.
-
-
The first step is to set the Min and Max value
of the channel
Then set the first corresponding value on the
left with the blue cursor, and the second with
the red one.
If you need more parts, add them with the “Nb
of points” control. You can have up to 5 points.
Click OK to save and exit.
Restriction: This function has been designed to convert values from 0-5V sensors, so the values are computed from
a 0-5000 mV range.
3.2.Channels properties
This panel comes by right-clicking on the label of a traced channel, and
mostly contains the same information than the data channel table, plus
trace-specific options, like the numbers of decimals.
ML-0001-R1-EN
XAP Technology - 298, rue des Entrepreneurs - 30420 Calvisson - France
Tél +33 (0)4 66 02 94 94 - Fax +33 (0)4 66 02 94 90
http://www.xap.fr - [email protected]
Page 6 of 17
E-Race v3 – User Manual
15/06/2015
ML-0001-R1-EN
3.3.Channel tools
nd
rd
By right-clicking on the 2 (or 3 ) column of the channel table, this menu allows to:
- Realize a “Zero to Cursor” operation: you have to select first the new
reference value on a graph. Only the “B” value of the channel will be
modified.
- Bring up the Channel setup panel.
- Add in to the data window: it’s small floating panel able to contain some
channels and display their values.
ML-0001-R1-EN
XAP Technology - 298, rue des Entrepreneurs - 30420 Calvisson - France
Tél +33 (0)4 66 02 94 94 - Fax +33 (0)4 66 02 94 90
http://www.xap.fr - [email protected]
Page 7 of 17
E-Race v3 – User Manual
15/06/2015
ML-0001-R1-EN
4. Data Analysis
4.1.Main Menu
After opening the files, the main menu bar is undimmed, as the first tab of Analysis interface is opened. The following
two controls make the floating tool windows appear. And the list boxes change the laps you are visualizing.
4.2.Display interface
The interface is made of a top control bar, including the basic controls, such as Time/Distance, Zoom, Shift, Screens, and
a set of tabs containing the graphs.
This is fully user-editable, up to 4 graphs on one tab, up to 16 tabs in one configuration.
The available channels are in the table at the right of the screen.
Channels table
This table may have up to 4 tabs, depending on the channels present in the file :
- The Data tab contains the default physical channels.
- The Maths tab contains only computed channels.
- The Diag tab is filled with the diagnostic channels.
- The Susps tab contains the suspension channels.
It always indicates the value of the channel at the position of the cursor.
Traced Channels
Right-Clicking on a channel label make this menu appear :
The first button calls the “Channel Setup” tool. See below.
Second button realizes the Zero to Cursor operation.
The third button brings up a popup window with the Min and Max value for the selected data.
The “Go To Min” and “Go To Max” buttons set the cursor position to the Min and Max of the data.
The “Delete” button deletes the trace from the graph.
The third button shows the “Trace Properties” panel.
To make this menu disappear without clicking a button, click the right mouse button or press the Escape Key.
ML-0001-R1-EN
XAP Technology - 298, rue des Entrepreneurs - 30420 Calvisson - France
Tél +33 (0)4 66 02 94 94 - Fax +33 (0)4 66 02 94 90
http://www.xap.fr - [email protected]
Page 8 of 17
E-Race v3 – User Manual
15/06/2015
ML-0001-R1-EN
The Trace Properties panel allows you to change the color of a trace, or delete it. There is also
the possibility to use the value itself for the Y-scale of the graph. Then click on the Close button,
or press the Escape key.
Zoom
The zoom controls allows you to zoom around the current cursor, by dividing the scale by 2. You
can also obtain the same result as the PLUS button when left-double-clicking on a
graph. The RESTORE button will restore the original scaling.
The black bar on the right symbolizes the position of the zoomed data in the selected lap, including its percentage.
You can drag the bar horizontally to navigate into the data.
Time/Distance toggle
This toggle allows to choose the X-Axis mode, time or distance. If there is no
distance channel available, this item is dimmed.
Floating Panels
The SHOW MAP button make the map panel to appear. The red and blue
of the two pilots, at the time or distance selected by the graph cursors.
cursors indicate the position
The localization of the cars on the maps depend on the beacon position. In Track
Mode, if the data and the map position don’t correspond, you can double-RIGHT-click
the map to use the Map Setup tool.
on
This tool allows you to change the position of the beacon, to a more accurate position.
Screen configurations
E-Race allows you to save your favorites screen configuration (graphs and channel traces
on them), up to 16 different configurations. The last configuration used is stored in the
“Auto” screen.
You can choose any saved screen configuration,
or save the current screen.
Click on the Interface\Save Current Screen menu :
A new panel will appear. If you want to create a new screen configuration,
enter its name.
Or choose an existing configuration from the list, clicking on rename if it’s
needed.
ML-0001-R1-EN
XAP Technology - 298, rue des Entrepreneurs - 30420 Calvisson - France
Tél +33 (0)4 66 02 94 94 - Fax +33 (0)4 66 02 94 90
http://www.xap.fr - [email protected]
Page 9 of 17
E-Race v3 – User Manual
15/06/2015
ML-0001-R1-EN
Laps
The lap control allows you to choose the lap you want to display, for each pilot. The Best
Lap is indicated with an asterisk.
This control only shows the Enabled laps. By default, all laps are Enabled.
Keyboard shortcuts
You can use the left/right arrows to move the cursors on the graphs. If you are zooming, the arrow will make the
graphs slide horizontally.
Pressing the SHIFT key and the arrows key, when the screen is zoomed, will slide the graphs page by page.
The Page-Up and Page-Down keys allow to change the current lap for the last used Pilot Lap control.
F1 will bring the contextual help.
4.3.Tabs
Overview
Each interface consists in a set of tabs (here, 4). You can navigate through them by clicking on their labels, at the
bottom of the screen.
On each tab, there is up to 4 graph controls, of 3 differents types :
- Time/Distance graphs: the data is traced against time or distance
- X/Y graphs: a channel is traced against another one.
- Statistics graphs: a 10 bars histogram of the data, computed on the current zoom level.
Time/Distance Graphs
On these graphs the data is plotted against time or distance.
To plot a data channel on a Time/Distance graph, drag and drop the channel on the graph control from:
- the first column of the table (label) to erase all traces
- the second or third column to add a trace to the graph
Note: if there is more than one file opened, the first option traces the data for the two Pilots.
Restrictions: You can only overlay different channels from a given pilot, or different pilots for a given channel.
ML-0001-R1-EN
XAP Technology - 298, rue des Entrepreneurs - 30420 Calvisson - France
Tél +33 (0)4 66 02 94 94 - Fax +33 (0)4 66 02 94 90
http://www.xap.fr - [email protected]
Page 10 of 17
E-Race v3 – User Manual
15/06/2015
ML-0001-R1-EN
The default trace colors are red, blue, green and magenta. You can change the trace color with the Trace Properties
panel (see above).
X/Y Graphs
This graph allows to plot one data against another one, typically
oil pressure versus engine RPM, or pedal signal versus throttle
position.
To put a data channel on the X axis, you have to drop it in the
lower right part of the graph. The Y data has to be dropped in the
upper left part.
The trace is also automatically adjusted when the zoom level
changes, or when another part of data is selected with the zoom
bar.
Statistics Graphs
This graph offers a histographic representation of
data, for the selected lap or all laps.
On the left of the screen, there are the intervals, and
on the right the % of time for this interval, and the
total time.
For example in the capture beside, the Pilot A has
been between 7280 and 6874 RPM 2.1% of time,
1.8s, and the Pilot B 2.6% of time, 2.2s.
You can display the channel of your choice with drag
and drop from the channel table.
If you want to see all the values for the entire time
of the session, use the All Session lap.
ML-0001-R1-EN
XAP Technology - 298, rue des Entrepreneurs - 30420 Calvisson - France
Tél +33 (0)4 66 02 94 94 - Fax +33 (0)4 66 02 94 90
http://www.xap.fr - [email protected]
Page 11 of 17
E-Race v3 – User Manual
15/06/2015
ML-0001-R1-EN
5. Maps
5.1.Overview
The localization of the vehicle can be made in two ways:
- Track mode: the position on the track is calculated with the distance channel, and traced on a pre-recorded
map.
- Rallye mode: the position is computed in real time with the GPS data in the file.
The first mode is interesting when the GPS can’t be fitted permanently in the vehicle. Otherwise, it’s recommended to
use the second mode.
5.2.Map Options
Click on Options\Map to display the Map Options panel.
You can set here the two modes previously presented.
The colors are those displayed on the floating map panel.
The external link is a new feature, working only in Rallye Mode. By putting the
switch “ON”, and launching the Google Earth application, the position of the
vehicle is automatically displayed on its map, in real time. It’s strongly
recommended to use two different screens, one for E-Race, the other for Google
Earth.
5.3. Map Creation
If the file you opened contains GPS data, you can use
the MAP\CREATE MAP tool. Click on the arrows on the
left of the numeric control LAP to visualize the GPS
Data. When you have a good-looking map, you can
rotate it with the ROTATION control on the right.
When you’ve finished, click on SAVE.
The software will ask you for the name
of the map. If you give the name that
already exists, it will be overwritten.
5.4. Map Selection
When you open a MAP file on a given track, the software take
automatically by default the previous map selected for this track.
ML-0001-R1-EN
XAP Technology - 298, rue des Entrepreneurs - 30420 Calvisson - France
Tél +33 (0)4 66 02 94 94 - Fax +33 (0)4 66 02 94 90
http://www.xap.fr - [email protected]
Page 12 of 17
E-Race v3 – User Manual
15/06/2015
ML-0001-R1-EN
You also have to possibility to select another map, from all the maps you created.
Use the MAP\SELECT MAP item :
Now double-click on the list on the left to choose the map you want to use on this track. Click OK when you’ve chosen
the right map.
ML-0001-R1-EN
XAP Technology - 298, rue des Entrepreneurs - 30420 Calvisson - France
Tél +33 (0)4 66 02 94 94 - Fax +33 (0)4 66 02 94 90
http://www.xap.fr - [email protected]
Page 13 of 17
E-Race v3 – User Manual
15/06/2015
ML-0001-R1-EN
6. Laps
6.1. Laps Display
In some cases, the laps recorded by the data logging system are inaccurate. They appear in
the lap time list, but are not representatives of any pilot performance.
So you may want to disable them, as they disturb the analysis of the good laps.
Use the Lap\Display menu item to show this window.
Choose the Pilot you want to modify the laps in the list control on the top of the window. His
lap time list appears in the table below.
Then double-click on the lap time you want to disable. The cell will become grey, as the lap is
disabled. To re-enable a lap just double-click on it.
The effect is immediate. Click on OK to close this window.
6.2. Lap tools
In the Lap menu, you’ll access the different lap tools.
Split
First, you have to position the cursor on the point you want the current lap splitted. Then
click on Laps\Split\Pilot X, when X is the name of the “Pilot” you want to split the lap.
You can make adjustment on the time, or the distance if it’s available.
Merge
Select the first lap you want to merge and click
on Lap\Merge\Pilot X. A panel appears with a
summary of the action.
Click OK to merge the laps.
Shift
The shift tool allows to correct the lap shifting between two XAP files. Between the two sessions, the beacon may have
been displaced, so you have to shift the starting of all laps.
You have first to shift the Pilot B data. Then click on Lap\Shift\Pilot B. The current shifting is saved in the file.
Restore
This item just restores the laps as they were in the original file, cancelling the modifications made with the lap tools.
ML-0001-R1-EN
XAP Technology - 298, rue des Entrepreneurs - 30420 Calvisson - France
Tél +33 (0)4 66 02 94 94 - Fax +33 (0)4 66 02 94 90
http://www.xap.fr - [email protected]
Page 14 of 17
E-Race v3 – User Manual
15/06/2015
ML-0001-R1-EN
7. Options
7.1. User Interface
Click on Options\User Interface.
You can set :
- The color of the text labels background (default: transparent)
- The startup lap, Best Lap, or All Session
- The units, Imperial or metric
- The GMT Time difference, if it hasn’t been set correctly in the
data logging system
- The default opening file mode, while double-clicking on a file
in the data manager
- The display to use at the opening of a file, the last one used or
the default one defined in the configuration.
7.2.Language
You can change the language of the E-Race User Interface. Clicking OK will automatically close the
software. The new language will be effective on the next use.
7.3.Graphs
In this box you can hide or show the grid of the graphs, and change traces from lines to
dots (very slow).
You can also choose any color you like for the grid, the graph background and the main
vertical cursor.
ML-0001-R1-EN
XAP Technology - 298, rue des Entrepreneurs - 30420 Calvisson - France
Tél +33 (0)4 66 02 94 94 - Fax +33 (0)4 66 02 94 90
http://www.xap.fr - [email protected]
Page 15 of 17
E-Race v3 – User Manual
15/06/2015
ML-0001-R1-EN
8. Session Information
The Session Information Tool allows you to access all
information in the XAP file, as the pilot name, date,
wheel perimeter…
The Pilot Name, Date and Time are only informational,
and have no effect on the data.
The Wheel Perimeter field will influence the calculated
Speed and Distance.
ML-0001-R1-EN
XAP Technology - 298, rue des Entrepreneurs - 30420 Calvisson - France
Tél +33 (0)4 66 02 94 94 - Fax +33 (0)4 66 02 94 90
http://www.xap.fr - [email protected]
Page 16 of 17
E-Race v3 – User Manual
15/06/2015
ML-0001-R1-EN
9. User Interface customization
Click on Interface\Edit to bring up the Interface Setup Panel.
9.1.General
Here you can set up a new background picture, shown when you launch E-Race.
The picture file should be left in the E-race program files directory.
You can also set a new name for the interface.
9.2.Tabs
This is the list of the tabs present in the interface. Use the buttons below to
create, delete, and move tabs.
9.3.Layouts
Here are the available layouts:
2 Time/Distance graphs
3 Time/Distance graphs
4 Time/Distance Graphs
1, 2 can be either Stats or X/Y Graphs. 3 is a Time/Distance graph.
1, 2, 3, 4 can be either Stats or X/Y Graphs.
ML-0001-R1-EN
XAP Technology - 298, rue des Entrepreneurs - 30420 Calvisson - France
Tél +33 (0)4 66 02 94 94 - Fax +33 (0)4 66 02 94 90
http://www.xap.fr - [email protected]
Page 17 of 17