1
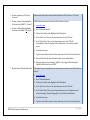
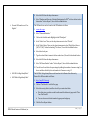
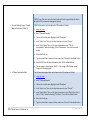
USER MANUAL LOCAL CONTROL AND ACCOUNTABILITY PLAN NEEDS ASSESSMENT TOOL School Services of California, Inc. Riverside County Office of Education Needs Assessment Tool The Needs Assessment Tool (NAT) was developed by the Riverside County Office of Education (COE) to assist local educational agencies (LEA) in conducting a local needs assessment based upon required and locally identified metrics included in the Local Control and Accountability Plan (LCAP). The local needs assessment is an essential LCAP building block and the NAT provides a foundation for the meaningful engagement of stakeholders and the development of goals and actions based on measurable student outcomes. The NAT allows LEAs to gather and display data for an individual school, program, or for an entire district, charter, or county office of education. Additionally, it allows LEAs to display trend data for each identified subgroup simplifying the identification of significant areas of need. This manual, written by School Services of California, Inc., in cooperation with the Riverside COE, has been developed to assist you in utilizing the NAT. The NAT is a Microsoft Excel file with two workbooks: data (Data tab) and report (Report tab). All of the data/information is entered into the Data tab. No inputs should be entered directly into the Report tab. In addition, no cells, rows, or columns should be deleted as that will result in an error message on the Report tab. The following provides instructions on how to input data into the Data tab and how to analyze the data on the Report tab. Entering Data All of the information necessary for the Data tab should be readily accessible through your district’s existing systems; however, most of the information can also be found online. Please see Appendix A: Data Sources for instructions on where and how to access the information available online. Please note that while the NAT is set up to have information entered and displayed by subgroup, in addition to district- and state-wide, not all data is available by subgroup or for the state. For those metrics for which information is not available, the input boxes have been crossed out. 1. Click on the Data tab to begin. 2. The columns contain state and district data for comparison, along with the district’s significant subgroups. a. Extra columns have been included to allow you to enter additional subgroups relevant for your district. Simply select the cell that states “District Identified Subgroup” and replace the text with the title of your subgroup. b. Subgroups that are not relevant to your district should be left blank and not deleted. Deleting columns will cause error messages to appear on the Report tab. ©2014 School Services of California, Inc. 1|Page c. However, if you find that you have an additional district identified subgroup, you can replace existing subgroups with district identified subgroups by simply typing the name of the district identified subgroup over the prepopulated subgroup. 3. The rows contain metrics that are being tracked by the district grouped by state priority. Those metrics with asterisks are required by the Education Code. The remaining metrics have been provided as examples or have been used by various districts across the state. Each metric encompasses three rows representing three prior years. a. Extra rows have been included to allow you to enter additional district identified metrics. Simply select the cell that states “District Identified” and replace the text with the title of the district identified metric. Remember that for each metric, you will have three rows of information to add. b. Non-state required metrics that are not relevant to your district should be left blank and not deleted. Deleting rows will cause error messages to appear on the Report tab. c. However, if you find that you have additional district defined metrics, you can replace non-state required metrics with district defined metrics by simply typing the name of the district defined metric over the prepopulated metric. 4. All information must be entered into the Data tab. You can either cut and paste the information from other sources or manually enter the data. If you will be manually entering the data, you have two options: a. You can manually enter data in the cells; or b. You can utilize the data entry form by clicking on the DATA ENTRY button to the right of the columns containing the subgroups. i. A form window will open which contains a page for each row (e.g., metric). To enter information, simply type in the required information. ii. The tab key will allow you to move from one cell (e.g., subgroup) to the next. iii. There are three ways to navigate between the metrics: 1. Hit the enter key; 2. Use the arrow down arrow to advance to the next metric or the up arrow to go back to a previous metric; or 3. Use the “Find Prev” and “Find Next” buttons to navigate between metrics. iv. Once you have finished with all of the metrics, click on the “Close” button. 5. Be aware of the format in which data is entered. All percentages should be entered in whole number and not decimal format (i.e., enter 32.5% as 32.5 not .325). ©2014 School Services of California, Inc. 2|Page 6. Now that all of the data has been entered, click on the Report tab. Reading the Report 1. As with the Data tab, the columns contain state and district data for comparison, along with the district’s significant subgroups. a. If you entered any additional district identified subgroups, they will be displayed in the columns to the right of the prepopulated subgroups. b. If there are subgroups that are not relevant to your district and were left blank in the Data tab, you can hide those columns so that they do not appear in you report. Once again, do not delete the columns as this will cause error messages to appear. i. In order to hide a column, simply right click on the column letter along the top of the workbook and select “Hide” from the menu. 2. As with the Data tab, the rows contain metrics that are being tracked by the district grouped by LCAP category (e.g., Conditions of Learning, Pupil Outcomes, and Engagement) and then by state priority. Some metrics have a red flag in the upper right hand corner of the cell. Hovering over the cell will provide you with a brief description of the metric. a. If you entered any additional district identified metrics, they will be displayed in the rows after the prepopulated metrics. b. If there are non-state required metrics that are not relevant to your district and were left blank in the Data tab, you can hide those rows so that they do not appear in you report. Once again, do not delete the rows as this will cause error messages to appear. i. In order to hide a row, simply right click on the row number along the left of the workbook and select “Hide” from the menu. 3. Each cell or square contains an aggregate of the three years’ worth of information entered into the Data tab. Each square, therefore, provides a quick and easy overview that, at a glance, informs you how the subgroup is performing on a given metric in the previous year and over time, and allows for the comparison of the subgroups against one another and against the state and district as a whole. Further detail on the squares is discussed below in “Understanding the Square”. 4. Once you have entered data into the NAT, you will see red, yellow, or green “stop lights” along the top of each state priority. a. The stop lights are included to draw attention to a subgroup that is performing below the district as a whole and to prompt a second look at the data. It may be that the difference is minimal and can be ignored, but the presence of a yellow or red stop light indicates that the metric warrants a second look. ©2014 School Services of California, Inc. 3|Page b. When all metrics within a priority are positive (i.e., the subgroup is performing at or above the district as a whole), then the stop light is green. c. When at least one of the metrics within a priority are negative (i.e., the subgroup is performing below the district as a whole), then the stop light is yellow or red. i. A yellow stop light will be displayed when 50% or less of the metrics within a priority are performing below the district as a whole. ii. A red stop light will be displayed when 51% or more of the metrics within a priority are performing below the district as a whole. Understanding the Square 1. Each cell or square contains the following information: a. The number shown in each square represents the metrics previous year’s value. b. The line within each square represents the trend for the three years, which provides the ability to visually see the change in that metric over time (i.e., a flat line indicates there has been no change over the three-year period while a “v” shaped line would indicate that the metric dipped in the second year and has now rebounded). i. Each line includes three markers representing the values of the metric for each year of data provided. ii. For the majority of the squares, the height represents the range for that metric and the location of the line on the y axis represents the values location within that range. For example, API scores range from 200 to 1000. A district with an API of 600 for all three years would show a straight line across the middle of the square. iii. Lines without all three points or drastic swings in the line indicate a second look at the data is warranted to ensure accuracy and/or that all information has been entered. It is possible that a data point was intentionally left blank (i.e., no students from a particular subgroup were present in the given year); however, the lack of three points or drastically swinging lines should prompt a second look at the information to ensure the omission was intentional. c. If the square is red, this represents that the value of that subgroup’s metric is less than the district as a whole, which may provide evidence of an achievement gap and indicate that that subgroup needs improvement. Closer inspection may show that the difference is minimal and can be ignored, but the presence of the red square indicates that the metric for that subgroup warrants a second look. ©2014 School Services of California, Inc. 4|Page Appendix A: Data Sources Category I. Conditions of Learning Priority 1. Basic Services Metrics: Information for these metrics can be found in the following locations: Teacher Misassignment Rate* 1. Human Resources system (District) Student Lacking Own Copy of Textbook Rate 2. CALPADS1 (District) Credentialed Teacher Rate Credentialed Teacher Teaching Outside of Subject Area Rate Teacher of English Learner Misassignment Rate 3. SIS2 (District) 4. SARC3 a. http://www.cde.ca.gov/ta/ac/sa/ b. Under “Information for the Public” click on “Find a SARC” c. Search for school Highly Qualified Teacher Rate d. Enter name of school in SEARCH field; or Most Recently Adopted Textbooks Rate* e. Scroll through list, which is alphabetized by school name f. Click on the symbol under “View SARC” to be provided with a PDF or a link to the school’s website The SARCs available on the California Department of Education’s (CDE) website are for the 2012-13 school year. To obtain SARCs for previous years, go to your school or district website. Where multiple data is provided for one category (e.g., Student Lacking Own Copy of Textbook Rate includes a percentage for each textbook), an average should be calculated. For those categories for which the SARC does not provide a percentage (e.g., Teacher Misassignment Rate, Credentialed Teacher, etc.), a percentage will need to be calculated by dividing the number of teachers in the particular category by the total number of teachers. ©2014 School Services of California, Inc. 5|Page Overall Facility Rating* Information for this metric can be found in the following locations: 1. Facility Inspection Tool (FIT)—School Facility Conditions Evaluation a. Page 6 of 6 of the FIT (or tab 4 of the Excel file titled “III. Totals and Ranking”) provides an Overall Rating percentage, which is the average of the eight categories contained with the FIT 2. Count the number of schools with either good or exemplary rating and divide that number by the total number of schools within the district Priority 2. Implementation of State Standards Metrics: Common Core ELA Implementation* Common Core Math Implementation* Common Core for English Learners* These are district identified metrics; therefore, the district will determine what data to provide Priority 7. Course Access Metrics: Information for these metrics can be found in the following locations: CTE Enrollment Rate (Grades 7-12)* 1. CALPADS UC/CSU Required Course Enrollment Rate 2. SIS AP Courses Offered AP Course Enrollment Rate Intervention/Remedial Course Enrollment Rate ©2014 School Services of California, Inc. 6|Page Category II. Pupil Outcomes Priority 4. Pupil Achievement Metrics: STAR4/CAASPP5 ELA Proficient or Advanced* STAR/CAASPP Math Proficient or Advanced* STAR/CAASPP Science Proficient or Advanced* STAR/CAASPP History/Social Science Proficient or Advanced* STAR information can be found on the CDE website as follows: 1. www.cde.ca.gov 2. Select “Data and Statistics” 3. Click on the first link under Highlights titled “DataQuest” 4. In the “Select Level” box, use the drop down menu to select “District” 5. In the “Select Subject” box, use the drop down menu to select “STAR Test Results” under the heading “Test Scores”, then click the submit button 6. Select the school year 7. Type the school district name in the box under item 2, then click the submit button 8. Select the LEA from the drop down menu 9. Click on “Test Results Search” towards the top of the page 10. Select a county, district, school, etc. down to the detail desired a. If you don’t select county, you will get statewide results b. If you select only a county, it will provide county level information c. If you select a county and district, it will provide district-level information and so on d. The information can also be broken down to the group and subgroup levels 11. Then click on view report CST summary report provides an overall summary and not detail by grade level and subject. The needs assessment tool only requires this summary information. ©2014 School Services of California, Inc. 7|Page API Score* API information can be found on the CDE website as follows: API Growth* 1. www.cde.ca.gov 2. Select “Data and Statistics” 3. Click on the first link under Highlights titled “DataQuest” 4. In the “Select Level” box, use the drop down menu to select “District” (information can also be viewed by school, county, or state) 5. In the “Select Subject” box, use the drop down menu to select “Academic Performance Index (API)” under the heading “School Performance”, then click the submit button 6. Select the LEA from the drop down menu 7. Select “Growth API Report” for each year that you want to include in the needs assessment tool (previous 3 years) under “Select Report” and then click the submit button Percent Completing UC/CSU Required Courses* UC/CSU information can be found on the CDE website as follows: 1. www.cde.ca.gov 2. Select “Data and Statistics” 3. Click on the first link under Highlights titled “DataQuest6” 4. In the “Select Level” box, use the drop down menu to select “District” 5. In the “Select Subject” box, use the drop down menu to select “Graduates” under the heading “Student Demographics”, then click the submit button 6. Select the school year 7. Type the school district name in the box under item 2, then click the submit button 8. Select the LEA from the drop down menu 9. Select “# of Grads and Grads meeting UC/CSU Entrance Requirements” with or without school data under “Select a Report”, then click the submit button ©2014 School Services of California, Inc. 8|Page Percent completing a CTE Course Sequence* Information for this metric can be found in the district’s SIS or Perkins – CTE report Percent in Cohort Attaining English Proficient Level (AMAO7 2 <5 years)* AMAO 2 information can be found on the CDE website as follows: Percent in Cohort Attaining English Proficient Level (AMAO 2 >5 years)* 1. www.cde.ca.gov 2. Select “Data and Statistics” 3. Click on the first link under Highlights titled “DataQuest” 4. In the “Select Level” box, use the drop down menu to select “District” 5. In the “Select Subject” box, use the drop down menu to select “Title III Accountability” under the heading “School Performance”, then click the submit button 6. Select the school year 7. Type the school district name in the box under item 2, then click the submit button 8. Select the LEA from the drop down menu, then click the submit button 9. Both percentages are located under “AMAO 2 – Percentage of ELs Attaining the English Proficient Level on the CELDT” English Learner Reclassification Rate* The English learner reclassification rate information can be found on the CDE website as follows: 1. www.cde.ca.gov 2. Select “Data and Statistics” 3. Click on the first link under Highlights titled “DataQuest” 4. In the “Select Level” box, use the drop down menu to select “District” 5. In the “Select Subject” box, use the drop down menu to select “English Learners” under the heading “Student Demographics”, then click the submit button 6. Select the school year 7. Type the school district name in the box under item 2, then click the submit button ©2014 School Services of California, Inc. 9|Page 8. Select the LEA from the drop down menu 9. Select “Number and Percent of Student Redesignated to FEP8” with or without school data under “Select a Report”, then click the submit button Percent AP Exam Score of 3 or Higher* The AP Exam Score can be found on the CDE website as follows: 1. www.cde.ca.gov 2. Select “Data and Statistics” 3. Click on the first link under Highlights titled “DataQuest” 4. In the “Select Level” box, use the drop down menu to select “District” 5. In the “Select Subject” box, use the drop down menu to select “High School Scores (SAT, ACT, AP)” under the heading “Test Scores”, then click the submit button 6. Select the school year 7. Type the school district name in the box under item 2, then click the submit button 8. Select the LEA from the drop down menu 9. Select “AP Exam Results” under “Select a Report”, then click the submit button 10. You will need to calculate the percentage by adding the number of exams scoring 3 or above and then divide by the total number of all exams scoring 1-5 EAP9 ELA College Ready Rate* EAP Math College Ready Rate* The EAP ELA College Ready Rate can be found on the California State University Chancellor’s Office website as follows: 1. http://eap2013.ets.org/ 2. Click on “Test Results” on left of the page 3. Select the county, district, and the school if you want school data a. Note that prior year data can be found toward the bottom of page under “Prior Year Test Results” b. You can also access the information by group and subgroup 4. Click the View Report button ©2014 School Services of California, Inc. 10 | P a g e 5. For the ELA rate, look at the percentage “Ready for College” under the Early Assessment of Readiness for College English 6. For the Math rate, look at the percentage “Ready for College” under the Early Assessment of Readiness for College Mathematics (Total) at the bottom of the page Priority 8. Other Pupil Outcomes CAHSEE10 ELA Proficient Rate CAHSEE Proficient rates can be found on the CDE website as follows: CAHSEE ELA 3 Year Pass Rate 1. www.cde.ca.gov CAHSEE Math Proficient Rate 2. Select “Data and Statistics” CAHSEE Math 3 Year Pass Rate 3. Click on the first link under Highlights titled “DataQuest” 4. In the “Select Level” box, use the drop down menu to select “District” 5. In the “Select Subject” box, use the drop down menu to select “High School Exit Exam (CAHSEE)” under the heading “Test Scores”, then click the submit button 6. Select the school year 7. Type the school district name in the box under item 2, then click the submit button 8. Select the District from the drop down menu 9. Select “Demographic Summary Report” under “Select a Report” 10. Select “Combined” under Specify Administration a. Note that “Combined” may not be an option in the current fiscal year depending on when you access the data as not all exams have been completed 11. Under “Select Test”, select “English-Language Arts (ELA)” , then click the submit button 12. In the “All Students Tested” chart, locate the percentage titled “% Proficient and Above” 13. Hit the back button on your browser and complete steps 11 and 12 again, but this time select “Mathematics” under “Select Test” ©2014 School Services of California, Inc. 11 | P a g e CAHSEE 3 year Pass rates cannot be found online and must be provided by the district through its SIS or assessment management system Percent Making Progress Toward English Proficiency (AMAO 1) AMAO 1 information can be found on the CDE website as follows: 1. www.cde.ca.gov 2. Select “Data and Statistics” 3. Click on the first link under Highlights titled “DataQuest” 4. In the “Select Level” box, use the drop down menu to select “District” 5. In the “Select Subject” box, use the drop down menu to select “Title III Accountability” under the heading “School Performance”, then click the submit button 6. Select the school year 7. Type the school district name in the box under item 2, then click the submit button 8. Select the LEA from the drop down menu, then click the submit button 9. The percentage is located under “AMAO 1 – Percentage of ELs Making Annual Progress in Learning English” AP Exam Participation Rate The AP Exam Participation Rate can be found on the CDE website as follows: 1. www.cde.ca.gov 2. Select “Data and Statistics” 3. Click on the first link under Highlights titled “DataQuest” 4. In the “Select Level” box, use the drop down menu to select “District” 5. In the “Select Subject” box, use the drop down menu to select “High School Scores (SAT, ACT, AP)” under the heading “Test Scores”, then click the submit button 6. Select the school year 7. Type the school district name in the box under item 2, then click the submit button ©2014 School Services of California, Inc. 12 | P a g e 8. Select the LEA from the drop down menu 9. Select “AP Exam Results” under “Select a Report”, then click the submit button 10. You will need to calculate the percentage by dividing the “Number of exam takers” by “Grades 11 + 12 Enrollment” Category III. Engagement Priority 3. Parental Involvement Metrics: Effort to Seek Parent Input* Promotion of Parental Participation* These are district identified metrics; therefore, the district will determine what data to provide Priority 5. Pupil Engagement Metrics: Attendance Rate* Chronic Absenteeism Rate* Middle School Dropout Rate* Attendance and Chronic Absenteeism rates cannot be found online and must be provided by the district through its SIS The Middle School Dropout Rate can be found on the CDE website as follows: 1. www.cde.ca.gov 2. Select “Data and Statistics” 3. Click on the first link under Highlights titled “DataQuest” 4. In the “Select Level” box, use the drop down menu to select “District” 5. In the “Select Subject” box, use the drop down menu to select “Dropouts” under the heading “Student Demographics”, then click the submit button 6. Select the school year ©2014 School Services of California, Inc. 13 | P a g e 7. Type the school district name in the box under item 2, then click the submit button 8. Select the District from the drop down menu 9. Select “Dropouts by Grade” either by Ethnicity or with school data under “Select a Report”, then click the submit button 10. You will need to calculate the percentage by adding the number of dropouts in 8th and 9th grades for district total and divide by total 8th and 9th grade enrollment obtained as described below Enrollment information can be found on the CDE website as follows: 1. www.cde.ca.gov 2. Select “Data and Statistics” 3. Click on the first link under Highlights titled “DataQuest” 4. In the “Select Level” box, use the drop down menu to select “District” 5. In the “Select Subject” box, use the drop down menu to select “Enrollment” under the heading “Student Demographics”, then click the submit button 6. Select the school year 7. Type the school district name in the box under item 2, then click the submit button 8. Select the District from the drop down menu 9. Select “District Enrollment by Grade” under “Select a Report”, then click the submit button High School Dropout Rate* The High School Dropout rate can be found on the CDE website as follows: High School Graduation Rate* 1. www.cde.ca.gov 2. Select “Data and Statistics” 3. Click on the first link under Highlights titled “DataQuest” 4. In the “Select Level” box, use the drop down menu to select “District” 5. In the “Select Subject” box, use the drop down menu to select “Graduates” under the ©2014 School Services of California, Inc. 14 | P a g e heading “Student Demographics”, then click the submit button 6. Select the school year 7. Type the school district name in the box under item 2, then click the submit button 8. Select the District from the drop down menu 9. Select “Cohort Outcome Summary Report by Race/Ethnicity” under “Select a Report”, then click the submit button 10. Select the percentage listed under “Cohort Graduation Rate” and “Cohort Dropouts Rate” Priority 6. School Climate Metrics: Suspension Rate* Expulsion Rate* Truancy Rate The Suspension, Expulsion, and Truancy rates can be found on the CDE website as follows: 1. www.cde.ca.gov 2. Select “Data and Statistics” 3. Click on the first link under Highlights titled “DataQuest” 4. In the “Select Level” box, use the drop down menu to select “District” 5. In the “Select Subject” box, use the drop down menu to select “Expulsion, Suspension, and Truancy” under the heading “Student Misconduct and Intervention”, then click the submit button 6. Select the school year 7. Type the school district name in the box under item 2, then click the submit button 8. Select the District from the drop down menu 9. Select “Suspension and Expulsion Rates” under “Select a Report”, then click the submit button 10. Hit the back button on your browser and complete step 9 again, but this time select “Truancy Rate Report” under “Select Test” ©2014 School Services of California, Inc. 15 | P a g e The Needs Assessment Tool was developed by the Riverside County Office of Education and is being utilized with its permission. Anyone requiring more in depth information or customization of the NAT should contact either Steve Ayon, Data Coordinator at 951.826.6784 or via email at [email protected], or Chun-Wu Li, Ph.D., Administrator, at 951-826-6601 or via email at [email protected]. 1 CALPADS = California Longitudinal Pupil Achievement Data Systems SIS = Student Information System 3 SARC = School Accountability Report Card. The California Department of Education (CDE) provides downloadable data files (in both Excel and Access formats) for many fields found on the SARC. To view for which fields downloadable data is available, go to the following website: http://www.cde.ca.gov/ta/ac/sa/accessdata1011.asp. Any fields that note “Provided by LEA” must utilize school records to obtain this information. 4 STAR = Standardized Testing and Reporting 5 CAASPP = California Assessment of Student Performance and Progress 6 You can also use DataQuest to gather information on STAR, API, and other data points 7 AMAO = Annual Measurable Achievement Objective 8 FEP = Fluent English Proficient 9 EAP = Early Assessment Program 10 CAHSEE = California High School Exit Exam 2 ©2014 School Services of California, Inc. 16 | P a g e