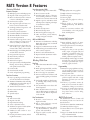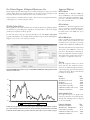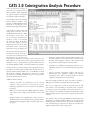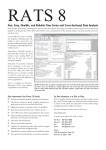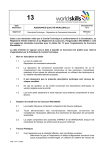
1
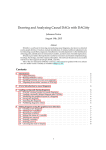
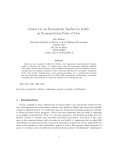
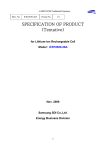
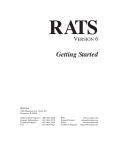
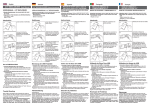
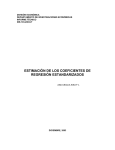
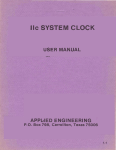
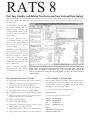
RATS 8
Fast, Easy, Flexible, and Reliable Time Series and Cross-Sectional Data Analysis
rats provides all the basics, including linear and non-linear least squares, forecasting, and arima models, but goes far beyond that with
support for techniques like gmm, arch and garch, vector autoregressions (vars), spectral analysis, state space models and dsges,
and much more.
It can handle time series of virtually
any frequency, including daily and
weekly, as well as panel data, and
produces publication-quality graphs
for printing or importing directly into
word processors.
Menu-driven “Wizards” provide a
point-and-click interface for many
common tasks, making RATS an
ideal tool for new users and for
educational settings.
Meanwhile, the powerful commanddriven language at the heart of
the program remains easy to learn
and use for simple jobs, while also
allowing users to automate complex
or repetitive tasks and even write
sophisticated menu- and dialog-driven
end-user applications.
rats is available for Windows,
Macintosh, unix, with complete
compatibility across platforms.
The RATS v.8 interface. Here, the sequence of commands appear in one text window, with the output directed to another window.
This makes it easy to save commands as a complete program, which you can rerun later with a couple of mouse clicks. Also
visible are a report window showing the output from a Box-Jenkins estimation, a graph window, and a look at the wizards on
the Time Series menu.
Major Improvements Since Version 7.0 Include:
For More Information, or to Place an Order:
r Revised and expanded manuals, with all-new Introduction.
rats is available directly from Estima, and from resellers around
r Much faster computation speeds. Complex estimation programs may run up to two times faster than before.
the world. We offer single-user, multi-user and network licenses,
as well as several options for using rats in instructional settings,
including discounts for full-time students.
r Significant extensions to state space and dsge capabilities.
r Reads data from Excel® 2007, Stata®, Matlab®, Eviews®.
For more information, please visit our web site at:
r Census Bureau x12-arima seasonal adjustment (Pro version).
www.estima.com
r Enhanced reporting features for viewing, saving, and exporting results. Can now export in TeX format.
or contact us by phone, fax, mail, or email:
r More point-and-click Wizards.
Toll free:
General:
Fax:
Email:
r Dozens of new built-in functions.
r Graphics: Now generates box plots. More control over graph
labeling, window titles, background color.
r Expanded View menu & toolbar icons for quick data analysis.
r New options for initial conditions on non-linear estimation.
800–822–8038
847–864–8772
847-864-6221
[email protected]
Estima
1560 Sherman Ave, Suite 510
Evanston, IL 60201 USA
RATS Version 8 Features
Statistical Methods
Estimation Techniques
r Multiple regressions including stepwise
r Regression with autoregressive errors
r Heteroscedasticity/serial-correlation
correction, including Newey-West
r Non-linear least squares
r Two-stage least squares for linear, nonlinear, & autocorrelated models
r Seemingly unrelated regressions and
three-stage least squares
r Non-linear systems estimation
r Generalized Method of Moments
r Maximum likelihood estimation
r Constrained optimization
r Extensive built-in hypothesis testing,
with procedures for a huge variety of
unit-root, stability, and other tests
r Limited and discrete dependent variable models: logit, probit, censored/
truncated data (Tobit), count models
r Panel data support, including fixed and
random effects estimators
r Non-parametric regressions
r Kernel density estimation
r Robust estimation
r Recursive least squares
r State-space models, including Kalman
filtering and smoothing, simulations,
and optimal control models
r dsge models
r Neural network models
r Linear and quadratic programming
Time Series Procedures
r Easy to specify lags and leads for timeseries model estimation and analysis
r arima and armax models including
multiplicative seasonal models; support
for arbitrary lag structures
r Transfer function/intervention models
r Error correction models
r Kalman filter
r Spectral analysis
Forecasting
Time series models
Regression models
Exponential smoothing
Static or dynamic forecasts
Simultaneous equation models (unlimited number of equations)
r Simulations with random or usersupplied shocks
r Forecast performance statistics, including Theil U statistics
r
r
r
r
r
Vector Autoregressions (VARs)
r Unmatched support for var models
r Error Correction models
r Structural vars. Choice of factorizations, including estimation of a factor
matrix from a covariance matrix model
r Impulse responses, with Monte Carlo
and Importance Sampling techniques
for standard error bands.
r Forecasting
r Variance decomposition
r Historical decomposition
r Extensive hypothesis testing tools
r cats 2.0 add-on provides industryleading cointegration analysis
ARCH and GARCH Models
r Univariate and multivariate, including
bekk, diagonal, cc, dcc, and vech
multivariate models
r Support for garch-in-mean models
r Additional exogenous variables in mean
and/or variance equations
r Normal, t and ged distributions
r Exponential and Asymmetric models
r Robust standard errors
Working With Data
Data Entry
r Menu-driven Data Wizards for reading
in data
r Reads and writes Excel files, text files,
EViews®, Stata®, and other formats
r Pro version supports sql/odbc
r On-screen data viewer and editor, with
point-and-click graphing and statistics
tools
r Can handle virtually any data frequency, including daily, weekly, intra-day,
and panel data
r Can automatically convert data to different frequencies
r rats data file format is fast and easy,
supports all frequencies, and allows you
to store series of different frequencies
on the same file
Data Transformations
r Flexible transformations with
algebraic formulas
r Easy to create trend series, seasonal,
and time period dummies
r Extensive filtering operations, including Hodrick-Prescott, Henderson,
Spencer, and custom filters
r Supports regular, seasonal, and fractional differencing
Graphics
r High-quality time series graphics
r High-resolution X-Y scatter plots
r Dual-scale graphs
r Contour graphs
r Copy-and-paste graphs into other applications
r Export graphs to many formats,
including PostScript and Windows
Metafile
r User can customize attributes such
as line thickness, colors and grayscale
levels, and fill patterns
Interface
Interactive Mode Environment
r Text-editor based
r Point-and-click “wizards” for many
tasks, greatly enhancing ease-of-use
r Saved programs can be re-run with just
a few mouse clicks
r Designed so that you can reproduce
results, output, and graphs easily and
accurately—a critical but often overlooked requirement for producing
reliable, publication-quality results
r True multiple window support. Simultaneously view your input commands
and output, spreadsheet-style “report”
windows, graphs, and more
Programmability
r Extensive looping capabilities and support for applying operations to lists of
variables make it possible to automate
many repetitive tasks
r You can write procedures, which can
perform complex tasks with a single
instruction, and write your own callable functions.
r A library of procedures written by
rats users from around the world is
available free of charge on our web site
r A variety of interface-related instructions allow you to create your own
drop-down menus, custom dialog
boxes, and more
RATS Professional
The Professional versions of rats add
the following features not found in the
Standard version:
r 64-bit version (Windows, unix/Linux)
r odbc/sql database support
r Census Bureau x12 seasonal adjustment routine
r Support for fame data files (for Windows and unix/linux)
r Support for crsp and fred databases
Free Technical Support, No Required Maintenance Fees
Estima supplies expert technical support at no additional charge for as long as you own the
software. Most questions are answered within one day. Users can also participate in web
and email discussion forums with rats users from around the world.
And your license to use rats will never expire—there are never any required maintenance
or licensing fees to continue using the software.
Supported Platforms
RATS for Windows
WinRATS runs on Windows 2000, xp,
Vista, and Windows 7. Pro versions includes
64-bit version. Requires a Pentium or better
processor, a hard drive with at least 90Mb
free, and a cd Rom drive.
RATS for Macintosh
Flexible Update Policies
Minor updates are often made available as free downloads, while more significant updates
are offered at very reasonable prices—typically no more than 10% to 15% of the original
purchase price. Updates are always optional.
For users who want to stay up to date automatically, we also offer Update Subscription
programs, which make it easy to budget software purchases and provide you with all updates
shipped to you on cd as soon as they are released.
MacRATS is a “Universal” application and
runs on any Intel or powerpc-based Mac,
running os x 10.4 or later. It requires a
hard drive with at least 90Mb free, and a
cd rom drive.
RATS for UNIX and Linux
rats is available for almost all unix and
Linux systems, and now includes the same
interactive-mode environment previously
available only for Windows and Macintosh.
The Linux and unix versions require a hard
drive with at least 90Mb free, and a cd
rom drive. The Motif x11 windowing libraries are required for interactive mode use.
The unix version requires that you have a
C compiler to compile the source code.
Pricing
The Box-Jenkins/ARIMA Wizard provides an easy way to estimate ARIMA and ARMAX models, including models with transfer
function or intervention terms.
1.50
1.25
1.00
Prices for single-user licenses are shown
below. We also offer multi-user licenses,
discounts on additional single-user licenses,
and several pricing options for classroom and
educational settings. Please contact Estima
for details on any of these.
Product
Price
WinRATS
WinRATS Professional
MacRATS
MacRATS Professional
Linux RATS (executable)
UNIX/Linux RATS (with source)
UNIX/Linux RATS Pro $500
$650
$500
$650
$600
$700
$850
Update Subscription Prices
0.75
0.50
1770
1780
1790
1800
ARCH6
1810
1820
EGARCH11
1830
1840
1850
1860
GARCH11
A sample time-series graph. Here, we’ve used the graphics style sheet feature in RATS to select thicker lines in shades of
gray to represent the three series. Because the series cross each other so frequently, the dash patterns that are the standard
for black and white lines wouldn’t look as good. We’ve used another option to place a key at the bottom of the graph.
For single-user licenses, an Update Subscription provides the user with all updates
through and including Version 8, shipped
on cd automatically.
Product for Subscription
Price
WinRATS, MacRATS
WinRATS Pro, MacRATS Pro
Linux RATS (executable)
UNIX/Linux RATS (with source)
UNIX/Linux RATS Pro $150
$175
$175
$200
$225
CATS 2.0 Cointegration Analysis Procedure
cats (Cointegration Analysis of
Time Series) is a sophisticated set of
rats procedures which implement
the popular Johansen and Juselius
cointegration analysis techniques.
Version 2.0 was written by Jonathan
Dennis, Katarina Juselius, Soren
Johansen, and Henrik Hansen of the
University of Copenhagen, and is
distributed and supported by Estima.
cats is almost entirely a menu and
dialog-driven procedure. You use
standard rats instructions to define
the frequency, read in data, and
do any necessary transformations.
You then “source” in and execute
the cats procedures. From there,
the rest of the analysis is done by
selecting operations from the cats
pull-down menus, and entering
information in pop-up dialog boxes.
The Johansen–Juselius approach to
cointegration is based on the errorcorrection form of a Gaussian vector
autoregression. In particular, they
analyze the decomposition of the matrix of error-correction coefficients P into ab'. The I(1) procedure supports partial systems,
and makes it easy to specify weakly exogenous variables. You can
also include dummy variables, or stationary dummy-type variables.
To help you choose a model, cats provides eigenvalues and trace
test statistics for reduced rank (as well as 90% critical values if requested) and unrestricted estimates of a, b, and P. You can check
the model by calculating multivariate test statistics for residual
autocorrelation, normality, and arch. Version 2 even provides an
automated model selection routine.
Additional features include:
• Auxiliary procedures for multivariate tests of long-run
exclusion, weak exogeneity and stationarity, and for
calculating eigenvalues and trace statistics for five different
hypotheses.
• Ability to set and reset the rank of P throughout the analysis,
and a variety of tests to help you determine the “correct” rank
order.
• Graphical analysis tools, including plots of the b-vectors to
check stationarity, and of residuals to locate possible problems
with the Gaussian assumption, plus correlograms and autocorrelograms.
• Descriptive statistics include: residual correlation matrices, the
short-run parameters and associated t-values, estimates of the
C-matrix (with asymptotic t-values) in the common trends
representation, and the long-run covariance matrix.
• Structural tests, including non-identifying restrictions on b,
identifying restrictions on b, and weak-exogeneity hypotheses
on a.
• Supports recursive cointegration analysis, with tests for
the constancy of the eigenvalues, stability of the estimated
cointegration space and the estimated parameters, and the
adequacy of the predictions from the model.
The cats package includes the cats procedures on diskette, a
200-page user’s manual, and sample data and program files.
The cost of a single copy of cats is $175. The price for fulltime students is $125 (verification of student status is required).
Site license prices are also available. cats requires Version 6.2 or
later of rats, and is available for Windows, Macintosh, unix,
and Linux. Please contact us if you have any questions about cats
or rats.
Also available: “The Cointegrated VAR Model: Methodology and
Applications”, by Katarina Juselius. Written in conjunction with
the development of cats 2.0, this book provides a comprehensive
look at both the theory and practice of cointegration analysis. It is
highly recommended for anyone using cats.
Online Courses and Resources
Over the past few years, we have provided several popular online
courses focused on particular topics in econometrics. These courses
are delivered via the discussion forum on our website, and include
pdf handbooks, example programs, and procedures specific to the
course, along with interactive discussions on the lessons and related
topics. Most courses last about two months, although we continue
to field questions from course participants indefinitely.
State Space and DSGE Models
Upcoming Courses
We do recommend that anyone purchasing the course materials also
have a copy of the Durbin and Koopman book, which is available
for purchase through Estima. The example programs require version
7.0 or later of rats.
Panel and Grouped Data
Our next web course will deal with Panel and Grouped Data, and
will run from January 26 to March 8 of 2012. This will be based
largely on Baltagi’s Econometrics of Panel Data, 4th edition.
We added quite a few new capabilities to RATS Version 8.1 for
handling panel and grouped data and this course will go over
them carefully. Among the topics will be organizing data, handling
balanced vs unbalanced (or generally grouped) data, panel data
transformations, fixed and random effects issues with dynamic
models (lagged dependent variables and panel VAR’s), unit roots
and cointegration, and fixed and random effects in non-linear
models like probits.
Materials From Previous Courses
The following sets of course materials, developed from our webbased, are now available on CD or by email for $50 per course.
Each package includes the pdf handbook containing the lecture
materials, as well as all of the example programs, data sets, and rats
procedures used in the course.
Please see www.estima.com/courses.shtml for information on any
current courses, or to order any of these materials via our website.
Bayesian Econometrics
The course wookbork is based upon the content of the RATS ecourse on Bayesian Econometrics, offered in April-May 2009. It
covers most of the most important methods now used in Bayesian
analysis in econometrics, including Gibbs sampling, MetropolisHastings and importance sampling. The applications are to a broad
range of topics, include time series, cross-section and panel data.
It assumes that the user is comfortable with such basic instructions
as COMPUTE, DISPLAY, GRAPH, SCATTER and LINREG, and
can use simple programming techniques such as DO loops. In each
chapter, there is a Tips and Tricks section which covers in greater
detail any functions or instructions that might be unfamiliar.
The presentation is based largely on Gary Koop’s Bayesian Econometrics (Koop 2003). We’ve added to that in several areas, with a
chapter on vector autoregressions, and examples from the literature
for panel, cross-sectional data and state-space models. In most cases,
we’ve included much of the statistical derivations from the book,
presented in a way to highlight the calculations as they are done with
RATS, so even those without the book can benefit.
The “State Space” part of this course, which ran in SeptemberOctober 2009, is based largely on Durbin and Koopman’s Time
Series Analysis by State Space Methods book, supplemented by material from Harvey’s Forecasting, Structural Time Series Models and the
Kalman Filter, and from West and Harrison’s Bayesian Forecasting
and Dynamic Models. Roughly two-thirds of the course is devoted to
State Space models, with the remainder focusing on dsge models.
Structural Breaks and Switching Models
This course, which ran from October 2010 through early 2011,
deals with a range of topics including outlier detection, intervention
modeling in various models, tests for structural breaks and threshold
effects, estimation of threshold and smooth transition models and
endogenous Markov switching models. It covers both maximum
likelihood and Bayesian estimation techniques.
VAR Models
The course covers identifying and estimating VAR models, computing impulse responses and variance decompositions, historical
decomposition and counterfactual simulations, structural and semistructural vars, and sign restrictions. The course was originally
presented in October-November 2009.
The Vector Autoregression (VAR) was introduced to the economics literature in the famous paper “Macroeconomics and Reality”
(Sims 1980b). Since then it, and its close relatives, have become the
standard for analyzing multiple time series. Even when more complicated and tightly parameterized models are used, it’s the stylized
facts gleaned from VAR analysis that they are expected to explain.
In this course, we examine techniques that use “flat priors”; that is,
the techniques designed to elicit information from the data without
the use of informative Bayesian priors. Strongly informative priors
(such as the so-called Minnesota prior) are widely used for building
forecasting models, but they tend to improve forecasts by shutting
down much of the cross-variable interaction. The techniques we
examine are designed primarily to analyze precisely that type of
interaction.
The
RATS Forum
In addition to hosting the online courses described above, the
rats
software forum available at
www.estima.com/forum
provides a convenient venue for rats users to discuss topics in
econometrics, share rats programs and procedures with other users,
and ask questions about using the software.
Participation is free for all licensed users of the software.
Econometrics Texts
Applied Econometric Time Series, 3rd edition, by Walter Enders
Applied Econometric Time Series, now in its third edition,
provides a lucid introduction to, and discussion of, most of the
key topics in modern time series econometrics, including stationarity and unit roots, arima models, volatility (arch/garch) models,
cointegration, and more. Geared towards Masters and PhD students
in time series analysis or advanced econometrics courses, as well as
professionals wishing to learn more about time series techniques.
Econometric Analysis of Panel Data, 4th Edition, by Badi Baltagi
Badi Baltagi’s Econometric Analysis of Panel Data is one of the leading
textbooks for postgraduate courses in panel data. The 4th edition
features recent developments in the field, and covers recent empirical
examples from the literature. It also examines dynamic panel data
models, non-linear panel models, and limited dependent variables
panel data models.
Introductory Econometrics for Finance, 2nd Edition
RATS Handbook for Intro. Econ. for Finance, by Chris Brooks
Introductory Econometrics for Finance is aimed at teaching introductory
econometrics to finance majors. It assumes no prior knowledge of
econometrics, and covers important modern topics such as time-series
forecasting, volatility modelling, switching models and simulation
methods. The book includes numerous examples and case studies,
making it particularly accessible for non-specialists. The second
edition contains new chapters on limited dependent variables and
panel methods, as well as new case studies from the finance literature.
Supporting materials are available on the web.
Brooks’ RATS Handbook, written to complement Introductory
Econometrics for Finance, provides a comprehensive introduction
to the use of rats for modelling in finance and beyond. It
includes numerous worked examples with carefully annotated code.
Detailed explanations of the outputs are also presented, giving readers the knowledge and confidence to use the software for their own
research and to interpret their own results.
An Introduction to State Space Time Series Analysis,
by Commandeur and Koopman
This text offers a step by step approach to the analysis of the salient
features in time series such as the trend, seasonal, and irregular
components. Practical problems such as forecasting and missing
values are treated in some detail. This useful book will appeal to
practitioners and researchers who use time series on a daily basis in
areas such as the social sciences, quantitative history, biology and
medicine. It also serves as an accompanying textbook for a basic time
series course in econometrics and statistics, typically at an advanced
undergraduate level or graduate level.
Time Series Analysis by State Space Methods,
by Durbin and Koopman
This is an excellent choice for rats users interested in pursuing state
space modelling techniques. Many of the enhancements to the dlm
instruction introduced in recent versions of rats were developed
in the process of writing rats code for the examples in this book.
Time Series Analysis, by James D. Hamilton
It’s no accident that Hamilton’s book is referenced extensively in
our rats manual, and in many journal articles published since its
release in 1994. A detailed treatment of modern time series analysis
and econometrics, suitable as a textbook for the student and as an
advanced reference for practicing researchers.
The Cointegrated VAR Model: Methodology & Applications,
by Katarina Juselius.
This book is highly recommended for anyone using Version 2 of
the “cats in rats” cointegration analysis software, but it will be of
interest to anyone interested in Vector Autoregression models and
cointegration analysis. The book was written in conjunction with
the development of cats 2.0, and provides a comprehensive look
at both the theory and practice of cointegration analysis.
Bayesian Econometrics, by Gary Koop
Designed for both undergraduate and graduate level econometrics
courses, this book introduces the use of Bayesian methods with a
focus on models used by applied economists and on the computational techniques required for empirical work. It includes many
numerical examples, and covers regression and time series models, qualitative and censored data, nonparametric methods, and
more. Data sets and code examples are available via the web.
Analysis of Financial Time Series, 2nd edition, by Ruey Tsay
Based on an mba course taught by the author, this covers a wide
range of topics, from Box-Jenkins modeling, through arch and
its relatives, duration models, continuous time models, value at risk
calculations, and multivariate time series and volatility analysis. It
includes rats programs for arch, non-linear volatility models
and duration models. (sca is used for basic time series methods.)
A Guide to Modern Econometrics, 3rd Edition, by Marno Verbeek
Verbeek notes that modern software tools have made it relatively
easy for researchers to apply the latest techniques without necessarily
understanding them well enough to be aware of potential problems
inherent in these techniques. This book is designed to help fill the
gap between introductory econometrics texts, which tend not cover
these techniques at all (or only deal with idealized cases), and more
advanced texts, which are often too advanced to be useful to many
practitioners. It aims to familiarize the reader with a wide range of
topics in modern econometrics, focusing on what is important for
doing and understanding empirical work.
Econometric Analysis of Cross Section and Panel Data
2nd Edition, by Jeffrey Wooldridge
Intended as a second semester graduate text, this book examines
the special problems that the econometrician must face in applying
linear regression, instrumental variables/gmm and sur estimators to
cross section and panel data. Also covers a wide range of non-linear
models: probit, logit, censoring and sample selection, count data
and duration models. This includes almost all techniques covered
in Chapter 14 of the RATS User’s Guide plus many more.
Databases
US Economic Data from Haver Analytics
In partnership with Haver Analytics, we are pleased to provide our
customers with high quality U.S. economic database services at very
reasonable prices. There are three packages from which to choose:
USECON Database
usecon (U.S. Economic Statistics) is Haver’s primary database of
U.S. economic and financial data. It includes approximately 12,000
series, including national accounts, prices, housing, construction,
industrial production, interest rates, money supply, and much more.
USECON Plus USNA Databases
Purchasers of the usecon database have the option of also subscribing to the usna (U.S. National Accounts) database, which offers
an additional 20,000 series with complete national income and
product accounts data from the Bureau of Economic Analysis. These
provide detailed information such as monthly personal consumption
expenditures and personal income.
US1 Database
The us1 database is a subset of the usecon database, containing
approximately 750 of the most commonly-used data series.
Distribution Details
The data are supplied on cd, both in rats format, and in Haver’s dlx (Data Link Express) format. rats users can access the
rats files directly using rats or the ratsdata utility program.
Customers with Version 5 or later of WinRATS can also read data
directly from the dlx versions of the data files. The cd also includes
our menu-driven ratsdata data-management software, for customers who do not have rats or Haver’s dlx software.
Database Products
Haver Analytics
❏
❏
❏
❏
❏
❏
❏
❏
❏
❏
❏
❏
USECON, Monthly
USECON plus NA, Monthly
US1, Monthly
USECON, Monthly, Academic
USECON, Quarterly, Academic
USECON, Annual, Academic
USECON + NA, Monthly, Academic
USECON + NA, Quarterly, Academic
USECON + NA, Annual, Academic
US1, Monthly, Academic
US1, Quarterly, Academic
US1, Annual, Academic
OECD MEI
❏
❏
❏
❏
❏
❏
❏
❏
❏
❏
❏
❏
Full, Monthly
Full, Quarterly
Full, Annual
G7, Monthly
G7, Quarterly
G7, Annual
Full, Monthly, Academic
Full, Quarterly, Academic
Full, Annual, Academic
G7, Monthly, Academic
G7, Quarterly, Academic
G7, Annual, Academic
$4,000
$5,000
$1,200
$3,000
$1,500
$1,000
$3,750
$2,000
$1,500
$900
$750
$500
$2,100
$1,500
$1,000
$1,600
$1,000
$600
$1,680
$1,200
$800
$1,280
$800
$480
The databases are offered as a one-year subscription. Commercial
institutions will receive updates every month. Academic institutions
can choose monthly updates, quarterly updates, or just a single copy
of the database (the “Annual” subscription).
Textbooks
OECD Main Economic Indicators Database
Econometrics Analysis of Panel Data _____ @ $58_=_ ___ by Badi Baltagi
The oecd mei database is available in “Full” and “Seven Country”
versions. The Full version includes data on more than 30 countries,
including Western Europe, the U.S., Canada, Japan, Turkey, Australia,
New Zealand, Mexico, Russia, and the former Soviet republics. The
seven country version includes only the G7 countries.
The data for most countries include gdp and its major components, producer and consumer price indexes, money stock and
related measures, major interest rates, industrial production indexes,
unemployment rates, exchange rate vs. the dollar, and the general
stock market index. For larger countries, you will also find data on
orders, shipments, and inventory stocks, plus greater disaggregation
on the price and industrial production indexes. Many of the monthly
series are available in both seasonally adjusted and unadjusted forms.
You can purchase a single copy of the oecd database, or you can
purchase quarterly or monthly subscriptions. The data are supplied on cd, in our convenient rats data file format, with one file
per country. You can read the data directly into rats, or use the
included ratsdata utility program to view, print, or graph data,
or export data into text files, Excel spreadsheets, and other formats.
Academic institutions qualify for discounted pricing, as noted in
the price table at right.
Description
Quant Price Tot
Applied Econometric Time Series
_____ @$135_=_ ___
by Walter Enders
Introductory Econom. for Finance RATS Handbook for I.E. for F.
by Chris Brooks
_____ @ $58_=_ ___
_____ @ $35_=_ ___ Intro to State Space Time Series Commandeur and Koopman
_____ @ $45_=_ ___ Time Series Analysis by State Space _____ @ $90_=_ ___ Methods, Durbin and Koopman
Time Series Analysis, by J. Hamilton _____ @ $80_=_ ___
The Cointegrated VAR Model
by Katarina Juselius
_____ @ $44_=_ ___
Bayesian Econometrics
by Gary Koop
_____ @ $75_=_ ___
Analysis of Financial Time Series, 3rd edition, by Ruey Tsay _____ @ $100_=_ ___
A Guide to Modern Econometrics, by Marno Verbeek _____ @ $58_= ____
Econometric Analysis of Cross Section _____ @ $75_=_ ___
& Panel Data, 2nd ed, by Wooldridge