1
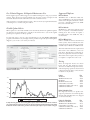
5$76
(CUV'CU[(NGZKDNGCPF4GNKCDNG6KOG5GTKGUCPF%TQUU5GEVKQPCN&CVC#PCN[UKU
RATS provides all the basics, including linear and non-linear least squares, forecasting, and ARIMA models, but goes far beyond that with
support for techniques like GMM, ARCH and GARCH, vector autoregressions (VARs), spectral analysis, state space models and DSGEs,
and much more.
It can handle time series of virtually
any frequency, including daily and
weekly, as well as panel data, and
produces publication-quality graphs
for printing or importing directly into
word processors.
Menu-driven “Wizards” provide a
point-and-click interface for many
common tasks, making RATS an
ideal tool for new users and for
educational settings.
Meanwhile, the powerful commanddriven language at the heart of
the program remains easy to learn
and use for simple jobs, while also
allowing users to automate complex
or repetitive tasks and even write
sophisticated menu- and dialog-driven
end-user applications.
RATS is available for Windows,
Macintosh, UNIX, with complete
compatibility across platforms.
6JG4#65XKPVGTHCEG*GTGVJGUGSWGPEGQHEQOOCPFUCRRGCTKPQPGVGZVYKPFQYYKVJVJGQWVRWVFKTGEVGFVQCPQVJGTYKPFQY
6JKUOCMGUKVGCU[VQUCXGEQOOCPFUCUCEQORNGVGRTQITCOYJKEJ[QWECPTGTWPNCVGTYKVJCEQWRNGQHOQWUGENKEMU#NUQ
XKUKDNGCTGCTGRQTVYKPFQYUJQYKPIVJGQWVRWVHTQOC$QZ,GPMKPUGUVKOCVKQPCITCRJYKPFQYCPFCNQQMCVVJGYK\CTFUQP
VJG6KOG5GTKGUOGPW
/CLQT+ORTQXGOGPVU5KPEG8GTUKQP+PENWFG
(QT/QTG+PHQTOCVKQPQTVQ2NCEGCP1TFGT
❒
Revised and expanded manuals, with all-new Introduction.
RATS is available directly from Estima, and from resellers around
❒
Much faster computation speeds. Complex estimation programs may run up to two times faster than before.
❒
Significant extensions to state space and DSGE capabilities.
the world. We offer single-user, multi-user and network licenses,
as well as several options for using RATS in instructional settings,
including discounts for full-time students.
❒
Reads data from Excel® 2007, Stata®, Matlab®, Eviews®.
For more information, please visit our web site at:
❒
Census Bureau X12-ARIMA seasonal adjustment (Pro version).
ZZZHVWLPDFRP
❒
Enhanced reporting features for viewing, saving, and exporting results. Can now export in TeX format.
or contact us by phone, fax, mail, or email:
❒
More point-and-click Wizards.
❒
Dozens of new built-in functions.
❒
Graphics: Now generates box plots. More control over graph
labeling, window titles, background color.
❒
Expanded View menu & toolbar icons for quick data analysis.
❒
New options for initial conditions on non-linear estimation.
7ROOIUHH
*HQHUDO
)D[
(PDLO
²²
²²
VDOHV#HVWLPDFRP
(VWLPD
6KHUPDQ$YH6XLWH
(YDQVWRQ,/86$
4#658GTUKQP(GCVWTGU
Statistical Methods
'UVKOCVKQP6GEJPKSWGU
❒ Multiple regressions including stepwise
❒ Regression with autoregressive errors
❒ Heteroscedasticity/serial-correlation
correction, including Newey-West
❒ Non-linear least squares
❒ Two-stage least squares for linear, nonlinear, & autocorrelated models
❒ Seemingly unrelated regressions and
three-stage least squares
❒ Non-linear systems estimation
❒ Generalized Method of Moments
❒ Maximum likelihood estimation
❒ Constrained optimization
❒ Extensive built-in hypothesis testing,
with procedures for a huge variety of
unit-root, stability, and other tests
❒ Limited and discrete dependent variable models: logit, probit, censored/
truncated data (Tobit), count models
❒ Panel data support, including fixed and
random effects estimators
❒ Non-parametric regressions
❒ Kernel density estimation
❒ Robust estimation
❒ Recursive least squares
❒ State-space models, including Kalman
filtering and smoothing, simulations,
and optimal control models
❒ DSGE models
❒ Neural network models
❒ Linear and quadratic programming
6KOG5GTKGU2TQEGFWTGU
❒ Easy to specify lags and leads for timeseries model estimation and analysis
❒ ARIMA and ARMAX models including
multiplicative seasonal models; support
for arbitrary lag structures
❒ Transfer function/intervention models
❒ Error correction models
❒ Kalman filter
❒ Spectral analysis
(QTGECUVKPI
❒
❒
❒
❒
❒
Time series models
Regression models
Exponential smoothing
Static or dynamic forecasts
Simultaneous equation models (unlimited number of equations)
❒ Simulations with random or usersupplied shocks
❒ Forecast performance statistics, including Theil U statistics
8GEVQT#WVQTGITGUUKQPU
8#4U
❒ Unmatched support for VAR models
❒ Error Correction models
❒ Structural VARs. Choice of factorizations, including estimation of a factor
matrix from a covariance matrix model
❒ Impulse responses, with Monte Carlo
and Importance Sampling techniques
for standard error bands.
❒ Forecasting
❒ Variance decomposition
❒ Historical decomposition
❒ Extensive hypothesis testing tools
❒ CATS 2.0 add-on provides industryleading cointegration analysis
#4%*CPF)#4%*/QFGNU
❒ Univariate and multivariate, including
BEKK, diagonal, CC, DCC, and VECH
multivariate models
❒ Support for GARCH-in-mean models
❒ Additional exogenous variables in mean
and/or variance equations
❒ Normal, t and GED distributions
❒ Exponential and Asymmetric models
❒ Robust standard errors
Working With Data
&CVC'PVT[
❒ Menu-driven Data Wizards for reading
in data
❒ Reads and writes Excel files, text files,
EViews®, Stata®, and other formats
❒ Pro version supports SQL/ODBC
❒ On-screen data viewer and editor, with
point-and-click graphing and statistics
tools
❒ Can handle virtually any data frequency, including daily, weekly, intra-day,
and panel data
❒ Can automatically convert data to different frequencies
❒ RATS data file format is fast and easy,
supports all frequencies, and allows you
to store series of different frequencies
on the same file
&CVC6TCPUHQTOCVKQPU
❒ Flexible transformations with
algebraic formulas
❒ Easy to create trend series, seasonal,
and time period dummies
❒ Extensive filtering operations, including Hodrick-Prescott, Henderson,
Spencer, and custom filters
❒ Supports regular, seasonal, and fractional differencing
)TCRJKEU
❒
❒
❒
❒
❒
High-quality time series graphics
High-resolution X-Y scatter plots
Dual-scale graphs
Contour graphs
Copy-and-paste graphs into other applications
❒ Export graphs to many formats,
including PostScript and Windows
Metafile
❒ User can customize attributes such
as line thickness, colors and grayscale
levels, and fill patterns
Interface
+PVGTCEVKXG/QFG'PXKTQPOGPV
❒ Text-editor based
❒ Point-and-click “wizards” for many
tasks, greatly enhancing ease-of-use
❒ Saved programs can be re-run with just
a few mouse clicks
❒ Designed so that you can reproduce
results, output, and graphs easily and
accurately—a critical but often overlooked requirement for producing
reliable, publication-quality results
❒ True multiple window support. Simultaneously view your input commands
and output, spreadsheet-style “report”
windows, graphs, and more
2TQITCOOCDKNKV[
❒ Extensive looping capabilities and support for applying operations to lists of
variables make it possible to automate
many repetitive tasks
❒ You can write procedures, which can
perform complex tasks with a single
instruction, and write your own callable functions.
❒ A library of procedures written by
RATS users from around the world is
available free of charge on our web site
❒ A variety of interface-related instructions allow you to create your own
drop-down menus, custom dialog
boxes, and more
RATS Professional
The Professional versions of RATS add
the following features not found in the
Standard version:
❒ 64-bit version (Windows, UNIX/Linux)
❒ ODBC/SQL database support
❒ Census Bureau X12 seasonal adjustment routine
❒ Support for FAME data files (for Windows and UNIX/LINUX)
❒ Support for CRSP and FRED databases
Free Technical Support, No Required Maintenance Fees
Supported Platforms
Estima supplies expert technical support at no additional charge for as long as you own the
software. Most questions are answered within one day. Users can also participate in web
and email discussion forums with RATS users from around the world.
And your license to use RATS will never expire—there are never any required maintenance
or licensing fees to continue using the software.
4#65HQT9KPFQYU
WinRATS runs on Windows 2000, XP,
Vista, and Windows 7. Pro versions includes
64-bit version. Requires a Pentium or better
processor, a hard drive with at least 90Mb
free, and a CD Rom drive.
4#65HQT/CEKPVQUJ
Flexible Update Policies
Minor updates are often made available as free downloads, while more significant updates
are offered at very reasonable prices—typically no more than 10% to 15% of the original
purchase price. Updates are always optional.
For users who want to stay up to date automatically, we also offer Update Subscription
programs, which make it easy to budget software purchases and provide you with all updates
shipped to you on CD as soon as they are released.
MacRATS is a “Universal” application and
runs on any Intel or PowerPC-based Mac,
running OS X 10.4 or later. It requires a
hard drive with at least 90Mb free, and a
CD Rom drive.
4#65HQT70+:CPF.KPWZ
RATS is available for almost all UNIX and
Linux systems, and now includes the same
interactive-mode environment previously
available only for Windows and Macintosh.
The Linux and UNIX versions require a hard
drive with at least 90Mb free, and a CD
Rom drive. The Motif X11 windowing libraries are required for interactive mode use.
The UNIX version requires that you have a
C compiler to compile the source code.
Pricing
Prices for single-user licenses are shown
below. We also offer multi-user licenses,
discounts on additional single-user licenses,
6JG$QZ,GPMKPU#4+/#9K\CTFRTQXKFGUCPGCU[YC[VQGUVKOCVG#4+/#CPF#4/#:OQFGNUKPENWFKPIOQFGNUYKVJVTCPUHGT and several pricing options for classroom and
HWPEVKQPQTKPVGTXGPVKQPVGTOU
educational settings. Please contact Estima
for details on any of these.
1.50
1.25
1.00
2TQFWEV
2TKEG
WinRATS
WinRATS Professional
MacRATS
MacRATS Professional
Linux RATS (executable)
UNIX/Linux RATS (with source)
UNIX/Linux RATS Pro
$500
$650
$500
$650
$600
$700
$850
7RFCVG5WDUETKRVKQP2TKEGU
0.75
0.50
1770
1780
1790
1800
ARCH6
1810
1820
EGARCH11
1830
1840
1850
1860
GARCH11
#UCORNGVKOGUGTKGUITCRJ*GTGYGʼnXGWUGFVJGITCRJKEUUV[NGUJGGVHGCVWTGKP4#65VQUGNGEVVJKEMGTNKPGUKPUJCFGUQH
ITC[VQTGRTGUGPVVJGVJTGGUGTKGU$GECWUGVJGUGTKGUETQUUGCEJQVJGTUQHTGSWGPVN[VJGFCUJRCVVGTPUVJCVCTGVJGUVCPFCTF
HQTDNCEMCPFYJKVGNKPGUYQWNFPʼnVNQQMCUIQQF9GʼnXGWUGFCPQVJGTQRVKQPVQRNCEGCMG[CVVJGDQVVQOQHVJGITCRJ
For single-user licenses, an Update Subscription provides the user with all updates
through and including Version 8, shipped
on CD automatically.
2TQFWEVHQT5WDUETKRVKQP
2TKEG
WinRATS, MacRATS
WinRATS Pro, MacRATS Pro
Linux RATS (executable)
UNIX/Linux RATS (with source)
UNIX/Linux RATS Pro
$150
$175
$175
$200
$225
%#65%QKPVGITCVKQP#PCN[UKU2TQEGFWTG
CATS (Cointegration Analysis of
Time Series) is a sophisticated set of
RATS procedures which implement
the popular Johansen and Juselius
cointegration analysis techniques.
Version 2.0 was written by Jonathan
Dennis, Katarina Juselius, Soren
Johansen, and Henrik Hansen of the
University of Copenhagen, and is
distributed and supported by Estima.
CATS is almost entirely a menu and
dialog-driven procedure. You use
standard RATS instructions to define
the frequency, read in data, and
do any necessary transformations.
You then “source” in and execute
the CATS procedures. From there,
the rest of the analysis is done by
selecting operations from the CATS
pull-down menus, and entering
information in pop-up dialog boxes.
The Johansen–Juselius approach to
cointegration is based on the errorcorrection form of a Gaussian vector
autoregression. In particular, they
analyze the decomposition of the matrix of error-correction coefficients Π into αβ'. The I(1) procedure supports partial systems,
and makes it easy to specify weakly exogenous variables. You can
also include dummy variables, or stationary dummy-type variables.
To help you choose a model, CATS provides eigenvalues and trace
test statistics for reduced rank (as well as 90% critical values if requested) and unrestricted estimates of α, β, and Π. You can check
the model by calculating multivariate test statistics for residual
autocorrelation, normality, and ARCH. Version 2 even provides an
automated model selection routine.
Additional features include:
• Auxiliary procedures for multivariate tests of long-run
exclusion, weak exogeneity and stationarity, and for
calculating eigenvalues and trace statistics for five different
hypotheses.
• Ability to set and reset the rank of Π throughout the analysis,
and a variety of tests to help you determine the “correct” rank
order.
• Graphical analysis tools, including plots of the β-vectors to
check stationarity, and of residuals to locate possible problems
with the Gaussian assumption, plus correlograms and autocorrelograms.
• Descriptive statistics include: residual correlation matrices, the
short-run parameters and associated t-values, estimates of the
C-matrix (with asymptotic t-values) in the common trends
representation, and the long-run covariance matrix.
• Structural tests, including non-identifying restrictions on β,
identifying restrictions on β, and weak-exogeneity hypotheses
on α.
• Supports recursive cointegration analysis, with tests for
the constancy of the eigenvalues, stability of the estimated
cointegration space and the estimated parameters, and the
adequacy of the predictions from the model.
The CATS package includes the CATS procedures on diskette, a
200-page user’s manual, and sample data and program files.
The cost of a single copy of CATS is $175. The price for fulltime students is $125 (verification of student status is required).
Site license prices are also available. CATS requires Version 6.2 or
later of RATS, and is available for Windows, Macintosh, UNIX,
and Linux. Please contact us if you have any questions about CATS
or RATS.
Also available: “The Cointegrated VAR Model: Methodology and
Applications”, by Katarina Juselius. Written in conjunction with
the development of CATS 2.0, this book provides a comprehensive
look at both the theory and practice of cointegration analysis. It is
highly recommended for anyone using CATS.
1PNKPG%QWTUGUCPF4GUQWTEGU
Over the past few years, we have provided several popular online
courses focused on particular topics in econometrics. These courses
are delivered via the discussion forum on our website, and include
3') handbooks, example programs, and procedures specific to the
course, along with interactive discussions on the lessons and related
topics. Most courses last about two months, although we continue
to field questions from course participants indefinitely.
5VCVG5RCEGCPF&5)'/QFGNU
Upcoming Courses
We do recommend that anyone purchasing the course materials also
have a copy of the Durbin and Koopman book, which is available
for purchase through Estima. The example programs require version
7.0 or later of 5$76.
2CPGNCPF)TQWRGF&CVC
Our next web course will deal with Panel and Grouped Data, and
will run from January 26 to March 8 of 2012. This will be based
largely on Baltagi’s Econometrics of Panel Data, 4th edition.
We added quite a few new capabilities to RATS Version 8.1 for
handling panel and grouped data and this course will go over
them carefully. Among the topics will be organizing data, handling
balanced vs unbalanced (or generally grouped) data, panel data
transformations, fixed and random effects issues with dynamic
models (lagged dependent variables and panel VAR’s), unit roots
and cointegration, and fixed and random effects in non-linear
models like probits.
Materials From Previous Courses
The following sets of course materials, developed from our webbased, are now available on CD or by email for $50 per course.
Each package includes the 3') handbook containing the lecture
materials, as well as all of the example programs, data sets, and 5$76
procedures used in the course.
Please see www.estima.com/courses.shtml for information on any
current courses, or to order any of these materials via our website.
$C[GUKCP'EQPQOGVTKEU
The course wookbork is based upon the content of the RATS ecourse on Bayesian Econometrics, offered in April-May 2009. It
covers most of the most important methods now used in Bayesian
analysis in econometrics, including Gibbs sampling, MetropolisHastings and importance sampling. The applications are to a broad
range of topics, include time series, cross-section and panel data.
It assumes that the user is comfortable with such basic instructions
as &20387(, ',63/$<, *5$3+, 6&$77(5 and /,15(*, and
can use simple programming techniques such as '2 loops. In each
chapter, there is a Tips and Tricks section which covers in greater
detail any functions or instructions that might be unfamiliar.
The presentation is based largely on Gary Koop’s Bayesian Econometrics (Koop 2003). We’ve added to that in several areas, with a
chapter on vector autoregressions, and examples from the literature
for panel, cross-sectional data and state-space models. In most cases,
we’ve included much of the statistical derivations from the book,
presented in a way to highlight the calculations as they are done with
RATS, so even those without the book can benefit.
The “State Space” part of this course, which ran in SeptemberOctober 2009, is based largely on Durbin and Koopman’s Time
Series Analysis by State Space Methods book, supplemented by material from Harvey’s Forecasting, Structural Time Series Models and the
Kalman Filter, and from West and Harrison’s Bayesian Forecasting
and Dynamic Models. Roughly two-thirds of the course is devoted to
State Space models, with the remainder focusing on '6*( models.
5VTWEVWTCN$TGCMUCPF5YKVEJKPI/QFGNU
This course, which ran from October 2010 through early 2011,
deals with a range of topics including outlier detection, intervention
modeling in various models, tests for structural breaks and threshold
effects, estimation of threshold and smooth transition models and
endogenous Markov switching models. It covers both maximum
likelihood and Bayesian estimation techniques.
8#4/QFGNU
The course covers identifying and estimating VAR models, computing impulse responses and variance decompositions, historical
decomposition and counterfactual simulations, structural and semistructural 9$5s, and sign restrictions. The course was originally
presented in October-November 2009.
The Vector Autoregression (VAR) was introduced to the economics literature in the famous paper “Macroeconomics and Reality”
(Sims 1980b). Since then it, and its close relatives, have become the
standard for analyzing multiple time series. Even when more complicated and tightly parameterized models are used, it’s the stylized
facts gleaned from VAR analysis that they are expected to explain.
In this course, we examine techniques that use “flat priors”; that is,
the techniques designed to elicit information from the data without
the use of informative Bayesian priors. Strongly informative priors
(such as the so-called Minnesota prior) are widely used for building
forecasting models, but they tend to improve forecasts by shutting
down much of the cross-variable interaction. The techniques we
examine are designed primarily to analyze precisely that type of
interaction.
6JG4#65(QTWO
In addition to hosting the online courses described above, the
RATS
software forum available at
www.estima.com/forum
provides a convenient venue for RATS users to discuss topics in
econometrics, share rats programs and procedures with other users,
and ask questions about using the software.
Participation is free for all licensed users of the software.