1
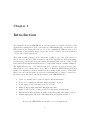
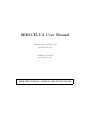
SER1CH-UA User Manual
Manual Revision (2007/11/25)
Board Revision B
Symmetric Research
www.symres.com
FREE WEB VERSION - PARTIAL CIRCUIT DIAGRAMS
Contents
1 Introduction
6
2 Getting started
2.1 Hardware installation . . . . . . . . . . . . . . . . . . . . . . . . . . . . . .
2.2 Software installation . . . . . . . . . . . . . . . . . . . . . . . . . . . . . . .
2.3 Do’s and Don’ts . . . . . . . . . . . . . . . . . . . . . . . . . . . . . . . . .
8
8
10
11
3 Application Programs
3.1 DVM . . . . . . . . . . . . . . . . .
3.1.1 starting the program . . . .
3.1.2 determining the serial port
3.1.3 ini syntax . . . . . . . . . .
3.1.4 calibrating the readouts . .
3.1.5 ASC output file format . .
3.1.6 modifying the program . . .
3.2 CAL . . . . . . . . . . . . . . . . .
3.2.1 starting the program . . . .
3.2.2 modifying the program . . .
3.2.3 determining the serial port
.
.
.
.
.
.
.
.
.
.
.
12
13
15
16
17
19
20
23
24
26
27
28
.
.
.
.
.
.
29
31
32
33
35
36
37
5 Sigma Delta A/D converters
5.1 Sampling rate . . . . . . . . . . . . . . . . . . . . . . . . . . . . . . . . . . .
5.2 50/60Hz power line rejection . . . . . . . . . . . . . . . . . . . . . . . . . .
38
38
38
4 User C Library
4.1 Open device . . . . . . .
4.2 Read data . . . . . . . .
4.3 Scale data . . . . . . . .
4.4 Get error message string
4.5 Close device . . . . . . .
4.6 Code example . . . . . .
.
.
.
.
.
.
.
.
.
.
.
.
.
.
.
.
.
.
.
.
.
.
.
.
.
.
.
.
.
.
.
.
.
.
.
.
.
.
.
.
.
.
.
.
.
.
.
.
.
.
.
.
.
2
.
.
.
.
.
.
.
.
.
.
.
.
.
.
.
.
.
.
.
.
.
.
.
.
.
.
.
.
.
.
.
.
.
.
.
.
.
.
.
.
.
.
.
.
.
.
.
.
.
.
.
.
.
.
.
.
.
.
.
.
.
.
.
.
.
.
.
.
.
.
.
.
.
.
.
.
.
.
.
.
.
.
.
.
.
.
.
.
.
.
.
.
.
.
.
.
.
.
.
.
.
.
.
.
.
.
.
.
.
.
.
.
.
.
.
.
.
.
.
.
.
.
.
.
.
.
.
.
.
.
.
.
.
.
.
.
.
.
.
.
.
.
.
.
.
.
.
.
.
.
.
.
.
.
.
.
.
.
.
.
.
.
.
.
.
.
.
.
.
.
.
.
.
.
.
.
.
.
.
.
.
.
.
.
.
.
.
.
.
.
.
.
.
.
.
.
.
.
.
.
.
.
.
.
.
.
.
.
.
.
.
.
.
.
.
.
.
.
.
.
.
.
.
.
.
.
.
.
.
.
.
.
.
.
.
.
.
.
.
.
.
.
.
.
.
.
.
.
.
.
.
.
.
.
.
.
.
.
.
.
.
.
.
.
.
.
.
.
.
.
.
.
.
.
.
.
.
.
.
.
.
.
.
.
.
.
.
.
.
.
.
.
.
.
.
.
.
.
.
.
.
.
.
.
.
.
.
.
.
.
.
.
.
.
.
.
.
.
.
.
.
.
.
.
.
.
.
.
.
.
.
.
.
.
.
.
.
.
.
.
.
.
.
.
.
.
.
.
.
.
.
.
.
.
.
.
.
6 Analog DC calibration
6.1 Full Scale Voltage Span and Counts . . . . . . . . . . . . . . . . . . . . . .
6.2 Approximate counts per volt . . . . . . . . . . . . . . . . . . . . . . . . . .
6.3 Calibration slope and offset . . . . . . . . . . . . . . . . . . . . . . . . . . .
39
40
41
42
7 Analog Resolution
7.1 Noise floor . . . . . . . . . . . . . . . . . . . . . . . . . . . . . . . . . . . . .
7.2 Thermal drift . . . . . . . . . . . . . . . . . . . . . . . . . . . . . . . . . . .
44
45
46
8 Ratiometric measurements
47
9 Scaling sensor voltages
9.1 Resistive scaling and biasing . . . . . . . . . . . . . . . . . . . . . . . . . . .
9.2 Op Amp scaling and biasing . . . . . . . . . . . . . . . . . . . . . . . . . . .
51
52
54
10 Single ended grounding practices
56
11 Batteries and minimizing power
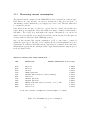
11.1 Measuring current consumption . . . . . . . . . . . . . . . . . . . . . . . . .
11.2 Minimizing power . . . . . . . . . . . . . . . . . . . . . . . . . . . . . . . . .
11.3 Batteries . . . . . . . . . . . . . . . . . . . . . . . . . . . . . . . . . . . . . .
57
58
59
60
12 Specifications
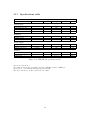
12.1 Specifications table . . . . . . . . . . . . . . . . . . . . . . . . . . . . . . . .
12.2 Noise floor . . . . . . . . . . . . . . . . . . . . . . . . . . . . . . . . . . . . .
12.3 Thermal response . . . . . . . . . . . . . . . . . . . . . . . . . . . . . . . . .
61
62
63
64
13 Circuit diagrams
65
14 Examples and Experiments
14.1 Basic voltage measurements with probes .
14.2 Plotting results with GnuPlot . . . . . . .
14.3 Ratiometric potentiometer . . . . . . . . .
14.4 Scaling and biasing +/-10 volt signals into
14.5 Measuring temperature . . . . . . . . . .
.
.
.
.
.
70
71
74
78
80
82
15 Frequently Asked Questions
15.1 Software . . . . . . . . . . . . . . . . . . . . . . . . . . . . . . . . . . . . . .
15.2 Hardware . . . . . . . . . . . . . . . . . . . . . . . . . . . . . . . . . . . . .
84
84
85
16 Extra supplies
16.1 Small parts for cables etc . . . . . . . . . . . . . . . . . . . . . . . . . . . .
90
91
3
. . . .
. . . .
. . . .
(0,5) .
. . . .
.
.
.
.
.
.
.
.
.
.
.
.
.
.
.
.
.
.
.
.
.
.
.
.
.
.
.
.
.
.
.
.
.
.
.
.
.
.
.
.
.
.
.
.
.
.
.
.
.
.
.
.
.
.
.
.
.
.
.
.
.
.
.
.
.
.
.
.
.
.
List of Figures
1.1
SER1CH-UA with typical potentiometer setup . . . . . . . . . . . . . . . . .
7
2.1
2.2
VIN connected to VREF . . . . . . . . . . . . . . . . . . . . . . . . . . . . . .
VIN connected to GND . . . . . . . . . . . . . . . . . . . . . . . . . . . . . .
9
9
3.1
3.2
3.3
3.4
3.5
3.6
Screen shot of GUI version of DVM program . . . . .
Sample DVM ini initialization file . . . . . . . . . . . .
DVM ini keyword table . . . . . . . . . . . . . . . . .
Sample DvmOutput.asc output file in verbose mode. .
Sample DvmOutputBare.asc output file in bare mode.
Screen shot of GUI version of CAL program . . . . . .
.
.
.
.
.
.
13
17
18
21
22
25
4.1
4.2
Ser1ch library function table . . . . . . . . . . . . . . . . . . . . . . . . . . . .
Sample C program calling Ser1ch library . . . . . . . . . . . . . . . . . . . . .
30
37
6.1
6.2
A/D counts with single ended input . . . . . . . . . . . . . . . . . . . . . . .
Production input offset spreads . . . . . . . . . . . . . . . . . . . . . . . . . .
40
43
7.1
7.2
SER1CH-UA long term resolution plot . . . . . . . . . . . . . . . . . . . . . .
Thermal drift plot . . . . . . . . . . . . . . . . . . . . . . . . . . . . . . . . .
45
46
8.1
8.2
Potentiometer parameters . . . . . . . . . . . . . . . . . . . . . . . . . . . . .
SER1CH-UA ratiometric comparison . . . . . . . . . . . . . . . . . . . . . . .
48
49
9.1
9.2
9.3
9.4
9.5
Two resistor scaling and biasing (-5,+5) into (0,5) . . . .
Three resistor scaling and biasing (-10,+10) into (0,5) . .
Three resistor values for various input ranges with Vbias =
Op amp unity gain buffer with scaling . . . . . . . . . . .
Op amp buffer with gain of 10 . . . . . . . . . . . . . . .
.
.
.
.
.
52
53
53
54
55
11.1
Maximum base power consumption . . . . . . . . . . . . . . . . . . . . . . . .
58
12.1
12.2
12.3
Specifications table . . . . . . . . . . . . . . . . . . . . . . . . . . . . . . . . .
SER1CH-UA noise floor . . . . . . . . . . . . . . . . . . . . . . . . . . . . . .
SER1CH-UA thermal response . . . . . . . . . . . . . . . . . . . . . . . . . .
62
63
64
14.1
Two lead voltage measurement of a battery . . . . . . . . . . . . . . . . . . .
71
4
.
.
.
.
.
.
.
.
.
.
.
.
.
.
.
.
.
.
.
.
.
.
.
.
.
.
.
.
.
.
.
.
.
.
.
.
. . . .
. . . .
VREF
. . . .
. . . .
.
.
.
.
.
.
.
.
.
.
.
.
.
.
.
.
.
.
.
.
.
.
.
.
.
.
.
.
.
.
.
.
.
.
.
.
.
.
.
.
.
.
.
.
.
.
.
.
.
.
.
.
.
.
.
.
.
.
.
.
.
.
.
.
.
.
14.2
14.3
14.4
14.5
14.6
14.7
14.8
14.9
14.10
14.11
14.12
14.13
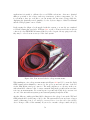
Pomona test leads for voltage measurements . . . . . .
Using a solar cell as a light level meter . . . . . . . . .
DVM output file fragment from DvmOutputSolar.asc .
DVM startup file fragment from DvmSetupSolar.ini .
GnuPlot commands for plotting DvmOutputSolar.asc
SER1CH-UA solar cell data example plot . . . . . . .
10 turn potentiometer, SER1CH-UA connections . . .
10 turn potentiometer, reverse side connections . . . .
Linear slider potentiometer . . . . . . . . . . . . . . .
Scaling and biasing (-10,+10) with four 10K resistors .
Temp diode with simple resistive current source . . . .
Temp diode with constant current op amp source . . .
5
.
.
.
.
.
.
.
.
.
.
.
.
.
.
.
.
.
.
.
.
.
.
.
.
.
.
.
.
.
.
.
.
.
.
.
.
.
.
.
.
.
.
.
.
.
.
.
.
.
.
.
.
.
.
.
.
.
.
.
.
.
.
.
.
.
.
.
.
.
.
.
.
.
.
.
.
.
.
.
.
.
.
.
.
.
.
.
.
.
.
.
.
.
.
.
.
.
.
.
.
.
.
.
.
.
.
.
.
.
.
.
.
.
.
.
.
.
.
.
.
.
.
.
.
.
.
.
.
.
.
.
.
.
.
.
.
.
.
.
.
.
.
.
.
.
.
.
.
.
.
.
.
.
.
.
.
72
73
74
75
76
77
78
79
79
80
82
83
Chapter 1
Introduction
The Symmetric Research SER1CH-UA is a precision analog to digital converter for DC
applications requiring 24 bit A/D conversions at a 1Hz sampling rate. In addition to its
high resolution, the system also has very low power consumption. With an active power
requirement of only 600 microamperes at 9 volts, it can be easily powered from batteries
or solar cells for field applications.
Along with an analog input for A/D conversions, a buffered copy of the A/D reference is
also provided for the user. This is useful for ratiometric applications, such as measuring
potentiometer positions and other sensor values. By using the same reference voltage for the
sensor and A/D, measurement variations due to temperature drift are virtually eliminated.
The digital interface is to a PC RS232 serial port. Software access is from user space
without the need for a kernel mode device driver. A Windows GUI DVM application is
included for displaying conversion results as well as saving acquired data to a hard disk.
Easy to use, the system requires power from a wall transformer or battery, connection to
the user’s sensor, and a PC. Among the features of the SER1CH-UA are:
•
24 bit one channel A/D converter design for DC measurements
•
Low power consumption, 600 microamperes during conversion
•
Power supply voltage can range from 9 to 18 volts
•
Buffered analog input with 10M ohm input impedance
•
Buffered A/D reference voltage provided for ratiometric measurements
•
General use includes applications with potentiometers and other passive sensors
•
Banana input plugs, test leads, wall transformer, and software included
We hope the SER1CH-UA is a useful tool for your applications
6
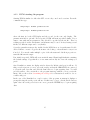
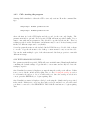
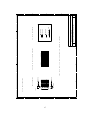
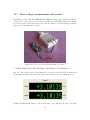
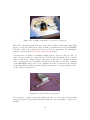
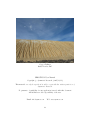
Typical usage:
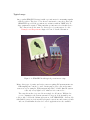
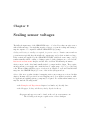
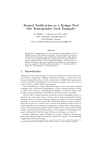
One popular SER1CH-UA setup is with a potentiometer for measuring angular
or linear position. The photo below shows a ratiometric connection, where the
SER1CH-UA provides the potentiometer excitation with its VREF jack. No
other equipment is required. This particular potentiometer is a 10 turn device.
The connections are the same for other types of potentiometers. See the
Examples and Experiments chapter for a more detailed discussion.
Figure 1.1: SER1CH-UA with typical potentiometer setup
Many other types of passive and active sensors requiring DC measurements at a
1Hz sampling rate can also be used. Strain gauges, photocells, and pressure
sensors are a few examples. With an input impedance of 10M ohms the system
adds only a very light load to whatever it is connected to.
The setup shown here is powered from a single 9 volt battery. With its low
power consumption, the system can run for long periods from small power
sources. Also, besides the banana jack version of the SER1CH-UA, other models
with Dshell connectors for front and back panel connections, and a narrow 1 inch
wide model with inline headers for borehole applications are also available.
7
Chapter 2
Getting started
Installation of the SER1CH-UA is straightforward. Here are the steps to follow:
2.1
Hardware installation
Connect the SER1CH-UA to the supplied wall transformer with the 2.1mm power connector. The green power LED on the top panel should light up. If not, make sure the wall
transformer has power. Then connect the RS232 DB9 on the SER1CH-UA back panel to
your PC with the supplied 6 ft cable. Make a note of which COM port you are using on
your computer. You will need to know the COM number when running the application
software.
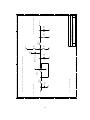
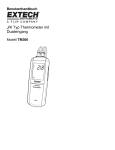
Analog connections are made to the three banana jacks on the top panel of the SER1CHUA. Reading from left to right, the jacks are (GND, VIN, VREF) with the colors (black,
red, red) as in Figure 2.1.
The middle red banana jack is the VIN analog input. All voltages are measured with respect
to GND, the black banana jack. When you are connecting an external voltage use the VIN
and GND banana jacks to connect the voltage, keeping in mind the GND jack is the same
as PC system ground.
The outer right red banana jack is the VREF output jack. Don’t connect the VREF jack
directly to ground. It is not fatal, but will draw unnecessary current.
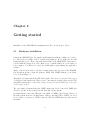
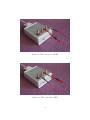
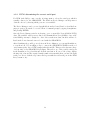
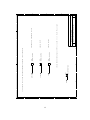
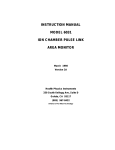
For initial testing connect the VIN jack to the GND or VREF to place known voltages on
the analog input as in the following figures. When connecting VIN to VREF, you don’t
need to make a connection to GND because the VIN and VREF share the same ground
internally.
8
Figure 2.1: VIN connected to VREF
Figure 2.2: VIN connected to GND
9
2.2
Software installation
Run the install.bat file on the CD. The directory /SR/SER1CH-UA will be created on your
hard disk and files will be copied there. No changes will be made to the operating system
registry or any other system files.
The SER1CH-UA does not require a device driver or device driver installation. Application
programs such as DvmGui.exe may be run as soon as the SER1CH-UA is connected to a
serial port and the SER1CH-UA is powered up.
To uninstall the software, simply delete the /SR/SER1CH-UA directory.
10
2.3
Do’s and Don’ts
• DO use the provided 9 vdc wall transformer or a 9 volt battery to power the system.
• DO use the system with RS232 ports that support RTS, DTR, and CTS.
• DO read the FAQ chapter for general questions regarding the SER1CH-UA.
• DO use the SER1CH-UA to measure positive voltages in the (0,5) volt range on the
red VIN banana jack with respect to the black GND banana jack.
• DON’T exceed 18 volts on the power supply. Excessive power supply voltages will
result in high power supply current drain.
• DON’T expect to make precision measurements with floating inputs. The analog
input VIN must be connected to a voltage source to make an accurate measurement.
VREF and GND are convenient voltages for initial testing.
• DON’T short circuit the VREF A/D reference output banana jack to the black GND
jack. The output is current limited so no damage will occur, however any current
sourced by VREF is ultimately provided by the SER1CH-UA power supply.
• DON’T use the SER1CH-UA to measure 110 vac or other high voltages. You will
damage the system and perhaps even your computer.
11
Chapter 3
Application Programs
The SER1CH-UA comes with two finished application programs, DVM and CAL. With
these programs, you can acquire data, display it on the screen, save it to disk, and calibrate
the system. Even for those planning to write their own custom software, running these
programs will help you quickly understand how the system works.
The DVM program displays its data on the screen in familiar digital voltmeter style with
large green readouts that are easy to see. Even though the SER1CH-UA has only one
channel, there are two readouts of the same data that can each be calibrated into different
display units. So, for example one readout could display sensor volts, while the other
displays physical sensor units. There is also a command line only version of DVM if you
don’t want the GUI display.
The CAL program is useful for gathering calibration coefficients for the DVM program.
Not only can it provide absolute calibration for the system, it can also easily calibrate into
physical units for the DVM readouts.
These programs can be found in subdirectories of /SR/SER1CH-UA. If you wish to
run with predefined configurations, there are shortcuts that can be double clicked to run
immediately. Further information about configuring and running these programs is given
in the following sections.
.
DVM
enhanced dual readout digital voltmeter
.
CAL
DVM calibration into volts and user units
12
3.1
DVM
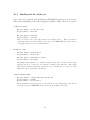
DVM is a program with a display and function much like a digital voltmeter. If instruments
such as Fluke meters are familiar, then you will find DVM easy to use.
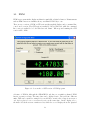
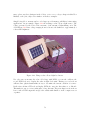
There are two versions of DVM, a GUI version with graphical display, and a command line
console mode version. The GUI version is available only for Windows, while the command
line version is available for both Windows and Linux. When up and running the GUI
version will look like:
Figure 3.1: Screen shot of GUI version of DVM program
A feature of DVM is although the SER1CH-UA only has one acquisition channel, DVM
has two separate readouts. The same data can be displayed twice, but scaled into different
units. This can be useful for example if you would like to monitor the voltage from a sensor
and display physical sensor measurement units at the same time. In the display above,
the first readout shows sensor units as volts, while the second display shows the physical
13
sensor reading, in this case an angle is shown as might occur with a potentiometer. Both
displays are generated from the raw A/D counts by applying a simple linear scale and offset
transformation.
A few DVM options can be specified on the GUI screen. For example, if the RunMode
Single radio button is selected, a single data sample will be acquired each time the Run
button is pressed. If Continuous is selected, DvmGui will acquire data at a 1Hz rate until
the Stop button is pressed.
Many other options can be specified in the DVM ini file. Both the GUI and command line
versions use the same ini syntax. For example, one ini option is to specify an output data
file. That way acquired values are displayed on the screen in real time and also saved to
disk. See the ASC output file section for more information about the format. Note that
while the output filename is displayed on the GUI screen for information, it is specified in
the ini file.
Besides saving data to disk, DVM can also record the time at which the each data sample
was acquired. The PC clock is used as a time source, and the timestamps can be saved in
a variety of formats. See the DVM: ini syntax section for the possible choices.
14
3.1.1
DVM: starting the program
Starting DVM is similar for either the GUI or text only console mode versions. From the
command line type:
cmd:prompt>
DvmGui parameters.ini
cmd:prompt>
DvmCmd parameters.ini
where the first is for the GUI display and the second for the text only display. The
parameters.ini file is optional. If not specified, DVM will start up with defaults. If you
want to run with custom parameters, they should be specified in the ini file. There is
nothing special about the ini filename, any filename may be used. In fact, having several
ini files for different setups can be very handy.
Several program shortcuts are also included in the DVM directory for quick starts. Double
click on them to execute. Copy the shortcuts to the desktop or start menu for easy access
if needed. You can also make multiple copies of the shortcuts and edit their properties to
run with different ini setups.
If no ini file is specified, DVM will create an ini file named DvmSetupDefault.ini containing
the default settings. Copy this file to a new name and modify it to have the settings you
prefer.
Once DvmGui.exe starts, its display window shows the RS232 serial port it will use. If
this port selection is not correct, select the serial port that the SER1CH-UA is connected
to from the pull down list, and click the Run button to begin acquiring data. You will
probably want to edit your ini file so the program starts up with the correct port in the
future. Also see the section determining the serial port for a discussion about how to choose
a valid serial port.
In the case of the DvmCmd.exe console version of the program, at startup it displays a
prompt showing the serial port it will use. If this is not correct, edit the ini file and try
again. Once the serial port selection is correct, press the ENTER key to begin acquiring
data.
15
3.1.2
DVM: determining the correct serial port
For DVM (and CAL) to run correctly, it is important to select the serial port which is
actually connected to the SER1CH-UA. The Windows Device Manager can help narrow
down the choices by showing which ports are even available.
The Device Manager can be accessed graphically from the Control Panel or from MyComputer properties. It can also be accessed from a command prompt by typing devmgmt.msc
and pressing ENTER.
Once the Device Manager window is showing, open or expand the Ports (COM & LPT1)
class. The available serial ports are listed as Communications Port (COMx). Some additional COM ports may be assigned to other devices such as modems, but these will not be
listed in the Ports class and can not be used with the SER1CH-UA.
After identifying the possible port selections in Device Manager, you can run DvmGui.exe
to test them out. Use an alligator clip to connect the SER1CH-UA VREF from the red
outer banana jack to the red VIN banana jack in the middle. This provides a known voltage
of about 4.96v to the SER1CH-UA A/D input. Then select one of the possible serial ports
in the DvmGui.exe dropdown list and click the run button. If you see the voltage display
showing 4.96 volts and the acquired sample number incrementing then you have the right
serial port. If not, click the stop button and repeat with the next serial port in the DVM
list you want to try.
16
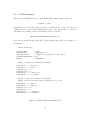
3.1.3
DVM: ini syntax
The layout of a DVM ini file is free format ASCII with a simple syntax of the form:
keyword = value
Comments are denoted with a semicolon, where everything from ; to the end of line is a
comment. Use text editors such as Windows Notepad or any other favorite to create and
edit ini files. For a listing of all the DVM ini keywords, see the file:
/SR/UsbXch/Dvm/DvmHelpIniSyntax.txt
Keywords not specified in the ini file will be given default values. Here is an example of a
short ini file:
; General parameters:
SerialPortName
OutputFileName
OutputFileComment
OutputFileShowTimeSec
RunMode
=
=
=
=
=
COM1
"DvmOutput.asc"
"Example ini showing volts and degrees"
ON
CONTINUOUS
; Display 0 format and calibration parameters:
DisplayTitle
DisplayUnits
DisplayPlaces
DisplayDigits
DisplaySlope
DisplayOffset
0
0
0
0
0
0
=
=
=
=
=
=
"Voltage"
"Volts"
9
5
2.98511e-007
-0.00119882
; Display 1 format and calibration parameters:
; Angular position with full range calibrated from 0 to 360.
DisplayTitle
DisplayUnits
DisplayPlaces
DisplayDigits
DisplaySlope
DisplayOffset
1
1
1
1
1
1
=
=
=
=
=
=
"Angle"
"Degrees"
6
2
2.16764e-005
-0.0536708
Figure 3.2: Sample DVM ini initialization file
17
For reference, the following table describes many of the DVM ini keywords. Also refer to
the help file DvmHelpIniSyntax.txt for the most current list.
DVM ini Keywords
Keyword
SerialPortName
Description
Values
Name of serial port to use
COM1, COM2,
COM3, COM4
File name in quotes
like ”DvmOutput.asc”
Descriptive comment
in quotes like ”Test 4”
ON, OFF
OutputFileName
Name of file for saved data
OutputFileComment
OutputFileShowTimeYmd
Arbitrary text to help identify the
saved data
Switch controlling whether
output file includes headers
Switch controlling whether
output file includes sample num
output time as seconds since
1970
Output time as YMDHMS
RunMode
Sampling mode
OutputFileShowHeader
OutputFileShowIndex
OutputFileShowTimeSec
ON, OFF
ON, OFF
ON, OFF
SINGLE,
CONTINUOUS
Keywords specific to display readout N = (0,1):
DisplayTitle
N
Title
String like ”Voltage”
DisplayUnits
N
Units
String like ”Volts”
DisplayPlaces
N
Total number of digits
Integer like 9
DisplayDigits
N
Digits after decimal point
Integer like 5
DisplaySlope
N
Calibration slope
Float like 7.27444e-007
DisplayOffset
N
Calibration offset
Float like 0.0000953873
Figure 3.3: DVM ini keyword table
18
3.1.4
DVM: calibrating the readouts
Now you should see the data acquired from the single SER1CH-UA channel being displayed
twice on the dialog box. These two displays represent the same data scaled into different
units. For example, the first display could show volts while the second display could show
user units such as inches or degrees or ounces or etc depending on the specific type of sensor
being used. Both displays are generated from the raw data, which comes in as A/D counts,
by applying a simple linear scale and offset transformation.
This transformation is really nothing more than using the familiar y = mx + b equation for
a straight line where the scale factor m and the offset b are controlled by user settable calibration parameters located in the DVM .ini initialization file. The easiest way to determine
the proper parameter values is to use the CAL program.
19
3.1.5
DVM: ASC output file format
Both the GUI and command line versions of DVM save their acquired data to ASCII output
files. Typically it is named DvmOutput.asc, but you can select the filename with the ini
keyword OutputFileName. Including summary header data can be controlled with the additional OutputFileShowHeader keyword. For importing into Excel, use OutputFileShowHeader=OFF to suppress the header text and include only the data values themselves.
DVM will not overwrite an existing .asc output file. So, if you’ve already run DVM once,
rename or delete any existing ASC output file before running DVM again. Changing the
ini keyword OutputFileName will also work and reloading the initializations will work.
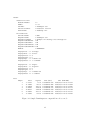
Now let’s see what some DVM .asc output files look like. The first sample output file was
created in verbose mode with all the optional outputs turned on. It has OutputFileShowHeader=ON so the header information is included and has OutputFileShowIndex=ON so
a extra column with the sample number is included. In addition, it has OutputFileShowTimeSec=ON and OutputFileShowTimeYmd=ON which add columns containing time as
seconds since 1970 and as year/month/day respectively.
The second sample DVM .asc output file was created in bare mode with all the optional
outputs turned off so only the data values are included. This mode makes it easy for the
file to be imported into analysis programs like Excel or MatLab.
20
Header:
General File Info:
HeaderFormatRev
DvmRev
FileName
FileCreationDate
IniFileName
=
=
=
=
=
2
2.01
"DvmOutput.asc"
2008/02/01 18:57:12
"DvmSetup.ini"
Ini Parameters:
SerialPortName
OutputFileName
OutputFileComment
OutputFileShowHeader
OutputFileShowIndex
OutputFileShowTimeSec
OutputFileShowTimeYmd
RunMode
=
=
=
=
=
=
=
=
COM1
"DvmOutput.asc"
"Example ini showing volts and degrees"
ON
ON
ON
ON
CONTINUOUS
DisplayTitle
DisplayUnits
DisplayPlaces
DisplayDigits
DisplaySlope
DisplayOffset
0
0
0
0
0
0
=
=
=
=
=
=
"Voltage"
"Volts"
9
5
2.98511e-007
-0.00119882
DisplayTitle
DisplayUnits
DisplayPlaces
DisplayDigits
DisplaySlope
DisplayOffset
1
1
1
1
1
1
=
=
=
=
=
=
"Angle"
"Degrees"
6
2
2.16764e-005
-0.0536708
Data:
Sample
1
2
3
4
5
6
7
Volts
-0.00021
+1.23895
+2.47836
+3.26040
+4.95701
+2.06543
+0.30847
Degrees
+0.02
+90.00
+180.00
+236.79
+359.99
+150.01
+22.43
Time (Sec)
1201892232.522
1201892233.684
1201892234.845
1201892236.007
1201892237.169
1201892238.330
1201892239.492
Time (YMD HMS)
2008/02/01 18:57:12.522
2008/02/01 18:57:13.684
2008/02/01 18:57:14.845
2008/02/01 18:57:16.007
2008/02/01 18:57:17.169
2008/02/01 18:57:18.330
2008/02/01 18:57:19.492
Figure 3.4: Sample DvmOutput.asc output file in verbose mode.
21
-0.00021
+1.23895
+2.47836
+3.26040
+4.95701
+2.06543
+0.30847
+0.02
+90.00
+180.00
+236.79
+359.99
+150.01
+22.43
Figure 3.5: Sample DvmOutputBare.asc output file in bare mode.
22
3.1.6
DVM: modifying the program
For those who are comfortable programming in C/C++ and want to modify DVM, this
section briefly discusses the organization of the provided source code files.
The files DvmLib.c and DvmLib.h contain the major portion of DVM, the part that is
shared between both the GUI and CMD versions. The files that start with DvmGui are
used for the GUI version and the file DvmCmd.c is used for the CMD version. Both versions
depend on the variables and functions defined in the DvmLib files.
Both DvmGui and DvmCmd can be built from the command prompt using the provided
Makefile. It accesses various settings and macros contained in the Compiler.mak file in the
/SR/SER1CH-UA/Lib directory and assumes that a batch file like vsvars.bat has been run
to set the compiler environment. The .sln and .vcproj files can be used to build DvmGui.exe
and DvmCmd.exe from inside the Visual Studio 2005 IDE.
Please refer to the comments inside the source code files themselves for more details.
23
3.2
CAL
To get the most accuracy from the DVM program described in section it is important to
calibrate the A/D. The CAL program makes this calibration easy. Like DVM, there are two
versions of CAL. CalCmd.exe is a console program that runs from the command line while
CalGui.exe is a Windows Graphical User Interface (GUI) program that uses the Microsoft
Foundation Classes (MFC) libraries.
Both versions of CAL read a preliminary set of control settings from a DVM initialization
file such as DvmSetup.ini in the Calibrate directory and output the calibrated version of
these settings into DvmSetupCal.ini. Don’t forget to copy DvmSetupCal.ini to the DVM
directory and rename it before running DVM again!
Running either version of CAL is simple. From Windows Explorer, double click on the
RunCalCmd or RunCalGui shortcut to start CalCmd.exe or CalGui.exe respectively. The
RunCalCmd shortcut first starts a command prompt and then runs CalCmd.exe. You
may also type in at a command prompt either program name followed by the name of
the .ini file you wish to use. If no .ini file is specified, CAL will output a .ini file named
DvmSetupDefault.ini containing the default settings. You should copy this file to a new
name, modify it to have the settings you prefer, and run CAL again with the new .ini file
name as a command line or shortcut argument.
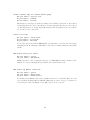
Both versions of CAL require that certain information is entered and that two known input
signals are presented to the SER1CH-UA for calibration measurements to be taken. The
required information includes the display title (eg voltage) and name of the units to be
used (eg volts), the value of one known input signal, and the value of a different known
input signal. Because DVM displays the acquired data in two ways (for example in volts
and in inches), appropriate calibration information is needed for both displays.
Once CalCmd.exe starts, it displays a prompt showing the serial port it will use. If this is
not correct, please quit, edit the .ini file and try again. Also, see the section Selecting the
serial port for a discussion about how to choose a valid serial port.
Once the serial port selection is correct and you are ready to continue, CalCmd prompts
you to enter the required calibration information starting with the display titles and units.
Then apply a known input signal to the SER1CH-UA, enter its value and press a key to
measure it. Repeat this for a second known input signal. CalCmd then computes the
calibration results and outputs them to the DvmSetupCal.ini file.
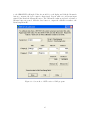
Once CalGui.exe starts, it displays a dialog box showing the default serial port specified in
the .ini file. If this is not correct, use the serial port dropdown list box to select the serial
port that is connected to the SER1CH-UA.
CalGui provides you with text boxes for entering the required calibration information like
the display titles and units. To perform the actual calibration, apply a known input signal
24
to the SER1CH-UA, fill in the Value A text field for each display and click the MeasureA
button to measure the A/D counts for that signal. Repeat with a second known input
signal, Value B and the MeasureB button. The calibration results are updated each time a
Measure button is pressed. Click the Save button to output the calibration results to the
DvmSetupCal.ini file.
Figure 3.6: Screen shot of GUI version of CAL program
25
3.2.1
CAL: starting the program
Starting CAL is similar for either the GUI or text only versions. From the command line
type:
cmd:prompt>
DvmGui parameters.ini
cmd:prompt>
DvmCmd parameters.ini
where the first is for the GUI display and the second for the text only display. The
parameters.ini file is optional. If not specified, DVM will start up with defaults. If you
want to run with custom parameters, they should be specified in the ini file. There is
nothing special about the ini filename, any filename may be used. In fact, having several
ini files for different setups can be very handy.
Several program shortcuts are also included in the DVM directory. Double click on them
to execute. Copy the shortcuts to the desktop or start menu for easy access if needed.
You can also make multiple copies of the shortcuts and edit their properties to run with
different ini setups.
OLD TEXT REGARDING RUNNING . . .
If no parameters.ini file is specified, DVM will create an ini file named DvmSetupDefault.ini
containing the default settings. Copy this file to a new name and modify it to have the
settings you prefer.
Once DvmCmd.exe starts, it displays a prompt showing the serial port it will use. If this
is not correct, edit the .ini file and try again. Also, see the Selecting the serial port section
for a discussion about how to choose a valid serial port. Once the serial port selection is
correct, press the ENTER key to begin acquiring data.
Once DvmGui.exe starts, it displays a dialog box showing the default serial port specified
in the .ini file. If this is not correct, use the serial port dropdown list box to select the serial
port that is connected to the SER1CH-UA. Then click the run button to begin acquiring
data.
26
3.2.2
CAL: modifying the program
For those who want to modify CAL and are comfortable programming in C/C++, this
section reviews the organization of its source code files.
The files CalLib.c and DvmLib.c are both required to build CAL. The files that start with
CalGui.cpp and CalCmd.c are the additional user interface source for the GUI and CMD
versions of the programs. Both versions depend on the variables and functions defined in
the CalLib and DvmLib files.
Both CalGui.exe and CalCmd.exe can be built from the command prompt using the provided Makefile. It accesses various settings and macros contained in the Compiler.mak file
in the /SR/SER1CH-UA/Lib directory and assumes that a batch file like vsvars.bat has
been run to set the compiler environment. The .sln and .vcproj files can be used to build
CalGui.exe and CalCmd.exe from inside the Visual Studio 2005 IDE.
Please refer to the comments in the source code files themselves for more details.
27
3.2.3
CAL: determining the correct serial port
For DVM and CAL to run correctly, it is important to select the serial port which is actually
connected to the SER1CH-UA. The Windows Device Manager can help narrow down the
choices by showing which ports are even available.
The Device Manager can be accessed graphically from the Control Panel or from MyComputer properties. It can also be accessed from a command prompt by typing devmgmt.msc
and pressing ENTER.
Once the Device Manager window is showing, open or expand the Ports (COM & LPT1)
class. The available serial ports are listed as Communications Port (COMx). Some additional COM ports may be assigned to other devices such as modems, but these will not be
listed in the Ports class and can not be used with the SER1CH-UA.
Now that the possible serial ports have been identified, you can run DvmGui to test them
out. Using the provided alligator clip cables, connect VREF from the red outer banana
jack to VIN on the red middle banana jack. This provides a known voltage of about 4.96v
to the A/D inputs.
Select one of the possible serial ports in the DvmGui dropdown list and click the run
button. If you see the sample number incrementing and the voltage display showing 4.96
volts you have the right serial port. If not, click the stop button and repeat with the next
serial port you want to try.
28
Chapter 4
User C Library
Besides finished applications like DVM and CAL, the SER1CH-UA comes with a function
library for users writing their own programs. These functions can be statically linked to C
programs, or called as a Dynamic Link Library (DLL) under Windows and a shared library
(.so) under Linux.
The library is written in C, but can be called from languages such as Visual Basic and
LabView as long as C calling conventions are followed. The methods for calling DLL
functions are specific to each language and typically require declarations describing the
parameters being passed. Check your language documentation for details.
The typical sequence of calls to use the library is simple: First call Open to initialize the
COM serial port and A/D. Then call GetData each time you want a new A/D sample,
followed by ScaleData if you want to convert the A/D counts to volts or other units. Finally,
when finished, call Close to free the COM port for other programs.
Be sure to include the header file Ser1ch.h in any C source code using the library. This
file contains prototypes and defined constants that can help make your program more
maintainable and readable. When using dynamic linking, make sure the Ser1ch.dll library
is on your Windows execution path so it can be found at runtime. Under Linux the shared
library libser1ch.so should be on the LD LIBRARY path.
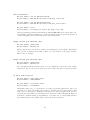
The table on the following page summarizes the SER1CH-UA library functions and their
parameters. Each function is also described in more detail in the following sections, along
with a code fragment to show typical calls from C.
29
SER1CH-UA Library Function Summary
Function/Parm
IO
Type (#bits)
Description
Ser1chOpen
return
SerialPortNumber
Error
O
I
O
DEVHANDLE (32)
integer (32)
pointer to integer (32)
Open the serial port and initialize A/D
= BAD DEVHANDLE on failure
Serial port number 1=COM1, 2=COM2, . . .
Detailed error code
Ser1chGetData
return
Ser1chHandle
DataCounts
TimeSecSince1970
Error
O
I
O
O
O
integer (32)
DEVHANDLE (32)
pointer to integer (32)
pointer to double (64)
pointer to integer (32)
Read a data point and the PC time
1 for success, 0 for failure
Handle to SER1CH-UA serial port
Data point as raw A/D counts
PC time of data point as seconds since 1970
Detailed error code
Ser1chScaleData
return
DataCounts
Slope
Offset
ScaledData
Error
O
I
I
I
O
O
integer (32)
pointer to integer (32)
floating point double (64)
floating point double (64)
pointer to double (64)
pointer to integer (32)
Scale data point counts to other units
1 for success, 0 for failure
Data point as raw A/D counts
Slope of scaling formula
Offset of scaling formula
Data point scaled to other units
Detailed error code
Ser1chErrorMsg
return
Error
O
I
pointer to char (8)
integer (32)
Get string associated with error code
Null terminated C-style string
Detailed error code
Ser1chClose
return
Ser1chHandle
Error
O
I
O
integer (32)
DEVHANDLE (32)
pointer to integer (32)
Close the serial port and A/D
1 for success, 0 for failure
Handle to SER1CH-UA serial port
Detailed error code
Figure 4.1: Ser1ch library function table
In addition to standard data types like integer and pointers to integers, the table also lists
DEVHANDLE. This special data type is defined in SrHelper.h and varies depending on
OS. Under Windows it is a (void *) and is equivalent to the Windows HANDLE type.
Under Linux it is an integer. In both cases, the size is 32 bits and the parameter refers to
an open file handle which gives the OS a shorthand way to refer to the device.
30
4.1
Open device
C usage:
#include "Ser1ch.h"
DEVHANDLE Ser1chOpen( int SerialPortNumber, int *Error );
The Open function opens and initializes the specified COM serial port and SER1CH-UA
A/D. It should be the first library function called.
The first argument passed to Open is an integer from 1 to 9 that specifies the serial port
to use. A value of 1 corresponds to COM1 under Windows or /dev/ttyS0 under Linux.
2 selects COM2, etc. You may want to check the Device Manager under Windows to see
which COM ports are available on your machine as described in section ?? on page ??.
The second argument is a pointer to an integer that will be filled with an error code giving
some detail about the failure if one occurs. An error code of 0 means the open succeeded.
This argument is optional and will be ignored and not filled in if you pass Error = NULL.
See Ser1ch.h for a list of the possible error codes. Or, use the ErrorMsg function to get the
message string associated with the integer error number.
Open returns a file handle to the open serial port in the form of a specially defined data
type called a DEVHANDLE. Under Windows this is a (void *) and is equivalent to the
Windows HANDLE type. Under Linux it is an integer. In both cases, the size is 32 bits
and this file handle provides a shorthand way for the OS to access the selected serial port.
If Open fails, the return value is BAD DEVHANDLE which is defined as -1.
Note that under Linux, Open will fail if you don’t have read permission on the selected serial
port. Type the command ls -l /dev/ttyS0 to see the current permissions on COM1. The
two easiest ways to add read permission for yourself are to join the group such as uucp or
nut that owns the COM port or to type the command chmod o+r /dev/ttyS0 as root to
add world read permission to the COM port.
31
4.2
Read data
C usage:
#include "Ser1ch.h"
int Ser1chGetData( DEVHANDLE Ser1chHandle,
long *DataCounts,
double *TimeSecSince1970,
int *Error );
Once you have successfully called Open to open and initialize the serial port, you can call
GetData to read in a data point as raw A/D counts.
GetData returns 1 for success and 0 for failure. It also takes an optional Error argument
for returning more detailed information when a failure occurs. See Ser1ch.h for a list of
the possible error codes, or use the ErrorMsg function to get the message string associated
with the error number.
The first argument to GetData is the DEVHANDLE returned by Open containing a file
handle to the open serial port. GetData uses this handle when deciding which serial port
to read.
The DataCounts argument to GetData should be a pointer to a 32 bit long integer. The
integer will be filled in with the A/D count value. The 24 bit A/D count is stored as a 32
bit integer with the top 8 bits always 0.
The optional TimeSecSince1970 argument returns the time when the A/D conversion occurred. Pass a NULL pointer if you wish to ignore this parameter. When used, the PC
clock time as seconds since 1970 of when the A/D conversion occurred will be returned.
This value can be converted into the more common year/month/day hour:minute:second
format with the SrSecTimeSplit function from SrHelper.c or with the standard C runtime
function gmtime.
32
4.3
Scale data
C usage:
#include "Ser1ch.h"
int Ser1chScaleData( long DataCounts,
double Slope,
double Offset,
double *DataScaled,
int *Error );
Once you have read a data sample in with GetData, you can use the function ScaleData
to convert its raw A/D counts to other units such as volts or inches. ScaleData returns 1
for success and 0 for failure. It also takes an optional Error argument for returning more
detailed information when a failure occurs. See Ser1ch.h for a list of the possible error
codes, or use the ErrorMsg function to get the message string associated with the error
number.
The first argument to ScaleData, DataCounts, is a 32 bit integer containing the A/D counts
returned by GetData. The 24 bit A/D count is stored as a 32 bit integer with the top 8
bits always 0 ????
The second and third arguments, Slope and Offset, are 8 byte floating point doubles that are
used to linearly convert from raw A/D counts to some other units such as volts. The scaled
result is returned in the 8 byte floating point double parameter pointed to by DataScaled.
Converting from A/D counts to converted scaled data is done using the slope and offset
formula for a straight line:
DataScaled = Slope · DataCounts + Offset
(4.1)
It is easy to compute the slope and offset from the information generated by the CAL
programs. Use CAL to measure the A/D counts for two known values of A/D input. Often
the input will be specified in terms of volts, but it can be in other units such as degrees
or inches too. This results in two (DataCounts,DataScaled) pairs, (C1, S1) and (C2, S2).
These two calibration points for the straight line equation (4.1) then imply that:
Slope = (S2 − S1)/(C2 − C1)
Offset = (S1 − Slope · C1)
33
The CAL programs do this computation and save the resulting slope and offset values in the
generated .ini file DvmSetupCal.ini. Use these values as inputs to the ScaleData function.
Note that systematic offsets, such as potentiometer offsets and op amp Vio errors, can be
removed by specifing S1 = 0 when calibrating. Software offset correction is a powerful
alternative to hardware trimming.
For the SER1CH-UA, the A/D counts always range from 0x00000000 to 0x00FFFFFF,
(0 to 16,777,215 decimal), and the input voltages at which these count values occur are
approximately 0 and 4.96 volts. Using these values, the slope in volts/count should always
be approximately 4.96/16777215 = 2.96e-7. The offset should always be approximately 0
because zero input volts maps approximately into 0 counts. Even if you don’t have exact
calibration numbers for a specific SER1CH-UA, you can still get reasonably good results
for voltage calibration by using the approximate slope and offset numbers:
Slope ≈ 2.96e-7 volts/count
Offset ≈ 0.0 volts
34
4.4
Get error message string
C usage:
#include "Ser1ch.h"
char *Ser1chErrorMsg( int Error );
The ErrorMsg function takes an error number as input and returns a pointer to a null
terminated string containing the corresponding message text.
Also see the C include file Ser1ch.h and source file Ser1ch.c for a listing of the error numbers
and corresponding strings.
35
4.5
Close device
C usage:
#include "Ser1ch.h"
int Ser1chClose( DEVHANDLE Ser1chHandle, int *Error );
The Close function closes the COM serial port. It should be the last library function called.
Close returns 1 for success and 0 for failure.
The first argument to Close is the DEVHANDLE returned from the Open function. This
is a 32 bit value representing a file handle to the open serial port. Under Windows it is
equivalent to the Windows HANDLE type.
The second argument is a pointer to an integer that will be filled with an error code giving
more detail than the simple (0,1) function return value. This argument is optional and will
be ignored if you pass a NULL pointer. See Ser1ch.h for a list of the possible error codes.
Or, use the ErrorMsg function to get the message string associated with the integer error
number.
36
4.6
Code example
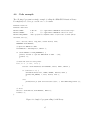
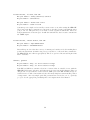
The following C program is a simple example of calling the SER1CH-UA function library.
For simplicity it does not process the error code returns.
#include <stdio.h>
#include "Ser1ch.h"
#define SLOPE
#define OFFSET
#define FMT_STRING
2.96e-7F
// < approximate SER1CH-UA volts/count slope
0.0F
// < approximate SER1CH-UA offset in volts
"Data pt %02d is 0x%08lX counts or %lf volts at Time %lf\n"
int main( void ) {
int i, Success, Error; long Data; double Scaled, Time;
DEVHANDLE Ser1chHandle;
// Open the SER1CH on COM1.
Ser1chHandle = Ser1chOpen( 1, &Error );
if ( Ser1chHandle == BAD_DEVHANDLE ) {
printf( "Failed to open the SER1CH-UA on COM1 ...\n");
return( 1 );
}
// Read and scale 50 data points.
for ( i = 0 ; i < 50 ; i++ ) {
Success = Ser1chGetData( Ser1chHandle, &Data, &Time, &Error );
if ( Success == 1 ) {
Ser1chScaleData( Data, SLOPE, OFFSET, &Scaled, NULL );
printf( FMT_STRING, i, Data, Scaled, Time );
}
else
printf("Data pt %02d failed because %s\n", i, Ser1chErrorMsg( Error ) );
}
// Close.
Success = Ser1chClose( Ser1chHandle, &Error );
return( 0 );
}
Figure 4.2: Sample C program calling Ser1ch library
37
Chapter 5
Sigma Delta A/D converters
Review that sigma delta A/D converters achieve their resolution by oversampling and
averaging down and the boxcar averages result in a sinc response.
5.1
Sampling rate
Currently the sampling is set at 1Hz by a timer tick running on the PC.
The user has no control over the internal oversampling rate used in the LTC2400. It is
nominally 7Hz, where this frequency is not crystal controlled and is set only by internal
RC components inside the chip.
Furthermore, the LTC2400 has a relatively low oversampling rate, resulting in poorer resolution than other 24 bit A/D converters which have higher oversampling.
However, in return you get much lower power consumption. Compare the power usage and
resolution with an A/D such as the LTC2440 series or ADS1255.
5.2
50/60Hz power line rejection
Because of their internal oversampling and digital filtering, sigma delta converters such as
the LTC2400 used in the SER1CH-UA are capable of excellent power line noise rejection.
The internal sampling rate of the SER1CH-UA LTC2400 is automatically set to place the
first notch of the sigma delta digital filter at 60Hz. International users may change the
oversampling rate to place the first notch at 50Hz.
Review that the power line noise rejection is typically greater than 120 dB.
38
Chapter 6
Analog DC calibration
The physical quantity measured by the SER1CH-UA is voltage, with its A/D converter
returning a count proportional to the input voltage. When the input voltage is low, a low
count value is returned, and as the input voltage increases the count value increases.
The exact relationship between a particular input voltage and the A/D counts is referred
to as the DC calibration. It is well approximated by a straight line with a slope and offset.
Performing a calibration requires measuring the slope and offset so application software
can convert counts into volts.
As shipped, the SER1CH-UA software is only approximately calibrated. Programs such as
DVM have a typical slope and offset in their ini files. These values are reasonably good,
but for highest accuracy, each SER1CH-UA must be calibrated on site by the user. The
following sections cover the calculations involved with DC calibration. For an easy to use
calibration program see the DVM CAL program.
To perform an absolute calibration requires either a precision voltage reference, or a precision voltmeter. Reference standards such as the Symmetric Research VREF-399 are
suitable calibration tools. You can also use less stable voltage sources if you have an
independent precision voltmeter such as an HP34401 to monitor the source with.
39
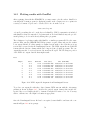
6.1
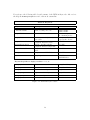
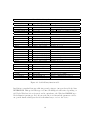
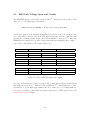
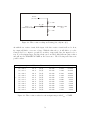
Full Scale Voltage Span and Counts
The SER1CH-UA has a 24 bit A/D converter with 224 counts spread out evenly over the
entire 0 to +5 volt input span of the system:
TOTAL 24 BIT A/D COUNTS = 2**24 = 16,777,216 (decimal)
Counts are returned by the GetData library function as 32 bit integers. For 0 input volts,
zero counts will be returned, and as the VIN input voltage increases the count value will
also increase. Counting upward from 0 volts to the maximum +5, there are 224 counts. The
SER1CH-UA is a single ended positive voltage system always returning postive counts.
Some of the count values for other input voltages are:
+ VIN (volts)
+5
+5-e
···
+e
0
-e
···
-4
0
0-e
GND (volts)
Counts (hex)
Counts (decimal)
0
0
0x00 FFFFFF
0x00 FFFFFE
16,777,216
16,777,215
0
0
0
0x00 000001
0x00 000000
0xFF FFFFFF
0,000,001
0,000,000
-0,000,001
0
0
0
0xFF C00000
0x00 000000
0xFF FFFFFF
-4,194,304
00,000,000
-00,000,001
Figure 6.1: A/D counts with single ended input
Of course, in actual practice resistor tolerances and op amp offsets will prevent the system
from achieving a perfect zero counts at 0 volts, and likewise 224 counts at full scale +5 volts.
Nevertheless, to a reasonable approximation the above values are good working numbers.
If you need to measure voltages that are negative with respect to GND, please refer to the
Scaling sensor voltages chapter.
40
6.2
Approximate counts per volt
With the total counts and the 16 volt span of the previous section in hand, the theoretical
counts per volt for the USB4CH is:
Counts per Volt = (2**24)/16 =
1,048,576 counts / volt
or equivalently,
Counts per Millivolt = 1,049 counts / millivolt
Counts per Microvolt = 1.0 count / microvolt
where the last two values are rounded. Of course the volts per count is just the inverse:
Volts per Count = 16/(2**24) =
1.0 microvolts / count
Note that because the A/D converters have noise floors greater than 24 bits, the resolution
implied by these numbers may not be fully usable. For example, at a sampling rate of 100
Hz, the system has a noise free repeatable count value of 20 bits. There are four bits, or
(2**4) * 1.0 = 16 microvolts, of noise. You may prefer to work in 20 bit counts and 16
microvolts per count for your calculations at that sampling rate.
The input voltage span depends on the gain setting of the front end op amps. The above
calculation assumes a gain of 1 on those amplifiers. By changing resistors on the board it
is possible to run the amplifiers with gains of 1 to 100 with no increase in the noise floor.
This is discussed in the Analog inputs chapter. The full scale input range will be smaller
with added gain, but the counts per volt will be more sensitive.
We do not recommend using the ADS1255 PGA feature to increase the counts per volt. As
with most sigma delta A/D converters claiming to have a PGA, the ADS1255 implements
this function by changing the effective oversampling. When doing this the noise floor
increases in direct proportion. This is in contrast to changing the gain of the USB4CH op
amps, where the gain can be increased without corresponding noise floor increases.
41
6.3
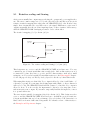
Calibration slope and offset
For the general differential DC transfer function in the Analog inputs chapter,
A/D counts = slope * (V+ - V-) + offset
applied to a theoretically perfect USB4CH, the slope is the A/D counts per volt as in the
previous section and the offset is zero. So the equation becomes:
A/D counts = 1,048,576 * (V+ - V-)
For most applications the calibration equation is actually used the other way around: given
the A/D counts one wants to compute the corresponding voltage. The DVM program is
one example. Given the A/D counts, we have:
(V+ - V-) = 9.53674e-007 * A/D counts
9.53674e-007 = 1/1,048,576
and the slope and offset would be entered into the DVM ini file as:
ChannelSlope x = 9.53674e-007
ChannelOffset x = 0
; = ( 1/1,048,576 )
The ini files shipped with DVM for voltage display use these theoretically perfect values. Of
course, physical components are never perfect and the true slope and offset will be slightly
different from this ideal. For an exact calibration of any particular USB4CH channel, you
should perform a physical calibration with the DVM Calibrate program. Note that besides
calibration into volts, it is possible to calibrate A/D counts into other physical quantities
such as temperature. The slope and offset can include the sensor response too.
The major contribution to offset error on USB4CH boards is the Vio input offset voltage
of the front end op amps. No op amp is ideal, and the Vio parameter measures what input
voltage may actually be required to zero the output. For the OPA2277 amps used on the
USB4CH Vio is +/- 50 microvolts max. See the TI spec sheet for this Vio specification,
as well as other details such as TC temperature variation. The following graph shows the
offset spreads measured on 10 USB4CH boards for a total of 40 channels at 25 ◦ C:
42
include graph here
Figure 6.2: Production input offset spreads
43
Chapter 7
Analog Resolution
This chapter covers the analog resolution of the SER1CH-UA. The term resolution has
many meanings and can cause a great deal of debate. Superficially one could say the
LTC2400 A/D converter used in the system is a 24 bit converter, and since it returns 24
bit integers, it has 24 bit resolution. Furthermore, if you know the input voltage span, you
can compute the number of A/D counts per volt and have one measure of the resolution.
See the Analog DC calibration chapter for a discussion of the counts per volt for the
SER1CH-UA.
However, simply knowing the number of counts per volt does not give a complete picture
of the system performance. The noise floor and stability of the conversions are equally
important measures of the accuracy which will occur in real life applications.
The graphs and statistics given in the following sections should give an idea of the actual
results possible with the SER1CH-UA.
44
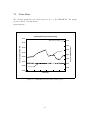
7.1
Noise floor
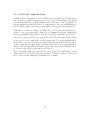
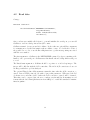
The following graphs show the short term noise floor of the SER1CH-UA. The graphs
present a variety of measurements.
Work underway . . .
Full Day Measuring Constant Voltage
4.94940
SER1CH-UA as ref voltage
VREF-399 as ref voltage
2.98940
4.94920
4.94900
2.98900
VREF-399
4.94880
2.98880
4.94860
2.98860
4.94840
2.98840
4.94820
SER1CH-UA
2.98820
4.94800
04:00:00
08:00:00
12:00:00
16:00:00
20:00:00
00:00:00
UTC Time
Figure 7.1: SER1CH-UA long term resolution plot
45
Volts for VREF-399 Ref
Volts for SER1CH-UA Ref
2.98920
7.2
Thermal drift
When making measurments over long time periods, thermal drift can become a problem.
The graphs in this section present a number of results for the thermal drift of the system.
Work underway . . .
include graph here
Figure 7.2: Thermal drift plot
For effective ways to battle back against thermal drift, see the Ratiometric measurements
chapter. The performance of ratiometric techniques is impressive and will greatly reduce
thermal drift problems.
46
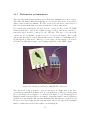
Chapter 8
Ratiometric measurements
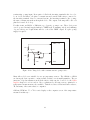
When working with passive sensors, one of the best ways to use the SER1CH-UA is to
make a ratiometric measurement. Such measurements are easy to set up and have the
added benefit of excellent TC thermal performance. The classic ratiometric sensor is a
potentiometer, and this section will use it as an example. For applications such as active
sensors, where ratiometric techniques may not be possible, the Scaling sensor voltages
chapter has interfacing methods which may be helpful.
The ratiometric concept is simple. All A/D converters use a reference voltage to set their full
scale range. Voltages less than full scale are compared with the reference and a proportional
number of counts returned. If measurements can be arranged so the A/D reference is also
used to excite the passive sensor, then the sensor and A/D response will both scale in
the same way. With this technique, measurements become insensitive to variations in the
reference voltage or sensor excitation, yielding excellent results.
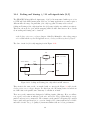
Let’s use a few equations to see how ratiometric methods work. A/D converters accept an
analog input voltage and produce a digital output count. The converter determines the
output by comparing the input against a reference voltage. Denoting the A/D reference
voltage by Vref one might write:
ADcounts = ( Vin / Vref ) · ADF ullScaleCounts
(8.1)
where the ADF ullScaleCounts is fixed by the architecture of the converter. In the case of a
24 bit converter, the full scale counts might be 0xFFFFFF, and an input voltage that is
half of the reference would return 0x7FFFFF.
For most systems, the Vref reference voltage is generated by a component separate from
the A/D converter. In the case of the SER1CH-UA the reference is a 2.5 volt LM4040A
bandgap device. This part has a typical 15 ppm/◦ C thermal variation, and so the reference
voltage may vary by (15 · 10−6 ) · 2.5 volts = 37.5 microvolts/◦ C. Equation (8.1) makes
47
it clear that changes in Vref will affect the output counts as much as Vin , however we will
see that with ratiometric methods the TC spec will hardly even matter. As a specific
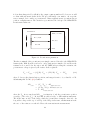
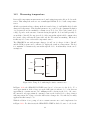
sensor example, let’s consider a potentiometer. Many applications use potentiometers as
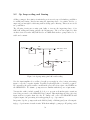
position or angular sensors. The circuit for a potentiometer hooked up to the SER1CH-UA
in ratiometric fashion is:
Potentiometer
VREF (+5 volts)
R
VIN (0,5)
Rb = PR
SER1CH-UA
Ra = (1-P)R
GND
Figure 8.1: Potentiometer parameters
The three terminals of the potentiometer are simply connected directly to the SER1CH-UA
banana jacks. With R as the total end to end potentiometer resistance, Ra and Rb as the
resistances above and below the wiper, and the VREF jack providing the excitation, the
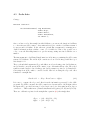
potentiometer voltage is given by the resistor divider equation:
Vin = Vwiper = ( Rb /R ) · Vref = ( P R / R ) · Vref = P Vref
(8.2)
where P denotes the physical wiper position, and ranges from 0 to 1, so that Rb = P R.
Substituting this Vin into (8.1) results in:
ADcounts = ( Vin / Vref ) · ADF ullScaleCounts
= ( P Vref / Vref ) · ADF ullScaleCounts
= P · ADF ullScaleCounts
where the Vref factor cancels and ADcounts is a function of only the potentiometer position
regardless of the value Vref ! In fact, this is really a bridge or differential measurement.
The A/D forms one side of the bridge, while the potentiometer forms the other side. As
long as the voltage at the top of each leg of the bridge is the same, all that matters is the
the ratio of the resistors on each side. Hence the term ratiometric measurement.
48
For the SER1CH-UA, a buffered copy of the A/D reference voltage is provided on the VREF
banana jack. The VREF jack is capable of supplying 10ma, so keep the potentiometer end
to end resistance greater than 500 ohms to avoid drawing too much current. A 10K pot is
often ideal. The SER1CH-UA analog input has an input impedance of 10M ohms so the
potentiometer wiper will not be significantly loaded by VIN. For a hands on demonstration
using a 10 turn potentiometer in ratiometric fashion see the Ratiometric potentiometer in
the Examples and Experiments chapter.
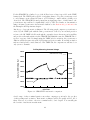
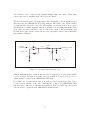
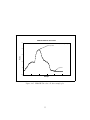
Just how good are ratiometric techniques? The following graph compares a potentiometer
excited by the VREF jack with the same potentiometer excited by an external precision
reference, the SR VREF-399. Even though the external reference has near perfect stability
and precision, thermal variation in the SER1CH-UA LM4040A cause the SER1CH-UA response to appear to drift. By simply using the VREF jack for excitation, the potentiometer
drifts in exactly the same way as the A/D giving near perfect results. If external excitation
such as a battery had been used instead of the VREF-399, the comparison would have been
only yet more dramatic.
Full Day Measuring Constant Voltage
4.94940
SER1CH-UA as ref voltage
VREF-399 as ref voltage
2.98940
4.94920
4.94900
2.98900
VREF-399
4.94880
2.98880
4.94860
2.98860
4.94840
Volts for VREF-399 Ref
Volts for SER1CH-UA Ref
2.98920
2.98840
4.94820
SER1CH-UA
2.98820
4.94800
04:00:00
08:00:00
12:00:00
16:00:00
20:00:00
00:00:00
UTC Time
Figure 8.2: SER1CH-UA ratiometric comparison
A wide range of three terminal passive sensors have outputs proportional to the product
of their settings and excitation. Ratiometric techniques will work equally well for all of
them. However, if you have only a two terminal sensor, don’t despair. You can still gain
the benefits of ratiometric measurement.
49
Work underway . . .
50
Chapter 9
Scaling sensor voltages
The full scale input range of the SER1CH-UA is 0 to +5 volts. If you have an active sensor
with a different range, even including negative voltages, you can use scaling and biasing to
map its output to be compatible with the SER1CH-UA (0,5) range.
Scaling and biasing is usually not required for passive sensors. Passive sensors such as
potentiometers typically have their full scale output range set by their excitation voltage.
If the excitation is supplied by the SER1CH-UA VREF, a full scale sensor range of (0,5)
results naturally with no scaling or biasing required. Such techniques are covered in the
Ratiometric measurements chapter, and also have excellent TC thermal performance.
Active sensors on the other hand usually include op amps in their design. They require
an independent power supply and commonly have a output range of (-5,+5) or (-10,+10)
volts. When working with these types of sensors, it is desirable to scale and bias their full
range into the SER1CH-UA (0,5) so none of the 24 bit A/D span is lost.
A few of the more popular circuits for mapping active sensor ranges are reviewed in this
chapter. In many cases, precision low noise mapping can be done with a few resistors, while
for applications requiring gain an op amp may be required. For additional information you
may also find the following useful:
• the Examples and Experiments chapter for a hands on (-10,+10) demo
• the SR paper, Scaling and Biasing Analog Signals for theory
SR papers and app notes can be found on the web at: www.symres.com
The following sections give a quick review of the techniques
51
9.1
Resistive scaling and biasing
Active sensors usually have output ranges reflecting the op amps and power supplies they
use. The most common ranges are (-5,+5) and (-10,+10) volts, and this section reviews
resistive circuits for mapping these ranges into the SER1CH-UA (0,5) volts. Besides being
simple, these circuits introduce very little noise to the signal. Furthermore, active sensor
outputs can usually drive the moderate input impedance of these circuits to full accuracy,
while the SER1CH-UA 10M ohm input presents no load to them either.
The circuit for mapping (-5,+5) volts into (0,5) is:
Vsensor
(-5,+5)
A = 10K
SER1CH-UA VIN
(0,5)
B = 10K
Vbias = +5
( SER1CH-UA VREF )
Figure 9.1: Two resistor scaling and biasing (-5,+5) into (0,5)
This design uses two resistors and the SER1CH-UA VREF as its bias source. For easy
construction, use 1/4 watt metal film resistors with leads. Carbon film resistors are not
recommended because they have poor noise and TC characteristics, with only a small
savings in cost. For vendors carrying 1% metal film resistors, see the Extra supplies chapter.
See the SR paper Scaling and Biasing Analog Signals for the theory behind this circuit.
When using this circuit, note that if the Vsensor input is allowed to float, it will drift to +5
volts and not ground. If you measure the floating input with a Fluke or other voltmeter it
will read +5 volts. The SER1CH-UA itself will also return +5 volts if the Vsensor input is
allowed to float. To work correctly, the input must be driven by a low impedance source
such as an active sensor output. If you want to temporarily hardwire the input low, connect
it to ground with a wire.
The next circuit is suitable for mapping (-10,+10) volts into (0,5). This design uses three
resistors and the SER1CH-UA VREF as its bias source. As with the previous circuit, use
1/4 watt metal film resistors for best performance. If you don’t have a 5K ohm resistor on
hand, build one from two 10K resistors in parallel. For a hands on demo of this circuit, see
the Examples and Experiments chapter.
52
Vsensor
(-10,+10)
A = 10K
B = 5K
SER1CH-UA VIN
(0,5)
Vbias = +5
( SER1CH-UA VREF )
C = 10K
Figure 9.2: Three resistor scaling and biasing (-10,+10) into (0,5)
As with the two resistor circuit, if the input of the three resistor circuit is allowed to float,
its output will drift to a non zero voltage. With the values above, it will drift to 3.3 volts.
Connect the Vsensor input to ground if you wish to temporarily drive the input low for a
test. For other input ranges, the this circuit can be modified with different resistor values
and still use the SER1CH-UA VREF as the bias source. The following table lists some
possible values:
Bipolar input
(+/-)
(+/-)
(+/-)
(+/-)
?
(+/-)
(+/-)
(+/-)
(+/-)
(+/-)
(+/-)
(+/-)
06.0
07.0
08.0
09.0
10.0
11.0
12.0
14.0
16.0
18.0
20.0
∆Vin
Vout
A(Kohm)
B(Kohm)
C(Kohm)
12.0
14.0
16.0
18.0
20.0
22.0
24.0
28.0
32.0
36.0
40.0
(0,5)
(0,5)
(0,5)
(0,5)
(0,5)
(0,5)
(0,5)
(0,5)
(0,5)
(0,5)
(0,5)
10.000
10.000
10.000
10.000
10.000
10.000
10.000
10.000
10.000
10.000
10.000
8.333
7.143
6.250
5.556
5.000
4.545
4.167
3.571
3.125
2.778
2.500
50.000
25.000
16.667
12.500
10.000
8.333
7.143
5.556
4.545
3.846
3.333
Figure 9.3: Three resistor values for various input ranges with Vbias = VREF
53
9.2
Op Amp scaling and biasing
Adding op amps to the resistive circuits in the previous section provides further possibilities
for scaling and biasing. Besides increasing the input impedance of a resistive divider, op
amps can perform signal conditioning such as adding gain or filtering. This section reviews
two possibilities.
The following circuit uses a unity gain buffer to increase the input impedance of its
10K/3.3K scaling and biasing pair into the Mohm range. The 3.3v bias required for this
circuit is derived from the 10K/20K divider on VREF which is then op amp buffered to be
stable and constant.
Vsensor
(-10,+10)
10K
SER1CH-UA VIN
(0,5)
3.3K
10K
VREF = 5.0
V = 3.3v
20K
Figure 9.4: Op amp unity gain buffer with scaling
Note the input amplifier above will need a split power supply in order for its non inverting
input to respond to negative signals. Typically a split supply like +/-12 will be required.
By comparison, the purely resistive circuits in the previous section require only VREF from
the SER1CH-UA. We assume op amp users are familiar with their power requirements.
You may also wish to include a small diode above to prevent accidental negative excursions
from being presented to the SER1CH-UA (0,5) input. This might happen if the (-10,+10)
input went more negative than -10 volts. No damage will occur to the SER1CH-UA with
negative inputs, but preventing it from happening is a good precaution.
Inexpensive bipolar op amps such as the LM358 (dual) or LM324 (quad) can offer surprisingly good performance in such circuits. With their multiple op amps per IC package, such
54
devices make it easy to build circuits requiring multiple amps and buffers. When using
generic parts, remove amplifier input offset errors in software.
The next circuit adds gain to the input signal. After amplifying by 10, the signal is scaled
and biased into the SER1CH-UA (0,5) range with the 10K resistor pair. When building
a design like this, it is ideal to place the gain amplifier out near the sensor. Low voltage
signals like the +/-500mV input are much more sensitive to noise pickup than high voltage
levels. Any long cable could then be placed between the output of the gain amplifier and
the 10K divider pair. Check to make sure the cable capacitance has not caused instability
and amplifier oscillations.
Vsensor
(+/-500mV)
10K
(-5,+5)
SER1CH-UA VIN
(0,5)
10K
Gain = 10
9K
1K
VREF = 5.0
Figure 9.5: Op amp buffer with gain of 10
With the small input range of this circuit, it is easy for a signal more negative than -500mV
to get hooked up to the input by accident. As before, a small diode may be added to protect
against negative voltages at the SER1CH-UA VIN input.
For a single ended circuit such as this, do not allow ground currents from other devices
to flow on the ground wire of the cable connecting the op amp to the SER1CH-UA GND
jack. Excessive common mode currents, such as those from motors, will bounce the ground
connection and be apparent in the SER1CH-UA measurements.
55
Chapter 10
Single ended grounding practices
The SER1CH-UA has a single ended input. Excessive currents flowing on the black GND
banana pin will affect absolute measurement accuracy.
Work underway . . .
56
Chapter 11
Batteries and minimizing power
With its small current consumption, the SER1CH-UA is a good match for many low power
bit banging applications. This chapter reviews the steps required for achieving the lowest
power possible. The steps are easy, but important to be aware of for success.
The chapter sections review how to measure the SER1CH-UA current consumption, then a
check list of power minimizing steps, and conclude with an example of using battery power.
57
11.1
Measuring current consumption
The physical current consumed by the SER1CH-UA can be measured in a various ways.
If the unit is out of its enclosure, one way is to measure the voltage drop across the 5.1
ohm antisurge resistor R900 in the power supply area of the board. Then use Ohm’s law
to compute the current.
If the unit is in its enclosure, you have two options. One is to include an external series
resistor in the power supply line. Any resistor with a few ohms to a hundred ohms resistance
will suffice. The voltage drop then implies the current. Alternatively, you can use an
ammeter in series with the power supply and read the current directly. It will require an
accurate ammeter with better than 1 milliamp accuracy.
Once you have measured the current consumption, you’ll of course want to compare it
against the quoted specs. The table below computes the theoretical maximum base power
requirement. Not all these individual current components are consumed at the same time
and usually the typical current consumption will be approximately 600 microamps as quoted
in the specification table.
SER1CH-UA MAXIMUM BASE POWER CONSUMPTION ...
PART
DESCRIPTION
CURRENT CONSUMPTION IN milliamps
R112
R115
R122
U110
U200
R211
U210
U910
R921
R922
R923
47K @ 5v
47K @ 5v
1M @ 5v
74HC14 quiesent
LTC2400 A/D converter, while running
100K @ 5v
TLC27L2 quiesent
TLC27L4 quiesent
LM4040 with 24K source resistor, 2.5v / 24K
100K @ 2.5v
100K @ 2.5v
Total base current consumption (in milliamps) = 0.76393
Figure 11.1: Maximum base power consumption
58
0.10638
0.10638
0.00500
0.04000
0.20000
0.05000
0.03400
0.06800
0.10417
0.02500
0.02500
11.2
Minimizing power
If you are consuming more current than the amount listed in the table in Figure 11.1, there
are four possible offenders:
•
•
•
•
The green power LED is on, consuming 10 milliamps !
A low value resistance is connected between VREF and GND
Custom software is not handling the RS232 port correctly
The power supply is greater than 18 volts
Disconnecting the green power LED can be done by removing jumper J910 on the board.
It may be hard to believe a simple green LED can consume over 10 times more current than
the A/D circuit itself, but it is true. Removing the LED jumper will save that current.
Having a visible power indicator is handy in the lab, but takes its toll when running from
batteries.
After disabling the green power LED, it is also easy to forget that resistive loads connected
between the VREF banana jack and GND will consume additional power. For example, if
a 1K ohm potentiometer is connected between VREF and GND, that alone will consume
5 milliamps. And, that 5 milliamps will have to be supplied by the SER1CH-UA power
supply. A 10K potentiometer would a give a better tradeoff between avoiding noise and
minimizing power consumption.
The third item, handling the RS232 serial port correctly, is a concern only if you are writing
your own custom software. The problem is with RS232 inputs on the PC end of the DB9
cable and the impedance they present, typically 5K ohms. If such an input is driven at
+5 volts by the SER1CH-UA then this will consume 1 milliamp, which ultimately must
provided by the power supply.
The way to battle against the third item is to note the SER1CH-UA has only one input
to the PC RS232 port, the CTS signal. Don’t idle this signal high or you will sink unnecessary current on the order of 1 to 2 milliamps. An easy way to avoid touble is to assert
the LTC2400 chip select signal (RS232 RTS) only when needed. When this signal is deasserted, then the CTS input will automatically idle low and not burn unnecessary power.
Application programs like DVM supplied with the SER1CH-UA do this automatically.
The last item, using a power supply greater than 18 volts, is a serious error. Circuity on the
SER1CH-UA would be damaged by power greater than 18 volts and is protected by a TVS
device. When the external power supply exceeds 18 volts, the TVS turns on and clamps the
voltage to safe levels. Normally, the TVS is there to protect against power supply spikes.
However, if the power supply voltage is simply too high, the TVS will equally well turn
on and present a heavy load to your external supply. Check your power supply equipment
beforehand and don’t exceed 18 volts.
59
11.3
Batteries
Once you have minimized the power consumption of the system, you may be interested in
powering the SER1CH-UA from batteries. 9 volt batteries are attractive temporary power
supply for this system, running over 100 hours. For longer term power, lead acid 12 volt
batteries are useful.
Work underway . . .
60
Chapter 12
Specifications
The table on the following page lists the leading SER1CH-UA operating specifications.
Many of the values are discussed in more detail in their respective chapters. The table
here lists the primary analog components used on the board. Copies of the manufacturer
specification sheets are also included in the directory /Docs/ChipSpecs.
A/D converter
A/D voltage reference
Front end op amp
=
=
=
LTC2400
LM4040A
TLC27L2
61
(Linear Technology)
(National Semiconductor)
(Texas Instruments)
12.1
Specifications table
SER1CH-UA Specs
Comment
Min
Parameter
Analog input:
VIN input voltage range
VIN input impedance
Resolution
Noise Floor (1)
Typ
0
Max
Units
5.0
Volts
Ω
bits
µV
10M
24
10
Reference:
VREF voltage
VREF current
VREF capacitive load
4.8
10
10
Power supply:
Supply Voltage
Supply Current (2)
Supply Current (3)
8
converting
sleeping
General:
RS232 cable length (4)
Operating Temperature
Dimensions
9
600
200
16
Vdc
µA
µA
6
100
70
feet
◦
C
inches
0
2.13 x 3
Figure 12.1: SER1CH-UA specifications table
(1)
(2)
(3)
(4)
Peak to peak noise floor.
Continuous current when performing conversions, with LED off and no VREF load.
Sleep mode occurs when the LTC2400 CS pin is held high.
Longer cables may be possible, 100 ft is the tested limit.
62
V
mA
µF
12.2
Noise floor
Work underway . . .
noise floor plot
Figure 12.2: SER1CH-UA noise floor
63
12.3
Thermal response
Work underway . . .
thermal response plot
Figure 12.3: SER1CH-UA thermal response
64
Chapter 13
Circuit diagrams
FREE WEB VERSION - PARTIAL CIRCUIT DIAGRAMS
This free web copy of the User Manual includes only partial diagrams with the circuit
Overview and the VIN analog input amplifier. Complete circuit diagrams are provided
only with purchase of the product. Install the CDROM software included in the product
shipment box for the full User Manual and complete diagrams. Customers who need an
update or have lost their original CDROM may obtain copies of the full User Manual by
emailing SR at [email protected].
Use the Adobe Acrobat reader View/Rotate View/Clockwise command to present the
diagrams horizontally on the screen.
Circuit Overview . . . . . . . . . . . . . . . . . . . . . . . . . . . . . . . . . . . . . . . . . . . . . . . . . . . . . . . . . . . . 66
Digital RS232 Connector . . . . . . . . . . . . . . . . . . . . . . . . . . . . . . . . . . . . . . . . . . . . . . . . . . . . 67
Analog A/D Input Buffer . . . . . . . . . . . . . . . . . . . . . . . . . . . . . . . . . . . . . . . . . . . . . . . . . . .
68
Analog A/D User Banana . . . . . . . . . . . . . . . . . . . . . . . . . . . . . . . . . . . . . . . . . . . . . . . . . . . 69
65
66
1
2
3
4
B
A
B
LINEAR REGULATION FOR LOW NOISE
2.1mm POWER CONNECTORS
WALL TRANSFORMER OR BATTERY POWER
SCHEMATIC PAGES 9-11
POWER SUPPLY
(100)
C
(900)
(200)
LTC2400 24 BIT A/D CONVERTER
REQUIRES RTS, DTR, CTS, GND
SCHEMATIC PAGES 5-7
RS232 INTERFACE
A/D CONVERTER
C
SCHEMATIC PAGES 2-4
RS232 DB9 CONNECTOR
SR SER1CH-UA BLOCK DIAGRAM OVERVIEW
A
Date:
Size
A
Title
E
D
Tuesday, July 10, 2007
Sheet
Document Number
SER1CH-UA.DSN, (c) Symmetric Research, 2007
01 OVERVIEW
BANANA JACK CONNECTIONS
1
E
5v BUFFERED USER REFERENCE
of
11
Rev
B
(300)
ONE 24 BIT ANALOG INPUT CHANNEL
SCHEMATIC PAGE 8
ANALOG CONNECTORS
D
1
2
3
4
67
1
2
3
4
J100
A
DB9 FEMALE
S1
5
9
4
8
3
7
2
6
1
S2
PIN5
PIN9
PIN4
PIN8
PIN3
PIN7
PIN2
PIN6
PIN1
SHIELD
SHIELD
DB9 CONNECTOR
RS232 DB9 CONNECTOR
A
PIN9
PIN8
PIN7
PIN6
PIN5
PIN4
PIN3
PIN2
PIN1
RS232-RI
RS232-CTS
RS232-RTS
RS232-DSR
RS232-GND
RS232-DTR
RS232-TX
RS232-RX
RS232-DCD
DB9 PIN TO RS232 SIGNAL MAPPING
C
B
C
Date:
Size
A
Title
GND
D
Tuesday, July 10, 2007
Sheet
Document Number
SER1CH-UA.DSN, (c) Symmetric Research, 2007
02 DIGITAL RS232 CONNECTOR
RS232-GND
RS232-CTS
RS232-DTR
RS232-RTS
TO RS232 BUFFERING
D
ONLY (RTS, DTR, CTS, GND) ARE USED, ALL OTHERS NO CONNECT
B
2
E
E
of
11
Rev
B
1
2
3
4
68
B
-
+
AGND
6
5
AGND
C
C221
470pF
AGND
AGND
R224
10M 1%
AGND
C222
220pF
7
E
of
USER-VIN
11
FROM ANALOG INPUT BANANA
A
Date:
Size
A
D
Tuesday, July 10, 2007
Sheet
Document Number
SER1CH-UA.DSN, (c) Symmetric Research, 2007
07 ANALOG A/D INPUT BUFFER
R223
1K 0.5%
Title
R222
NP
R221
NP
Rev
B
3
4
1
NP = NOT POPULATED
C220
1uF/16v
7
U210B
TLC27L2
D200
NP [ZENER DIODE 6.2v]
E
1
AGND
+
R220
100 0.5%
VDC
AGND
USER-VREF
D
2
AD-VIN
TO A/D CONVERTER
C
2
3
4
B
ANALOG USER INPUT SIGNAL CONDITIONING AND BUFFERING
A
8
4
69
1
2
3
4
B
C
A
SHIELD
B
1
1
1
J302
BANANA JACK (BLACK)
J301
BANANA JACK (RED)
J300
BANANA JACK (RED)
ANALOG GROUND
ANALOG INPUT
BUFFERED A/D REFERENCE OUTPUT
D
C
Date:
Size
A
Title
D
Tuesday, July 10, 2007
Sheet
Document Number
SER1CH-UA.DSN, (c) Symmetric Research, 2007
08 ANALOG A/D USER BANANA
SINGLE ENDED USER ANALOG INPUT wrt AGND 0 to 5 VOLTS FULL SCALE
BRACKET FRONT PANEL
1
J303
AGND
USER-VIN
USER-VREF
USER ANALOG INPUT AND BUFFERED REFERENCE BANANA JACK CONNECTORS
A
8
E
E
of
11
Rev
B
1
2
3
4
Chapter 14
Examples and Experiments
The following are a few hands on demonstrations using the SER1CH-UA. Several of these
examples show how to implement topics covered in previous chapters. These are starting
points and should be modified as necessary for the work at hand.
Basic voltage measurements with probes . . . . . . . . . . . . . . . . . . . . . . . . . . . . . . . . . . . .
71
Plotting results with GnuPlot . . . . . . . . . . . . . . . . . . . . . . . . . . . . . . . . . . . . . . . . . . . . . . . 74
Ratiometric potentiometer . . . . . . . . . . . . . . . . . . . . . . . . . . . . . . . . . . . . . . . . . . . . . . . . . .
78
Scaling and biasing +/-10 volt signals into (0,5) . . . . . . . . . . . . . . . . . . . . . . . . . . . . . 80
Measuring temperature . . . . . . . . . . . . . . . . . . . . . . . . . . . . . . . . . . . . . . . . . . . . . . . . . . . . . . 82
70
14.1
Basic voltage measurements with probes
Measuring a voltage with the SER1CH-UA is similar to using other voltmeters, with the
voltage source being connected between the red VIN and black GND banana jacks. Figure
14.1 shows a pair of AA batteries in series, and the alligator test leads supplied with the
system used to measure their voltage.
Figure 14.1: Two lead voltage measurement of a battery
*** WHAT HAPPENS IF THE BATTERY IS HOOKED UP IN REVERSE ??????
Since two AA cells in series is approximately 3 volts, if you use the DVM program with
the startup file DvmVoltage.ini you should see the following on your computer screen:
In this particular DVM display, both readouts have been calibrated in volts. For many
71
applications it is useful to calibrate the second DVM readout into other more physical
units proportional to the voltage, such as potentiometer position, temperature, etc. It
is convenient to have two readouts so you can monitor the raw sensor voltage while also
displaying the physically sensed quantity. See the Software chapter of this User Manual
and the CAL program for more details.
Besides using the alligator leads supplied with the system, you can also use standard
red/black banana plug test leads. In Figure 14.2, a pair of Pomona test leads are shown
connected to the SER1CH-UA banana jacks. If you need a pair of heavy gauge test leads,
they may be ordered as an accessory for the basic system.
Figure 14.2: Pomona test leads for voltage measurements
When making two wire voltage measurements as in Figures 14.1 and ??, be aware the black
GND banana jack is ultimately connected to the power ground and enclosure of the PC
via the DB9 RS232 serial port connector. The analog inputs are not floating as they are
with a hand held voltmeter. Also be aware current flowing in the ground system can cause
noise in your measurements. Use a star layout for ground and ideally keep your sensor at
one end of the star without system ground currents passing though its circuit.
Another difference with typical hand held voltmeters is the voltage between the VIN and
GND jacks should be in the range of (0,5) volts. The system will tolerate moderate voltages
outside of this range, but do not attempt to measure 110 vac from the wall socket with this
device. Doing so will void the warranty. If you need to measure voltages outside the (0,5)
72
range, please use the techniques in the Scaling active sensor voltages chapter in this User
Manual, or the (-10,+10) section further on in these examples.
Simply being able to measure and record voltages provides many possibilities for interesting
applications. As an example, Figure 14.3 shows using a solar cell as a light sensor. The
voltage generated by the solar cell is a measure of the amount of light shining on it. The
cell in Figure 14.3 has a voltage ranging from 0 volts at total darkness to approximately 3
volts at full brightness.
Figure 14.3: Using a solar cell as a light level meter
Not only can you measure the solar cell voltage with DVM, you can also calibrate the
second DVM readout to display the value in light level units. Having a second readout
calibrated into physical units makes it easy to determine the current condition of a sensor.
Besides its real time GUI readout display, DVM also saves its data values to a disk file.
This makes it easy to review results after a long data run. The next chapter section shows
how to take a DVM output file and plot the results with GnuPlot on the computer screen
or printer.
73
14.2
Plotting results with GnuPlot
After acquiring data with the SER1CH-UA, you may want to plot the values. GnuPlot is
a useful public domain program for displaying results on the computer screen or printer in
a variety of formats. Copies can be downloaded for free from the web at:
www.sourceforge.net
or found by searching the web on the keywords GnuPlot. PDF documentation is included
with GnuPlot when it is unpacked. Programs such as Xcel and MatLab may also provide
useful plotting tools for users already having those programs.
The techniques for plotting results with GnuPlot or similar programs all follow the same
pattern. First, run the SER1CH-UA DVM program to acquire values and save the results
to an output disk file. For this example we assume data from the solar cell in the previous
section has been saved in the file DvmOutputSolar.asc. The DVM output files are in ASCII
format with the data in columns which can be imported into plotting programs. The .asc
output files may also be reviewed in text editors such as Notepad. The following is a portion
of the DVM .asc output data file that might result:
Data:
Sample
1
2
3
4
5
6
7
8
9
Volts
+0.7
+0.7
+0.7
+0.7
+0.7
+1.0
+0.9
+1.0
+1.2
OneToTen
+1.42
+1.43
+1.43
+1.45
+1.49
+2.01
+1.90
+1.99
+2.34
Time (Sec)
1202171952.468
1202171953.629
1202171954.791
1202171955.953
1202171957.114
1202171958.276
1202171959.438
1202171960.599
1202171961.761
Time (YMD HMS)
2008/02/05 00:39:12.468
2008/02/05 00:39:13.629
2008/02/05 00:39:14.791
2008/02/05 00:39:15.953
2008/02/05 00:39:17.114
2008/02/05 00:39:18.276
2008/02/05 00:39:19.438
2008/02/05 00:39:20.599
2008/02/05 00:39:21.761
Figure 14.4: DVM output file fragment from DvmOutputSolar.asc
To produce an output file with these data columns, DVM was run with the .ini startup
parameters shown in Figure 14.5. Besides the general output format, this .ini file also
specified the second display should be formatted in light level units of 1 to 10. You may
wish to calibrate into other light level units as appropriate.
Once the DvmOutputSolar.asc file has been acquired, start GnuPlot and issue the commands in Figure 14.6 at its prompt.
74
; General ini parameters:
OutputFileName
OutputFileComment
OutputFileShowHeader
OutputFileShowIndex
OutputFileShowTimeSec
OutputFileShowTimeYmd
RunMode
=
=
=
=
=
=
=
"DvmOutputSolar.asc"
"Measuring solar panel response"
ON
ON
ON
ON
CONTINUOUS
; Display 1 format and calibration parameters:
DisplayTitle
DisplayUnits
DisplayPlaces
DisplayDigits
DisplaySlope
DisplayOffset
1
1
1
1
1
1
=
=
=
=
=
=
"Light Level"
"OneToTen"
6
2
6.02121e-007
-0.00147941
Figure 14.5: DVM startup file fragment from DvmSetupSolar.ini
You can also save the commands in Figure 14.6 to a file and then run them in GnuPlot with
the load command. The file Solar.gp in the examples software directory has the complete
set of commands required to produce the following graph. The core GnuPlot command
is plot. With that single command you can display simple plots. Additional commands
should be used for features like graph titles. Refer to the GnuPlot documentation for more
information.
75
# SET FILE FORMAT PARAMETERS:
DataFile = "DvmOutputSolar.asc"
ColSample = 1
ColVolts
= 2
ColLight
= 3
ColSeconds = 4
ColTime
= 5
# SET AXIS DATA LIKE TIC MARK STYLE, FORMAT, LABEL AND RANGE:
set
set
set
set
set
set
xtics nomirror
ytics nomirror
xlabel "Sample"
ylabel "Volts"
xrange [0:120]
yrange [0:5]
font "Helvetica Bold,14"
font "Helvetica Bold,14"
font "Helvetica Bold,18"
font "Helvetica Bold,18"
# About 2 minutes of data
# Solar panel outputs ~3.3v in strong sunlight
# PLOT THE SOLAR DATA:
set title "SER1CH-UA Solar Panel Data" font "Helvetica Bold,18"
plot DataFile index 1 using ColSample:ColVolts linestyle 1 title "Solar panel voltage"
Figure 14.6: GnuPlot commands for plotting DvmOutputSolar.asc
76
SER1CH-UA Solar Panel Data
5
Solar panel voltage
Light very close
4
Volts
3
2
1
Light off
0
0
20
40
60
80
100
Sample
Figure 14.7: SER1CH-UA solar cell data example plot
77
120
14.3
Ratiometric potentiometer
Three wire ratiometric measurements are an excellent way to minimize errors due to temperature drift. The math behind such techniques is covered in the Ratiometric measurements
chapter earlier in this User Manual. The demo reviewed here shows the connections for a
three wire measurement using a precision 10 turn wire wound potentiometer.
For a ratiometric measurement, the A/D reference voltage provided on the red VREF
banana jack should be used as the excitation voltage for the potentiometer, and the potentiometer wiper should be connected to the VIN jack. The photo below shows the
connections. For a schematic, see the Ratiometric measurements chapter. Here, a 10K
ohm potentiometer has been used. This means a total of 5V/10K = 0.5 milliamps is flowing through the potentiometer. This is good, it is a large enough current to avoid noise
problems, but still small enough to avoid putting a high load on the VREF output.
Figure 14.8: 10 turn potentiometer, SER1CH-UA connections
The connections on the bottom side of the potentiometer are simple wires to the three
potentiometer terminals as in Figure 14.9. For an application of this type you may want
the second DVM readout display to be calibrarted in Turns. See the ini startup file in
Examples/DvmPotentiometer.ini for an example. Generating suitable custom calibration
parameters is easy with the CAL program. Running CAL, first turn the potentiometer all
the way to its lowest setting and take a measurement. Then do the same at the maximum
number of turns and save the CAL results to an ini startup file.
78
Figure 14.9: 10 turn potentiometer, reverse side connections
How well do ratiometric methods work to reduce the problems of temperature drift? With
the above setup, the relative wiper voltage from the potentiometer as read by the SER1CHUA did not vary by more than 30 microvolts (???) in our experiments. For quantitative
results see the plots in the Ratiometric measurements chapter.
Potentiometers are useful for measuring angular position. However, they are only one
class of sensors suitable for ratiometric use. For linear measurements, there are linear
slider potentiometers. Using a linear potentiometer is the same as a 10 turn rotational
device. Connect the three terminals of the linear potentiometer to the three terminals
of the SER1CH-UA and you are ready. Calibrate the linear potentiometer into physical
length units with the CAL program. For linear measurements over greater distances, there
are also string potentiometers.
Figure 14.10: Linear slider potentiometer
For other types of passive ratiometric applications, there are also sensors such as strain
gauges, tilt meters, and pressure transducers that all connect naturally to a three wire
interface.
79
14.4
Scaling and biasing +/-10 volt signals into (0,5)
The SER1CH-UA has a full scale input range of (0,5) volts as measured with respect to its
red VIN and black GND banana jacks. However, for many applications you may require a
different full scale range. In particular, (-10,+10) is popular for many active sensors.
Scaling and biasing a (-10,+10) signal into the (0,5) range is fairly easy with a few resistors.
This demo shows how to preform the mapping with four 10K ohm resistors. More details
about scaling and biasing can be found in:
• the Scaling active sensor voltages chapter of this User Manual for other voltage ranges
• for additional theory, the SR application note, Scaling and Biasing Analog Signals
The demo circuit for (-10,+10) mapping is as in Figure 14.11:
10K
VREF (+5 volts)
10K
10K
VIN (0,5)
(-10,+10)
SER1CH-UA
Active Sensor
10K
GND
Figure 14.11: Scaling and biasing (-10,+10) with four 10K resistors
This circuit is the same as the one marked with a ? star in the Figure 9.3 table in the
Scaling active sensor voltages chapter. For this demo the 5K biasing resistor is built from
two 10K resistors in parallel, since that may be all that is on hand.
There are several construction techniques for building circuits of this type. Here, we will use
vector perf board, resistors with wire leads, wire, and solder. The popular white prototype
punch boards are not recommended. The resistance at the punch board spring clip contacts
varies considerably and is subject to corrosion. Simple solder joints result in a more reliable
and stable circuit. Use good quality 1/4 watt metal film resistors for best performance.
80
Build the three resistor +/-10 to (0,5) divider on vector board to demonstrate one construction technique. Review soldering resistors together. Include JPEG photo. Suitable
resistors are listed in the extra supplies section.
Mention resistor values can often be built using series or parallel combinations of a single
stock value. So for example, with the +/-10 three resistor divider, use 4 10K resistors total,
with 2 in parallel to build the 5K.
Demonstrate the input/output mapping with the scope and Gnu plots?
Make a point that a FLOATING input will not map to the 2.5 midpoint. The input must
be grounded for the output to be at 2.5 ... an example that the item driving the input
must be low impedance.
Also discuss where there are pads on the RevB board for smt parts. Maybe include a JPG
for this too.
81
14.5
Measuring temperature
Reasonable temperature measurements can be made using inexpensive silicon diodes as the
sensor. This example shows how to use a small signal 1N4148 diode to build a temperature
sensor.
All silicon pn junctions have a change in their forward voltage of -2 mV(millivolts)/◦ C with
changes in temperature. This thermal parameter is governed by the quantum mechanics
of a pn junction and is remarkably constant across diode lots. The total forward diode
voltage depends on the amount of current flowing though the diode and will generally be
around 600 to 700 mV. For any given diode, if the current through it is held constant, then
its forward voltage will stay the same with only the TC variation remaining. When used
in this way it becomes a reasonable temperature sensor.
The SER1CH-UA can easily measure changes of 2 mV out of voltages of 600 to 700 mV,
and the DVM program can be calibrated to display the result as a temperature. The key
is to maintain a constant steady current through the diode. A rudimentary circuit can be
as simple as:
VREF = 5.0
VIN
1N4148
SER1CH-UA
10K
GND
Figure 14.12: Temp diode with simple resistive current source
In Figure 14.12, the SER1CH-UA VREF is used as a 5 volt source for the diode. To a
crude approximation, if the voltage across the 10K resistor is taken to be 5 volts, then an
approximately constant current of 0.5 milliamps will be flowing in the diode. Of course,
the current is only approximately constant because as the forward diode voltage changes
with temperature the voltage across the 10K resistor changes also. Nevertheless, for many
applications this is may be ok.
With the addition of an op amp, a better constant current source can be implemented as
in Figure 14.13. For this circuit, the SER1CH-UA VREF is divided down to 1 volt for the
82
noninverting op amp input. By negative feedback the inverting terminal is also forced to
be at 1 volt, and this 1 volt puts a constant current down the 10K resistor connected to
the inverting terminal. Since no current flows into the inverting terminal of the op amp,
the same constant current flows though the diode. The output of the amp will be at 1 volt
plus the forward diode drop.
For this circuit, an LM358 or LM324 is a good generic op amp to use. These devices can
even be powered in single supply fashion by VREF itself. Consuming only about 1 milliamp
of power, their power requirements will not overload the VREF output. No split op amp
supply is required.
VREF = 5.0
1.0 volt
VIN
2.5K
SER1CH-UA
10K
1N4148
GND
10K
Figure 14.13: Temp diode with constant current op amp source
Many silicon diodes are suitable for use as temperature sensors. The 1N4148 or 1N914
are among the least expensive, costing as little as $0.05 even in small quantities. The pn
junctions of bipolar transistors such as the 3904 or 3906 can also be used. See the Extra
supplies chapter for a few vendors. More sophisticated solid state sensors optimized for
temperature measurement are also available. Visit the web sites of National Semiconductor,
TI, and many other semiconductor companies.
Calibrate DVM into ◦ C or ◦ F for a nice display on the computer screen of the temperature
measured in this way ...
83
Chapter 15
Frequently Asked Questions
The following FAQ may help if you have general questions about the SER1CH-UA.
15.1
Software
Do you include source code ?
Yes. The source code for all the supplied software is included with the system
at no extra cost. The software is also available for free download from our
web site www.symres.com. Please review before purchase to make sure the
SER1CH-UA is a match for your applications. Current customers should also
download from the website to get any version updates.
What format are the DVM acquisition files in ?
ASCII text with the data listed in columns. The files can be read into text
editors as well as imported into programs such as spreadsheets.
Two ASCII formats are possible, verbose and bare. Verbose has a header with
information about the DVM acquisition parameters in addition to the data.
Bare format has just the data. Besides the converted A/D data, the PC time
stamp at which A/D data is acquired is optionally provided as a column.
Can I use the SER1CH-UA with Xcel spreadsheets ?
First run DVM generating an OUT data file in bare format. Then import the
ASCII data file into Xcel.
84
Can I use the SER1CH-UA with MatLab ?
A native MatLab format is not provided. Import the DVM OUT data files in
bare ASCII format.
Can I use the SER1CH-UA with Visual Basic ?
The User C Library supporting the system is available as a DLL. It can
be called from Visual Basic as well as other programming languages as long
as you follow C calling conventions. Please note, SR does not provide Visual
Basic programming advice.
Can I use the SER1CH-UA with LabView ?
Set up LabView VI interfaces to the SER1CH-UA DLL library with C calling conventions and it will work. Please note, SR does not provide LabView
programming advice.
15.2
Hardware
What analog input voltage ranges are possible ?
The analog input voltage may range from 0 to +5 volts. This is the voltage
as measured on the middle red VIN banana jack with respect to the black
GND banana jack. Valid count values are returned only for voltages within the
specified (0,5) volt range.
If you wish to work with a different range, then you must add circuitry such as
a voltage divider or amplifier to scale the voltage into the 0 to +5 range. For
details, see the Scaling sensor voltages chapter. By using the VREF jack as a
bias source, bipolar ranges such as (-10,+10) are easily supported.
Many passive sensors can use the VREF jack as excitation to scale their ranges
naturally into the full range of the SER1CH-UA. See the Ratiometric chapter
for a discussion.
Can I overdrive the VIN analog input ?
Moderate overvoltages in the range of 20 volts are ok. Input currents are
limited by the signal conditioning on the SER1CH-UA front end. However,
overdriving the input is hard on the system. We recommend adding suitable
external circuitry to deal with the particular problems at your site rather than
85
making the SER1CH-UA take the brunt of the overload.
Zener diodes, TVS diodes, and gas arrestor tubes are all popular overload
protection techniques depending on the size and magnitude of the problem.
Do static shocks hurt the banana jack inputs ?
Yes. Although the input circuitry has resistors and capacitors to help guard
against static shocks on the banana jack connectors, static discharges are brutal
to any electronics.
This includes small sparks generated from walking over a carpet. Static discharge events will result in a degradation of the electronics even if total failure
does not occur.
Before touching the banana jack inputs, take a moment and discharge yourself
by touching a nearby metal object such a metal desk or a computer case. Then
touch the metal case of the SER1CH-UA and then finally the banana jack
inputs for any connections that must be made. The moment spent consistently
performing this simple routine will significantly reduce static damage.
Why does waving my hand change the DVM voltage ?
The input impedance of the SER1CH-UA is 10M ohms. Waving your hand over
the input banana jacks when nothing is connected will induce a measurable
charge and voltage change by capacitive coupling. DVM reflects this change.
Connect the analog input VIN to the VREF or GND jacks and you will notice that the effect disappears. This behavior is typical of all precision, high
input impedance voltmeters. Floating inputs tend to wander as as various
charged entities are brought near their inputs. Connect the input to specific
low impedance voltages to make accurate measurements.
Can I connect a 10 ohm resistor to the VREF output ?
No. Connecting a 10 ohm resistor across the 5 volt VREF and GND would
theoretically result in a current of 5/10 = 0.5 amp flowing! Obviously, this is
more current than a device like the SER1CH-UA is designed to supply.
No damage will occur by connecting a 10 ohm resistor or even shorting VREF
directly to ground. The output is current limited and will supply an absolute
maximum current of about 40ma. On our spec sheet lists a max of 10ma to
stay within compliance. When overloaded the output will simply drop and fall
out of regulation. If you need more than a few milliamps of reference current
then use VREF to drive an offboard buffer.
86
Why is the system consuming more than 10ma ?
You probably have the green power LED enabled, which consumes considerably
more than the SER1CH-UA base power consumption. The green LED jumper
must be disabled to minimize power. For more information, see the Batteries
and minimizing power chapter.
Is the SER1CH-UA connected to system ground ?
Yes. The black GND banana jack on the SER1CH-UA top panel is connected
to the RS232 DB9 ground pin on the back panel which in turn is connected to
PC ground. In addition, the outer ring of the 2.1mm power supply connector
is also connected to the black GND jack. If you use a grounded power supply,
then the SER1CH-UA will also be connected to that ground.
Note that even though the wall transformer supplied with the system is an
unregulated floating power supply, or even if you use battery power, the system
is still connected to the PC ground via the DB9 RS232 connection.
Is there any antialiasing filter ?
The SER1CH-UA does not have an op amp antialias filter in its front end signal
conditioning. However, fow low frequency measurements 60 or 50Hz rejection is
the most common requirement, and the LTC2400 A/D converter has excellent
power line rejection internally. See the 60 and 50Hz power line rejection section
for more information.
For rejection of higher RF frequencies, simple RC filters are usually recommended, and there are pads for installing a variety of RC combinations on the
SER1CH-UA front end signal conditioning. See the Circuit diagrams.
How do I select 50Hz rejection ?
The internal LTC2400 A/D filter can be set to either 60 or 50Hz rejection, but
not both. The selection is made with soldered on surface mount resistors on
the SER1CH-UA circuit board. Usually customers in specific countries want
only one setting or the other. Please specify 50Hz rejection at the time of your
order if required. If not specified, the system will be set for 60Hz rejection.
Customers wishing to change the 60/50Hz setting themselves, should refer to
the Circuit diagrams and the Linear Tech LTC2400 spec sheet for details.
Is twisted pair good for analog inputs ?
Yes! Even though the SER1CH-UA sigma delta A/D converter has excellent
87
60/50 Hz rejection, it is better to avoid power line noise in the first place.
Twisted pair for the input signals is one of the best ways to do so. The long
red and black test leads typically used with voltmeters create large open loops
which easily pick up power line noise. Even simple steps such as loosely twisting
red and black test lead pairs together can substantially reduce power line noise
pickup. Jacketed twisted shielded pair round cable is even better.
Note that foil shielding does not do much good against 60/50Hz noise. What
foil shielding does help with is to protect against ESD static discharge damage
and RF noise. At 60/50Hz it is the twist that does the job.
Does the SER1CH-UA have any digital buffering ?
No, the SER1CH-UA does not have memory for buffering accumulating converted results. After a conversion, the one digital result is saved on the A/D
chip and the PC must read that result. If another conversion is performed, the
previous digital result is lost.
Other Symmetric Research A/D products feature sizeable FIFO buffers so the
PC does not have to read the results immediately. However, at the 1Hz acquisition rates of the SER1CH-UA it is assumed the PC can keep up with the
required digital bandwidth.
What kind of RS232 cable is required ?
Use a standard straight through DB9 male to female cable. Sometimes this is
called a DB9MF extension cable. Do not use null modem cables. They swap
signal wires and will not work correctly.
If you are using multiwire jacketed cable to make a custom cable, you will need
5 conductors. One each for ground, power, CTS, RTS, and DTR. We also
recommend shielded cable for this connection, with the shield connected to the
outer housing on the Dshell connectors on each end. The shield will conduct
away any static discharges to the enclosures on each end.
Split out the power conductor and route it to the 2.1mm power connector.
The other signals can go to the DB9 connector. If you are making a permanent installation consider using the SER1CH-UA-DSUB model which has all
connections on Dshell connectors.
What length RS232 serial cable can I use ?
We have tried 100 feet of RS232 serial port cable. Signal quality of the digital
signals was good and the system ran without trouble. Longer cables may work,
but have not been tested.
88
Is the system opto isolated ?
No. The SER1CH-UA is connected to the ground and signal wires of the
RS232 DB9. Those signals are not opto isolated from the analog ground of the
SER1CH-UA.
Users requiring a floating system should use RS232 opto iosolators that support
CTS, RTS and DTR, and floating power supplies such as an unregulated wall
transformer or a battery.
Will USB to RS232 dongles work ?
Only dongles that support the RS232 signals RTS, CTS, DTR can be used. Be
careful, many dongles support only RX and TX.
One USB to RS232 dongle we have used successfully is from Keyspan. It is
clearly advertised as supporting all the RS232 signals including RTS, CTS,
DTR. Various other dongles have failed, so don’t make assumptions.
Does the SER1CH-UA record GPS time ?
Not directly. However, the DVM application program is capable of recording
the PC time along with each sample. If you have a GPS receiver or NTP time
setting your PC clock, then that time will be recorded in the DVM files as a
result. See the Software chapter for more details on DVM PC time stamping.
Note that time stamps derived from the PC clock give at best millisecond
accuracy. This is perfectly adequate for many applications, particularly if they
are sampling at the 1Hz rate. For more precise time stamping SR has other
A/D converter products with accuracy in the sub microsecond range.
89
Chapter 16
Extra supplies
A small collection of parts for getting started with the SER1CH-UA is included with all
new orders. We will be glad to supply additional parts if you contact us.
The following list of mail order suppliers and part numbers may also be useful for obtaining
small parts for use with the SER1CH-UA.
DigiKey
www.digikey.com
1(800)344-4539
Mouser Electronics
www.mouser.com
1(800)346-6873
JDR Microdevices
www.jdr.com
1(800)538-5000
Abbreviations used below:
MFG = Manufacturer
DK = DigiKey
MO = Mouser
JDR = JDR Microdevices
90
16.1
Small parts for cables etc
Some of the most commonly used small parts in SER1CH-UA applications are as follows.
This is only a small listing of the parts and suppliers available. Many others are acceptable.
2.1mm power plug
MFG part number = CUI Inc PP3-002A
DK part number = CP3-1000A
MFG part number = Kobiconn
MO part number = 1710-2131
These are discrete wire power plugs suitable for soldering wires to. They are useful for
connecting batteries and other custom power sources to the SER1CH-UA. Use these instead
of chopping the plug off of your wall transformer.
Alligator clips
MFG part number = Mueller BU-30
DK part number = 314-1010-ND
MFG part number = Silvertronic 501793
MO part number = 835-501793
The Mueller BU-30 clip has a good spring and strong teeth. The connection is wire crimp,
which should also be soldered for low resistance. Making cables with these clips requires
skill, but they result in inexpensive connections of good quality that are easy to use. The
Silvertronic part is equivalent to the Mueller.
Johnson banana plugs
MFG part number = Johnson (Emerson) 108-753-001
DK part number = J149-ND
MO part number = 530-108-0753-1
These uninsulated banana plugs have a 6-32 screw in the end. When plugged into the red
and black jacks on the SER1CH-UA, they provide screw terminal connections.
91
Solder terminal lugs for Johnson banana plugs
MFG part number = Keystone 7329
DK part number = 7329K-ND
MO part number = 534-7329
The Keystone solder lugs are useful for making screw terminal connections to the Johnson
banana plugs. It is also easy to clip alligators onto these lugs when they have no wire soldered
on. The lugs listed above are flat. Lugs with internal tooth lock washer holes are also available
for even more secure connections.
Pomona test leads
MFG part number = Pomona 5519A
DK part number = 501-1004-ND
MO part number = 565-5519A
To use these test leads with the SER1CH-UA you must trim or cut away the banana plug
insulating sheath. Do this with a utility knife or razor blade carefully cutting away the plastic
sheath.
DB9 molded serial port cables
MFG part number = generic
JDR part number = CBL-DB09-MF
Finished molded 6’ cable. Commonly referred to as a DB9-MF male female extension cable.
All pins are connected straight through. Null modem cables will not work.
DB9 solder cup Dshell connectors
MFG part number = generic
JDR part number = DB09P (male)
JDR part number = DB09S (female)
For making custom RS232 cables, solder cup DB connectors are convenient. These are available everywhere including DK and MO. The JDR parts are generic and of good quality at a
reasonable price. Since the RS232 cable is MF you need one for each end.
92
Wall transformers
MFG part number = CUI Inc DPD090020-P5P-SZ
DK part number = T967-P5P-ND (9v 200ma 2.1mm plug, 110vac US)
MFG part number = CUI Inc DPD090050E-P5P-SZ
DK part number = T973-P5P-ND (9v 500ma 2.1mm plug, 220vac Euro)
MFG part number = Xicon
MO part number = 412-109024 (9v 200ma 2.1mm plug, 110vac US)
Don’t use switching regulated wall transformers with the SER1CH-UA. No damage will occur,
but switching regulators will introduce considerable high frequency noise into the system. A
common unregulated linear wall transformer is generally preferable.
Single twisted pair shielded cable
MFG part number = Belden 9501
MO part number = 566-9501-100
Twisted pair provides reasonable powerline noise immunity for analog inputs. This Belden
cable also has a foil shield and is jacketed. There are a large number of cable types available.
This is only one example.
Double twisted pair shielded cable
MFG part number = Belden 9502
MO part number = 566-9502-100
For connecting potentiometers three wires are needed. This is the double pair version of single
twisted pair. Use one wire from each pair as ground, and the other wire of each pair as signal.
1% metal film resistors
MFG part number = Yageo many values
DK part number = (Value)XBK-ND
MFG part number = Xicon many values
MO part number = 271-VALUE-RC
Metal film resistors give good performance for scaling and biasing applications. They cost
very little more than carbon film parts but have better TC and noise characteristics. The
parts above are standard 1/4 watt types with wire leads. For most applications, precision
greater than 1% metal film costs considerably more and may not deliver substantially improved
performance. Hand matching 1% metal films is a reasonable way to obtain tightly matched
pairs. Hand matched carbon films will not deliver the same performance.
93
Potentiometers, 10 turn, 10K ohm
MFG part number = Vishay (Sfernice) 53411103
MO part number = 594-53411103
MFG part number = Bourns 3540 series
DK part number = 3540S-1-103-ND
A 10 turn pot is a simple and reasonably accurate sensor to use when testing the SER1CHUA. Connect the three potentiometer connections to the three banana jacks with the wiper
going to the red VIN jack and you can make accurate angular measurements. There are
many manufacturers of 10 turn pots. A 10K ohm unit will not draw excessive current from
the VREF output.
Potentiometers, linear slider, 10K ohm
MFG part number = Alps RSA0N11S9002
MO part number = 688-RSA0N11S9002
Linear slider pots do not have the accuracy of a 10 turn pot, but they are ideal for making linear
position measurements. As with rotary pots you only have to connect the three terminals to
the SER1CH-UA and calibrate appropriately. The above pot has a linear travel length of 120
mm = 4.7 inches.
Sensors, general
DK part number = Many, see their sensors listings
MO part number = Many, see their sensors listings
Both DK and MO have extensive selections of sensors that are suitable for use with the
SER1CH-UA. Pressure, vibration, and light sensors are just a few in their listings. They can
often provide an easy solution to sensor selection. PDF copies of the DK and MO catalogs are
available for free download from their web sites. For many simple measurements like position
or temperature, often very simple parts like potentiometers and diodes can do a perfectly
good job. See the appropriate part listings here and chapters in the User Manual.
94
Sensors, temp diodes
MFG part number = Fairchild 1N4148
DK part number = 1N4148FS-ND
MFG part number = Fairchild 1N4148
MO part number = 512-1N4148
Virtually any silicon pn junction may be used as a temperature diode. Even the most inexpensive small signal silicon diode does a reasonable job. The generic 1N4148 or 1N914 are
probably the least expensive, although if you have something else in your spare parts box it
will probably do as well. More expensive solid state temp sensors are available at many of
the semiconductor companies like National Semiconductor and TI.
Op Amps
MFG part number = TI LM324N
DK part number = 296-1391-5-ND
MFG part number = ST Micro LM324N
MO part number = 511-LM324N
The selection of op amps is large, each device optimizing some particular parameter. Probably
the most generic part available is the LM324. The LM324 has four op amps (a quad) in a 14
pin ic package. Its close cousin, the LM358 is the same op amp, but with with two op amps
(a dual) in an 8 pin ic package. These traditional bipolar devices were originally developed by
National Semiconductor, but are now second sourced by many. They offer good performance
at very low cost for general applications, and may be used with either single or split power
supplies from as low as +5v to as high as +32v.
Batteries, 12 volt lead acid
MFG part number = BB Battery BP1.2-12-T1 (12v 1.2Ah)
DK part number = 522-1007-ND
MFG part number = Power Sonic (12v 1.4Ah)
MO part number = 547-PS-1212
The batteries above are small lead acid batteries. A good point about lead acid is they are
rechargeable. A 1.2Ah battery would have enough power to run the SER1CH-UA continuously
for 1.2/0.0006 = 2000 hours = 83 days.
95
Copper Tailings
Ruth, Nevada, 2007
SER1CH-UA User Manual
c , Symmetric Research, (2007/11/25)
Copyright This material can only be reproduced in whole or part with the written permission of
Symmetric Research
No guarantee of suitability for any application is made with this document
All liabilities are the responsibility of the user
Email: [email protected]
Web: www.symres.com
96