1
Management and Processing of Vibration Data
MANAGEMENT AND PROCESSING OF VIBRATION DATA
BY
WISAM HUSSAIN, B.Eng.
a thesis
submitted to the department of computing & software
and the school of graduate studies
of mcmaster university
in partial fulfilment of the requirements
for the degree of
Master of Applied Science
c Copyright by Wisam Hussain, April 2013
All Rights Reserved
Master of Applied Science (2013)
McMaster University
(Computing & Software)
Hamilton, Ontario, Canada
TITLE:
Management and Processing of Vibration Data
AUTHOR:
Wisam Hussain
B.Eng., (Software Engineering)
Concordia University, Montreal, Canada
SUPERVISOR:
Dr. Martin von Mohrenschildt
NUMBER OF PAGES:
xiii, 97
ii
Abstract
Vibrating screens are mechanical machines used to sort granulated materials based
on their particle size. Utilized in the mining industry, these machines can sort tonnes
of materials per hour. In the past, McMaster University developed sensor devices
that measure and transmit vibration data of these machines to a central data acquisition unit for analysis, tuning, and maintenance purposes. In this thesis, I present
the development of two new software systems that are used to process, manage, and
present the information gained from these measurements. The first system, the offline vibration analysis software, is used to analyze the vibration data in both time
and frequency domain, and presents the measured and calculated data in textual and
graphical forms. The second system, the online vibration analysis software, is used by
vibrating screens manufacturers and their customers to gather and manage vibration
data collected from their vibrating screens by utilizing a central storage. The development process of these systems followed an iterative and incremental approach with
continuous feedback from stakeholders. It included extensive requirements gathering
to define a model, in terms of data representation, that captures the business logic
and practices of the industry. Furthermore, it used standard architectures such as
Model View Controller (MVC) and advanced technologies such as Object Relationship
Mapping (ORM) for data access to increase flexibility and maintainability. Finally,
iii
comprehensive unit testing and thorough security risks evaluation were conducted in
order to ensure that these systems are secure and bug free.
iv
Acknowledgements
I would like to express my gratitude to Dr. Martin von Mohrenschildt for his guidance and support during the research and writing of this thesis. Also, I would like to
thank W.S.Tyler for their financial support and their technical expertise in the field
of vibration analysis. In particular, I would like to thank Dieter Takev and Markus
Kopper for their continuous input, suggestions, and feedback. Their invaluable contributions have made this thesis possible. Finally, I am thankful to my parents and
my two sisters for their patience and support during my studies.
v
Contents
Abstract
iii
Acknowledgements
v
List of Tables
x
List of Figures
xi
1 Introduction
1
1.1
Thesis Motivation . . . . . . . . . . . . . . . . . . . . . . . . . . . . .
1
1.2
Thesis Objective . . . . . . . . . . . . . . . . . . . . . . . . . . . . .
4
1.3
Thesis Contributions . . . . . . . . . . . . . . . . . . . . . . . . . . .
4
1.4
Thesis Overview . . . . . . . . . . . . . . . . . . . . . . . . . . . . . .
5
2 Background of Vibration Analysis
6
2.1
Introduction . . . . . . . . . . . . . . . . . . . . . . . . . . . . . . . .
6
2.2
Variable Summary . . . . . . . . . . . . . . . . . . . . . . . . . . . .
10
2.3
User Defined Variables . . . . . . . . . . . . . . . . . . . . . . . . . .
12
2.3.1
Machine Inclination . . . . . . . . . . . . . . . . . . . . . . . .
13
Measured Data Variables . . . . . . . . . . . . . . . . . . . . . . . . .
13
2.4
vi
2.4.1
2.5
2.6
Calibrated Data . . . . . . . . . . . . . . . . . . . . . . . . . .
13
Processed Data Variables . . . . . . . . . . . . . . . . . . . . . . . . .
14
2.5.1
DC Filter . . . . . . . . . . . . . . . . . . . . . . . . . . . . .
14
2.5.2
Butterworth Filter . . . . . . . . . . . . . . . . . . . . . . . .
14
2.5.3
Fast Fourier Transform (FFT) . . . . . . . . . . . . . . . . . .
15
Calculated Variables . . . . . . . . . . . . . . . . . . . . . . . . . . .
15
2.6.1
Nodal Variables . . . . . . . . . . . . . . . . . . . . . . . . . .
16
2.6.2
Global Variables . . . . . . . . . . . . . . . . . . . . . . . . .
18
3 Requirements
19
3.1
Overview . . . . . . . . . . . . . . . . . . . . . . . . . . . . . . . . . .
19
3.2
Functional Requirements . . . . . . . . . . . . . . . . . . . . . . . . .
21
3.2.1
Offline Vibration Analysis Software . . . . . . . . . . . . . . .
21
3.2.2
Online Vibration Analysis Software . . . . . . . . . . . . . . .
27
Non Functional Requirements . . . . . . . . . . . . . . . . . . . . . .
30
3.3.1
Offline Vibration Analysis Software . . . . . . . . . . . . . . .
30
3.3.2
Online Vibration Analysis Software . . . . . . . . . . . . . . .
31
3.3
4 Design
32
4.1
Technology . . . . . . . . . . . . . . . . . . . . . . . . . . . . . . . .
32
4.2
Offline Vibration Analysis Software . . . . . . . . . . . . . . . . . . .
35
4.3
Online Vibration Analysis Software . . . . . . . . . . . . . . . . . . .
38
4.4
Database . . . . . . . . . . . . . . . . . . . . . . . . . . . . . . . . . .
42
5 Implementation
5.1
45
Frameworks . . . . . . . . . . . . . . . . . . . . . . . . . . . . . . . .
vii
46
5.1.1
ASP.NET MVC Framework . . . . . . . . . . . . . . . . . . .
46
5.1.2
Entity Framework . . . . . . . . . . . . . . . . . . . . . . . . .
47
5.2
Build System . . . . . . . . . . . . . . . . . . . . . . . . . . . . . . .
48
5.3
Offline Vibration Analysis Software . . . . . . . . . . . . . . . . . . .
50
5.4
Online Vibration Analysis Software . . . . . . . . . . . . . . . . . . .
58
6 Security
61
6.1
Hypertext Transport Protocol (HTTP) . . . . . . . . . . . . . . . . .
62
6.2
Authentication . . . . . . . . . . . . . . . . . . . . . . . . . . . . . .
63
6.3
Authorization . . . . . . . . . . . . . . . . . . . . . . . . . . . . . . .
66
6.4
Cross-Site Scripting (XSS) . . . . . . . . . . . . . . . . . . . . . . . .
67
6.5
Cross-Site Request Forgery (XSRF) . . . . . . . . . . . . . . . . . . .
68
6.6
SQL Injection . . . . . . . . . . . . . . . . . . . . . . . . . . . . . . .
70
6.7
Restrict URL Access . . . . . . . . . . . . . . . . . . . . . . . . . . .
71
6.8
Other . . . . . . . . . . . . . . . . . . . . . . . . . . . . . . . . . . .
72
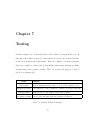
7 Testing
74
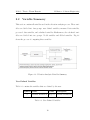
7.1
Unit Testing . . . . . . . . . . . . . . . . . . . . . . . . . . . . . . . .
75
7.2
Functional and Non Functional Tests . . . . . . . . . . . . . . . . . .
76
7.2.1
Mathematical Model . . . . . . . . . . . . . . . . . . . . . . .
77
7.2.2
Database and XML . . . . . . . . . . . . . . . . . . . . . . . .
77
7.2.3
User Interface . . . . . . . . . . . . . . . . . . . . . . . . . . .
77
7.2.4
External Libraries . . . . . . . . . . . . . . . . . . . . . . . . .
77
7.2.5
Other . . . . . . . . . . . . . . . . . . . . . . . . . . . . . . .
77
viii
8 Conclusion
78
8.1
Discussion . . . . . . . . . . . . . . . . . . . . . . . . . . . . . . . . .
78
8.2
Future Work . . . . . . . . . . . . . . . . . . . . . . . . . . . . . . . .
79
A Offline Vibration Analysis Software
80
A.1 Installation . . . . . . . . . . . . . . . . . . . . . . . . . . . . . . . .
81
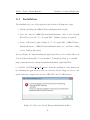
A.2 User Manual . . . . . . . . . . . . . . . . . . . . . . . . . . . . . . . .
82
B Online Vibration Analysis Software
87
B.1 Deployment . . . . . . . . . . . . . . . . . . . . . . . . . . . . . . . .
88
B.2 User Manual . . . . . . . . . . . . . . . . . . . . . . . . . . . . . . . .
89
C Bibliography
95
ix
List of Tables
2.1
Vibration Analysis Constants . . . . . . . . . . . . . . . . . . . . . .
6
2.2
Vibration Analysis Common Notations . . . . . . . . . . . . . . . . .
7
2.3
User Defined Variables . . . . . . . . . . . . . . . . . . . . . . . . . .
10
2.4
Measured Data Variables . . . . . . . . . . . . . . . . . . . . . . . . .
11
2.5
Processed Data Variables . . . . . . . . . . . . . . . . . . . . . . . . .
11
2.6
Calculated Nodal Variables . . . . . . . . . . . . . . . . . . . . . . . .
12
2.7
Calculated Global Variables . . . . . . . . . . . . . . . . . . . . . . .
12
4.1
Technology Stack Choices . . . . . . . . . . . . . . . . . . . . . . . .
33
4.2
Web Browser Statistics . . . . . . . . . . . . . . . . . . . . . . . . . .
35
4.3
Screen Resolution Statistics . . . . . . . . . . . . . . . . . . . . . . .
35
5.1
Offline Vibration Analysis Software Classes - Part 1 . . . . . . . . . .
51
5.2
Offline Vibration Analysis Software Classes - Part 2 . . . . . . . . . .
52
5.3
Offline Vibration Analysis Software Classes - Part 3 . . . . . . . . . .
53
5.4
Offline Vibration Analysis Software Classes - Part 4 . . . . . . . . . .
54
5.5
Online Vibration Analysis Software Classes - Part 1 . . . . . . . . . .
59
5.6
Online Vibration Analysis Software Classes - Part 2 . . . . . . . . . .
60
7.1
Software Testing Techniques . . . . . . . . . . . . . . . . . . . . . . .
74
x
List of Figures
1.1
Projects Timeline . . . . . . . . . . . . . . . . . . . . . . . . . . . . .
2
1.2
Vibrating Screen . . . . . . . . . . . . . . . . . . . . . . . . . . . . .
3
1.3
Vibration Analysis Software . . . . . . . . . . . . . . . . . . . . . . .
3
2.1
Measurement Locations on a Two Bearing Machine . . . . . . . . . .
8
2.2
Measurement Locations on a Four Bearing Machine . . . . . . . . . .
8
2.3
Right Side View of a Machine . . . . . . . . . . . . . . . . . . . . . .
9
2.4
Top View of a Machine . . . . . . . . . . . . . . . . . . . . . . . . . .
9
2.5
Rear View of a Machine . . . . . . . . . . . . . . . . . . . . . . . . .
9
2.6
Vibration Analysis Variables Summary . . . . . . . . . . . . . . . . .
10
2.7
Machine Inclination . . . . . . . . . . . . . . . . . . . . . . . . . . . .
13
3.1
Iterative and Incremental Development Approach . . . . . . . . . . .
20
4.1
Microsoft .Net Framework . . . . . . . . . . . . . . . . . . . . . . . .
34
4.2
Offline Vibration Analysis Software Classes . . . . . . . . . . . . . . .
37
4.3
Offline Vibration Analysis Software Dependencies . . . . . . . . . . .
38
4.4
Model View Controller Architecture . . . . . . . . . . . . . . . . . . .
39
4.5
Online Vibration Analysis Software Dependencies . . . . . . . . . . .
40
4.6
Online Vibration Analysis Software Classes . . . . . . . . . . . . . . .
41
4.7
Database Design . . . . . . . . . . . . . . . . . . . . . . . . . . . . .
43
xi
5.1
ASP.NET MVC Framework . . . . . . . . . . . . . . . . . . . . . . .
46
5.2
Entity Framework . . . . . . . . . . . . . . . . . . . . . . . . . . . . .
47
5.3
MSBuild Project File . . . . . . . . . . . . . . . . . . . . . . . . . . .
49
5.4
Offline Vibration Analysis Software Directory Structure . . . . . . . .
50
5.5
Sample XML File . . . . . . . . . . . . . . . . . . . . . . . . . . . . .
55
5.6
XML Schema Definition - 1 . . . . . . . . . . . . . . . . . . . . . . .
56
5.7
XML Schema Definition - 2 . . . . . . . . . . . . . . . . . . . . . . .
57
5.8
Online Vibration Analysis Software Directory Structure . . . . . . . .
58
6.1
HTTP Request and Response . . . . . . . . . . . . . . . . . . . . . .
62
6.2
Forms Authentication . . . . . . . . . . . . . . . . . . . . . . . . . . .
65
7.1
DC Filter Test Case . . . . . . . . . . . . . . . . . . . . . . . . . . .
75
7.2
DC Filter Test Case Result
. . . . . . . . . . . . . . . . . . . . . . .
76
A.1 Microsoft .Net 4.0 Framework Initialization Error . . . . . . . . . . .
81
A.2 Offline Vibration Analysis Software Menu Items . . . . . . . . . . . .
82
A.3 Offline Vibration Analysis Software Main View . . . . . . . . . . . . .
85
A.4 Offline Vibration Analysis Forms View . . . . . . . . . . . . . . . . .
86
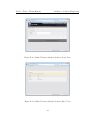
B.5 Online Vibration Analysis Software FTP View . . . . . . . . . . . . .
88
B.6 Online Vibration Analysis Software Text View . . . . . . . . . . . . .
91
B.7 Online Vibration Analysis Software List View . . . . . . . . . . . . .
91
B.8 Online Vibration Analysis Software Create View . . . . . . . . . . . .
92
B.9 Online Vibration Analysis Software Edit View . . . . . . . . . . . . .
92
B.10 Online Vibration Analysis Software Details View . . . . . . . . . . . .
93
B.11 Online Vibration Analysis Software Delete View . . . . . . . . . . . .
93
B.12 Online Vibration Analysis Software Login View . . . . . . . . . . . .
94
xii
B.13 Online Vibration Analysis Software Error View . . . . . . . . . . . .
xiii
94
Chapter 1
Introduction
1.1
Thesis Motivation
Vibrating screens are mechanical machines used, in the mining industry, to separate
granulated materials based on particle size. Materials processed by these machines
range from fine materials such as sand, chemicals, and fertilizers to coarse materials
such as coal and phosphate rocks. To prevent such machines from failing and to
reduce the cost of maintenance, the field of vibration analysis was developed [2]. The
Computing and Software Engineering Department of McMaster University was approached in 2006 by a manufacturer of these machines to develop a vibration analysis
tool. The proposed vibration analysis tool was able to measure, analyze, and display vibration data collected from eight simultaneous sensors attached to a vibrating
screen [19]. After deploying the vibration analysis tool in 2010, the manufacturing
company proposed the creation of two new software systems. The first system, the
offline vibration analysis software, will be used to analyze vibration data in time and
frequency domain. Furthermore, it will be used to display measured and computed
1
M.A.Sc. Thesis - Wisam Hussain
McMaster - Software Engineering
data in textual and graphical forms. Whereas the second system, the online vibration
analysis software, will be used to store vibration data in a central database and provide a web based user interface to access these data to authorized users. The objective
of this thesis is to utilize the knowledge acquired in previous projects to develop the
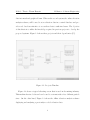
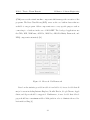
proposed systems. Figure 1.1 shows these projects and their dependencies [15].
Figure 1.1: Projects Timeline
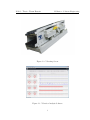
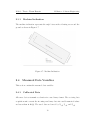
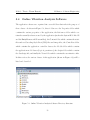
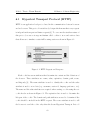
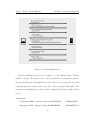
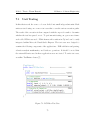
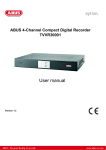
Figure 1.2 shows a typical vibrating screen that is used in the mining industry.
This machine has two decks and can be used to sort materials of two different particle
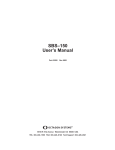
sizes. On the other hand, Figure 1.3 shows the offline vibration analysis software
displaying and analyzing a previously recorded vibration data.
2
M.A.Sc. Thesis - Wisam Hussain
McMaster - Software Engineering
Figure 1.2: Vibrating Screen
Figure 1.3: Vibration Analysis Software
3
M.A.Sc. Thesis - Wisam Hussain
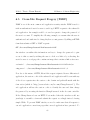
1.2
McMaster - Software Engineering
Thesis Objective
The goal of this thesis is to develop the proposed systems for the purpose of vibration analysis. The offline vibration analysis software should be able to perform the
following tasks in order to fulfill the proposed requirements:
• Convert data from the old text files format to the newly created XML format
• Validate the content of XML files using an XML Schema Definition (XSD) file
• Process the data by applying filters, FFT transformation, and ellipse fitting
• Compute nodal and global variables such as operating frequency and stroke
where nodal variables are sensor specific and global variable are machine specific
• Plot the measured and processed data using orbit, waveform, and FFT charts
On the other hand, the online vibration analysis software should be able to perform
the following tasks in order to fulfill the proposed requirements:
• Provide public web pages to promote the software to potential customers
• Utilize a central database to store data such as users, machines, records, etc
and provide a web based user interface to view, add, update, and delete data
• Implement security features that deal with access controls list (ACL), cross site
request forgery (CSRF), cross site scripting (XSS), and SQL injection attacks
1.3
Thesis Contributions
The main contribution of this thesis is the development the proposed applications.
This includes gathering the requirements and defining the business model behind it.
4
M.A.Sc. Thesis - Wisam Hussain
McMaster - Software Engineering
Also, it includes the design, implementation, and testing of these applications using
an iterative and incremental development approach.
1.4
Thesis Overview
This thesis work is divided into the following chapters, in order, to reflect the software
development life cycle (SDLC) used in realizing these two applications:
Chapter 2 discusses the mathematical model used in performing vibration analysis
Chapter 3 enlists, in details, the features provided by the applications (functional
requirements) and the operational constraints (non-functional requirements)
Chapter 4 discusses technology choices and architectural design decisions. Also, it
explains how the major components of the applications interact with each other
Chapter 5 describes the implementation of both applications and provides a brief
documentation of the main classes (excluding external libraries)
Chapter 6 discusses, in details, the security features considered and implemented
Chapter 7 explains and provides an examples on how unit testing was utilized
Chapter 8 provides a conclusion for this thesis and discusses suggested future work
Appendix A provides a user manual for the offline vibration analysis software
Appendix B provides a user manual for the online vibration analysis software
5
Chapter 2
Background of Vibration Analysis
This chapter contains the mathematical model used to perform vibration analysis. It
includes six sections that describe in details the constants, common notations, variables, parameters, algorithms, and equations used in the vibration analysis process.
Furthermore, this chapters includes information on the measurement locations used
to mount the sensor devices and the coordinate system utilized to describe directions.
2.1
Introduction
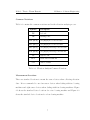
Constants
Table 2.1 contains the constants used in the vibration analysis process.
Symbol
Value
Unit Description
G
9.81
m/s2
Fs
500
Hz
Gravity
Sampling rate
Table 2.1: Vibration Analysis Constants
6
M.A.Sc. Thesis - Wisam Hussain
McMaster - Software Engineering
Common Notations
Table 2.2 contains the common notations used in the vibration analysis process.
Symbol
Description
FE
Feed-end
DE
Discharge-end
LFB (RFB)
Left (Right) Feed-end Bracket
LFS (RFS)
Left (Right) Feed-end Sidearm
LDS (RDS)
Left (Right) Discharge-end Sidearm
LDB (RDB)
Left (Right) Discharge-end Bracket
DC
Digital Comb
FFT
Fast Fourier Transform
CM
Center of Mass
Table 2.2: Vibration Analysis Common Notations
Measurement Locations
There are standard locations to mount the sensor devices when collecting vibration
data. It is recommended to use four sensor devices when dealing with two bearing
machines and eight sensor devices when dealing with four bearing machines. Figure
2.1 shows the standard device locations for a two bearing machine and Figure 2.2
shows the standard device locations for a four bearing machine.
7
M.A.Sc. Thesis - Wisam Hussain
McMaster - Software Engineering
Figure 2.1: Measurement Locations on a Two Bearing Machine
Figure 2.2: Measurement Locations on a Four Bearing Machine
Coordinate System
A traditional cartesian coordinate system is used to indicate directions. In this system, the X axis coincides with the flow of the material on the machine, the Y axis is
perpendicular to the screen plane, and the Z axis is perpendicular to both the X axis
and the Y axis. In this system, when standing at the right side of the machine in the
positive Z axis looking at the X and Y axes we will be presented with the right side
view which is represented in Figure 2.3. When hovering above the machine in the
8
M.A.Sc. Thesis - Wisam Hussain
McMaster - Software Engineering
positive Y axis looking at the X and Z axes we will be presented with the top view
which is represented in Figure 2.4. Finally, when standing behind the machine in the
negative X axis looking at the Y and Z axes we will be presented with the rear view
which is represented in Figure 2.5.
Figure 2.3: Right Side View of a Machine
Figure 2.4: Top View of a Machine
Figure 2.5: Rear View of a Machine
9
M.A.Sc. Thesis - Wisam Hussain
2.2
McMaster - Software Engineering
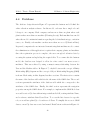
Variable Summary
This section contains all variables used in the vibration analysis process. These variables are divided into four groups: user defined variables, measured data variables,
processed data variables, and calculated variables. Furthermore, the calculated variables are divided into two groups: Nodal variables and Global variables. Fig 2.6
shows the process of computing these variables.
Figure 2.6: Vibration Analysis Variables Summary
User Defined Variables
Table 2.3 contains the variables that are defined by the user.
Symbol
β
Name
Units
Description
Machine Inclination Degrees Machine inclination
Table 2.3: User Defined Variables
10
M.A.Sc. Thesis - Wisam Hussain
McMaster - Software Engineering
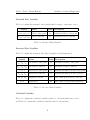
Measured Data Variables
Table 2.4 contains the measured data variables that belongs to each sensor device.
Symbol
Name
Units Description
xcal , ycal , zcal
G-Force data point
G
Calibrated G-Force data point
Xcal , Ycal , Zcal
G-Force data set
G
Calibrated G-Force data set
Table 2.4: Measured Data Variables
Processed Data Variables
Table 2.5 contains the measured data after being filtered and transformed.
Symbol
Name
Units Description
xdc , ydc , zdc
DC G-Force data point
G
DC filtered G-Force data point
Xdc , Ydc , Zdc
DC G-Force data set
G
DC filtered G-Force data set
BW G-Force data point
G
Butterworth filtered G-Force data point
Xn , Yn , Zn
BW G-Force data set
G
Butterworth filtered G-Force data set
Fx , Fy , Fz
Frequency content
n/a
FFT result from a G-Force data set
Frequencies
Hz
FFT result corresponding frequencies
xi , yi , zi
f reqs
Table 2.5: Processed Data Variables
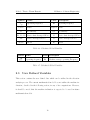
Calculated Variables
Table 2.6 contains the calculated variables related to each individual sensor device
and Table 2.7 contains the calculated variables related to the machine.
11
M.A.Sc. Thesis - Wisam Hussain
Symbol
fop
P hase
E
McMaster - Software Engineering
Name
Units
Operating frequency
Hz
Phase
MG
Stroke
Operating frequency
degrees Phase
Eccentricity
XG , YG , ZG
Description
n/a
Eccentricity
Device Axis Average G-Force
G
Device Axis Average G-Force
Device Average G-Force
G
Device Average G-Force
Stroke
m
Stroke
Table 2.6: Calculated Nodal Variables
Symbol
cm
fop
Name
Units Description
Operating frequency
Hz
Machine average operating Frequency
Table 2.7: Calculated Global Variables
2.3
User Defined Variables
This section contains the user defined data which can be utilized in the vibration
analysis process. The current mathematical model does not utilize the machine inclination, described in the following section, in any of its computations. However,
it should be noted that the machine inclination is expected to be used in future
mathematical models.
12
M.A.Sc. Thesis - Wisam Hussain
2.3.1
McMaster - Software Engineering
Machine Inclination
The machine inclination represents the angle between the vibrating screen and the
ground as shown in Figure 2.7
Figure 2.7: Machine Inclination
2.4
Measured Data Variables
This section contains the measured data variables.
2.4.1
Calibrated Data
All sensor devices transmit acceleration in a raw binary format. The receiving data
acquisition unit converts the incoming raw binary data into usable numerical values
and saves them in file(s). The saved data are denoted by Xcal , Ycal , and Zcal .
13
M.A.Sc. Thesis - Wisam Hussain
2.5
McMaster - Software Engineering
Processed Data Variables
This section contains the filters and the transformations used on the measured data
variables described in the previous section.
2.5.1
DC Filter
Inputs: Xcal (Ycal or Zcal )
Outputs: Xdc (Ydc or Zdc )
The gravity component is removed from the measured data using a DC filter [9].
The following algorithm is applied to each data point to achieve the task.
xscaled = xcurrent − xprevious + 0.98 ∗ xscaled previous
xprevious = xcurrent
xscaled previous = xscaled
It should be noted that the strength of the filter is R = 0.98 (selected experimentally).
2.5.2
Butterworth Filter
Inputs: Fs , fop and Xdc (Ydc or Zdc )
Outputs: Xn (Yn or Zn )
The noise component is removed from the DC filtered data by using a bandpass
Butterworth filter [9]. In this mathematical model, a fourth order bandpass Butterworth filter is used that takes into account the sampling rate Fs and the operating
frequency fop of the axis it is filtering. The X axis and the Y axis are filtered using
14
M.A.Sc. Thesis - Wisam Hussain
McMaster - Software Engineering
their own operating frequency fop whereas the Z axis is filtered using the X axis
operating frequency fop . This is done to study the Z acceleration associated with
the main operating frequency.
2.5.3
Fast Fourier Transform (FFT)
Inputs: Fs and Xdc (Ydc or Zdc )
Outputs: f reqs and Fx (Fy or Fz )
Fast Fourier Transform is used to convert the DC filtered data from the time domain to the frequency domain [3]. The first step is to calculate the frequencies that
can be represented in the FFT using the following equations:
div = Fs / FFTsize (Calculates bin spacing)
−2
) ∗ div] (Calculates FFT frequencies)
f reqs = [1 ∗ div, 2 ∗ div, 3 ∗ div, ..., ( FFTSize
2
The second step is to calculate the amplitude of each frequency present in f reqs using
the following equations:
f ullF F T = f f t(Xdc , F F T size) (Performs FFT on data)
half F F T = f ullF F T [1, 2, 3, ...,
F F T size−2
]
2
(keep first half - sampling theorem [20])
Fx = abs(half F F T ) (Removes negative sign)
2.6
Calculated Variables
This section contains the equations and algorithms used to compute the calculated
variables. The calculated variables can be either sensor specific or machine specific.
15
M.A.Sc. Thesis - Wisam Hussain
McMaster - Software Engineering
Sensor specific variables are called nodal variables whereas machine specific variables
are called global variables.
2.6.1
Nodal Variables
This section contains the nodal variables calculated for each sensor device.
Operating Frequency
Inputs: Fx (Fy )
Outputs: fop
The operating frequency of a sensor device is the frequency that corresponds to the
highest amplitude present in the Fast Fourier Transform (FFT) result. The selected
frequency is not accurate since the FFT examine a finite set of frequencies. In order to improve the accuracy of the operating frequency, a polynomial interpolation
is used. The polynomial interpolation requires three points where the second point
corresponds to the maximum amplitude (m2 = max(FX )) and the other two points
corresponds to the previous point and the next point. These three points are defined
as [(f1 , m1 ), (f2 , m2 ), (f3 , m3 )] and are used to compute the polynomial interpolation
using the following equations:
a = m1 ∗ f3 − m3 ∗ f1 − m1 ∗ f2 + m3 ∗ f2 − m2 ∗ f3 + m2 ∗ f1
b = m3 ∗ f1 2 − m2 ∗ f1 2 − m3 ∗ f2 2 + m1 ∗ f2 2 − m1 ∗ f3 2 + m2 ∗ f3 2
fop = − b/a
2
16
M.A.Sc. Thesis - Wisam Hussain
McMaster - Software Engineering
Phase and Eccentricity
Inputs: Xn , Yn
Outputs: P , E
An ellipse fitting algorithm is used to calculate the phase and the eccentricity of
sensor devices in the XY axes, ZX axes, and the ZY axes [8] [6]. The calculated
eccentricity is used to deduce the motion of the device where an eccentricity close to
zero would indicate a circular motion and an eccentricity close to one would indicate
an elliptical motion. The calculated phase indicates the degrees between the major
axis of the ellipse and the X axis. Positive value requires clockwise rotation of the
ellipse to align the major axis with the x axis and the negative values requires counter
clockwise rotation.
Average Accelerations
Inputs: Xn , Yn , Zn
Outputs: XG , YG , ZG , MG
For each sensor, we calculate four average accelerations: XG , YG , ZG , MG . The
XG , YG , ZG represents the average acceleration of the sensor device in the X axis, Y
axis, and Z axis respectively and are calculated using the following equations:
XG = (|max(Xn )| + |min(Xn )|)/2
YG = (|max(Yn )| + |min(Yn )|)/2
ZG = (|max(Zn )| + |min(Zn )|)/2
The MG represents the average acceleration of the sensor device and is calculated
17
M.A.Sc. Thesis - Wisam Hussain
McMaster - Software Engineering
using a single pair (x,y) from Xn , Yn that yields the largest value using the following
equation: MG =
q
xi 2 + yi 2 (Pythagorean theorem)
Stroke
Inputs: fop and MG
Outputs: Stroke
The stroke is calculated using ( Stroke = MG /2 ∗ fop 2 ) which is derived below:
F = m ∗ r ∗ fop 2 = m ∗ a (equating angular and tangential accelerations)
r ∗ fop 2 = a (cancelling m on both sides)
r = a/fop 2 (dividing both sides by fop 2 )
r = MG /fop 2 (replacing a with the sensor main acceleration MG )
Stroke = MG /2 ∗ fop 2 (divide both side by 2 and replacing r/2 with stroke)
2.6.2
Global Variables
This section contains the global variables calculated for the machine.
Operating Frequency (CM)
Inputs: fop (for all n sensors)
cm
Outputs: fop
The machine operating frequency is calculated by taking the average of all the operating frequencies of all sensors.
cm = average(f , f , ..., f
fop
op 1 op 2
op n )
18
Chapter 3
Requirements
This chapter enlists the functional and non functional requirements of the two systems
developed as part of this thesis work. The first system, the offline vibration analysis
software, is used to read, analyze, compute, and plot the vibration data of a machine.
The graphical and textual representation of the computed and measured data are used
by trained technicians to determine the status of a machine. Based on the results,
the machine is tuned to improve its performance and to prevent failure. The second
system, the online vibration analysis software, is used to collect and manage data such
as users, roles, machines and records by utilizing a central database. Furthermore,
It provides a web based user interface to authorized user to view, add, update, and
delete these data.
3.1
Overview
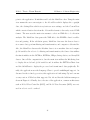
The development of both applications followed an iterative and incremental approach.
The features of both applications were listed by priority and divided into small subsets
19
M.A.Sc. Thesis - Wisam Hussain
McMaster - Software Engineering
where each subset takes approximately one man-month to complete. Each iteration
goes through the requirement, analysis, design, implementation, and testing phases
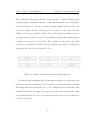
as shown in Figure 3.1. In a more advanced setting, multiple iteration can be executed concurrently when the feature sets do not depend on each other and when
multiple developers are available. At the end of each iteration, a working version of
the application is produced and used in our monthly meeting with the manufacturing
company (our sponsor) to get feedback. The continuous feedback from the client
made the development more flexible and less costly since problems were identified at
early stages and therefore less expensive to fix.
Figure 3.1: Iterative and Incremental Development Approach
The iterative and incremental approach has many advantages over rigid approaches
such as the classical waterfall model. The iterative and incremental approach makes
risk management more manageable due to the continuous feedback from the client
and makes testing and debugging of the applications easier due to the small size of the
development iteration. Moreover, development iterations can be used as a milestones
to track progress [18].
20
M.A.Sc. Thesis - Wisam Hussain
3.2
McMaster - Software Engineering
Functional Requirements
This section enlists the functional requirements of both applications. These requirements describe the functionalities that the applications provide to their users. Each
functionality or set of functionalities will be translated to a piece of code in the implementation phase [18]. The following requirements are divided into groups based
on their purpose within the application.
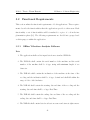
3.2.1
Offline Vibration Analysis Software
Data
1. The application shall read its input data from a standard XML file.
2. The XML file shall contain the serial number of the machine and the serial
number of the machine shall be of type string with minimum length of one
character.
3. The XML file shall contain the inclination of the machine at the time of the
recoding and the inclination shall be of type decimal and shall fall within the
range of 0.0 to 360.0 inclusive.
4. The XML file shall contain the starting date and time of the recoding and the
starting date and time shall be of type DateTime.
5. The XML file shall contain the ending date and time of the recording and the
ending date and time shall be of type DateTime
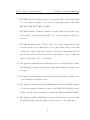
6. The XML file shall contain data for at least one sensor and at most eight sensors.
21
M.A.Sc. Thesis - Wisam Hussain
McMaster - Software Engineering
7. The XML file shall contain the name of each present sensor and the name shall
be of type string and shall be one of the following eight values: LFB, RFB,
LFS, RFS, LDS, RDS, LDB, and RDB.
8. The XML file shall contain the orientation of each present sensor and the orientation shall be of type string and shall be one of the following two values: Top
and Side.
9. The XML file shall contain a G-Force data set for each present sensor and each
set shall contain at least 4096 G-Force data points. Each G-Force data point
contains three values which represents the acceleration of the machine in the X
axis, Y axis, and Z axis. Each of the three values shall be of type decimal and
shall be in the range of -11 to 11 inclusive.
10. The application shall validate the XML file prior to processing its data to ensure
that all required values are present and to ensure that all values are of the correct
data type.
11. The application shall display an error message and a line number when an error
occurs during the validation process.
12. The application shall use the standard XML Schema Definition (XSD) language
to define the structure, elements and types of the XML. The XSD will be saved
in a file and will be used at runtime to compare the XML file with the XSD file.
13. The application shall benchmark the reading and validation process of the XML
file and shall display the time elapsed in the status bar of the application.
22
M.A.Sc. Thesis - Wisam Hussain
McMaster - Software Engineering
14. The application shall provide a conversion utility that can be used to convert
data files from the old format (text files) to the new format (single XML file).
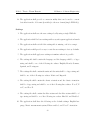
Settings
1. The application shall save the user settings locally using a single XML file.
2. The application shall load user settings with every subsequent application launch.
3. The application shall not fail if the settings file is missing or if it is corrupt.
4. The application shall provide a way to reset the user settings to factory defaults.
5. The application shall apply user settings at runtime when it is possible.
6. The settings file shall contain the language and the language shall be of type
string and shall be one of the following five values: English, French, German,
Spanish, and Portuguese.
7. The settings file shall contain the units and the units shall be of type string and
shall be one of the following two values: Metric and Imperial.
8. The setting file shall contain the charts orientation and the charts orientation
shall be of type string and shall be one of the following three values: X vs Y, Z
vs Y, and Z vs X.
9. The setting file shall contain the filter status and the filter status shall be of
type string and shall be on of the following two values: Enabled and Disabled.
10. The application shall have the following as the default settings: English language, Metric measurement system, Filters enabled, and X vs Y orientation.
23
M.A.Sc. Thesis - Wisam Hussain
McMaster - Software Engineering
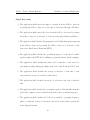
Signal Processing
1. The application shall remove the impact of gravity from the G-Force data sets
by passing the G-Force data set of each axis of each sensor through a DC filter.
2. The application shall remove the noise from the G-Force data sets by passing
the G-Force data set of each axis of each sensor through a Butterworth filter.
3. The application shall calculate the magnitudes of the different frequencies present
in the G-Force data sets by passing the G-Force data set of each axis of each
sensor in a Fast Fourier Transform (FFT).
4. The application shall calculate the operating frequency of each sensor by utilizing the results of the FFT and by utilizing a polynomial interpolation technique.
5. The application shall calculate the phase and eccentricity of each sensor by
performing an ellipse fitting algorithm on the data of the X axis and the Y axis.
6. The application shall calculate the average acceleration of each axis of each
sensor and the average acceleration of the sensor.
7. The application shall calculate the stroke of each sensor and each of its three
axis.
8. The application shall calculate the operating frequency of the machine using the
previously computed sensor variables such as the sensor operating frequency.
9. The application shall calculate all of the above variables: operating frequency,
phase, eccentricity, average acceleration, and stroke in the metric system and
in the imperial system.
24
M.A.Sc. Thesis - Wisam Hussain
McMaster - Software Engineering
Display
1. The application shall display an orbit chart for each sensor where the orbit
chart can be used to plot the motion of the machine using the filtered or the
unfiltered G-Force data sets of the X vs Y axes, Z vs X axes, and Z vs Y axes.
2. The application shall display the FFT charts of each sensor where the FFT
charts are used to plot the X, Y, and Z G-Force data sets in the frequency
domain.
3. The application shall display the waveform charts of each sensor where the
waveform charts are used to plot the filtered or the unfiltered G-Force data sets
of the X, Y, and Z axes.
4. The application shall allow the user to zoom-in and zoom-out of charts and the
zooming should be synchronized between the X-FFT, Y-FFT, Z-FFT charts as
well as X-Waveform, Y-Waveform, and Z-Waveform charts.
5. The application shall provide a tooltip to format and display the value of the
selected G-Force data point in the the orbit, the FFT, and the waveform charts.
6. The application shall display the operating frequency, phase, eccentricity, and
stroke of each present sensor. Moreover, the application shall display the operating frequency of the machine.
7. The application shall display all of the above variables: operating frequency,
phase, eccentricity, average acceleration, drive inclination, and stroke in the
metric system and in the imperial system.
8. The application shall display the time used to process the XML file content.
25
M.A.Sc. Thesis - Wisam Hussain
McMaster - Software Engineering
9. The application shall display orbit charts, FFT charts, waveform charts, and
the calculated nodal and global variables on the screen.
10. The application shall use different colors to indicate that the chart is showing
data in the time domain or in the frequency domain.
11. The application shall provide the user with a dialog box to select an existing
XML file from the local file system. Moreover, the dialog box shall filter the
files to show only those with .xml extension.
12. The application shall allow the user to edit the application settings graphically.
13. The application shall allow the user to convert files from the old format to the
new format graphically without the use of command line or external tools.
14. The application shall allow the user to edit the window layout by hiding/showing
the orbit charts and hiding/showing the calculated variables.
15. The application shall display the author, the version and the copyright data.
16. The application shall provide keyboard shortcuts to all its menu items to increase the application usability.
17. The application shall be multilingual and shall support the following languages
out of the box: English, French, German, Spanish, and Portuguese where the
english language is the default application language.
18. The application shall resize all of its user interface controls such as the charts,
menu, status bar, etc when the application window is resized.
26
M.A.Sc. Thesis - Wisam Hussain
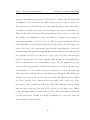
3.2.2
McMaster - Software Engineering
Online Vibration Analysis Software
Data
1. The application shall manage user roles by storing their data in the database
where each user role has a unique identifier of type integer and a unique name
of type string.
2. The application shall manage registered users by storing their data in the
database where each user has a unique identifier of type integer, a unique username of type string, a password of type string, a lock status of type boolean,
and an expiration date of type datetime.
3. The application shall manage registered companies by storing their data in the
database where each company has a unique identifier of type integer, a unique
name of type string, a geolocation of type string, an address line of type string,
a city of type string, a postal code of type string, a region of type string, a
country of type string, and a postal box of type string.
4. The application shall manage registered plants by storing their data in the
database where each plant has a unique identifier of type integer, a unique
name of type string, a geolocation of type string, an address line of type string,
a city of type string, a postal code of type string, a region of type string, a
country of type string, and a postal box of type string.
5. The application shall manage registered machines by storing their data in the
database where each machine has a unique identifier of type integer, a unique serial number of type string, a designation of type string, a width of type decimal,
27
M.A.Sc. Thesis - Wisam Hussain
McMaster - Software Engineering
a length of type decimal, and a number of decks of type integer.
6. The application shall manage machine records by storing their data in the
database where each record has a unique identifier of type integer, a starting time of type datetime, an ending time of type datetime, and the location of
the XML file that contains the recorded acceleration data points.
7. The application shall manage machine models by storing their data in the
database where each model has a unique identifier of type integer, a unique
name of type string, an excitation unit size of type integer, and a number of
excitation units of type integer.
8. The application shall manage the machine manufacturers by storing their data
in the database where each manufacturer has a unique identifier of type integer,
and a unique name of type string.
9. The application shall manage the excitation sources by storing their data in the
database where each excitation source has a unique identifier of type integer,
and a unique name of type string.
10. The application shall manage the deck inclination types by storing their data
in the database where each deck inclination type has a unique identifier of type
integer, and a unique name of type string.
11. The application shall provide all registered users with a dashboard to view user
specific statistical data such as the number of recodings per month, the number
of machine managed by the user, etc.
28
M.A.Sc. Thesis - Wisam Hussain
McMaster - Software Engineering
Display
1. The application shall use the role of the logged in user to determine what should
be displayed. In this project, we have three user groups namely the customers
group, the staff group, and the administrators group. Customers have access
to their account only, staff have access to all accounts, and administrators have
access to all data and all accounts.
2. The application shall display a list for each of the following data stored in the
database: roles, users, companies, plants, machines, records, models, manufacturers, excitation sources, and deck inclination types.
3. The application shall display the lists using pagination where each page display
ten tuples from the database and the user can use a Next and a Previous button
to navigate among the pages.
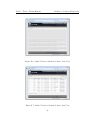
4. The application shall allow users to add/edit a tuple in the database by submitting an HTML form. The application shall validate the data and display an
error message for each field to indicated if the data is present and if it is of the
correct type.
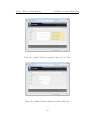
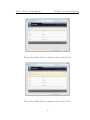
5. The application shall allow users to view/delete a tuple from the database by
submitting a request. The application shall ensure that the tuple exists before
attempting to show it or delete it.
6. The application shall handle errors by catching any exception that may occur
and by displaying the exception error message using a custom error page.
29
M.A.Sc. Thesis - Wisam Hussain
McMaster - Software Engineering
7. The application shall redirect anonymous and unauthorized users who are attempting to access restricted pages to the login page.
8. The application shall display the logo of the sponsoring company and it shall
display the name of the application in the banner section of each page.
3.3
Non Functional Requirements
This section enlists the non functional requirements of both applications. Non functional requirements describe the quality of the application and is used to judge the
operations of the application [18].
3.3.1
Offline Vibration Analysis Software
1. The application shall run on all modern Windows OS versions including Windows XP, Windows Vista, and Windows 7.
2. The application shall require minimal processing power, minimal memory, and
minimal storage. An acceptable configuration would be 1 GHz CPU, 512 MB
RAM, and few MBs for the application executable.
3. The application shall be fast where loading, validating, and processing of a
single XML file shall not require more than two seconds on an average machine.
4. The application shall be reliable such that exceptions are caught and handled
by the application. The application shall display the exception error to the user
for feedback.
30
M.A.Sc. Thesis - Wisam Hussain
McMaster - Software Engineering
5. The application shall be well structure and well documented to improve the
readability and the maintainability of the application.
6. The application shall provide a simple and easy to use graphical user interface
(GUI) by organizing the user control logically and by using color as a meta
data. An example of using colors as a meta data would be using the red color
for charts in the time domain and using the blue color for the charts in the
frequency domain.
3.3.2
Online Vibration Analysis Software
1. The application shall run in all major browsers such as Internet Explorer,
Mozilla Firefox, Apple Safari, Google Chrome, and Opera consistently.
2. The application shall use standard technologies such as XHTML, CSS, JavaScript
for its graphical user interface (GUI) and the application shall avoid non standard technologies such as Adobe Flash.
3. The application shall use the standard Model View Controller (MVC) design
pattern and shall be well documented to increase the readability and the maintainability of the application.
4. The application shall be fast when performing a tasks in order to increase the
number of concurrent requests that can be handled by the application at once.
5. The application shall be hosted on multiple servers in order to increase the reliability, throughput, and uptime. Also, the application database shall be backed
frequently as a safety measure to increase the recoverability of the application.
31
Chapter 4
Design
Software design is the process of planning how to build a system. It is one of the
main phases in the software development life cycle (SDLC) and it acts as a connector
between the requirements phase and the implementation phase. In this process, the
system is divided into classes and each class is assigned a set of responsibilities.
These classes interact with each other to achieve the functional and non functional
requirements of the system. In general, it is highly recommended to design classes to
have high cohesion and low coupling. This ensures that classes have a focused set of
responsibilities with minimal dependency on external resources such as other classes.
The ultimate goal of this process is to design a software that is easy to implement,
easy to understand, and easy to maintain.
4.1
Technology
This section discusses technology stacks used to develop the both applications. The
offline vibration analysis software is a desktop based application used to read, analyze,
32
M.A.Sc. Thesis - Wisam Hussain
McMaster - Software Engineering
compute, and plot vibration data. On the other hand, the online vibration analysis
software is a browser based application used as a central storage for vibration data.
In addition, it is used to manage users, roles, companies, etc. At the early stages of
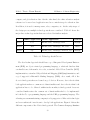
the design process, multiple technology stacks were considered. Table 4.1 shows the
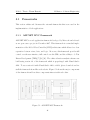
major three technology stacks that were selected for further analysis.
Offline Application
Online Application
Database
Stack 1
C++
HTML, CSS, JavaScript, PHP
MySQL
Stack 2
Java
HTML, CSS, JavaScript, JSP, Java
Oracle
Stack 3
C#
HTML, CSS, JavaScript, ASP.Net, C#
MSSQL
Table 4.1: Technology Stack Choices
The ideal technology stack should have a good Integrated Development Environment (IDE), an object-oriented programming language, a relational database that
can handle tens of thousands of records, a standard Model View Controller (MVC)
implementation, a standard Object Relational Mapping (ORM) implementation, and
a good support for Extensible Markup Language (XML). As a result, All of the
above technology stacks were deemed as good choices. However, due to the fact that
both applications have a common set of functionalities and due to the fact that both
application have to be delivered within twelve months, technology stack 1 was not
considered further since the common set of functionalities had to be implemented
in both the C++ programming language and the PHP programming language. The
vibrating screens manufacturing company is a big supporter of Microsoft technologies
and as a result stack 3 was chosen to develop both applications. Figure 4.1 shows the
different components of the .Net technology stack. The Common Language Runtime
33
M.A.Sc. Thesis - Wisam Hussain
McMaster - Software Engineering
(CLR) serves as the virtual machine component which manages the execution of the
programs. The Base Class Library (BCL) serves as the core built-in classes that are
available to any program. Other components serve a very specific purpose such as
connecting to a database in the case of ADO.NET. The developed applications use
the CLR, BCL, WinForms, ASP.Net, ADO.Net, ADO.Net Entity Framework, and
LINQ components extensively [12].
Figure 4.1: Microsoft .Net Framework
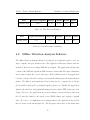
Based on the statistics provided in table 4.2 and table 4.3, it was decided that all
major browsers including Internet Explorer, Mozilla Firefox, Google Chrome, Apple
Safari, and Opera should be supported. Furthermore, it was decided that all web
pages should have a maximum width of 1024 pixels in order to eliminate the need for
horizontal scrolling [4].
34
M.A.Sc. Thesis - Wisam Hussain
Date
McMaster - Software Engineering
Internet Explorer Firefox Chrome
January 2012
20.1%
37.1%
35.3%
Safari Opera
4.3%
2.4%
Table 4.2: Web Browser Statistics
Date
Higher Resolution
1024x768
800x600
640x480
January 2012
85%
13%
1%
0%
Other
1%
Table 4.3: Screen Resolution Statistics
4.2
Offline Vibration Analysis Software
The offline vibration analysis software is a desktop based application used to read, analyze, compute, and plot vibration data. The application takes user defined data and
measured data stored in a single XML file as an input. The application validates the
content of the XML file against an XML schema to ensure that all required attributes
are present and have the correct data types. If the validation passes, the application
loads the content of the file to memory and starts the filtering and the transformation
phases. The filtered and transformed data is then used to compute the nodal and
global variables such as the operating frequency, phases, etc. Finally, the application
displays the vibration data graphically using waveform charts, FFT charts, and orbit
charts. Moreover, the application stores user settings, converts vibration data from
the old text file format to the newly created XML format, and displays copyright
data. In order to accomplish the above functionalities, the application was divided
into 21 classes as shown in Figure 4.2. The Program class is used as the main entry
35
M.A.Sc. Thesis - Wisam Hussain
McMaster - Software Engineering
point to the application. It initializes and loads the MainView class. Using the main
view menus the user can navigate to the AboutView which displays the copyright
data, the SettingsView which stores/retrieves user settings, and the ConvertView
which convert vibration data from the old text files format to the newly created XML
format. The user uses the main view menus to select an XML file to do vibration
analysis. The MainView class passes the XML file to the XMLFile class for validation and parsing. If the validation passes, MainView class uses the Sensor class to
store sensor data, perform filtering and transformation, and compute nodal variables.
Also, the MainView class uses the Machine class to store machine data and compute
global variables. In order to do filtering and transformation, the Sensor class utilizes
the functionalities in the DCFilter, BWFilter, Ellipse, Interpolation, and ArrayUtil
classes. Once all the computation is done the main view utilizes the InfoString class
to display the nodal and global variables and it utilizes the FFTWaveChart class
and the OrbitChart to display the processed and transformed data graphically. Finally, the application uses the Language Class to provide multilingual support. As
discussed in the technology section, this application is built using C# and can run
on any version of Windows that supports .Net 4.0 and has the built-in namespaces
shown in Figure 4.3. Finally, due to the size of the application, common architectures
such as Model View Controller (MVC), and Model View Presenter (MVP) were not
used in order to avoid overhead.
36
M.A.Sc. Thesis - Wisam Hussain
McMaster - Software Engineering
Figure 4.2: Offline Vibration Analysis Software Classes
37
M.A.Sc. Thesis - Wisam Hussain
McMaster - Software Engineering
Figure 4.3: Offline Vibration Analysis Software Dependencies
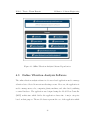
4.3
Online Vibration Analysis Software
The online vibration analysis software is a browser based application used to manage
vibration data collected from various vibrating screens. Moreover, the application is
used to manage users, roles, companies, plants, machines, and other data by utilizing
a central database. The application was designed using the Model View Controller
(MVC) architecture which divides the application classes into 3 major categories
based on their purpose. The model classes represent the core of the application which
38
M.A.Sc. Thesis - Wisam Hussain
McMaster - Software Engineering
is the logic and storage of the vibration data. The views are the visual representation of the models and are done using the traditional HTML, CSS, and JavaScript.
Finally, the controller classes are mediators that accepts input from users, calls the
model classes to perform a task, and render a view which can be sent to browser.
It is highly recommended to have thin controllers and fat models when designing a
web application using the MVC architecture. This recommendation ensures that our
classes have a cohesive set of responsibilities and are easy to understand and easy to
maintain. Figure 4.4 & 4.6 show the MVC architecture utilized in the design of the
application.
Figure 4.4: Model View Controller Architecture
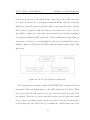
The application was designed to utilize the ASP.NET MVC 2 framework which is
the standard Microsoft implementation of the MVC architecture [7] [13] [16]. When
the browser sends the first request to the web server, the application gets loaded
into memory. Then, the web server passes the request to the web application which
uses a router to determine which controller and action to invoke. In this application, the first part of the URL is used to determine the controller name, the second
39
M.A.Sc. Thesis - Wisam Hussain
McMaster - Software Engineering
part of the URL is used to determine the action name, and the rest of the URL is
used as parameters for the action. A typical example of a request would look like
http://www.company.com/machine/delete/102 which means invoke the delete function of the machine controller with a parameter equal to 102. Once the action is
performed, the resulting visual representation is sent back to the browser for consumption. The web application is built using C# and ASP.NET MVC 2 and shall
run on any Windows Server that supports the .Net 4.0 framework that have the builtin namespaces shown in Figure 4.5.
Figure 4.5: Online Vibration Analysis Software Dependencies
40
M.A.Sc. Thesis - Wisam Hussain
McMaster - Software Engineering
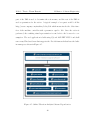
Figure 4.6: Online Vibration Analysis Software Classes
41
M.A.Sc. Thesis - Wisam Hussain
4.4
McMaster - Software Engineering
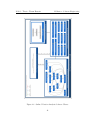
Database
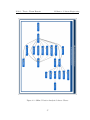
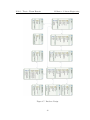
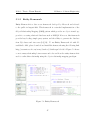
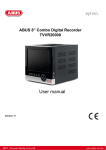
The database design shown in Figure 4.7 represents the business model behind the
online vibration analysis software. In this model, each user has a single role and
belongs to one company. Each company can have more than one plant where each
plant can have more than one machine (Vibrating Screen). Each machine has a model
where the model contains information regarding the deck inclination type, excitation
source, etc. Finally, each machine can have more than one record (Vibration Data).
In general, companies who are interested in monitoring their machines need to contact
the administrators of this application to register their company, plants, and machines.
Once the registration process is complete, the user can upload vibration data by
accessing the system and uploading the required files. To accommodate the business
model, the database was designed to allow for a fine control over users access to
machines. This was achieved by using a many-to-many relationship between the
User and the Machine tables. In Figure 4.7, a hybrid between the concept of Entity
Relationship (ER) diagram and the concept of Object Relationship Mapping (ORM)
is shown. Each entity, in this diagram, has three sections. The first section contains
the name of the database table which is also the name of the ORM class. The second
section represents the attributes of the database table which also corresponds to the
attributes of the ORM class. Finally, the third section represents the navigation
properties among the ORM classes. For example, to implement the ORM Role class
we would create a C# class with an integer attribute RoleId, a string attribute Name,
and a reference attribute List<User>Users. To access the list of users for a specific
role, we would use plain C# code such as role.Users. To simplify the access to ORM
classes, a new C# class was created and named DataContext as shown in Figure 4.6.
42
M.A.Sc. Thesis - Wisam Hussain
McMaster - Software Engineering
Figure 4.7: Database Design
43
M.A.Sc. Thesis - Wisam Hussain
McMaster - Software Engineering
The DataContext class has a reference to all ORM classes within the application.
Furthermore, the DataContext class utilizes the settings stored in the Web.Config file
to establish a connection with the database server. In this project, Microsoft SQL
Server and Microsoft Entity Framework (EF) 4.0 were used extensively. The EF is
the standard Microsoft implementation of the Object Relationship Mapping (ORM)
pattern which runs on top of the .Net framework [14] [10].
44
Chapter 5
Implementation
The implementation phase is one of the main phases of the software development life
cycle (SDLC). The applications were developed using an iterative and incremental
approach as shown in Figure 3.1. Using this approach, the application requirements
were sorted by priority and then divided into sets where each set takes one manmonth to complete. Each set of requirements is analyzed, integrated into the overall
design, and then implemented and tested [18]. At the end of each month, a fully
working version of the application is produced and used in a monthly meeting with
the company to get feedback. In the implementation phase, the requirements and
design are mapped to a set of highly cohesive and low coupled classes. These classes
are written using the C# programming language and then internally documented
using inline comments. It should be noted that the implementation should also meet
the various non functional requirements such as performance and readability. As a
result, detailed comments, minimal object creation, meaningful variable names, and
consistent user interface design were used to accommodate these type of requirements.
45
M.A.Sc. Thesis - Wisam Hussain
5.1
McMaster - Software Engineering
Frameworks
This section enlists and discusses the external frameworks that were used in the
implementation of both applications.
5.1.1
ASP.NET MVC Framework
ASP.NET MVC is a web application framework developed by Microsoft and released
as an open source project in November 2007. This framework is a standard implementation of the Model View Controller (MVC) architecture which allows for a clear
separation between views, data, and logic. Moreover, this framework provides full
control over the user interface, full control over the URL, and the ability to do Test
Driven Development (TDD) [7] [13] [16]. The online vibration analysis software was
build using version 2.0 of the framework which is prepackaged with Visual Studio
2010. To use version 2.0 with Visual Studio 2008 or 2012, please download and install the framework from Microsoft website. Figure 5.1 shows the major components
of the framework and how these components interact with each other.
Figure 5.1: ASP.NET MVC Framework
46
M.A.Sc. Thesis - Wisam Hussain
5.1.2
McMaster - Software Engineering
Entity Framework
Entity Framework is a data access framework developed by Microsoft and released
to the public in August 2008. This framework is a standard implementation of the
Object Relationship Mapping (ORM) pattern which provides an object oriented approach to accessing relational databases such as MSSQL. Moreover, this framework
provides lazy loading, simple query syntax, and the ability to generate the database
from C# classes and visa versa [14] [10]. To use Entity Framework 4.1 with Visual Studio 2010, please download and install the framework using the following link:
http://www.microsoft.com/en-us/download/details.aspx?id=8363. Figure 5.2 shows
a one-to-many relationship between users and roles and how the entity framework is
used to realize this relationship using the object relationship mapping paradigm.
Figure 5.2: Entity Framework
47
M.A.Sc. Thesis - Wisam Hussain
5.2
McMaster - Software Engineering
Build System
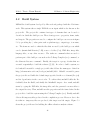
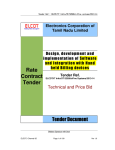
MSBuild is a build system developed by Microsoft and packaged with the .Net framework. This system takes a single XML file as an input which is also known as the
project file. The project file contains four types of elements that can be used to
describe in details the build process. These four types are : properties, items, tasks,
and targets. The properties are used to configure the build process as seen in figure
5.3 by providing key / value pairs such as platform type, output type, icon name,
etc. The items are used to enlist the files that are used by the build process which
can be dynamic-link libraries (*.dll), source code files (*.cs), XML files, image files,
language files, or any other resource. The tasks are commands that are used to
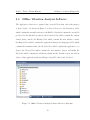
perform part of the build process such as the C Sharp Compiler (csc) command, or
the Generate Resource command. Finally, the target is a group of tasks that are
executed sequentially to build the software [5] [11]. In order to build a system, we
feed msbuild executable a single project file that follows the namespace defined in
http://schemas.microsoft.com/developer/msbuild/2003. Msbuild executable parses
the project file and builds the default target specified in the root element (Project)
and its dependencies in the correct order. To achieve that, msbuild builds the BeforeBuild, then the Build, and finally the AfterBuild targets. As a result, msbuild
starts by coping the XSD files, the image files, and the generated resources files to
the output directory. Then, msbuild uses the properties and the items defined in the
project file to build the system using the C Sharp Compiler (csc). Finally, msbuild
deletes all temporary files produced in the compilation process. However due to the
fact that no temporary files are produced, this target was left empty. Figure 5.3
shows the project file used in building the offline vibration analysis software.
48
M.A.Sc. Thesis - Wisam Hussain
McMaster - Software Engineering
Figure 5.3: MSBuild Project File
49
M.A.Sc. Thesis - Wisam Hussain
5.3
McMaster - Software Engineering
Offline Vibration Analysis Software
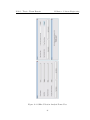
The application classes were organized into several folders that reflect the purpose
of these classes. As shown in Figure 5.4, these folders are: the References folder
which contains the assembly references, the Build folder which contains the executable
produced by the msbuild executable, the Controls folder which contains the custom
defined chart controls, the Events folder which contains the user interface events,
the Images folder which contains the application images, the Languages folder which
contains the translation files, the Models folder which contains the application core
classes, the Views folder which contains the user interface classes, and finally the
Xsd folder which contains the validation schema.xsd file. In this section, the various
classes of this application (shown in Figure 4.2) will be listed and described.
Figure 5.4: Offline Vibration Analysis Software Directory Structure
50
M.A.Sc. Thesis - Wisam Hussain
McMaster - Software Engineering
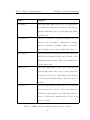
Name
Purpose
Program.cs
This class is the main entry point to the application.
It contains the main function which creates the application main thread and loads the main view (using
MainView.cs)
Properties.cs
This file contains the following assembly level attributes: title, description, configuration, company,
product, copyright, trademark, culture, com visible,
guid, assembly version, and assembly file version.
ArrayUtil.cs
This class implements multiple array helper functionalities such as finding the index and the value of the
maximum item in an array. This class is mainly used
by the sensor class.
BWFilter.cs
This class implements a fourth order bandpass butterworth filter that can be used to remove the noise
from the vibration data. This filter takes an array
of doubles and return the filtered data as an array of
doubles.
DCFilter.cs
This class implements a digital comb filter of strength
R=0.98 that can be used to remove the impact of
gravity from the vibration data. This filter takes an
array of doubles and return the filtered data as an
array of doubles.
Table 5.1: Offline Vibration Analysis Software Classes - Part 1
51
M.A.Sc. Thesis - Wisam Hussain
McMaster - Software Engineering
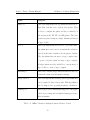
Name
Purpose
Ellipse.cs
This class implements an algorithm that finds an ellipse that best fits a set of given data points. This
is done to compute the phase and the eccentricity of
the motion in the XY, ZY, and ZX planes. The data
points are passed using two single dimensional arrays
of type double.
FFT.cs
This class implements the radix-2 Cooly-Tuckey FFT
algorithm that can be used to transform the vibration
data from the time domain to the frequency domain.
The algorithm takes an array of type complex (size
= power of 2) and return an array of type complex.
A helper function is also available to convert array of
type double to array of type complex.
InfoString.cs
This class contains helper functions that are used to
format the main view information strings.
Interpolation.cs
This class implements an interpolation algorithm that
can be applied to three data points. This algorithm is
used to improve the operating frequency calculation.
Language.cs
This class provides multilingual support to the application by accessing and reading the language resource
files at runtime.
Table 5.2: Offline Vibration Analysis Software Classes - Part 2
52
M.A.Sc. Thesis - Wisam Hussain
McMaster - Software Engineering
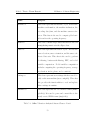
Name
Purpose
Machine.cs
This class represents the machine object. It holds the
machine serial number, the machine inclination, the
recording date/time, and the machine sensors references. This class is also used to compute global variables such as the operating frequency.
Matrix.cs
This class contains helper functions that are used in
manipulating matrices in the ellipse class.
Sensor.cs
This class represents the sensor object. It holds the
sensor location, sensor orientation, and the sensor calibrated data sets. This class is also used to perform
dc filtering, butterworth filtering, FFT, and nodal
variable computation. Nodal variables computation
includes computing the operating frequency, average
acceleration, stroke, phase, and eccentricity.
Settings.cs
This class represents user settings which are saved locally on the user machine (user.config file). This class
also provides the functionalities to read and update
these settings at runtime.
TextFiles.cs
This class represents the old text files format (multiple files). It is used to parse and convert files to the
newly created XML format (single file).
Table 5.3: Offline Vibration Analysis Software Classes - Part 3
53
M.A.Sc. Thesis - Wisam Hussain
McMaster - Software Engineering
Name
Purpose
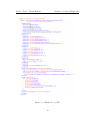
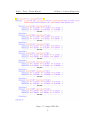
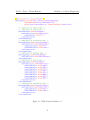
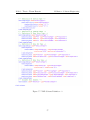
XMLFile.cs
This class represents the new file format (single
XML). It is used to parse and load the content to
memory by creating sensor and machine objects. It
is also used to validate the content of the XML file
against an XML schema definition (XSD). Figure 5.5,
Figure 5.6, and Figure 5.7 show the content of a sample XML file and the XML schema definition (XSD)
used for validation.
AboutView.cs
This class implements the about view by extending
the built-in System.Windows.Forms.Form class
ConvertView.cs
This class implements the conversion view by extending the built-in System.Windows.Forms.Form class
MainView.cs
This class implements the main view by extending
the built-in System.Windows.Forms.Form class
SettingsView.cs
This class implements the settings view by extending
the built-in System.Windows.Forms.Form class
FftWaveChart.cs
This class implements a custom chart controls that
can be used to display FFT charts and waveform
charts. These charts provide zooming, axes synchronization, and tooltips with custom messages
OrbitChart.cs
This class implements a custom chart control that
can be used to display orbit charts.
Table 5.4: Offline Vibration Analysis Software Classes - Part 4
54
M.A.Sc. Thesis - Wisam Hussain
McMaster - Software Engineering
Figure 5.5: Sample XML File
55
M.A.Sc. Thesis - Wisam Hussain
McMaster - Software Engineering
Figure 5.6: XML Schema Definition - 1
56
M.A.Sc. Thesis - Wisam Hussain
McMaster - Software Engineering
Figure 5.7: XML Schema Definition - 2
57
M.A.Sc. Thesis - Wisam Hussain
5.4
McMaster - Software Engineering
Online Vibration Analysis Software
The application classes were organized into several folders that reflect the purpose of
these classes. As shown in Figure 5.8, these folders are: the Properties folder which
contains the various properties of the application, the References folder which contains the assembly references used by the application (such as the System.Web.Mvc.dll
and the EntityFramework.dll assemblies), the Content folder which contains the static
files such as Cascading Style Sheet (CSS) files and image files, the Controllers folder
which contains the application controller classes, the Models folder which contains
the application model classes (logic & persistence), the Scripts folder which contains
the JavaScript file, and finally the Views folder which contains the user interface files.
In this section, the various classes of this application (shown in Figure 4.6) will be
listed and described.
Figure 5.8: Online Vibration Analysis Software Directory Structure
58
M.A.Sc. Thesis - Wisam Hussain
McMaster - Software Engineering
Name
Purpose
Global.asax
This class is the main entry point to the application. It contains the RegisterRoutes and the Application AuthenticateRequest functions that are used to
set the route rules and to authenticate user requests
respectively.
Web.config
This file contains the application configurations. This
includes the database, sessions, cookies, and frameworks configurations.
Controller Classes
These classes contain the functions that responds to
HTTP Get and Post requests. The controller functions calls a model class to perform a certain task and
then forward the results to the view for display.
Model Classes
These classes contains the application core functionalities such as database persistence, security, exception handling, and mathematics.
DataContext.cs
This class provides object relationship mapping. It is
the main entry point to the database and it provides
a simple interface to perform database queries.
DataInitializer.cs
This class is used at development time to drop and
create database. It is also used to seed the newly created database with sample data for testing purposes.
Table 5.5: Online Vibration Analysis Software Classes - Part 1
59
M.A.Sc. Thesis - Wisam Hussain
McMaster - Software Engineering
Name
Purpose
Error.aspx
This active server page is used to display exception
errors caught while processing HTTP requests.
Private.Master
This master page is used to create the common layout
for the private pages of the application.
Public.Master
This master page is used to create the common layout
for the public pages of the application.
Create.aspx
This page displays an HTML form that can be used
to create a new database entry.
Delete.aspx
This page is used to delete an entry from the database
Details.aspx
This page is used to display the details of an entry
Edit.aspx
This page is used to edit the attribute of an entry
Index.aspx
This page is used to display all entries of a specific
database table. It also provides pagination and links
to the create, delete, details, and edit pages.
Table 5.6: Online Vibration Analysis Software Classes - Part 2
The online vibration analysis software manages ten database tables as show in
Figure 4.7. Each database table has a dedicated controller, a dedicated model, and five
dedicated views (index, delete, details, create, and edit). In order to avoid repetition,
the above tables show only a partial list of the classes that exist in the application
source code. JavaScript files and Cascading Style Sheet files are not discussed due to
their minor impact on the design and implementation of the application.
60
Chapter 6
Security
It is recommended to consider the security of a web application prior to building it.
With the wide adoption of web applications as a main way of doing business and
delivering services, web applications became targeted by a wide range of attacks. To
prevent these attacks, the following security risks should be considered at the early
stages of the software development: broken authentication & authorization, cross site
scripting (XSS), cross site request forgery (XSRF), SQL injection, failure to restrict
URL access, and insufficient transport layer protection [17]. In this chapter, we will
discuss these security risks and the counter measures developed in the online vibration
analysis software to prevent these attacks. However, before we start our discussion,
we need to take a look at how browsers and web servers interact with each other
using the Hypertext Transport Protocol (HTTP). It should be noted that the offline
vibration analysis software is available to view vibration data by technicians offline
and therefore requires no security measures.
61
M.A.Sc. Thesis - Wisam Hussain
6.1
McMaster - Software Engineering
Hypertext Transport Protocol (HTTP)
HTTP is an application level protocol used in the communication between browsers
and web servers. This protocol is stateless by design which means that every request
is independent from past and future requests [1]. To overcome the stateless nature of
this protocol, we use a storage mechanism called cookies to store and retrieve data
that allows us to simulate a state-full browsing session as shown in Figure 6.1.
Figure 6.1: HTTP Request and Response
Each cookie has seven attributes that determine its content and the behaviour of
the browser. These attributes are: name, value, expiration, domain, path, secure,
and httponly [1]. The name attribute is used to identify the cookie and the value
attribute is used to store data (e.g. username, session id, language preference, etc).
The name and the value attributes are required when creating a cookie using the setcookie header as shown in Figure 6.1. The expiration date is used to determine the
life span of the cookie. The domain and path attributes are used to determine if the
cookie should be included in the HTTP request. The secure attribute is used to tell
the browser to send the cookie only when the Secure Hypertext Transport Protocol
62
M.A.Sc. Thesis - Wisam Hussain
McMaster - Software Engineering
(HTTPS) is in use. Finally, the httponly attribute tells the browser that the cookie
is not accessible (i.e. JavaScript can not read or modify the content of the cookie).
6.2
Authentication
The current version of HTTP (version 1.1) supports two types of authentication:
basic authentication and digest authentication. These two authentication methods
are not widely used because the authentication process is done by the web server and
not by the web application. Nowadays, the most common authentication method is
forms authentication where the user fills an HTML form by entering a username and
a password. The web application then validates these credentials against a database
or other storage. Forms authentication is a custom authentication method and is not
part of the HTTP protocol. Other custom protocols such as windows authentication
exists but rarely used. In the online vibration analysis software, forms authentication
was implemented by annotating all secure resources with the [Authorize] attribute to
indicate that only authenticated user have the right to access theses resources [7].
public class AccountController : Controller
{
[Authorize]
public ActionResult Index() { ... Implementation Omitted ... }
}
The online vibration analysis software was configured to redirect all unauthenticated
requests to the login page as shown below. In the configuration, the login url, default
url, and the cookie default values are set and used when redirecting requests and
63
M.A.Sc. Thesis - Wisam Hussain
McMaster - Software Engineering
creating cookies when the authentication process is complete.
<authentication mode="Forms">
<forms name="WebAppAuth"
loginUrl="~/Account/Login"
defaultUrl="~/Dashboard/Index"
protection="All"
timeout="30"
path="/"
requireSSL="false"
slidingExpiration="true"
enableCrossAppRedirects="false"
cookieless="UseDeviceProfile"
domain=""
ticketCompatibilityMode="Framework20">
</forms>
</authentication>
Figure 6.2 shows HTTP requests that the browser sends and HTTP responses that
the web server returns when an unauthenticated user tries to access a secured resource
such as the homepage of an account using the (/Account/Index) URL.
64
M.A.Sc. Thesis - Wisam Hussain
McMaster - Software Engineering
Figure 6.2: Forms Authentication
Once the authentication process is complete, a cookie with the name ”WebAppAuth” is created. The newly created cookie is sent with each subsequent request to
indicate that the user is an authenticated user. Moreover, to prevent the user from
tampering with the content of the cookie, the cookie is encrypted and hashed. The
encryption and hashing keys are stored in the configuration file (web.config) as shown
below.
<machineKey
validation="SHA1" validationKey="32E3587255897 .... 3DF605835F4F"
decryption="AES" decryptionKey="B179091DB58B2 .... 4F58693DF5F4" />
65
M.A.Sc. Thesis - Wisam Hussain
6.3
McMaster - Software Engineering
Authorization
After going through the authentication process to determine the identity of the user,
we go through the authorization process to determine what resources the user has
access to. The combination of the above two processes are used to create an Access
Control List (ACL). In the online vibration analysis software, we used two database
tables namely the user table and the role table to determine the identity and the role
of the user. In response to the requirements, each user can assume only one role. The
online vibration analysis software has three roles (Admin, Staff, Customer) where the
administrators have access to all the resources that the Staff have access to and the
Staff have access to all the resource that the Customer have access to. The following
shows the two database tables that were used in this application where the RoleId in
the User table is a foreign key pointing to the primary key of the Role table.
User (UserId, Username, Password, Locked, Expiration, RoleId, ... )
Role (RoleId, Name)
After going through the authentication and the authorization, the web application
determines the identity and the role of user. All secured resource will be decorated
with the Authorize attribute to indicate the role required to grant the user an access.
public class AccountController : Controller
{
[Authorize(Group="Admin,Staff")]
public ActionResult Index() { ... Implementation Omitted ... }
}
66
M.A.Sc. Thesis - Wisam Hussain
McMaster - Software Engineering
If the Authorize attribute does not specify a specific group then all groups are granted
access [7].
6.4
Cross-Site Scripting (XSS)
XSS attack occurs when a web application accepts input from users without implementing proper filters. This allows users to inject the web application with client
side scripts such as HTML, CSS, or, JavaScript. As a result, the web application will display web pages to all subsequent users with the injected client side
scripts. These client side scripts are executed by the browser and usually leads to
one of the following: stealing the user cookie, hijacking the user session, redirecting the user to another URL, defacing the user interface, or modifying the content
of the web page. In the online vibration analysis software, three measures were
considered in order to prevent XSS attacks.
First, input sanitization was used
on all inputs to remove tags that are not considered safe. To do that, the sanitizer method was used from the Microsoft.Security.Application namespace. The following is an example: Sanitizer.GetSafeHtmlFragement(”abc <script></script>”)
would return only ”abc ”.
Second, all inputs were encoded prior to displaying
them in the browser. The encoding was done using the HtmlEncode, JavaScriptEncode, UrlEncode and Other functions from the AntiXSS library from Microsoft.
The following is an example: AntiXss.HtmlEncode(”<b>hello</b>”) would produce
<b>hello</b> Lastly, In order to prevent the client side scripts from accessing the cookie, the HttpOnly attribute was set when cookies are created. The
HttpOnly attribute tells the browser to send the cookie with the http request only
and should not be accessed by client side scripts such as JavaScript or VBScript [7].
67
M.A.Sc. Thesis - Wisam Hussain
6.5
McMaster - Software Engineering
Cross-Site Request Forgery (XSRF)
XSRF is one of the most common web application security attacks. XSRF is used to
trick an authenticated user’s browser to send forged HTTP requests to the vulnerable
web application. An example would be to send a request to change the password of
the user’s account. To simplify the following example, we assume that the user is
authenticated and authorized to change his/her account password by filling an HTML
form that submits a GET or POST requests.
GET /Account/ChangePassword?NewPassword=12345
An attacker can utilize this information and try to change the password to gain
access to this account by tricking the user to click on a link or by redirecting the
user’s browser to a webpage the contains an image that contains a link as its source
<a href=".../Account/ChangePassword?NewPassword=11111">Click</a>
<img src=".../Account/ChangePassword?NewPassword=11111" />
Now due to the nature of HTTP, Even if the request originated from a different web
application, the session cookie of the vulnerable web application will be sent with any
of the above requests since the session cookie domain and path will match with the
form action (which is ”http://www.website.com/Account/ChangePassword”). The
web application will use the session cookie to identify the user and then change
the password by executing the function ChangePasssword in the Account controller.
If the ChangePassword was an HTTP Post method then the attacker would use
javaScript to assemble a form and submit the request accordingly instead of using
simple URLs. To prevent XSRF attacks, we need to make sure that all requests to
our web application comes from pages that our web application have generated. To
68
M.A.Sc. Thesis - Wisam Hussain
McMaster - Software Engineering
achieve this, we add a hidden input field to our HTML forms with random string
and we create a cookie and add this random string to it. Now when the request
is submitted, the web application checks the value of these two strings and if they
match we process the request. Otherwise, the web application raises an exception to
prevent XSRF attack. The implementation is done using the Html helper function
AntiForgeryToken() and the annotation attribute [ValidateAntiForgeryToken].
<form action="/Account/ChangePassword" method="..." enctype="..." >
<%= Html.AntiForgeryToken() %>
<!-- The above line will generate -->
<input name="__RequestVerificationToken" type="hidden"
value="saTFWpkKN0BYazFtN6YbZ ... VgeV2cFVmelvzwRZpArs" />
</form>
The Html.AntiForgeryToken() function will generate a hidden input field and create a
cookie with name/value equal to the name/value of the hidden field. The annotation
attribute is used to decorate controller action which indicates that the value of the
cookie and the hidden field needs to be compared prior to the action execution [7].
public class AccountController : Controller
{
[Authorize]
[ValidateAntiForgeryToken]
public ActionResult ChangePassword(...) { ... Implementation Omitted ... }
}
69
M.A.Sc. Thesis - Wisam Hussain
6.6
McMaster - Software Engineering
SQL Injection
SQL injection is the most common security attack used against web applications.
Even though the idea behind SQL injection is quite simple, the result of such attacks
can be very destructive. Typically an SQL injection attack is used to gain access
to restricted information but it could be also used to change the database content
or even delete the database itself. In the following example, we will discuss how an
SQL injection attack can be used to gain access to restricted information. Most web
application deploy an authentication/authorization system to grant user access to
specific set of data. This is done by comparing the provided username and password
against the database using an SQL statement. We prepare the SQL statement by
concatenating the provided username and password to produce the following:
SELECT * FROM USERS WHERE USERNAME = ’u’ AND PASSWORD = ’p’;
Now assuming we know the username of another user, we can bypass the password
by providing a password which is equal to x’ or ’1’ = ’1
SELECT * FROM USERS WHERE USERNAME = ’u’ AND PASSWORD = ’x’ or ’1’ = ’1’;
To prevent such an attacks, we either have to handle these attacks manually by
scanning the user input for special characters such as single quotation or we can
use a library to automate this task. In the online vibration analysis software, we
used an Object Relationship Mapping (ORM) framework called Entity Framework
to communicate with the database. The Entity Framework has a extensive API that
we use to generate safe SQL statements. To produce an SQL statement equivalent to
the one above, we use the Entity Framework’s API functions. The ORM framework
70
M.A.Sc. Thesis - Wisam Hussain
McMaster - Software Engineering
functions were designed to prevent SQL injection attacks by using multiple techniques
such as parameterized input, character escaping, etc [7].
User user = dataContext.Users.Where(u => u.Username == login.Username)
.Where(u => u.Password == login.Password);
6.7
Restrict URL Access
Failure to restrict URL access is a common security risk that occurs when a user manipulate the URL address to access a restricted page. In the online vibration analysis
software, a router was implemented to intercept all requests prior to processing them.
The router rule is defined using a regular expression where the MapRoute statement
indicates that the first segment of the URL is mapped to a controller class, the second
segment of the URL is mapped to an action (method in the controller) and the last
segment is mapped to a parameter in the action [7]. The definition of the default
route is:
routes.MapRoute("Default", "{controller}/{action}/{id}",
new { controller="Home", action="Index", id=UrlParameter.Optional } );
Once the router is done processing the URL, the controller class will be initialized and
the action with the correct parameter value gets executed. In other words, all requests
will be mapped to an action in a controller and since all of these actions are decorated
with the authorize attribute, it is impossible for a user to gain an unauthorized access
to any part of the web application. Moreover, if the Controller is not specified in the
URL the the Home controller is used and if the action is not specified then the Index
action is used as defined in the above routing function MapRoute.
71
M.A.Sc. Thesis - Wisam Hussain
McMaster - Software Engineering
public class SomeController : Controller
{
[Authorize(User="John")] public ActionResult SomeAction1(...) { ... }
[Authorize(Role="Admin")] public ActionResult SomeAction2(...) { ... }
}
In the first example, A user needs to be authenticated and needs to have a username
equal to John to be able to access http://.../SomeController/SomeAction1. In the
second examples, the user needs to be authenticated and needs to be a member of
the Admin group to be able to access the http://.../SomeController/SomeAction2.
Static files such as Images, Cascading Style Sheet (CSS) files and JavaScript files are
exempt from the above routing technique.
6.8
Other
It is highly recommended that a Secure Socket Layer (SSL) protocol is used when
communicating sensitive data between the browser and the web server. In the online
vibration analysis software, SSL was not used due to time constraints. Without
SSL, sending sensitive data such as the username/password, credit card information
and cookies can be intercepted by intruders [7]. An intruder can use these data to
impersonate the original user to gain access to the web application. On the other
hand, the communication between the web application and the database server is
secure. The following connection string is located in the web.config file and is used
to establish a connection between the web application and the database server. By
setting the Encrypt attribute of the connection string to YES, the Database provider
(System.Data.SqlClient) will be informed that a secure connection is required.
72
M.A.Sc. Thesis - Wisam Hussain
McMaster - Software Engineering
<connectionStrings>
<add name="DataContext"
providerName="System.Data.SqlClient"
connectionString="Data Source=243.243.243.243;
Initial Catalog=Database;
User ID=UserId;
Password=Password;
Encrypt=Yes;" />
</connectionStrings>
Encrypting the communication between the web browser and the web server and
between the web application and the database server will decrease the responsiveness
of the web application and increase the CPU and memory usage of the web server
and the database server.
73
Chapter 7
Testing
Software testing is one of the main phases of the software development life cycle. In
this phase, the software is tested to ensure that it is bug free and it meets the functional and non functional requirements. There are a number of testing techniques
that can be applied to achieve this goal including: unit testing, integration testing,
system testing, and acceptance testing. Table 7.1 describes the purpose of each of
the above techniques [18].
Name
Unit testing
Integration testing
System testing
Acceptance testing
Purpose
Tests a small unit of the source code (e.g logic, function, etc)
Used when two or more units are combined in a larger structure
Tests the end to end quality of the entire software
Used by the customer when the software is delivered
Table 7.1: Software Testing Techniques
74
M.A.Sc. Thesis - Wisam Hussain
7.1
McMaster - Software Engineering
Unit Testing
In this thesis work, the source code was divided into small independent units. Each
unit was tested using one or more test cases that covers the various execution paths.
The result of the execution is then compared with the expected result to determine
whether the test has passed or not. To perform unit testing, an open source framework called NUnit was used. NUnit framework is written in C# and can be easily
integrated within Microsoft Visual Studio Express. The test cases were designed to
examine the following components of the applications : XML validation and parsing,
vibration analysis mathematics, and database operations. It should be noted that
the external libraries used in these applications were not tested. To write test cases,
we utilize TestFixture classes [7].
Figure 7.1: DC Filter Test Case
75
M.A.Sc. Thesis - Wisam Hussain
McMaster - Software Engineering
A TestFixture class is a special C# class that contains one or more test cases as
shown in Figure 7.1. Each test case starts by initializing the classes it uses. Each test
case, then, prepares a sample input and its expected output. Finally, the test case
runs the function and compares the actual result with the expected result as shown
above. Figure 7.2 shows the console output produced by the above test case.
Figure 7.2: DC Filter Test Case Result
7.2
Functional and Non Functional Tests
This section discusses the various tests that were used to ensure that both applications
meet the functional and non functional requirements described in chapter three.
76
M.A.Sc. Thesis - Wisam Hussain
7.2.1
McMaster - Software Engineering
Mathematical Model
All mathematical functions used in the vibration analysis process were extensively
tested and compared with Matlab. This includes testing the implementation of DC
filter, Butterworth filter, Fast Fourier Transform, Ellipse, Average Accelertaion, Operating Frequency, Stroke, Phase, and Eccentricity functions.
7.2.2
Database and XML
All basic database operations are tested using sample data and a MSSQL server.
These tests were performed for each database table and it includes creating, reading,
updating, and adding database tuples. Also, the validation and parsing process of
the XML file is extensively tested using valid, invalid, and corrput files.
7.2.3
User Interface
The user interface of the online vibration analysis software was tested using different
browsers on different operating systems in order to ensure that the look is consistent.
7.2.4
External Libraries
All external libraries used by both applications are not tested and are assumed to be
stable and bug free. This includes NUnit, ASP.NET MVC, and Entity Framework.
7.2.5
Other
All major functions of both applications are monitored for CPU and memory usage
in order to meet the various non functional requirements such as performance, etc.
77
Chapter 8
Conclusion
8.1
Discussion
This thesis presented the design and implementation of two software systems that
are used to process, manage, and visualize vibration data. These new systems satisfy
a real need in the field of vibration analysis and they are currently being branded
and deployed by our sponsoring company. The offline vibration analysis software will
be used by the company technicians to examine the vibration data in both time and
frequency domain, and to present the measured and calculated data in textual and
graphical forms. On the other hand, the online vibration analysis software will used by
the company management and customers to collect and manage vibration data using
a central data storage. In order to accommodate the continuously changing requirements provided by these various stakeholders, an iterative and incremental approach
was chosen. In this approach the requirements were sorted by priority and divided
into small sets where each set takes approximately one man-month to complete. At
the end of each iteration a meeting with the sponsoring company is conducted to get
78
M.A.Sc. Thesis - Wisam Hussain
McMaster - Software Engineering
feedback. Finally, to ensure that these systems can be further extended, Model View
Controller (MVC) architecture and Object Relationship Mapping (ORM) framework
were utilized in the development process.
8.2
Future Work
This section contains a list of suggested future work that can be used to extend the
functionalities of the new systems. These items are considered desirable and are
expected to be implemented in the near future:
• Port the offline vibration analysis software to tablets and enable the software to
communicate directly with the sensor devices which would eliminate the need
for the data acquisition unit
• Extend the online vibration analysis software to perform mathematical calculations and to play vibration data recording using standard web technologies
• Utilize data mining in the online vibration analysis software to study the performance and life span of the different machine models that are produced by
the manufacturers of these machines
• Extend the online vibration analysis software to perform fault prediction by analyzing the history of a machine and comparing the results with other machines
of the same type that faulted
• Provide report generation functionality in the online vibration analysis software
that analyzes the current state of the machine and produces recommendations
for the purpose of maintenance
79
Appendix A
Offline Vibration Analysis Software
The offline vibration analysis software is used to read, analyze, compute, and plot
vibration data. The application is build using the C# programming language and
can run on Windows XP, Windows Vista, Windows 7, and any future version of
windows that supports Microsoft .Net 4.0 framework. The application takes a single
XML file as an input where the XML file contains the user defined data and the
measured data of a vibrating screen. The user defined data and the measured data
are used by the application to plot charts and to calculate the values of the nodal and
global variables. The result of the vibration analysis is used by trained technicians to
understand and analyze the behaviour of the vibrating screen. The collection of the
user defined data and the measured data is done using a data acquisition unit that was
developed by graduate students earlier at McMaster University. The format of the
data that is produced by this unit is text based. As a result, the application provides
an integrated tool to convert the data from the old text format to the newly developed
XML format. In this chapter, we provide the users with detailed instructions on the
installation process and the usage of this application.
80
M.A.Sc. Thesis - Wisam Hussain
A.1
McMaster - Software Engineering
Installation
The installation process of the application involves the following three steps:
1. Obtain and Unzip the OfflineVibrationAnalysisSoftware.zip file
2. Move the extracted OfflineVibrationAnalysisSoftware folder to the Program
Files folder located at ”C: \ Program Files” (Admin. privilege is required)
3. Create a Shortcut by right clicking on ”C: \ Program Files \ OfflineVibrationAnalysisSoftware \ OfflineVibrationAnalysisSoftware.exe” and then clicking
send to Desktop (Shortcut)
If you see Figure A.1 when launching the application then you do not have Microsoft
.Net 4.0 framework installed on your machine. To fix this problem, go to the link
http://www.microsoft.com/en-us/download/details.aspx?id=17718
to download dotNetFx40 Full x86 x64.exe. After the installation of the framework,
try launching the application and the error message should disappear. It is recommended that the computer has at least 1 GHz CPU and 512 MB memory.
Figure A.1: Microsoft .Net 4.0 Framework Initialization Error
81
M.A.Sc. Thesis - Wisam Hussain
A.2
McMaster - Software Engineering
User Manual
To launch the application, double click on the shortcut which is located on the desktop
or double click on the application executable which is located in the OfflineVibrationAnalysisSoftware directory under Program Files. After launching the application,
you will see the main view of the application which consists of six areas: the menu,
the banner, the information panel, the orbit panel, the FFT/waveform panel, and the
status bar. The information panel will show the calculated variables such as the operating frequency, average acceleration, stroke, phase, and eccentricity. These variable
are divided into two categories. These two categories are nodal variables which are
sensor specific and global variables which are machine specific. To switch the view
between these two categories, click on the icon in the upper right corner. By default,
the application will show the nodal variables for the currently selected sensor. Figure
A.2 shows the menu items available in this application.
Figure A.2: Offline Vibration Analysis Software Menu Items
To use the application, open the ”File” menu and click ”Open” to select an XML
file from your local file system. The application will validate the XML file against
an internal XML Schema Definition file (Schema.xsd) to check if the file is a valid
input. If the XML file is invalid, an error message will be displayed to tell the user
what the error is and where the error is located in the XML file. On the other hand,
if the XML file is valid the application starts processing the content by loading the
82
M.A.Sc. Thesis - Wisam Hussain
McMaster - Software Engineering
data into memory, filtering the loaded data, performing Fast Fourier Transformation
(FFT), performing ellipse fitting, and calculating the nodal and global variables. The
application requires approximately one second (+/- 0.25 second) to do all of the above
using an average computer. The time is displayed to the user in the left corner of the
status bar as shown in Figure A.3. To close the application, open the ”File” menu
and click ”Quit” or use the shortcut (Ctrl-Q). The application settings determine
what to show in the main view of the application. By default, orbit charts shows the
X-Y plot and by default the digital filters are enabled. To disable the filters or to
show the Z-Y or Z-X plot, open the ”Settings” menu and click ”Edit” then select the
options from the drop down menus provided to you. The user can also change the
language setting and the measurement system setting to accommodate international
users. The application stores these settings, locally, on the user machine and loads
them with each subsequent launch of the application. These settings are stored in an
XML file named user.config which is located at ”C: \ Documents and Settings \ User
Name \ Local Settings \ Application Data \ W.S.Tyler \ OfflineVibrationAnalysisSoftware.exe Url xxx \ x.x.x.x” in Windows XP and located at ”C: \ Users \ Wisam
\ AppData \ Local \ W.S.Tyler \ OfflineVibrationAnalysisSoftware.exe Url xxx \
x.x.x.x” in Windows Vista and Windows 7. It is worth noting that the Application
Data folder in Windows XP and the AppData folder in Windows Vista and Windows
7 are hidden folder. If you want to view the content of these folders, change the
folder options in the control panel to show all hidden folders. If the user.config file
gets corrupted or if you want to reset the setting to the original values use the ”Reset
Setting” button. The application main view contains eight charts in the orbit panel
and six charts in the FFT/waveform panel. In addition to that the application main
83
M.A.Sc. Thesis - Wisam Hussain
McMaster - Software Engineering
view has an information panel to display the calculated nodal and global variables.
For users with small screens, the application can hide the information panel and/or
the orbit panel. This can be achieved by opening the ”Window” menu and clicking
on ”Hide Info Panel” and/or ”Hide Side Panel”. If the user wants to return to the
original layout of the application main view then click on the ”Reset Window Layout”. The changes to the application main view layout are temporary and are ignored
when the application is closed. As discussed earlier, the collection of the user defined
data and the measured data is done using a data aquisition unit which was developed
by other graduate students. The measured data which contains the G-Force data sets
are measured by attaching one to eight sensor(s) to specific locations on the vibrating
screen. These sensors uses a built-in accelerometer to measure the acceleration of the
screen in the x, y, and z axes. These sensors then send the measured accelerations to
the data aquisition unit using Bluetooth technology. The unit saves the acceleration
data of each sensor by creating a text file for each sensor in common folder. The unit
adds two extra files to specify the machine and to add any notes that the technician
have entered at the recording time. In order to fill the gap between the output of the
data aquisition unit which is a collection of text files in a folder and the input of this
application which is an XML file, a conversion tool was built and integrated within
the application. To access the conversion tool, open the ”Tools” menu and click
”Convert”. Select the source folder of the text files and destination folder where the
XML file will be created and click ”Apply Conversion”. If the conversion is successful,
a new XML file will created at the destination folder and this XML file can be used
as an input to the application. Finally, to access copyright and version information
open the ”Help” menu and click ”About”.
84
M.A.Sc. Thesis - Wisam Hussain
McMaster - Software Engineering
Figure A.3: Offline Vibration Analysis Software Main View
85
M.A.Sc. Thesis - Wisam Hussain
McMaster - Software Engineering
Figure A.4: Offline Vibration Analysis Forms View
86
Appendix B
Online Vibration Analysis Software
The online vibration analysis software is used to manage the user defined data and
the measured data of all vibrating screens. This is achieved by storing these data in a
central database and by allowing the authorized users to access these data. The web
application is built using the C# programming language and can run on any Windows server that has Internet Information Services (IIS) installed and that support
Microsoft .Net 4.0 framework. In order to built a robust and maintainable web application, we used the ASP.NET MVC 2 framework to utilize a popular implementation
of the Model-View-Controller design pattern. Also, we used the Entity Framework
4.1 to utilize the Object Relationship Mapping (ORM) technique when accessing the
database. In other word, querying the database for data and updating the content
of the database is done by using the Entity Framework API. The Entity Framework
is database independent and can work with a wide variety of databases including
MSSQL, Oracle, MySQL, and others. In this web application, MSSQL was used as
database server. If you want to change the current database configuration, refer to
the connection string section of the web.config file.
87
M.A.Sc. Thesis - Wisam Hussain
B.1
McMaster - Software Engineering
Deployment
The deployment process of the application involves the following four steps:
1. Obtain and Unzip the OnlineVibrationAnalysisSoftware.zip file
2. Use an SSH client to remotely create a database account on the server
3. Edit the web.config file to reflect the newly created database information
4. Use an FTP client as in Figure B.5 to transfer the extracted files to the server
Figure B.5: Online Vibration Analysis Software FTP View
The web application connects to the database using the data provided by the web.config
file. When the first request is executed, the web application checks to see if the
database contains the required tables using the entity framework API. If the tables
are not present, the web application will then attempt to create these tables and
populate them with seed data. If your hosting provider does not support creating
tables at runtime, use an SSH client to create and populate the tables manually.
88
M.A.Sc. Thesis - Wisam Hussain
B.2
McMaster - Software Engineering
User Manual
To access the web application, type its address in the browser and hit enter. The
address was ”localhost” at the development phase and ”macvib.com” at the testing
phase. The online vibration analysis software was built using standard web technologies (XHTML, CSS2.1, and JavaScript). As a result, all modern browsers are
supported including Internet Explorer, Mozilla Firefox, Google Chrome, Safari, and
Opera. To improve usability, all of the web application pages were divided into six
areas: the login, the banner, the menu, the title, the content, and the footer. Prior
to login, the user can access the public content of the web application which contains
a group of pages that promote the online vibration analysis software and attract
new customers by providing information about the service, the features, the terms
and conditions, the customer support, and the contact information. Once the user
is logged in, the user can access the private content of the web application which
contains a group of pages that allow the user to create, edit, view, delete, and list
data such as companies, plants, machines, records, etc. As mentioned in the previous
chapters, each user of the web application falls in one of the following three categories:
Administrator, Staff, or Customer. Each of these groups has access to a subset of
the web application functionality. In general, customers can access their accounts.
Staff can access their accounts, and any user account. Administrators can do all of
the above and can access and manage other parts of the web application such as
users, roles, companies, plants, machines, records, manufacturers, models, excitation
sources, deck inclination types, etc. Anonymous users trying to access private content will be redirected to the login page prior to processing their requests. To use the
web application, launch the application in your favourite browser and then login by
89
M.A.Sc. Thesis - Wisam Hussain
McMaster - Software Engineering
entering your username and password. Using the web.config file, the web application
is configured to direct all users to the dashboard page after the login process succeed.
The dashboard page shows the user some important information such as the number
of machines accessible by the user, and the number of recording per machine, etc.
Moreover, the dashboard shows different information based on the role of the user.
For example, only administrator can see the number of registered users, number of
active users and number of inactive users, etc. The web application has ten database
tables that fully covers the initial business model specified by the sponsoring company. Please refer to the requirements chapter and the design chapter to get a better
understanding of the application requirements and the business model behind it. The
web application provides as robust way to create, edit, view, delete, and list tuples
from the following tables (role, user, company, plant, machine, record, manufacturer,
model, excitation source, and deck inclination type). The web application provides
the user with a custom menu to list the tables that are accessible by the user based
on the his/her role. To perform a task on a certain table, click on the menu item
that is associated with that table and the listing page will appear. The listing page
will show ten rows at a time and the user can navigate through the rows by clicking
the ”Next” and the ”Prev” buttons in the lower right corner of the table. If the
user wants to edit a certain row, click on the ”Edit” link within the Actions column.
After the task is performed, the user will be redirected to the listing page. Similar
to the edit functionality, to create, view, or delete click on the link and follow the
provided instructions. Finally, it is highly recommended to logout after using the
online vibration analysis software.
90
M.A.Sc. Thesis - Wisam Hussain
McMaster - Software Engineering
Figure B.6: Online Vibration Analysis Software Text View
Figure B.7: Online Vibration Analysis Software List View
91
M.A.Sc. Thesis - Wisam Hussain
McMaster - Software Engineering
Figure B.8: Online Vibration Analysis Software Create View
Figure B.9: Online Vibration Analysis Software Edit View
92
M.A.Sc. Thesis - Wisam Hussain
McMaster - Software Engineering
Figure B.10: Online Vibration Analysis Software Details View
Figure B.11: Online Vibration Analysis Software Delete View
93
M.A.Sc. Thesis - Wisam Hussain
McMaster - Software Engineering
Figure B.12: Online Vibration Analysis Software Login View
Figure B.13: Online Vibration Analysis Software Error View
94
Appendix C
Bibliography
[1] U.C. Berkeley A. Barth. Http state management mechanism. https://tools.
ietf.org/rfc/rfc6265.txt, 2011.
[2] Sahar Abughannam. Design and implementation of a vibration analysis tool.
Master’s thesis, McMaster University, 2008.
[3] Burrus. DFT/FFT And Convolution Algorithms. Wiley, 1984.
[4] Refsnes Data. Browser information. http://www.w3schools.com/browsers/
default.asp, 2012.
[5] Sayed Ibrahim Hashimi & Sayed Ibrahim Hashimi. Inside the Microsoft Build
Engine: Using MSBuild and Team Foundation Build. Microsoft Press, 2011.
[6] The MathWorks Inc. fit ellipse. http://www.mathworks.com/matlabcentral/
fileexchange/3215-fitellipse, 2003.
[7] Jimmy Bogard Jeffery Palermo, Ben Scheirman and Matthew Hinze. Asp.NET
MVC 2 In Action. O’REILLY, 2011.
95
M.A.Sc. Thesis - Wisam Hussain
McMaster - Software Engineering
[8] Charles F. Van Loan. Using the ellipse to fit and enclose data points. http:
//www.cs.cornell.edu/cv/OtherPdf/Ellipse.pdf, 2006.
[9] R. G. Lyons. Understanding Digital Signal Processing. Prentice Hall, 2004.
[10] Microsoft. Ado.net entity framework. http://msdn.microsoft.com/en-us/
library/bb399572%28v=vs.100%29.aspx, 2010.
[11] Microsoft. Msbuild reference. http://msdn.microsoft.com/en-us/library/
0k6kkbsd(v=vs.100).aspx, 2010.
[12] Microsoft. .net framework class library. http://msdn.microsoft.com/en-us/
library/gg145045(v=vs.100).aspx, 2010.
[13] Microsoft. Microsoft asp.net mvc: Getting started. http://www.asp.net/mvc,
2011.
[14] Julia Lerman & Rowan Miller. Programming Entity Framework : Code First.
O’REILLY, 2011.
[15] Jay Parlar. Vibration analysis and vibrating screens: Theory and practice. PhD
thesis, McMaster University, 2010.
[16] Pluralsight.
Introduction to asp.net mvc 3.
http://pluralsight.com/
training/Courses/TableOfContents/aspdotnet-mvc3-intro, 2011.
[17] The Open Web Application Security Projects. The ten most critical web application security risks. http://owasptop10.googlecode.com/files/OWASP%
20Top%2010%20-%202010.pdf, 2010.
[18] Ian Sommerville. Software engineering. Addison Wesley, 2007.
96
M.A.Sc. Thesis - Wisam Hussain
McMaster - Software Engineering
[19] Daniel Volante. Vibration based condition monitoring. Master’s thesis, McMaster University, 2011.
[20] Wikipedia. Nyquist shannon sampling theorem. http://en.wikipedia.org/
wiki/Nyquist%E2%80%93Shannon_sampling_theorem, 2001.
97