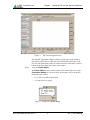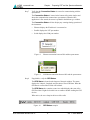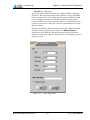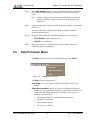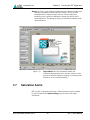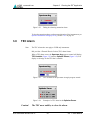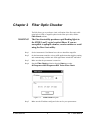
1
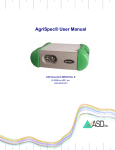
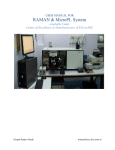
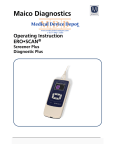
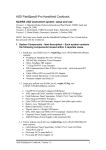
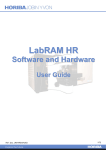
RS ™ User Manual
3
ASD Document 600545 Rev. E
© 2008 by ASD Inc.
www.asdi.com
www.asdi.com
Trademark Information
ASD Inc.
2555 55th Street
Boulder, CO 80301 USA
Phone: (303) 444-6522
www.asdi.com
Trademarks FieldSpec®, LabSpec®, QualitySpec®, TerraSpec®,
AgriSpec®, RxSpec®, ViewSpec™, RS3™, Indico™, goLab™, and
HandHeld2™ are registered, and unregistered trademarks, and the intellectual
property of Analytical Spectral Devices, Inc. (dba ASD Inc.). All trademarks
used or displayed in this material are the property of ASD, its affiliates, or
third party owners. Unauthorized use of these trademarks is illegal and
punishable by law. Nothing contained on this Site is to be construed as
granting, by implication, estoppel, or otherwise, any license or right of use of
any such trademark without the prior and express written permission of ASD,
or such third party owner.
This document contains proprietary information protected by copyright law
and may not be reproduced in any manner without the express written
approval of ASD Inc.
The information and specifications contained in this manual are subject to
change without notice. ASD Inc. shall not be held liable for technical,
editorial omissions, or errors made herein; nor for incidental or consequential
damages resulting from furnishing, performance, or use of this material.
Technical Support
If you have any questions or concerns, please contact ASD Inc. by phone, fax,
or email:
Phone: 303-444-6522 X-144
Fax: 303-444-6825
email: [email protected]
Web: www.asdi.com
ftp: ftp.asdi.com
Technical support is committed to providing you with a timely response to
your questions. We will work with you to provide solutions to your
applications. Technical support is available to answer your questions Monday
thru Friday, 8 am to 5 pm Mountain Standard Time. We will happily respond
to your e-mail queries as well.
ASD Document 600545 Rev. E
ii
RS3™ User Manual
Table of Contents
Trademark Information . . . . . . . . . . . . . . . . . . . . . . . . . . . . . . . . . . . . . . . . . . . ii
Technical Support . . . . . . . . . . . . . . . . . . . . . . . . . . . . . . . . . . . . . . . . . . . . . . . ii
Chapter
Preparing RS3 and the Spectroradiometer. . . . . . . . . . . . . . . . . . . . . . . . . . . . v
Verifying the Hardware Connections . . . . . . . . . . . . . . . . . . . . . . . . . . . . . . . v
Power . . . . . . . . . . . . . . . . . . . . . . . . . . . . . . . . . . . . . . . . . . . . . . . . . . . . v
Data Communication . . . . . . . . . . . . . . . . . . . . . . . . . . . . . . . . . . . . . . . .vii
Accessory Ports . . . . . . . . . . . . . . . . . . . . . . . . . . . . . . . . . . . . . . . . . . . .vii
Power ON Sequence . . . . . . . . . . . . . . . . . . . . . . . . . . . . . . . . . . . . . . . . . . viii
Chapter
Running the RS3 Application . . . . . . . . . . . . . . . . . . . . . . . . . . . . . . . . . . . . . xiii
Quick Start . . . . . . . . . . . . . . . . . . . . . . . . . . . . . . . . . . . . . . . . . . . . . . . . . . xiii
Pull-down Menus . . . . . . . . . . . . . . . . . . . . . . . . . . . . . . . . . . . . . . . . . . . . . xiv
Display Pull-down Menu . . . . . . . . . . . . . . . . . . . . . . . . . . . . . . . . . . . . . . . . .xv
Axes... [Alt+D, A] . . . . . . . . . . . . . . . . . . . . . . . . . . . . . . . . . . . . . . . . . . .xv
Cursor... [Alt+D, C]. . . . . . . . . . . . . . . . . . . . . . . . . . . . . . . . . . . . . . . . . xvii
Grid... [Alt+D, G] . . . . . . . . . . . . . . . . . . . . . . . . . . . . . . . . . . . . . . . . . . xviii
Line Properties... [Alt+D, L]. . . . . . . . . . . . . . . . . . . . . . . . . . . . . . . . . . . xix
View Files... [Alt+D, V] . . . . . . . . . . . . . . . . . . . . . . . . . . . . . . . . . . . . . . .xx
Freeze [F6] . . . . . . . . . . . . . . . . . . . . . . . . . . . . . . . . . . . . . . . . . . . . . . . xxii
Quit.... [Alt+Q] . . . . . . . . . . . . . . . . . . . . . . . . . . . . . . . . . . . . . . . . . . . xxiii
Control Pull-down Menu . . . . . . . . . . . . . . . . . . . . . . . . . . . . . . . . . . . . . . . xxiii
Take Dark Current measurement [F3] . . . . . . . . . . . . . . . . . . . . . . . . . xxiv
Initialize Radiometric measurement [F9] . . . . . . . . . . . . . . . . . . . . . . . .xxv
Take White Reference measurement [F4] . . . . . . . . . . . . . . . . . . . . . . .xxv
Adjust Configuration...[Alt+C, C]. . . . . . . . . . . . . . . . . . . . . . . . . . . . . . xxvi
Optimize Instrument Settings [Ctrl+O] . . . . . . . . . . . . . . . . . . . . . . . . . xxix
Abort Spectrum Collection [Ctrl+A] . . . . . . . . . . . . . . . . . . . . . . . . . . . . .xxx
Parabolic Correction measurement [Ctrl+P] . . . . . . . . . . . . . . . . . . . . . xxxi
Spectrum Save [Alt+S] . . . . . . . . . . . . . . . . . . . . . . . . . . . . . . . . . . . . . xxxii
ViewSpec Pro...[Alt+C, V] . . . . . . . . . . . . . . . . . . . . . . . . . . . . . . . . . . . xxxv
GPS Pull-down Menu . . . . . . . . . . . . . . . . . . . . . . . . . . . . . . . . . . . . . . . . . xxxv
Help Pull-down Menu . . . . . . . . . . . . . . . . . . . . . . . . . . . . . . . . . . . . . . . . xxxvii
© 2008 ASD Inc.
iii
RS3™ User Manual
www.asdi.com
Saturation Alarm. . . . . . . . . . . . . . . . . . . . . . . . . . . . . . . . . . . . . . . . . . . .xxxviii
TEC Alarm . . . . . . . . . . . . . . . . . . . . . . . . . . . . . . . . . . . . . . . . . . . . . . . . xxxix
Chapter 1
RS3 Introduction . . . . . . . . . . . . . . . . . . . . . . . . . . . . . . . . . . . . . . . . . . . . . . . . . 1
Computer Requirements for RS3 . . . . . . . . . . . . . . . . . . . . . . . . . . . . . . . . . . 1
Windows Vista User Setup . . . . . . . . . . . . . . . . . . . . . . . . . . . . . . . . . . . . 2
Spectroradiometer . . . . . . . . . . . . . . . . . . . . . . . . . . . . . . . . . . . . . . . . . . . . . 3
Chapter 2
Fiber Optic Checker . . . . . . . . . . . . . . . . . . . . . . . . . . . . . . . . . . . . . . . . . . . . . . 5
Chapter 3
RS3 Quick Reference . . . . . . . . . . . . . . . . . . . . . . . . . . . . . . . . . . . . . . . . . . . . . 7
Index . . . . . . . . . . . . . . . . . . . . . . . . . . . . . . . . . . . . . . . . . . . . . . . . . . . . . . . . . . 9
ASD Document 600545 Rev. E
iv
RS3™ User Manual
Chapter
Preparing RS and the
Spectroradiometer
3
Note:
.1
This manual assumes that the RS3 application software has been installed and
correctly configured, as per the Installation Guide.
Verifying the Hardware Connections
With the Spectrometer and the instrument controller turned OFF, verify the
cabling connections.
.1.1
Power
The ASD Spectrometer expects input power to be 12 VDC. The two options
for providing the appropriate DC voltage are:
•
An external power supply which converts Standard US 110 VAC to
12 VDC.
•
An external battery pack which delivers 12 VDC.
Insert power (battery or power supply) into the receptical on the back panel
labeled “INPUT 12 VDC” (shown in Figure 2-1). Lock the connector in
place by twisting the barrel end of the connector clockwise.
© 2008 ASD Inc.
v
RS3™ User Manual
www.asdi.com
Chapter
Preparing RS3 and the Spectroradiometer
Figure -1
ASD Spectrometer back panel showing Ethernet
connection, power switch, and power input jack.
Figure -2
ASD Spectrometer back panel showing Ethernet
connection, power switch, and power input jack.
ASD Document 600545 Rev. E
vi
RS3™ User Manual
www.asdi.com
.1.2
Chapter
Preparing RS3 and the Spectroradiometer
Data Communication
The instrument controller can communicate with the ASD Spectrometers with
one of four different protocols:
•
Ethernet RJ45 (shown in Figure 2-1)
•
Parallel DB-25 IEEE1284
•
Serial DB-9
•
Wireless
Ethernet is the default communication protocol for all newer ASD
Spectrometers.
Refer to the Installation Guide for information on configuring the instrument
controller’s Windows operating system for Ethernet, parallel, serial, or
wireless communication.
Verify that the cables for your communication protocol are connected
between the spectrometer and the instrument controller.
.1.3
Accessory Ports
Figure 2-3 shows the accessory ports on the front panel of many ASD
Spectrometers, such as the AgriSpec. These ports are used to connect the fiber
optical cable used by the sensing tip or probe and to provide any required DC
power to the probe or other external devices for light sources.
Note:
Some ASD Spectrometers, such as the FieldSpec, do not permit removal of
the fiber optical cable from the front of spectrometer, because its fixed
mounting within the instrument eliminates a variable fiber junction that could
attenuate the light signal being measured. The probe or tip on the other end of
the cable, however, can be changed as required for the task.
Figure -3
ASD Document 600545 Rev. E
Enhanced view of the font panel with the fiber cable
connector and accessory power jack for probe for the
AgriSpec, LabSpec, and TerraSpec.
vii
RS3™ User Manual
www.asdi.com
Chapter
Figure -4
.2
Preparing RS3 and the Spectroradiometer
Enhanced view of the font panel with the fiber cable
connector and accessory power jack for probe for the
FieldSpec.
Step 1
If applicable, attach the special power cable from the auxilliary power jack to
the contact probe or source probe.
Step 2
If applicable, connect the fiber cable to the optical cable port.
Step 3
Attach the appropriate tip or probe to the other end of the fiber cable.
Power ON Sequence
Once you have verified all cable connections are in place, you may initiate the
power ON sequence.
Step 1
Turn ON the ASD Spectrometer first using the power switch on the back of
the device, as is shown in Figure 2-1.
Step 2
Turn ON the instrument controller or computer with the FieldSpec (or
AgriSpec, TerraSpec, LabSpec, QualitySpec, or other ASD
spectroradiometer) application software.
Note:
Once the ASD Spectrometer has been turned on, it will begin sending
information over the data communication path, whether or not the instrument
controller and the RS3 application are running to collect that data.
Step 3
Start the RS3 application. Options for starting it are:
•
•
Through the Desktop icons:
»
RS3 desktop with a color scheme suitable for indoor use.
»
High Contrast RS3 icon launches RS3 with a different color scheme
that allows for easier viewing outdoors on most laptop LCD screens.
From the Start menu under All Programs->ASD Programs->RS3.
ASD Document 600545 Rev. E
viii
RS3™ User Manual
www.asdi.com
•
Chapter
Preparing RS3 and the Spectroradiometer
From navigating your harddisk and its default location, launch the
executable file: C:\Program Files\ASD\RS3\RS3.exe
As the software loads, a splash screen with the software version, instrument
serial and calibration number, and the spectrometer type will appear
(Figure 2-5).
Figure -5
Step 4
RS3 software splash screen.
Ensure the instrument and calibration numbers match the spectrometer. The
spectrometer serial number is located on the back of the instrument. The
Help->About menu item displays the information that the RS3 application
has about the spectrometer (same as the splash screen).
If the spectrometer’s serial number does not match what the RS3 application
has, contact Technical Support at ASD Inc.
Step 5
When the application finishes loading, the main navigation screen seen
(Figure 2-6) will open. At this point you may notice the software is already
running and the collection of data has begun.
ASD Document 600545 Rev. E
ix
RS3™ User Manual
www.asdi.com
Chapter
Figure -6
Preparing RS3 and the Spectroradiometer
RS3 main navigation screen.
The main RS3 application window contains a graph region in the middle, a
menu and toolbar at the top, GPS data at the bottom and status boxes on the
left. The main application window is sizable and can be controlled by window
buttons in the upper right hand corner of the window.
Step 6
Verify the Power Status.
The Power Status is located at the bottom of the main window next to the
Connection Status.The volt level of the spectrometer will be reported in
the balloon type window.
•
11-12 Volts is considered good (full).
•
<11 Volts issues a warning.
Figure -7 Example of a Power Status
ASD Document 600545 Rev. E
x
RS3™ User Manual
www.asdi.com
Step 7
Chapter
Preparing RS3 and the Spectroradiometer
Verify that the Connection Status is correct for communicating with the
spectrometer.
The Connection Status is located at the bottom of the main window and
shows the communication connection to spectrometer. When the RS3
application is first started, the status is updated in the balloon type window.
The Connection Status will also display any warnings during operation of
the instrument.
Step 8
•
Ethernet displays the IP address it is connected to.
•
Parallel displays the LPT port number.
•
Serial displays the COM port number.
Figure -8
Ethernet connection between RS3 and the spectrometer.
Figure -9
No Ethernet connection between RS3 and the spectrometer.
If applicable, verify the GPS Status.
The GPS Status is located at the bottom of the main window. The status
displays the Latitude, Longitude and Elevation of fixed GPS data. When the
GPS data is not fixed these fields will be blank.
The GPS Status also contains a status icon which displays the state of the
GPS fixed data. Right click on this icon to enable or disable reading the GPS
devices.
When active, the wave shape in the lower-left scrolls.
Figure -10
ASD Document 600545 Rev. E
GPS Status example.
xi
RS3™ User Manual
www.asdi.com
Chapter
Preparing RS3 and the Spectroradiometer
Notes:
ASD Document 600545 Rev. E
xii
RS3™ User Manual
Chapter 3
3.1
Running the RS Application
3
Quick Start
Step 1
Follow the Power ON Sequence in section 2.2 on page 8,
Step 2
Start the RS3 application,
•
•
Step 3
Through the Desktop icons:
»
RS3 desktop with a color scheme suitable for indoor use.
»
High Contrast RS3 icon launches RS3 with a different color scheme
that allows for easier viewing outdoors on most laptop LCD screens.
From the Start menu under All Programs->ASD Programs->RS3.
Verify that the initial splash screen does not display any communication
errors.
If there are errors, you must resolve them before continuing.
Step 4
Place a white reference under the probe.
Note:
Step 5
The reference must be placed under the probe at the same angle that
the samples will be placed under the probe.
Optimize the spectroradiometer, as per “Optimize Instrument Settings
[Ctrl+O]”, Section 3.4.5 on page 29.
The spectroradiometer must be optimized before any data is collected.
Optimization sets the proper settings for the light source you will be using to
collect spectra. If the light source does not change substantially and the
instrument is warmed up, there should not be a reason to re-optimize.
Optimization has no affect on the data unless the measurement has drifted
either towards saturation or too low, in which case optimization is mandatory.
The RS3 application provides a warning in these situations. In contrast to
optimization, a white reference should be done as often as possible but at a
minimum every ten to fifteen minutes when using solar illumination and
every thirty minutes when using artificial illumination sources.
Step 6
© 2008 ASD Inc.
Take a white reference reading, as per “Take White Reference measurement
[F4]”, Section 3.4.3 on page 25.
13
RS3™ User Manual
www.asdi.com
Step 7
Chapter 3
Place your sample under the probe.
Note:
Step 8
3.2
Running the RS3 Application
The sample must be placed under the probe at the same angle that the
white reference was placed under the probe.
Save the results of the spectrum, as per “Spectrum Save [Alt+S]”, Section
3.4.8 on page 32.
Pull-down Menus
RS3 has a small number of pull-down menus which can all be accessed with
the mouse or the keyboard., as is shown Figure 3-1:
•
Display Pull-down Menu
•
Control Pull-down Menu
•
GPS Pull-down Menu
•
Help Pull-down Menu
Figure 3-1
Pull-down menus.
When using the keyboard, press the ALT key and the key corresponding to the
underlined letter in the menu name, such as:
•
Alt+D for Display,
•
Alt+C for Control,
•
Alt+G for GPS, and
•
Alt+H for Help.
Once the pull-down menu is open, further operations can be launched by
pressing the key corresponding to the underlined letter in the desired
pull-down menu item.
In addition, many RS3 operations are available directly through function keys
(e.g., F1 through F12), other hot-key combinations, and icons within the
application’s toolbar. The items listed in a given pull-down menus typically
shows to the right what its hot-key is.
Figure 3-2
ASD Document 600545 Rev. E
RS3 toolbar.
14
RS3™ User Manual
www.asdi.com
3.3
Chapter 3
Running the RS3 Application
Display Pull-down Menu
The Display pull-down menu can be reached using the mouse or Alt+D. It
includes the items:
•
Axes... [Alt+D, A]
•
Cursor... [Alt+D, C]
•
Grid... [Alt+D, G]
•
Line Properties... [Alt+D, L]
•
View Files... [Alt+D, V]
•
Freeze [F6]
•
Quit.... [Alt+Q]
Figure 3-3
3.3.1
Display pull-down menu
Axes... [Alt+D, A]
The Axes... item (Display->Axes... [Alt+D, A]) allows you change the
viewable range for both the X and Y axes. Both the minimum and maximum
levels can be set. If you changed the viewable range, this dialog box can also
be used to restore the default ranges.
ASD Document 600545 Rev. E
15
RS3™ User Manual
www.asdi.com
Chapter 3
Figure 3-4
Running the RS3 Application
The Axes... item [Alt+D, A] to configure the display axes.
While the X-axis remains in wavelengths (nm), the Y-axis type can be
changed to:
Note:
•
raw DN (Digital Number coming from the spectroradiometer)
•
transmission
•
reflectance
•
radiance
•
irradiance
•
absorption
In order to change the Y-axis type from this dialog box, you must first initiate
a White Reference for the desired type. Refer to Take White Reference
measurement [F4].
With the exception of the axis type, these same XY range parameters can be
changed using the options from Cursor... [Alt+D, C] or the toolbar buttons,
such as Pan, Zm, or XY.
ASD Document 600545 Rev. E
16
RS3™ User Manual
www.asdi.com
3.3.2
Chapter 3
Running the RS3 Application
Cursor... [Alt+D, C]
The Cursor Mode dialog box (Display->Cursor... [Alt+D, C]) shows
radio buttons to assist in viewing an appropriate range of the spectrum. The
operations available from this dialog box are also available from the toolbar.
Figure 3-5
The Cursor... item [Alt+D, C]
Pan button (or Pan Mode setting) allows you to move the zoom viewing
rectangle through the use of the horizontal and vertical scroll bars, or the
left/right up/down arrow keys of the keyboard. The Ctrl+arrow keys
move the view rectangle in larger steps.
Zm button (or Zoom Mode setting) allows you to click & drag a rectangle
with your cursor in the graphing area, thereby zooming the viewing area
and the XY-axis scaling to that range. The left/right up/down arrow
keys of the keyboard can also be used to zoom the image. The
Ctrl+arrow keys zoom the view rectangle in larger steps The
right-mouse button has an option to Undo Zoom.
XY button (or Coordinate Mode setting) allows you to move the cursor to a
specific point in the spectrum and have its XY coordinates displayed in
the lower left-hand corner of the application. The point can be specified
with the mouse or with the left/right up/down arrow keys of the
keyboard.
ASD Document 600545 Rev. E
17
RS3™ User Manual
www.asdi.com
Chapter 3
Running the RS3 Application
OP button (or Optimize Params Mode) displays in the lower left-hand
corner of the application the optimized parameters for VNIR spectrum
collection time and the Gain & Offset for the SWIR spectrum. The values in
the Optimize Params area are related to the Opt button; refer to Optimize
Instrument Settings [Ctrl+O].
3.3.3
Grid... [Alt+D, G]
The Display Grid dialog box (Display->Grid [Alt+D, G]) shows radio
buttons to help subdivide and mark up the graphed spectrum for ease of
viewing.
The settings apply to the X and Y axes independently. Options include:
No Grid turns off any settings established by the other settings leaving a
clean spectral graph.
Tick Marks turns on tiny marks along the respective X and/or Y axis to help
distinguish the range.
Major Lines Only turns on graph lines for major division that extend
perpendicularly across the graph from the selected axis. The interval used
for the major line depends on the zoom scaling and for the X-axis
(wavelength) could be 250 nm, 100 nm, 50 nm, 10 nm, etc.
Major Lines and Minor Lines turns on graph lines for all divisions that
extend perpendicularly across the graph from the selected axis. The
interval for the grid markings depends on the zoom scaling.
ASD Document 600545 Rev. E
18
RS3™ User Manual
www.asdi.com
Chapter 3
Figure 3-6
3.3.4
Running the RS3 Application
The Grid... item [Alt+D, G] to specify grid properties
Line Properties... [Alt+D, L]
The Line Properties dialog box allows you to change the line properties of
the displayed spectra for better viewing. You can change the thickness and
color of the line.
ASD Document 600545 Rev. E
19
RS3™ User Manual
www.asdi.com
Chapter 3
Figure 3-7
Running the RS3 Application
The Line Properties... item [Alt+D, L]
To change a line’s style:
3.3.5
Step 1
Make sure that the RS3 is displaying an active spectra from the
spectroradiometer or one or more spectra retrieved from a file.
Step 2
Open the Line Properties dialog box using one of the available methods:
•
Display->Line Properties...
•
[Alt+D, L]
•
Right-Click->Line Properties...
Step 3
Select the line you want to change within the dialog box.
Step 4
Select its type and color.
View Files... [Alt+D, V]
RS3 allows you to display up to five different spectra in the graph region
while collecting a current spectrum of the target sample. The previously
captured spectra must be of the same data type as the spectra being viewed in
real-time.
ASD Document 600545 Rev. E
20
RS3™ User Manual
www.asdi.com
Chapter 3
Running the RS3 Application
To setup files to view:
Step 1
Select Display->View Files… from the pull-down menus.
Note:
Due to the difference in the Y Axis units of different types of spectra
files, RS3 may only allow viewing of spectra of the same Y Axis file
types. Thus, only like file types will be displayed.
Dialog box to view several spectrum at once.
Figure 3-8
Dialog box to view several spectrum at once.
Step 2
Select the Select Spectrum Files button to specify files to display.
Step 3
Select up to five files to view.
ASD Document 600545 Rev. E
21
RS3™ User Manual
www.asdi.com
Chapter 3
Figure 3-9
Step 4
3.3.6
Dialog box to select spectrum files to view.
Select OK to view the selected files in the graph region.
Note:
Step 5
Running the RS3 Application
To change the files to view type, remove all the files in the View Files
dialog box and then change the Y Axis type.
For better viewing and differientiation of the spectra, change the line
properties of the graphs. Refer to Line Properties... [Alt+D, L].
Freeze [F6]
The Freeze function is a toggle to allow the current spectra to be held in
place or released to real-time viewing. At the point, the spectra can be saved
and/or compared with other stored spectra files. The Freeze toggle function
is available through these methods.
•
Fz button from the toolbar
•
Display->Freeze
•
F6
•
Alt+D, F
Even though the diplay has been frozen, the spectroradiometer is still
transmitting new spectra.
Note:
If a Spectrum Save [Alt+S] operation is still being carried out (based on the
number of files to save and the saving time interval), these operations will
continue to happen in the background regardless of the frozen spectra display.
ASD Document 600545 Rev. E
22
RS3™ User Manual
www.asdi.com
3.3.7
Chapter 3
Running the RS3 Application
Quit.... [Alt+Q]
The RS3 application can be gracefully terminated using one of these methods:
•
Selecting Display->Quit with the mouse from the pull-down menus.
•
Typing Alt+D, Q or Alt+Q from the keyboard.
•
Selecting X-close button in the upper right-hand corner of the application
(standard Windows functionality) using the mouse.
The RS3 application verifies that you truly desire to exit the application.
Figure 3-10
WARNING!
3.4
Quit [Alt+D, Q] or Alt+Q
Terminating the RS3 application does not stop the
spectroradiometer from acquiring and transmitting data
to the instrument controller. Refer to the appropriate
spectroradiometer manual regarding turning it off.
Control Pull-down Menu
The Control pull-down menu can be reached using the mouse or Alt+C. It
includes the items:
•
Take Dark Current measurement [F3]
•
Initialize Radiometric measurement [F9]
•
Take White Reference measurement [F4]
•
Adjust Configuration...[Alt+C, C]
•
Optimize Instrument Settings [Ctrl+O]
•
Abort Spectrum Collection [Ctrl+A]
•
Parabolic Correction measurement [Ctrl+P]
ASD Document 600545 Rev. E
23
RS3™ User Manual
www.asdi.com
Chapter 3
•
Spectrum Save [Alt+S]
•
ViewSpec Pro...[Alt+C, V]
Figure 3-11
3.4.1
Running the RS3 Application
Control pull-down menu
Take Dark Current measurement [F3]
Dark Current (DC) refers to the amount of electrical current that is inherent in
the spectroradiometer’s electrical components and creeps into the detection
and photon measurement of the light signals. DC is a property of the detector
and the associated electronics (not the light source). DC varies with
temperature. In the VNIR region, Dark Current can also vary with integration
time. In order for accurate light data to be obtained, the DC at each channel
must be subtracted from the total signal at that channel.
The Dark Current (DC) measurement should be performed fairly often
during your sessions, and even more frequently while the spectroradiometer is
warming up. As such, the DC operation is automatic with Optimize
Instrument Settings [Ctrl+O] and Take White Reference measurement [F4].
The DC operation instructs the spectroradiometer to block off the light
entrance slit so that a “dark” signal can be measured for each channel. The
spectroradiometer measures this offset and stores it in the DCC (Dark Current
Correction) entry in its initialization file, asdcfg.ini. Once the DC is acquired
and stored, it is later subtracted automatically from signals at each channel in
order to obtain a more accurate light measurment.
You can initiate a DC measurement using:
•
DC button from the toolbar.
•
Control->Take Dark Current measurement pull-down menu item.
•
Alt+C, D key combination.
•
F3 hotkey.
ASD Document 600545 Rev. E
24
RS3™ User Manual
www.asdi.com
Chapter 3
Figure 3-12
3.4.2
Running the RS3 Application
Dark Current measurement progress indicator.
Initialize Radiometric measurement [F9]
Rad button initializes Radiometric measurement
Note:
Only available with the FieldSpec and HandHeld.
You can initiate a Rad measurement using:
3.4.3
•
Rad button from the toolbar.
•
Control->Initialize Radiometric measurement pull-down menu
item.
•
Alt+C, R key combination.
•
F9 hotkey.
Take White Reference measurement [F4]
The white reference is required because the spectroradiometer only measures
the intensity of a light field through a given point in space. Yet, reflectance
and transmittance are inherent properties of all materials and are independent
of the light source.
Reflectance is the actual fraction of incident light that is reflected from a
surface.
Transmittance is the fraction of incident light that passes through a given
material.
With the WR available and known, RS3 can computes the reflectance or
transmittance for the material being sampled by the spectroradiometer.
WR button takes a White Reference measurement. This is required to adjust
the future measurements to a known standard.
ASD Document 600545 Rev. E
25
RS3™ User Manual
www.asdi.com
Chapter 3
Running the RS3 Application
A material with approximately 100% reflectance across the entire spectrum is
called a white reference panel or white reference standard, usually
Spectralon.
Note:
When doing the WR operation, it is important to actually have a white
reference standard available for the spectroradiometer to measure.
You can initiate a WR measurement using:
•
WR button from the toolbar.
•
Control->Take White Reference measurement pull-down menu
item.
•
Alt+C, W key combination.
•
F4 hotkey.
A graph will display measurements in reflectance plotted against wavelength
with an initial value of 1.00. The data type on the main RS3 GUI will specify
reflectance. These ratio spectra are calculated in real time with RS3.
3.4.4
Adjust Configuration...[Alt+C, C]
The bane of all electrical data analysis is noise. Noise, in all of its forms,
manifests itself in detection equipment of any kind as an uncertainty of
measurement.
Noise is random. This means it can usually be reduced in the desired spectral
signal by a technique called spectrum averaging. If the noise is truly random,
then it will be reduced by an amount proportional to the square root of the
number of spectra averaged together. Thus, 16 spectra averaged will have
one-quarter the noise of a single spectrum, and an average of 64 spectra will
have half the noise of 16, and so forth. The spectroradiometer software is all
set up to do this averaging for you. A 100-sample spectrum will take roughly
ten times the time needed to acquire 10 samples.
With ASD spectroradiometers, you can collect spectra based on an average of
any number from one to around 32,000 samples (but the latter would take
almost an hour.) In order to be effective in an attack against noise though, you
must also collect an equivalent average of dark current spectra (VNIR region
only) and, for a reflectance spectrum, an equivalent average of the white
reference spectra as well; noise affects all of these equally, so they must be
taken into consideration in spectrum averaging.
Most researchers find that a sample average of around 10 to 25 is sufficient.
Some need an even better Signal-to-Noise (S/N) ratio than this can provide,
but prefer to average some of their own spectra in post-processing, to help
eliminate any possible spectral anomalies due to an unusual sample or poor
geometry. For example, if a field researcher needs one spectrum to represent
the ground foliage on 10,000 square meters of land (and there are no aircraft
available for the purpose), he or she might stand on top of a ladder or scaffold
in several locations on the land, or merely walk the land, and take a total of
ASD Document 600545 Rev. E
26
RS3™ User Manual
www.asdi.com
Chapter 3
Running the RS3 Application
10, or even 100 spectra of 25 to 100 samples each, depending on lighting
conditions and humidity. No single one of these spectra is likely to be
perfectly representative of this plot, but an average of all of them, calculated
through post-processing, will certainly be close.
Averaging shorter duration measurements in post-processing allows you to
deal with pesky low-frequency noise associated with partial cloud cover, wind
and motion through shadowed areas like under forest canopy. Sometimes, if
too many files are averaged in real-time, by the time even a white reference is
performed you may find the lighting conditions are changed-before you've
even had the chance start collecting data you can use.
The instrument uses signed arithmetic (positive & negative values) in
calculating spectrum averages, but does not write these negative values to the
file when finished. Therefore, negative values are written to final data as zero
values, which should not be incorporated into an average in post processing,
because of their false nature. Additionally, an equal number of upper outliers
should be discarded to compensate for the loss of these negative values. The
simplest solution is to use Median values in post processing, rather than
averages. You should find that when the number of spectra is greater than 25
or so, the difference in S/N improvement is negligible, and the low values in
your spectra, such as those in water bands and other saturated absorption
bands will be more accurate when using the median rather than the average.
Adjusting the Configuration for Spectrum Averaging
When adjusting the configuration of the spectroradiometer, you can modify:
•
Number of samples for Spectrum: The value of the spectrum average is
dependent on the collection needs. The greater the spectrum average, the
less noise however long the collect period.
•
Number of samples for Dark Current
•
Number of samples for White Reference.
•
Scan Type. This selection is only for instruments with NIR detectors. The
mechanical design allows collection of two different directions: A or B.
The default is AB Even. The scan type is used for special applications
and/or troubleshooting instrument problems. The AB Even selection
guarantees an equal number of A scans and B scans. For example, if a
sample count of 9 is requested, then 10 samples are collected - 5 A and 5
B scans. The A only selection collects only A scans. The B only selection
collects only B scans. The A or B selection collects different amounts of
A or B scans. For example, if a sample count of 9 is requested, then 9
samples are collected in two different combinations - 5 A and 4 B scans or
4 A and 5 B scans.
•
Absolute Reflectance Mode: With this box checked the spectral response
of the spectralon reference is incorporated into the data.
You can adjust the spectroradiometer’s configuration by using:
•
Control->Adjust Configuration pull-down menu item.
ASD Document 600545 Rev. E
27
RS3™ User Manual
www.asdi.com
•
Chapter 3
Running the RS3 Application
Alt+C, C key combination.
Figure 3-13
Instrument configuration.
The steps towards collecting absolute reflectance spectra:
Note:
ASD Technical Support must create an Absolute Reflectance file specific
to your calibration panel in order to view Absolute Reflectance, .
Step 1
Copy and paste the attached files into C:\Program Files\RS3 on your
operating computer.
Step 2
Edit the RS3.ini by inserting the name of the absolute reflectance file into it,
also located under C:\Program Files\RS3. This is done by simply opening
the RS3.ini file using Notepad and looking for the [INSTUMENT CONFIG]
section of the ini. This section is approximately ¾'s through the entire
document. Look for the text that states:
AbsoluteReflectanceFile=C\Program Files\RS3\bseXXXX.ref
where XXXX = instrument and calibration number.
ASD Document 600545 Rev. E
28
RS3™ User Manual
www.asdi.com
Step 3
Chapter 3
Running the RS3 Application
Edit the text so that the file matches the panel you are referencing. The
RS3.ini line should now state.
AbsoluteReflectanceFile=C\Program Files\RS3\absXXXX.ref
Step 4
Now that the software is referring to the calibrated base, launch your RS3
software.
Step 5
Go to the configuration menu (Alt+C) and place a check mark in the Absolute
Reflectance box.
Once this box is checked, all of the reflectance data will be represented and
collected as absolute reflectance, not relative reflectance.
Spectralon is not 100% reflective across the entire 350-2500 nm range. The
Absolute Reflectance measurement will be slightly below 1.0 at the longer
wavelengths. The spectra in Figure 3-14 is an example.
Figure 3-14
3.4.5
Example of the spectra which shows Absolute Reflectance
slightly below 1.0.
Optimize Instrument Settings [Ctrl+O]
The spectroradiometer must be optimized before any data is collected.
Optimization sets the proper settings for the light source you will be using to
collect spectra. If the light source does not change substantially and the
instrument is warmed up, there should not be a reason to re-optimize.
ASD Document 600545 Rev. E
29
RS3™ User Manual
www.asdi.com
Chapter 3
Running the RS3 Application
Optimization has no affect on the data unless the measurement has drifted
either towards saturation or too low, in which case optimization is mandatory.
The RS3 application provides a warning in these situations. In contrast to
optimization, a white reference should be done as often as possible but at a
minimum every ten to fifteen minutes when using solar illumination and
every thirty minutes when using artificial illumination sources.
Position the spectroradiometer and reference panel appropriate for the
illumination conditions.
WARNING!
The conditions and set-up of the reference panel should
be identical to how the samples will be measured.
You initiate optimization of the spectroradiometer by using one of the
following:
•
Opt button from the toolbar.
•
Control->Optimize Instrument Settings pull-down menu item.
•
Ctrl+O hotkey.
•
Alt+C, O key combination.
After Optimization, a graph will display measurements in raw digital numbers
(DN) plotted against wavelength in nm. Raw DN peaks will be visible
representing:
VNIR (350-1000 nm)
SWIR 1 (1000-1830 nm)
SWIR 2 (1830-2500 nm).
Note:
You might observe only two peaks or even one, depending upon the type of
the spectroradiometer, such as full-range VNIR-SWIR1-SWIR2 versus other
combinations of the three.
The data type on the main RS3 GUI will specify “raw DN” and the spectra can
now be saved in raw DN format.
Note:
3.4.6
A dark current is automatically captured during the optimization process.
Abort Spectrum Collection [Ctrl+A]
The Abort Spectrum Collection is applicable if:
•
Spectrum save settings were made to the number of files to save and their
interval. Or,
•
If Take White Reference measurement [F4] or Optimize Instrument
Settings [Ctrl+O] are being performed.
ASD Document 600545 Rev. E
30
RS3™ User Manual
www.asdi.com
Chapter 3
Running the RS3 Application
You abort the spectrum collection by using one of the following:
3.4.7
•
Control->Abort Spectrum Collection pull-down menu item.
•
Ctrl+A hotkey.
•
Alt+C, A key combination.
Parabolic Correction measurement [Ctrl+P]
Background: ASD Full Range instruments should be “warmed up” before
being used to collect radiometric data. The reason for this is the inherent
variations in detector sensitivity when used under different ambient
temperatures. The variations occur in the VNIR array and the SWIR2
detector, but do not appear to be pronounced in the SWIR1 detector (~1000 to
1800 nm).
Figure 3-15
Detector Responses during warmup period.
A sufficient warmup period can be difficult to achieve when the instrument is
used in the field – particularly when using battery power alone. The stability
of the SWIR1 detector offers a possible solution: Using the endpoints of
SWIR1 and the shape of the response change curves, it is possible to
mathematically characterize and adjust for the temperature-dependent
sensitivities of the two variable ranges.
ASD Document 600545 Rev. E
31
RS3™ User Manual
www.asdi.com
Chapter 3
Running the RS3 Application
Since the varying spectral regions appear somewhat parabolic, a pair of partial
parabolas inserted into what otherwise is an identity matrix can be used to
correct the temperature sensitive channels. This is known as Parabolic
Correction (see ftp://ftp.asdi.com/Technical Documents/pcorrect.pdf for
further details).
Note:
This parabolic correction function is only enabled when the graph Y Axis
region is in radiance or irradiance.
You initiate Parabolic Correction measurement by using one of the
following:
3.4.8
•
PC button from the toolbar.
•
Control->Parabolic Correction measurement pull-down menu
item.
•
Ctrl+P hotkey.
•
Alt+C, P key combination.
Spectrum Save [Alt+S]
You initiate Spectrum Save dialog box for setting save parameters by using
one of the following:
•
Control->Spectrum Save pull-down menu item.
•
Alt+S hotkey.
•
Alt+C, S key combination.
You initiate Spectrum Save by using one of the following:
•
Spacebar key: saves the file as per the settings.
•
Alt+Spacebar key: saves the file as per the settings and displays up to
five files on the screen.
•
OK button: accepts the values placed into the Spectrum Save window
•
Begin Save button: accepts the values placed into the Spectrum aved
window and starts immediately collecting data.
ASD Document 600545 Rev. E
32
RS3™ User Manual
www.asdi.com
Chapter 3
Figure 3-16
Running the RS3 Application
Dialog box to save the spectrum to a file.
Path name: the directory folder where files are to be saved. ASD
recommends creating a directory structure outside of
C:\Program Files\RS3) and using the year, month, and day as part of the
directory naming convention, such as:
C:\spectroradiometer\20050701
Base name: When Save As New File Format is checked, the base name
can be up to 27 characters long. The base name is concatenated with an
incrementing five digit sample number followed by an .asd extension. ie.
HgArSpec00001.asd. When Save As New File Format is unchecked the
base name only allows 8 characters in the filename used in each data file.
File names are DOS compatible 8.3, meaning 8 characters followed by a
period and then 3 digits in the extension. ASD recommends using base
names related to the samples being collected, such as HgArSpec: This
would result in files being created such as:
C:\spectroradiometer\20050701\HgArSpec:.000
Starting spectrum number: This field is the starting point for the three
digit file extension given to the filename. You can only enter the starting
value. If you specify 056 and assuming the example settings above, this
would result in:
ASD Document 600545 Rev. E
33
RS3™ User Manual
www.asdi.com
Chapter 3
Running the RS3 Application
C:\spectroradiometer\20050701\HgArSpec.056
Whenever a spectrum or sequence of spectra is saved, this number
automatically increments.
Number of files to save: This field specifies how many total files are to be
create each time the spectrum is saved. The time between file saves
depends on the interval setting. The starting value of the extension is
specified by the spectrum number and automatically increments. If you
specify, say, 6 and assuming the example settings above, this would result
in:
C:\spectroradiometer\20050701\HgArSpec:.056
C:\spectroradiometer\20050701\HgArSpec:.057
C:\spectroradiometer\20050701\HgArSpec:.058
C:\spectroradiometer\20050701\HgArSpec:.059
C:\spectroradiometer\20050701\HgArSpec:.060
C:\spectroradiometer\20050701\HgArSpec:.061
Interval between saves: This field specifies the time in seconds between
saving of the desired number of spectrum. This is only applicable when
more than one spectra file is to be saved, as set above.
Comments: This field specifies additional information. It can document
weather conditions, sample type, etc. These comments can be viewed in
the header details of ViewSpec Pro.
Additional information automatically saved with each spectrum:
•
Integration time, gain and offset values
•
Instrument serial and calibration number
•
Data type - Raw DN, Reflectance, transmission, etc.…
•
Date and time spectra was saved (as noted from the computers time
clock).
•
Number of samples averaged
•
Status field indicating when a dark current and/or white reference was
collected
•
Type of foreoptic used (if applicable)
•
GPS Data - Latitude, Longitude, and Elevation (if applicable)
•
Reference Spectrum.
Save As New File Format: When checked this field specifies saving the
file in the new file format with an asd extension. I.e. ArHgSpec00001.asd.
The data is saved in rawDN format with the reference spectrum. Contact
technical support for a detailed explanation of this file format. This
format allows easy conversion between reflectance, transmittance,
absorbance, radiance and irradiance. When this field is unchecked, the file
is saved as the old format, in the 8.3 DOS format. I.e. ArHgSpec.001.
ASD Document 600545 Rev. E
34
RS3™ User Manual
www.asdi.com
3.4.9
Chapter 3
Running the RS3 Application
ViewSpec Pro...[Alt+C, V]
You initiate ViewSpec Pro by using one of the following:
•
Control->ViewSpec Pro... pull-down menu item.
•
Alt+C, V key combination.
ViewSpec Pro is a separate program that is discussed in more detail in the
ViewSpec Pro User Manual.
3.5
GPS Pull-down Menu
The RS3 application can communicate with an external global positioning
system (GPS) which plugs into one of the ports of the instrument controller.
The GPS pull-down menu can be reached using the mouse or Alt+G.
Figure 3-17
GPS pull-down menu
When all aspects of the configuration (in the RS3 application, the instrument
controller, the GPS device, and the cabling between) have been established,
the GPS can provide positioning information to the RS3 application.
The GPS status is located at the bottom of the main window. The status
displays the Latitude, Longitude and Elevation of fixed GPS data. When the
GPS data is not fixed, these fields will be blank. The GPS status also contains
a status icon. This icon displays the state of the GPS fixed data. Right-click on
this icon to enable or disable reading the GPS devices. The waveform image
in the lower left-hand corner scrolls when enabled and active.
Figure 3-18
GPS information
The GPS information will also be made available to the spectra when it’s
saved to a file.
To configure the GPS:
Step 1
Select either:
•
GPS->Settings... pull-down menu item.
ASD Document 600545 Rev. E
35
RS3™ User Manual
www.asdi.com
•
Chapter 3
Running the RS3 Application
Alt+G, S key combination.
You need a National Marine Electronics Association (NMEA) compatible
GPS device. RS3 requires the output of the GPS device to be in the NMEA
GGA serial format. This is the format usually found in an NMEA text GPS
receiver configuration setting. This format is an RS232 format and will
require an RS232 interface cable from the GPS receiver. USB cables do not
typically work correctly. Check your GPS device documentation for output
and port settings.
Normally, the Baud rate, Data bits, Parity and Stop bits settings will remain
the same as what is displayed in the window. The Write to log file is
checked by default. When this field is checked and the GPS fixed data is
enabled, an entry will be made to a daily log file (i.e. 050302gps.log) when a
spectrum is saved.
Figure 3-19
ASD Document 600545 Rev. E
GPS settings menu
36
RS3™ User Manual
www.asdi.com
Step 2
Chapter 3
In the GPS Settings dialog box, enter communication settings appropriate
for your instrument controller’s port intended for use as well as the GPS
device.
Note:
Step 3
Running the RS3 Application
The RS3 settings on the instrument controller and the ports that are
used must match the actual port used as well as the settings of the
GPS device.
Connect an appropriate cable between the instrument controller’s port and the
GPS device.
You may need a serial-USB converter depending upon the instrument
controller and GPS device.
Step 4
Step 5
3.6
Enable the GPS functionality in the RS3 application by selecting either:
•
GPS->Enable... pull-down menu item.
•
Alt+G, E key combination.
Refer to the manual of your actual GPS device for further instructions
regarding usage and configuration.
Help Pull-down Menu
The Help pull-down menu can be reached using the mouse or Alt+H.
Figure 3-20
Help pull-down menu
The Help pull-down menu contains:
User Guide [Alt+H, U]: opens the PDF file containing the RS3™ User
Manual.
Online Documentation [Alt+H, O]: opens your default browser and an
HTML page. The page contains hyperlinks to the various ASD references
manuals (in PDF format) that have been installed on your system. At
minimum, you should have:
»
The hardware manual for your ASD spectroradiometer(s).
»
This RS3™ User Manual
»
The Installation Manual
»
The Accessories Manual
ASD Document 600545 Rev. E
37
RS3™ User Manual
www.asdi.com
Chapter 3
Running the RS3 Application
About [Alt+H, A]: opens a dialog box that shows the instrument number and
calibration information known to the RS3 software. This is the same
information that is displayed at RS3 start-up. The RS3 application
installed on your system has calibration to match your specific ASD
spectroradiometer. This dialog box helps you match the installation to the
spectroradiometer.
Figure 3-21
3.7
Help->About shows the instrument number and
calibration information known to the RS3 software. It also
provides a link to the instument webpage, by clicking on the
IP address, for use in troubleshooting.
Saturation Alarm
RS3 provides a saturation alarm feature. When saturation occurs an audible
beep will sound and the Spectrum Avg progress control will display
“Saturation”.
ASD Document 600545 Rev. E
38
RS3™ User Manual
www.asdi.com
Figure 3-22
Chapter 3
Running the RS3 Application
Dialog box showing saturation alarm.
To clear the saturation alarm, perform an optimization of the instrument as per
Optimize Instrument Settings [Ctrl+O], Section 3.4.5 on page 29.
3.8
TEC Alarm
Note:
The TEC Alarm does not apply to VNIR only instruments.
RS3 provides a Thermal Electric Cooler (TEC) alarm feature.
When a TEC alarm occurs, the Spectrum Avg progress control will display
TEC Unstable (Figure 3-22) and the Optimize Parms (Figure 3-23) will
display a red image for the TEC that is unstable.
Caution!
Figure 3-23
TEC Unstable in the Spectrum Averagin progress control.
Figure 3-24
Example of a TEC alarm in the Optimize Parms.
The TEC must stabilize to clear the alarm.
ASD Document 600545 Rev. E
39
RS3™ User Manual
www.asdi.com
Chapter 3
Running the RS3 Application
To clear the alarm, perform an optimization of the instrument as per Optimize
Instrument Settings [Ctrl+O], Section 3.4.5 on page 29.
When the TEC is working properly a green image (Figure 3-24) will be
displayed.
Figure 3-25
ASD Document 600545 Rev. E
Example of clearing a TEC alarm in the Optimize Parms.
40
RS3™ User Manual
Chapter 1
RS Introduction
3
RS3 refers to the third version of this ASD application and is pronounced "RS
cubed." Its purpose is:
1.1
•
to control the operation of an ASD general-purpose spectroradiometer;
and
•
to receive and store the spectral data transmitted from an ASD
spectroradiometer.
Computer Requirements for RS3
The instrument controller is a computer which manages the RS3, stores data,
and processes the results.
The minimum requirements for the instrument controller are:
•
1.2 GHz Pentium or better notebook or PC-w/monitor
•
256 MB RAM or more
•
20 GB of free disk space
•
Microsoft Windows® (95,98,ME,NT,2000,XP)
•
1024 x 768 or better graphics resolution
•
24-bit color or better - 32-bit recommended
•
Internet Explorer 6.0 or better
•
Ethernet port: 10/100 Base T Ethernet interface
•
(Optional) Ethernet wireless (Wi-Fi) adaptor: PCMIA, USB, or built-in
that is compatible with the 802.11b standard
•
(Optional) Serial communications port (or USB port) for GPS receiver.
Only needed if you want to use GPS.
•
(Optional) NMEA compatible GPS receiver
The instrument controller requires the following software:
•
© 2008 ASD Inc.
Either RS3 Software from ASD.
1
RS3™ User Manual
www.asdi.com
Chapter 1
RS3 Introduction
•
Or Indico Software from ASD.
•
Microsoft Windows® (2000,XP,Vista) Operating System.
Users need a basic understanding of the Microsoft Windows operating system
including software installation.
International customers using non-English versions of Windows® must alter
the Regional Settings under Start>Settings>Control Panel. The
default language must be set to English (United States) in order for the
software to be registered and operate correctly. The numbering format must
also be set to English.
1.1.1
Windows Vista User Setup
RS3 requires a user to have read, write and execute permissions to operate the
software. This can be accomplished in two ways: Create a user with
Administrator rights or create a standard user and provide read, write and
execute permissions to the c:\Program Files\ASD folder and subfolders. The
following are steps on how to create a standard user and provide read, write
and execute permissions.
Note:
These steps require Administrator rights to perform.
Step 1
Turn off the User Account Control (UAC).
Step 2
Step 3
•
Start Button - Control Panels - User Accounts.
•
Select Turn User Account Control on or off.
•
Uncheck Use User Account Control (UAC) to help protect your
computer.
•
Select OK.
Create a standard user.
•
Start Button - Control Panels - Administrative Tools - Computer
Management.
•
Expand Local Users and Groups.
•
Right click Users. Select New User...
•
Create a new user. Select Close.
Give Users group Full Control permission for the c:\Program Files\ASD
folder and subfolders.
•
Right click Start Button. Select Explore.
•
Right click c:\Program Files\ASD folder. Select Properties.
•
Select Security Tab.
•
Select Edit Button
•
Select Users Group.
ASD Document 600545 Rev. E
2
RS3™ User Manual
www.asdi.com
1.2
Chapter 1
RS3 Introduction
•
Check Full control, Modify, Read and execute, List folder contents, Read,
Write
•
Select OK to close Permissions for ASD.
•
Select OK to close ASD properties.
Spectroradiometer
The ASD general-purpose spectroradiometers are useful in many application
areas requiring the measurement of either reflectance or transmittance. The
ASD spectroradiometers are highly portable, yet perform competitively in the
laboratory as well.
The RS3 application comes standard with the following ASD
spectroradiometers:
•
FieldSpec
•
TerraSpec
•
AgriSpec
•
HandHeld
The RS3 application can be ordered separately and used with the following
ASD spectroradiometers:
Note:
•
LabSpec
•
QualitySpec
A single instrument controller cannot control more than one ASD
spectroradiometer, because the configuration files are calibrated to a specific
spectroradiometer.
ASD Document 600545 Rev. E
3
RS3™ User Manual
www.asdi.com
Chapter 1
RS3 Introduction
Notes:
ASD Document 600545 Rev. E
4
RS3™ User Manual
Chapter 2
Fiber Optic Checker
The RS3 allows you to perform a visual verification of the fiber optic cable
using built-in LEDs, a magnifier placed on the fiber optic cable, and the
Fiber Check software.
WARNING!
The Fiber Check utility produces rapid flashing lights in
the SWIR 1 and 2 region's optical fibers. If you are
susceptible to epileptic seizures, exercise caution or avoid
using the Fiber Check utility.
Step 1
See the instrument’s User Manual to see how to install the magnifier.
Step 2
On the instrument controller, exit any ASD applications that might be running
and communicating with the unit. Such applications include RS3 and Indico.
Step 3
Make sure that the spectrometer is turned on.
Step 4
Start the Fiber Check application from the Start menu under
All Programs->ASD Programs->RS3 Tools->Fiber Check.
Figure 2-1
Step 5
© 2008 ASD Inc.
Fiber Check Program
Make sure the IP address configured is the one for your spectrometer.
5
RS3™ User Manual
www.asdi.com
Chapter 2
Fiber Optic Checker
Step 6
Use the mouse to select the checkbox for the LED to turn on: VNIR, SWIR1,
or SWIR2. One or more may be selected at once.
Note:
If you select a range that the spectrometer doesn’t have, that particular LED
will not be available to turn on. Nothing will be harmed.
Step 7
Select the Check button which turns on the selected LEDs.
Step 8
Look through the magnifier to see which fibers light up.
•
Count the number of fibers that show light. Refer to Details about the
Fiber Optic Cable and LEDs.
•
If applicable, use the checkboxes and the Check button shown in
Figure 5-1 to turn on and off different LEDs to help determine which
range might be affected.
Note:
Step 9
The RED LED for VNIR may be hard to see when the other
ranges are enabled.
When you are finished, shutdown the Fiber Check application.
Details about the Fiber Optic Cable and LEDs
•
The LEDs will only turn on for the ranges installed in the spectrometer.
Selecting one that the spectrometer doesn’t have will not cause a problem.
•
Each range has a different LED color so that you can see the fibers in the
cable that are associated with it: RED for VNIR; WHITE for SWIR1;
GREEN for SWIR2.
The instrument can be successfully used with a few broken fibers in each
range, although with a reduction in signal strength.
ASD Document 600545 Rev. E
6
RS3™ User Manual
Chapter 3
Table 3-1
RS Quick Reference
3
RS3 Shortcut Quick Reference
FUNCTION
SHORTCUT KEY
Optimization
Ctrl+O
Fore optic selection
F7 (decrease to match fore optic size)
F8 (increase to match fore optic size)
Measure dark current
F3
Measure white reference
F4
Alternate zoom/pan/coordinate
modes
F5
Freeze screen
F6
Initialize radiometric calculation
F9
Apply parabolic correction to
radiometric spectra
Ctrl+P
Move cursor left/right
Left/Right Arrows (for one data point)
Ctrl + Left/Right (for large increments)
© 2008 ASD Inc.
Move cursor one data point
Ctrl+Left/Right
Move cursor to first/last data point
Home/End
Zoom in/out on X-axis
Left/Right arrows
Zoom in/out on Y-axis
Up/Down arrows
Zoom in/out full X-axis
Home/End
Zoom in/out full Y-axis
Page Up/Page Down
Pan left/right
Left/Right arrows
Pan up/down
Up/Down arrows
Pan left/right to edge
Home/End
Pan top/bottom to edge
Page Up/Page Down
Undo last pan/zoom
Ctrl+U
7
RS3™ User Manual
www.asdi.com
Table 3-1
Chapter 3
RS3 Quick Reference
RS3 Shortcut Quick Reference
FUNCTION
SHORTCUT KEY
Restore default settings
Ctrl+R
Open fore optic menu
Ctrl+F
Open spectrum type menu
Ctrl+Y (use up/down arrows to maneuver
menu)
Abort current task
Ctrl+A
Open spectrum Save dialog
Alt+S
Save spectrum
Spacebar
Save spectrum and display file
Alt+Spacebar
Quit Application
Alt+Q
Remove display spectrum
Alt+X
Undo Zoom
Ctrl+Z
Toggle viewing spectrum file 1
Alt+1
Toggle viewing spectrum file 2
Alt+2
Toggle viewing spectrum file 3
Alt+3
Toggle viewing spectrum file 4
Alt+4
Display Axes
Alt+D, A
Display Cursor
Alt+D, C
Display Grid
Alt+D, G
Line Properties
Alt+D, L
ASD Document 600545 Rev. E
8
RS3™ User Manual
Index
communication vii
computer requirement 1
Control
abort spectrum collection xxx
adjust configuration xxvi
initialize radiometric xxv
optimize instrument settings xxix
parabolic correction xxxi
pull-down menu xxiii
spectrum save xxxii
take dark current measurement xxiv
take white reference xxv
ViewSpec Pro xxxv
coordinate mode xvii
Ctrl+A (abort current task) 8
Ctrl+A (abort spectrum collection) xxx
Ctrl+F (open fore optic menu) 8
Ctrl+O (optimization) 7
Ctrl+O (optimize instrument settings) xxix
Ctrl+P (parabolic correction) xxxi, 7
Ctrl+R (restore default settings) 8
Ctrl+U (undo last pan/zoom) 7
Ctrl+Y (open spectrum type) 8
cursor xvii
A
abort spectrum collection xxx
absolute reflectance xxviii
accessory ports vii
adjust configuration xxvi
AgriSpec 3
alarm
saturation xxxviii
TEC xxxix
Alt+1 (toggle viewing spectrum file) 8
Alt+2 (toggle viewing spectrum file) 8
Alt+3 (toggle viewing spectrum file) 8
Alt+4 (toggle viewing spectrum file) 8
Alt+C
A (abort spectrum collection) xxx
C (adjust configuration) xxvi
D (dark current) xxiv
O (optimize instrument settings) xxix
P (parabolic correction) xxxi
R (initialize radiometric) xxv
S (spectrum save) xxxii
V (ViewSpec Pro) xxxv
W (white reference) xxv
Alt+D
A (axes) xv, 8
C (cursor) xvii, 8
F (freeze) xxii
G (grid) xviii, 8
L (line properties) xix, 8
Q (quit) xxiii
Alt+G
GPS pull-down menu xxxv
S (GPS settings) xxxv
Alt+H
A (about) xxxvii
O (Online Documentation) xxxvii
U (User Guide) xxxvii
Alt+Q (quit) 8
Alt+S (spectrum save) xxxii, 8
Alt+spacebar 8
Alt+spacebar (save file and display) xxxii
Alt+X (remove display spectrum LIFO) 8
axes xv
D
dark current xxiv
data communication vii
DC xxiv
Display
axes xv
cursor xvii
freeze xxii
grid xviii
line properties xix
pull-down menu xv
quit xxiii
view files xx
F
F3 (dark current) xxiv, 7
F4 (white reference) xxv, 7
F5 (zoom, pan, coordinate modes) 7
F6 (freeze) xxii, 7
F7 (decrease fore optic size) 7
F8 (increase fore optic size) 7
C
check fiber optic cables 5
© 2008 ASD Inc.
9
RS3™ User Manual
www.asdi.com
Index
F9 (initialize radiometric) xxv, 7
fiber check 5
FieldSpec3 3
file
base name xxxiii
extention (starting spectrum number) xxxiii
number to save xxxiv
path name xxxiii
view xx
freeze xxii
Fz xxii
O
offset xviii
optimize instrument settings xxix
optimize parameters xxxix
optimize params mode xviii
P
pan mode xvii
parabolic correction xxxi
power v
power on sequence viii
pull-down menus xiv
G
gain xviii
GPS
pulldown menu xxxv
grid xviii
major lines xviii
minor lines xviii
no grid xviii
tick marks xviii
Q
QualitySpec 3
quick start xiii
quit xxiii
R
radiometric
initialize xxv
H
S
HandHeld 3
Help
pull-down menu xxxvii
saturation alarm xxxviii
software requirement 1
spacebar 8
spacebar (save file) xxxii
spectroradiometer 3
spectrum
files xx
spectrum averaging xxxix
saturation alarm xxxviii
spectrum save xxxii
base name xxxiii
comments xxxiv
extension xxxiii
interval between saves xxxiv
number of files to save xxxiv
path name xxxiii
starting spectrum number xxxiii
support ii
I
instrument controller 1
interval between saves xxxiv
L
LabSpec 3
language settings, Windows 2
LED fiber optic check 5
line properties xix
M
major lines (grid) xviii
menu
Control pull-down xxiii
Display xv
GPS pull-down xxxv
help xxxvii
pull-down xiv
minor lines xviii
mode
optimize params xviii
pan xvii
XY xvii
zoom xvii
T
TEC alarm xxxix
technical support ii
TerraSpec 3
tick marks xviii
trademarks ii
V
view files xx
ViewSpec Pro xxxv
N
no grid xviii
ASD Document 600545 Rev. E
10
RS3™ User Manual
www.asdi.com
Index
W
white reference xxv
Windows language settings 2
X
XY xvii
Z
zm xvii
zoom mode xvii
ASD Document 600545 Rev. E
11
RS3™ User Manual
www.asdi.com
ASD Document 600545 Rev. E
Index
12
RS3™ User Manual