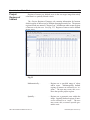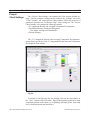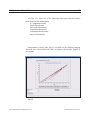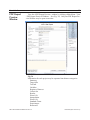
1
WIR i-Star Professional User Guide
For Use With:
WIR i-Star Professional Edition
Fully-Enabled Free Public Beta – Version 7.2 (2010-01-01)
Powerful CIELAB based, full tonal scale, comparative image analysis software with simplified single-number or two-number reporting of results. Developed by Wilhelm Imaging
Research, WIR i-Star also provides comprehensive analysis of image appearance differences with specific colors, including critical human skintone colors, or with user-selected
pictorial “regions of interest,” in both color and black-and-white photographic images.
WIR i-Star Professional Edition User Guide [Revision 4] 2010-01-01
WIR Software Development and Documentation Team:
Dmitriy Shklyarov (chief programmer), Yaw Nti-Addae, Kabenla Armah,
Mark McCormick-Goodhart (consultant), Dimitar Tasev, Henry Wilhelm,
Tessa Bergan (editor), and Carol Brower Wilhelm
© Copyright 2008 Wilhelm Imaging Research, Inc.
All Rights Reserved
Wilhelm Imaging Research, Inc.
Grinnell, Iowa U.S.A.
[email protected]
www.wilhelm-research.com
1
Contents
Introduction ...................................................................................... 2
I*Metric and Method Notes ............................................................ 4
Before Getting Started ................................................................... 5
User Interface ................................................................................... 6
Main Window ............................................................................... 7
The Main Menu .......................................................................8
Preferences Page ............................................................... 17
General Tab ....................................................................... 18
Project Info ........................................................................ 31
Project Components .......................................................... 32
Project Variables ............................................................... 33
Project Regions of Interest ............................................... 41
Project Crops .................................................................... 43
Project Color Map ............................................................ 45
Project Chart Settings ....................................................... 48
Permanence ...................................................................... 51
Project Description Page .................................................. 53
Data Layout Page ............................................................. 55
About Page ....................................................................... 57
Charts Window .......................................................................... 58
Target Model Window ............................................................... 63
PDF Report Preview Window .................................................... 67
Spreadsheet Window .................................................................. 72
Working with i-Star ......................................................................... 74
How to Choose and Prepare a Target ......................................... 74
How to Create a New i-Star Intelligible Input File .................... 74
How to Create a New i-Star Project ........................................... 74
How to Interpret the Results ...................................................... 60
Glossary .......................................................................................... 79
Bibliography .................................................................................... 81
WIR i-Star Professional Edition Version 7.2
User Guide (Rev. 2010-01-01)
2
Introduction
The WIR i-Star v.2.0 software (later in this manual also referred to as i-Star,
the software, the program, or the application) was created to perform calculations of I* components in accordance with the theory and metric presented
in the technical paper titled, “A Retained Image Appearance Metric For Full
Tonal Scale, Colorimetric Evaluation Of Photographic Image Stability”(1),
and as calculations for some other common colorimetric functions.
The results of these calculations help to evaluate the reproduction accuracy
(i.e. retention of color, lightness, contrast) of the final image with respect to
a reference image. The i-Star application will both calculate and graph these
results.
Depending on its version, the program can be used in a wide variety of the
areas dealing with image representation, transformation, and preservation. A
few examples of the possible software applications include:
• In the field of the image permanence studies, the application can calculate a series of results for a number of images representing the same photographic print over time and graph the loss of accuracy as the print ages.
• In the field of color accuracy studies, i-Star can be used as a proofing
evaluation tool, comparing aspects like tonal reproduction accuracy of an image manufactured using print system A to the same image manufactured using
print system B.
Regarding the different possible applications of the program, the reference
and final image can be presented in one the following forms:
• file - a content of an image file
• print - an image, printed on some media
• view - an image displayed by an electronic output device, such as a
monitor
Any of these image forms may be regarded as a two-dimensional array of
graphic elements (also referred to as samples or patches). Images must be
digitized for use in the program (i.e. converted to a numeric form). Prints
and views can be measured by spectrophotometers readily available on the
market. The minimum graphic size readable by an instruments defines the
frequency of the test image sampling. The frequency is very low in comparison to the file form image sampling frequencies. Nonetheless, the i-Star
application can successfully evaluate the reproduction accuracy even at low
spatial frequency.
When using the i-Star application, several test files containing numeric
renditions of the same image can be grouped into an i-Star project. After the
reference image is defined, the i-Star application calculates and compares the
WIR i-Star Professional Edition Version 7.2
User Guide (Rev. 2010-01-01)
Introduction
3
I*components to that image.
The i-Star application provides a wide variety of results. Some results
may be used as a generic one-number accuracy score, describing how much
an image pair differs. Other results describe and specify the spacial location of exact differences between the images. Simultaneously, i-Star allows
project analysis flexibility. For example, results for a chosen mathematical,
spatially defined, or an entire test target data set can be calculated. Visit www.
wilhelm-research.com for advanced information about program applications,
test targets, and analysis techniques.
WIR i-Star Professional Edition Version 7.2
User Guide (Rev. 2010-01-01)
4
I* Metric and
Method Notes
As are other color appearance models in use today, the I* metric is based
on CIE LAB colorimetry. However, the I* metric is more suited to photographic tone reproduction analysis than conventional color difference models
because, in addition to analyzing the standard colorimetric attributes of hue,
chroma, and lightness, I* metric can also analyze the changes in image contrast.
The I* metric does not quantify how pleasing a final image appears to the
viewer or how noticeable the visual differences are between an image and a
reference image. Rather, the I* metric quantifies how accurate the final color
and tone reproduction state of an image persists under controlled conditions
with respect to the initial image. Color and tone reproduction accuracy does
not necessarily correlate with perceived image quality. For example, if the
reference image is perceived to be too dark, and no change occurs when compared with the final one, then the I* metric would return a 100% accuracy rating because the image is still perceived precisely the same way. If the same
dark image were compared with its lightened version, the viewer may find
the lightened version more pleasing than the initial state. However, the I*
metric calculations would yield a lower accuracy rating (i.e. less than 100%),
because the lighter image is no longer an accurate representation of the reference image.
The I* method samples a photographic image as a uniformly spaced rectangular grid of elements so that the I* statistics account for the specific information content in the scene. For example, a photograph containing an
expansive blue sky would have a large statistical sampling of colorimetric
data corresponding to the large area of sky reproduced in the photograph.
The contribution of the sky area to the overall I* results would then be proportional to the spatial area in the image occupied by blue sky. I* results are
image dependent, just as actual human observations change when viewing
different photographs. To evenly compare the performance of different imaging systems, therefore, the same generic test target or set of pictorial images
must be used in the I* analysis.
The I* method allows calculation of an entire data set or a chosen subset
of the data, called a region of interest. Viewers often assign specific areas in
a photograph with greater importance than other areas in the same photograph
and will judge color and tone reproduction fidelity preferentially on the accuracy retention in those regions. A region of interest may be a specific range
of colors and/or tones (e.g. scene highlights, skin tones, etc.) or a bounded
geometric area within a scene (e.g. a person’s face in a portrait or the sky area
in a landscape). Skin tone reproduction is a particularly important region of
interest example. A region of interest can be further evaluated by including or
excluding the worst 10% data from within the specified region.
WIR i-Star Professional Edition Version 7.2
User Guide (Rev. 2010-01-01)
5
Check the computer specification. The following configuration (or better)
Before Getting
is recommended:
Started
•
•
•
•
Processor:
Memory:
Display Resolution:
OS:
Pentium IV Class running at 2.80 GHz
512 MB or more
1240 x 1024 pixels or higher
Windows XP
A large-sized monitor or a multi-monitor system would be beneficial and is
highly recommended. Some versions of the software require the use of a USB dongle that is
shipped with the software. Should the software version require a USB dongle,
be sure to execute install_drivers.bat (located in the root folder of the CD containing the i-Star application) before starting the application for the first time.
Additionally, this version of the software will corrupt the preferences file if an
attempt to run the application without the dongle is made. Should this occur,
remove AppDef.isf (located in the application folder) and restart the i-Star
application. The restart will also reset all i-Star related preferences to factory
defaults. Therefore, once configured and in use, restart is not recommended.
To run the i-Star application, execute iStar.exe. It is recommended that this
file be placed in a separate folder, because a number of configuration files will
be created and maintained for the application. This folder must satisfy the
following requirements:
• have at least 64 MB available free space
• be on a user-accessible, write-enabled location
Running the application from a zipped package, a CD/DVD, a locked flash
drive, or a flash drive with insufficient capacity, temporary OS instability and/
or application crash may occur.
If more than one version of the i-Star application exists on the computer, be
sure the associated .isf file is used when opening the project files. Note that on
Microsoft® Windows Vista™ systems the i-Star application must be run with
administrator privileges every time this option is being set.
Also, please note that the application works with only one project at a time.
To work with more than one project simultaneously, launch multiple instances
of the i-Star application.
WIR i-Star Professional Edition Version 7.2
User Guide (Rev. 2010-01-01)
6
User Interface
The user interface of the i-Star application includes the main window and
four view windows: Charts, Target Model, Results, and Spreadsheet.
The i-Star application uses a variety of context menus. Many controls have
a specific set of actions made available with a right-click on that control. Further information regarding these actions is given in the next chapters.
When the i-Star application is executed, the program main window appears:
Main Window
Fig. 1
When no projects are open, the main window provides access to the general panels via the main menu. See (Fig. 1). An active project uses the main
window as a source of all project data and the project control center.
The main window contains a status bar indicating the status of the load and
save processes and the project status. When a project is opened/created, additional controls such as the project page and several preferences tabs become
accessible.
WIR i-Star Professional Edition Version 7.2
User Guide (Rev. 2010-01-01)
User Interface. Main Window.
The Main Menu
7
The main menu provides the major controls of the application. It contains
the following drop-down menus:
<i-Star>
<Project>
<Files>
<View>
<Windows>
<Arrange>
<Extras>
When the i-Star application is open and there are no active projects, some
drop-down menu items are disabled. These menu items become enabled when
a project is opened.
WIR i-Star Professional Edition Version 7.2
User Guide (Rev. 2010-01-01)
User Interface. Main Window. The Main Menu.
8
The <i-Star> drop-down menu is always enabled. See (Fig. 2).
Fig. 2
Help ...
- Opens the user manual in default PDF
viewer. The shortcut is F1.
Show Preferences page …
- Shows/hides the preferences page. The
first click shows the preferences page for
an active project. A second click hides the
preferences page.
The shortcut is F2.
Show About page … - Shows the panel with information about
the i-Star application version, release date,
and a hyperlink to the www.wilhelm-research.com website.
The shortcut is F3.
Quit ... - Command to close the i-Star application.
The shortcut is Ctrl + q.
WIR i-Star Professional Edition Version 7.2
User Guide (Rev. 2010-01-01)
User Interface. Main Window. The Main Menu.
9
The <Project > drop-down menu is always enabled. See (Fig. 3).
Fig. 3
Create New ...
- Creates a new project.
The shortcut is Ctrl + n.
Open Project …
- Opens a project stored as an .isf file.
The shortcut is Ctrl + o.
Save Project …
- Option becomes enabled only when there
is an active project. Saves the active
project in the source .isf file.
The shortcut is Ctrl + s.
Close Project …
- Option becomes enabled only when there
is an active project. Closes the active
project.
The shortcut is Ctrl + w.
Save Project As…
WIR i-Star Professional Edition Version 7.2
- Option becomes enabled only when there
is an active project. Saves the active
User Guide (Rev. 2010-01-01)
User Interface. Main Window. The Main Menu.
10
project in a new .isf file.
The shortcut is Ctrl + Alt + s.
Recalculate Project …
- Option becomes enabled only when there
is an active project. Recalculates the I*
results for the active project.
The shortcut is F7.
WIR i-Star Professional Edition Version 7.2
User Guide (Rev. 2010-01-01)
User Interface. Main Window. The Main Menu.
11
The <Files> drop-down menu becomes enabled only when there is an active project. It operates using data files from the active project. See (Fig. 4).
Fig. 4
Add to Project ...
- Adds a new data file to the active project.
The shortcut is Ctrl + a.
Delete from Project ...
- Deletes the selected data file from the active project.
The shortcut is Ctrl + d.
Move Up ...
- Moves a file up in the list of project data
files. The reference file is always first on
the list.
The shortcut is Ctrl + Up.
Move Down ...
- Moves a file down in the list of project
data files. The reference file is always first
on the list.
The shortcut is Ctrl + Down.
WIR i-Star Professional Edition Version 7.2
User Guide (Rev. 2010-01-01)
User Interface. Main Window. The Main Menu.
12
The <View> drop-down menu becomes enabled only when there is an active project. See (Fig. 5).
Fig. 5
Charts Window ...
- Creates a new chart window.
The shortcut is Ctrl + g.
Target Model Window ...
- Creates a new target model window.
The shortcut is Ctrl + t.
PDF Report
Preview Window ...
- Creates the PDF Preview Window.
The shortcut is Ctrl + r.
Show Regions
of Interest Page ...
- Opens “Preferences Page” to allow editing of the regions of interest in an active
project.
The shortcut is F4.
Show Color Map Page ... WIR i-Star Professional Edition Version 7.2
- Opens “Preferences Page” to allow editUser Guide (Rev. 2010-01-01)
User Interface. Main Window. The Main Menu.
13
ing of the target image map settings in an
active project.
The shortcut is F5.
Show Crops Page ... WIR i-Star Professional Edition Version 7.2
- Opens “Preferences Page” to allow editing of crop settings in an active project.
The shortcut is F6.
User Guide (Rev. 2010-01-01)
User Interface. Main Window. The Main Menu.
14
The <Windows> drop-down menu is always enabled. See (Fig. 6). The
menu does not, however, contain any menu items unless a view window has
been opened. When visible, this drop-down menu will show a list of open
view windows in the active project. Choosing an item will bring the corresponding window to the front. Change the front window by pressing the
shortcut Ctrl + ‘. Activate the main window using the shortcut Ctrl + Shift + ‘
on any view window.
Fig. 6
WIR i-Star Professional Edition Version 7.2
User Guide (Rev. 2010-01-01)
User Interface. Main Window. The Main Menu.
15
The <Arrange> drop-down menu is always enabled. See (Fig. 7). Actions
will not perform unless more than one window is open. The menu contains
the following items:
Fig. 7
Cascade Windows ...
- Organizes the open project windows in a
cascade.
Tile Horizontal ...
- Tiles the open project windows horizontally.
Tile Vertical ...
- Tiles the open project windows vertically.
Tile Both Ways ...
- Simultaneously tiles the open project windows horizontally and vertically.
Minimize Each Window ... - Minimizes all open project windows.
Normalize Each Window ... - Normalizes all open project windows.
Maximize Each Window ... - Maximizes all open project windows.
WIR i-Star Professional Edition Version 7.2
User Guide (Rev. 2010-01-01)
User Interface. Main Window. The Main Menu.
16
The <Extras> drop-down menu content depends on the version of the
i-Star application. See (Fig. 8). The generic i-Star version contains the following menu items:
Fig. 8
Spreadsheet ...
- Creates a new spreadsheet window.
The shortcut is Ctrl + e.
Target Builder ...
- Launches the Target Builder executable,
an optional utility, when present in the
drop-down menu.
Download
Acrobat Reader ... WIR i-Star Professional Edition Version 7.2
- Opens default web browser to Adobe website to obtain a copy of the Adobe Acrobat
Reader. Adobe is necessary for viewing
the PDF formatted supplemental documents included in the i-Star application
package.
User Guide (Rev. 2010-01-01)
User Interface. Main Window.
Preferences
Page
17
The “Preferences Page” appears on the main window. It can be accessed
by the main menu « i-Star : Preferences ... ». Without an active project, the
Preferences Page contains general parameters for the i-Star application. When
an active project is opened, the Preferences Page becomes a source of information about the project parameters. Only one Preferences Page will open
per i-Star application.
Depending on the version of i-Star application, the Preferences Page may
contain a slightly different set of tabs. The common tabs include:
<General>
<Project Info>
<Project Components>
<Project Variables>
<Project Regions of Interest>
<Project Crops>
<Project Chart Settings>
<Project Color Map>
<Permanence> (permanence only)
WIR i-Star Professional Edition Version 7.2
User Guide (Rev. 2010-01-01)
User Interface. Main Window. Preferences Page.
General Tab
18
The <General> tab contains general preferences in the i-Star application.
See (Fig. 9). The preference sub-tabs include:
<Application>
<Directories>
<Data Import Options>
<Project Options>
<Notification Options>
<Themes>
<Reports>
.
Fig. 9
The <Application> sub-tab contains the following adjustable options:
Restore
default preferences ... - Restores the content of the “Preferences
Page” to default conditions.
Restore
preferences from AppDef ... - Restores content of the “Preferences Page”
from AppDef file. This action will reset
current project settings to settings previously memorized in the AppDef file.
WIR i-Star Professional Edition Version 7.2
User Guide (Rev. 2010-01-01)
User Interface. Main Window. Preferences Page.
Memorize
preferences in AppDef ...
19
- Saves current content of the “Preferences
Page” to an AppDef file.
Save preferences in AppDef
when closing application
(Yes/No) ...
- Controls the content rewrite of the
AppDef file.
Always keep preferences
after closing project
(Yes/No) ...
- Controls the i-Star application reset of
content on the “Preferences Page.”
When left unchecked, standard settings
from AppDef file are restored everytime
the project is closed. When checked the
current settings remain. This is important
when a series of projects are created.
Use i-Star as default
reader for *.isf files
(Yes/No) ...
- Controls setting to choose the running
version of the i-Star application as the default program to open .isf formatted files.
If this option is disabled, the current version of the i-Star application will access
the projects only through the «Project :
Open Project» menu item.
When enabled, this option creates the OS
registry record overwriting previous registry records. If more than one version of
the i-Star application exists on a computer, the one associated with the .isf file type
must be determined.
Note that on systems running Windows
Vista™ the user must run the application
with administrator privileges every time
this option is set or unset.
WIR i-Star Professional Edition Version 7.2
User Guide (Rev. 2010-01-01)
User Interface. Main Window. Preferences Page.
20
Use screen resolution
correction
(Yes/No) ...
- Controls resizing the i-Star application
windows and controls to meet the varied
computer screen resolution settings.
Due to large amounts of data and controls
necessary for the i-Star application, WIR
recommends using screen resolution equal
to 1280 x 1024 (SXGA) or higher.
If the screen resolution is less than 1280 x
1024, some controls on the i-Star application windows may be hidden.
WIR i-Star Professional Edition Version 7.2
User Guide (Rev. 2010-01-01)
User Interface. Main Window. Preferences Page.
21
The <Directories> sub-tab contains the project name, number of files, and
directory information. See (Fig. 10). This sub-tab also contains controls allowing path and folder specification for every file action. The information in
this tab may change between projects.
Fig. 10
WIR i-Star Professional Edition Version 7.2
User Guide (Rev. 2010-01-01)
User Interface. Main Window. Preferences Page.
22
The <Data Import Options> sub-tab contains adjustable options
controlling the data import process. See (Fig. 10). The following options are
available for the “Create Project” procedure when files are added using the
“Add Project” procedure.
Fig. 10
Import only user confirmed
data (Yes/No) ...
- Forces the i-Star application to show
the data layout page before importing
data, regardless of Data Import Assumptions (DIA) engine results. This option
protects from importation of incorrectly
interpreted data.
Accept projects with stable
conditions only (Yes/No) ... - Allows data import only if critical
parameters of the target (e.g., geometry,
sequence of patches, illuminant, observer,
white base, filter, etc.) are in compliance
with the project reference target. When
WIR i-Star Professional Edition Version 7.2
User Guide (Rev. 2010-01-01)
User Interface. Main Window. Preferences Page.
23
enabled, this option restricts data import
not within the requirement parameters.
This option protects incorrect data import,
but may not be suitable for all projects.
Use assumptions
when importing
data files (Yes/No) ...
Assume that
the target geometry is
the same (Yes/No) ...
Assume that
the sequence of patches
is the same (Yes/No) ...
- Allows use of the DIA engine. Based on
knowledge of specific data formats for
the i-Star application, the DIA engine will
read and recognize data file content. If all
parameters required for the data import file
have been located, the DIA will complete
the action automatically. This option simplifies the workflow by allowing the DIA
engine to recognize and sort information.
- Allows the DIA engine to assume that the
import file contains a target with geometry
in compliance with the reference target.
- Allows the DIA engine to assume the
import file contains a target with a patch
reading sequence in compliance with the
reference target.
Assume that sequence of
patches is always (left-to-right
or top-to-bottom) ...
- Specifies the reading sequence used by the
DIA on the import data. The left-to-right
sequence is common for older Gretag
Macbeth Spectrochart software. The topto-bottom sequence is typical for the newer GretagMacbeth Measure Tool software.
Improper assumption of the patch reading
sequence will result in wrong spatial location of the color patches. Once imported,
check the image reconstruction on the
“Target Model” window.
WIR i-Star Professional Edition Version 7.2
User Guide (Rev. 2010-01-01)
User Interface. Main Window. Preferences Page.
Assume that the illuminant
is the same (Yes/No) ...
Assume that the observer
is the same (Yes/No) ...
24
- Allows the DIA engine to assume that the
import file contains a target using the same
illuminant name as the reference target.
- Allows the DIA engine to assume that the
import file contains a target using the same
observer name as the reference target.
Assume that the white base
is the same (Yes/No) ...
- Allows the DIA engine to assume that the
import file contains a target using the same
white base name as the reference target.
Assume that the filter
is the same (Yes/No) ...
Import multiple
files (Yes/No) ...
- Allows the DIA engine to assume that the
import file contains a target using the same
filter name as the reference target.
- Allows the import of multiple files simultaneously. The system will not allow import of multiple files if the “Import Only
User Confirmed Data” option is checked
or “Use Assumptions When Importing
Data Files” is not checked.
Use file created date and time
as a time stamp (Yes/No) ... - Automatically includes creation date and
time of the imported file into the table on
“Project Description” page.
WIR i-Star Professional Edition Version 7.2
User Guide (Rev. 2010-01-01)
User Interface. Main Window. Preferences Page.
WIR i-Star Professional Edition Version 7.2
25
User Guide (Rev. 2010-01-01)
User Interface. Main Window. Preferences Page.
26
The <Project Options> sub-tab contains adjustable options controlling
functions on the “Project Page.” See (Fig. 11). A detailed description of these
options can be found in the “Project Page” and “Results Window” chapters.
.
Fig. 11
Date and time
configuration ...
- Gives the ability to format the date and
time found on the project page. Allows
the designation of two hotkeys used to enter the date and time into editable fields.
Date and time formats will not affect project results.
Project options ...
- Gives the ability to specify the reference
category of project files. Also, sets the
decimal precision of the result calculations.
Result report options ...
- Contains default settings for time-related
result reporting. The following choices
are available:
WIR i-Star Professional Edition Version 7.2
User Guide (Rev. 2010-01-01)
User Interface. Main Window. Preferences Page.
27
Hours ... - Time is shown in hours.
Kilolux hours ... - Often used in light fading when the scale
is based on exposure of 1 kLux/hr. The
value depends on the light level setting in
the test conditions group on the “Permanence Tab” of the “Preferences Page.”
Display years ... - Calculates predicted display years using
light level and light cycle settings found in
the predictions group on the “Permanence
Tab” of the “Preferences Page.”
Adjusted years ... - Allows the user to set a correction factor
for gas fading when determining predicted
display years. The correction factors are
set in the predictions group on the “Permanence Tab” of the “Preferences Page.”
When used, the application reports “adjusted years” rather than “display years.”
WIR i-Star Professional Edition Version 7.2
User Guide (Rev. 2010-01-01)
User Interface. Main Window. Preferences Page.
28
The <Notification Options> sub-tab contains adjustable options controlling i-Star application notifications. See (Fig. 12).
Fig. 12
Use audio
notification (Yes/No) ...
Always remind about
the D-min and D-max
settings (Yes/No) ...
WIR i-Star Professional Edition Version 7.2
- Forces the i-Star application to accompany all important messages with a system
sound.
- Forces the i-Star application to remind the
user about defining D-min and D-max settings in a project. This reminder appears
immediately after the “Create New Project” procedure has been completed.
User Guide (Rev. 2010-01-01)
User Interface. Main Window. Preferences Page.
29
The <Themes> sub-tab contains adjustable options which control the appearance of the i-Star application. See (Fig. 13). Two standard backdrops are
available for each chart. The user may also choose an external file to be used
as a custom backdrop. An external file is linked to the i-Start application, but
not embedded permanently.
Fig. 13
WIR i-Star Professional Edition Version 7.2
User Guide (Rev. 2010-01-01)
User Interface. Main Window. Preferences Page.
30
The <Reports> tab contains information about PDF Report presets. See
(Fig. 14). These presets define the content of a PDF report. The two checkboxes define the creation location of the PDF Report file.
Fig. 14
Always create report at
collector folder (Yes/No) ... - Instructs the i-Star application to create a
PDF Report at a specified collector folder
selected by the user.
Always create report at
project folder (Yes/No) ...
- Instructs the application to create a PDF
Report in the same directory as the corresponding .isf file. Note: The project must
be saved before creating a report.
When both options are enabled, the i-Star
application will create two identical reports in the different locations.
WIR i-Star Professional Edition Version 7.2
User Guide (Rev. 2010-01-01)
User Interface. Main Window.
Project Info
31
The <Project Info> tab contains information about data files collected by
the Data Import Assumptions (DIA) engine during file import, saves notes
about files, and allows for file origin specifications. See (Fig. 15). Additional
project information including the project number, sample number, job number, target file name, reading device, and project observations are stored in
this tab.
The “Export” and “Import” buttons allow the ability to save and load
project information into a text file. This process makes integration of similar
projects easier.
Fig. 15
WIR i-Star Professional Edition Version 7.2
User Guide (Rev. 2010-01-01)
User Interface. Main Window.
Project
Components
32
The <Project Components> tab contains the table with information about
components tracked and/or calculated by the i-Star application. See (Fig.
16). Each component included in the “Project Components” grid has a corresponding tab on the project page, where results of the calculations have been
stored. The name of the project page tab can be found in the “Tab Name” column of the “Project Components” grid. The grid holds the absolute minimum
and maximum values for each component and defaults found in the “Target
Model” window. The markers identify patches above, below, and within a
selected range. The Spectrum, L source, A source, and B source items in the
table are values stored by the i-Star application, not calculated components.
All information in the “Project Components” grid is not adjustable.
Fig. 16
WIR i-Star Professional Edition Version 7.2
User Guide (Rev. 2010-01-01)
User Interface. Main Window.
Project
Variables
33
The <Project Variables> tab contains variables used to calculate results for
an active project.
The tab includes the following sub-tabs:
<I*ctr>
<I*br>
<I*tone>
<I*c>
<I*total>
< ∆E Methods>
.
Fig. 17
The <I*ctr> sub-tab contains variables related to the calculations of I*ctr
values. See (Fig. 17).
Delta L threshold ... WIR i-Star Professional Edition Version 7.2
- The calculation of I*tone, {I*tone}, I*ctr,
and {I*ctr} components require a threshold treatment for nearest neighbor picture
elements having very small initial or final
Delta L values. Without a threshold evaluation method, the measurement of small
Delta L changes would result in large
deviations. As a result, the gamma calUser Guide (Rev. 2010-01-01)
User Interface. Main Window. Project Variables.
34
culation would be too high or low when
compared to the image contrast seen by a
human observer.
Gamma +
minimum quality level ... Gamma –
minimum quality level ...
False encoding
truncation level ...
- The i-Star application compares I*ctr data
to the Gamma + minimum quality level,
and then computes the percentage of data
greater than or equal to this value. The
G+QC component represents the result of
this calculation.
- The i-Star application compares the I*ctr
data to the Gamma – minimum quality
level, and then computes the percentage of
data less than or equal to this value. The
G-QC component represents the result of
this calculation.
- The false encoding truncation value is
used to compute the {I*ctr} component.
To better understand the {I*ctr} component, refer to the technical paper(1).
Minimum quality level ...
- The i-Star application compares I*ctr data
to the minimum quality level, then computes the percentage of data less than or
equal to this value. The I*ctrQC component represents the result of this calculation.
Nearest neighbors grid ...
- Allows user to select the nearest neighbor pattern used to calculate the I*ctr and
I*tone data. Any of the eight neighboring
patterns may be included or excluded.
WIR i-Star Professional Edition Version 7.2
User Guide (Rev. 2010-01-01)
User Interface. Main Window. Project Variables.
35
The <I*br> sub-tab contains variables related to the calculations of I*br
values. See (Fig.18).
Fig. 18
Basis of calculation ... - Choose either “single patch” or “nearest neighbors.” The “nearest neighbors”
choice is defined by the matrix values set
by the I*ctr component calculation. When
“single patch” is chosen, the i-Star application will reference the brightness of the
center patch in the nearest neighbor grid.
Minimum quality level ...
- The i-Star application compares the I*br
data to the minimum quality level, and
computes the percentage of data less than
or equal to this value. The I*brQC component represents the result of this calculation.
WIR i-Star Professional Edition Version 7.2
User Guide (Rev. 2010-01-01)
User Interface. Main Window. Project Variables.
36
The <I*tone> sub-tab contains variables related to the calculation of I*tone
values. See (Fig.19).
Fig. 19
False encoding
truncation level ...
Minimum quality level ... WIR i-Star Professional Edition Version 7.2
- The false encoding truncation value is
used to compute the parameter {I*tone}.
I*ctr is a negative value when a contrast
inversion has occurred in the image. To
better understand the {I*tone}, refer to the
technical paper (1).
- The i-Star application compares I*tone
data values to the minimum quality level and then computes the percentage of
data less than or equal to this value. The
I*toneQC component represents the result
of this calculation.
User Guide (Rev. 2010-01-01)
User Interface. Main Window. Project Variables.
37
The <I*c> sub-tab contains variables related to the calculation of color
retention values. See (Fig.20).
Fig. 20
Chroma threshold ... Delta a*b* offset
correction factor ... - Sets threshold for the neutral gray color
sector. All patches with chroma values
below 9.5 (default) are treated as part of
the neutral gray color sector. The Delta
a*b* offset correction factor is added to
the threshold value before the inclusion
of a date point in the gray sector is determined.
- Ensures that small instrumental measurement errors do not result in I* color calculations less than 100% until the Delta
a*b* value is outside the measuring device instrumental error range.
False encoding truncation ... - Used to compute the {I*c} component.
WIR i-Star Professional Edition Version 7.2
User Guide (Rev. 2010-01-01)
User Interface. Main Window. Project Variables.
38
To better understand the {I*c} component, refer to the technical paper (1).
Minimum quality level ... WIR i-Star Professional Edition Version 7.2
- The i-Star application compares the I*c
data to the minimum Quality value and
then computes the percentage of data less
than or equal to this value. The I*cQC
component represents the result of this
calculation.
User Guide (Rev. 2010-01-01)
User Interface. Main Window. Project Variables.
39
The <I*total> sub-tab contains variables related to the calculation of I*total
values. See (Fig.21).
Fig. 21
Weighting factor ...
WIR i-Star Professional Edition Version 7.2
- The I*total is the weighted average of
I*c and I*tone values, as described in the
technical paper (1). The 1.0 weight value
returns the average of I*c and I*tone. A
value between 0.0 and 1.0 gives weight
to I*c, and a value higher than 1.0 gives
weight to I*tone.
User Guide (Rev. 2010-01-01)
User Interface. Main Window. Project Variables.
40
The <∆E Methods> sub-tab contains variables related to the calculation of
color difference systems, such as Delta E 1994, Delta E 2000, or Delta E cmc.
See (Fig.22). To better understand these variables, refer to specific documentation for each color difference system.
Fig. 22
WIR i-Star Professional Edition Version 7.2
User Guide (Rev. 2010-01-01)
User Interface. Main Window.
Project
Regions of
Interest
41
Regions of interest are defined areas in the test target image that satisfy
colorimetric or spatially filtered criteria.
The <Project Regions of Interest> tab contains information for fourteen
default regions of interest set by Wilhelm Imaging Research, Inc. The present
regions include one named “Custom Crop,” and thirteen other custom regions
of interest set by the user. See (Fig. 23). Regions of interest can be defined
in two ways:
Fig. 23
Mathematically ...
- Regions are a specified range of colors
and/or tones. Mathematically defined
regions of interest are reffered to as “regions.” The user may create, edit, or remove the specific project regions.
Spatially ...
- Regions are a geometric area within the
image. Spatially defined regions of interest are reffered to as “crops.” The user
may create, edit, or remove specific geometric areas.
WIR i-Star Professional Edition Version 7.2
User Guide (Rev. 2010-01-01)
User Interface. Main Window. Project Regions of Interest.
42
The Project Regions of an Interest grid contains mathematical information about every mathematical and spatial region stored in a project. The
grid includes minimum and maximum values of lightness, hue, chroma, and
endpoint criteria set for each region. Further information regarding endpoint
criteria sets can be found in the “How To Interpret The Results” chapter.
Region settings are either brand new or based on another saved prototype
region set. To create a region based on another prototype, first click the corresponding row in the “Project Regions” of the Interest grid. Mathematical
values defining the prototype will appear in the edit grid. After necessary
corrections have been made, save the region by clicking the “Add” button.
The new region must have a unique name. To create a brand new region, first
enter the mathematical values into the edit grid to define the region. After all
necessary information has been entered, save the created region by clicking
the “Add” button. Once again, the new region must have a unique name.
To edit any user-defined regions, first click on the corresponding row in
the Project Regions of the Interest grid. The mathematical values defining the
region will appear in the edit grid. After necessary changes, save by clicking
the “Apply Changes” button. The i-Star application will create a new region
if the name of the user-defined region has been changed. Editing any of the
fourteen default regions of interest is not allowed.
To remove the user-defined regions, first click on the corresponding row
in the Project Regions of Interest grid. The defined mathematical region values will appear in the edit grid. Delete this region by clicking the “Remove”
button. Removal of any of the fourteen default regions of interest is not allowed.
The Project Regions of Interest grid also contains “Export” and “Import”
buttons to move region data from one project to another. The “Export” button allows data from the edit grid to be saved to an external .islr file. The
“Import” button loads a selected .islr file to the edit grid. Any number of .islr
files may be stored. The fourteen default regions of interest, set by Wilhelm
Imaging Research, cannot be edited or modified by the import procedure.
WIR i-Star Professional Edition Version 7.2
User Guide (Rev. 2010-01-01)
User Interface. Main Window.
Project Crops
43
The <Project Crops> tab contains information about project crop sets.
(See Fig. 24). Crops are a subclass of the regions of interest and represent a
geometrically defined area of interest within the image. By default, the i-Star
application has a single crop region named “Custom Crop” and thirteen other
preset regions of interest.
Fig. 24
The Project Crops grid contains a visual model of the reference target of a
project.
The group of buttons including “Mark all,” “Un-mark all,” “Mark selected,” and “Un-mark selected,” change the selection of crop grid patches
marked with X forming the crop. These controls are also found in the Project
Crops grid context menu. Double click on a patch from the crop grid to select
and unselect the patch.
Either brand new or preset crop settings may be used.
To create a crop based on a prototype, select the name in the drop-down
list. The crops grid will show the set of patches forming the prototype. After
necessary corrections, save the newly defined crop by clicking the “Add” butWIR i-Star Professional Edition Version 7.2
User Guide (Rev. 2010-01-01)
User Interface. Main Window. Project Crops.
44
ton. The new crop must have a unique name.
To create a brand new crop, select the “–Empty–” choice in the drop-down
list. The crops grid will be cleared of marks. Input new data and press the
“Add” button. The new crop must have a unique name.
To edit any pre-existing crops, first select the name in the crops drop-down
list. The crops grid will show the patches forming the prototype. After necessary changes, save by clicking the “Apply Changes” button.
To remove any of the user defined crops, first select the name in the crops
drop-down list. The crops grid will show the set of patches forming the prototype. Delete this region by clicking the “Remove” button. The crop removal
will be reflected both on the crops drop-down list and the “Project Regions of
Interest” grid. The “Custom Crop” cannot be removed.
The <Project Crops> tab contains “Export” and “Import” buttons used to
move data from one project to another. The “Export” button allows data from
the crops grid to be saved to an external .islc file. The “Import” button loads a
selected .islc file to the crops grid. Any number of .islc files may be stored.
To edit a pre-set crop, first select its name in the crops drop-down list. The
set of patches in the prototype will appear on the crop grid. After necessary
changes, click the “Apply Changes” button.
To remove a pre-set crop, first select the name in the crops drop-down list.
The set of patches in the prototype will appear on the crop grid. Click the
“Remove” button. The selected crop will be removed from the Project Crops
drop-down list and “Project Regions of Interest” grid.
The “Export” and “Import” buttons placed on the <Project Crops> tab help
to ease the transition of data from one project to another. Any number of
custom defined crops may be stored outside the program and imported when
needed. By clicking the “Export” button, information is saved from the crops
grid to an external file with the .islc extension. Clicking the “Import” button
will load the content of a selected .islc file into the crops grid.
WIR i-Star Professional Edition Version 7.2
User Guide (Rev. 2010-01-01)
User Interface. Main Window.
Project
Color Map
45
The <Project Color Map> tab allows defining of the dynamic range of image targets. See (Fig. 25).
Fig. 25
Depending on the use of the program, the dynamic range may be defined
in one of the following ways:
Defined by user ...
- When values of Lmin and/or Lmax are
not certain, the dynamic range may be extended beyond the actual range of the target image. This is necessary for projects
involving pictorial images.
Defined by image ...
- To calculate the dynamic range of an image as an interval between the darkest
and lightest point, the values of Lmin and
Lmax are found automatically in the reference target image.
Defined by map ...
- The dynamic range may also be defined as
an interval between the average values of
WIR i-Star Professional Edition Version 7.2
User Guide (Rev. 2010-01-01)
User Interface. Main Window. Project Color Map.
46
both the Lmin and LMax of a selected set
of patches in the target image. Mark the
group of patches on the color map with the
white patch marker and click the “Apply
Changes” button. The averaged L value
for the selected group of patches becomes
the Lmin. Calculate the Lmax value similarly. When the target image has at least
one white patch and the Lmax is calculated
using “Defined by map,” choose to extend
the target with an artificial border for the
I*tone calculation. Even if the “Nearest
Neighbors” map includes all eight adjacent patches, this allows a calculation of
the I*tone component for patches located
on the outer perimeter of the image target.
The L value average for all patches defined as white in the Color Map grid will
substitute missing L value information for
non-existing neighbors.
The controls including “Mark all,” “Un-mark all,” “Mark selected,” “Unmark selected,” and the “White patch marker/Black patch marker” dropdown list helps to change the selection of the Color Map grid patches (marked
with W as white or B as black) to form the color map. Select or unselect
one patch in the color map grid by a double-click. The patch will remain
marked according to the “White patch marker/Black patch marker“ dropdown list. The location of the selected patch and its value of lightness is
available in the status bar of the main window. Change the color map by
clicking on the “Mark extreme” button. All patches within the set percentage, from the minimal L value of the image as black patches and the maximum L value of the image as white patches, will be marked. Confirm the
selection of black and white patches by clicking the “Apply changes” button.
“Export” and “Import” buttons on this tab help move color maps data from
one project to another. The “Export” button allows data to be saved from the
Color Map tab to an external .islcm file. The “Import” button loads a selected
.islcm file to the <Color Map> tab. Any number of .islcm files may be stored.
WIR i-Star Professional Edition Version 7.2
User Guide (Rev. 2010-01-01)
User Interface. Main Window. Project Color Map.
WIR i-Star Professional Edition Version 7.2
47
User Guide (Rev. 2010-01-01)
User Interface. Main Window.
Project
Chart Settings
48
The <Project Chart Settings> tab contains the Chart window default settings. Similar parameter settings can be found on the “Settings” tab of the
“Chart” window. All created project Chart windows follow the exact set of
parameters specified on “Preferences Page” chart setting tab. The <Project
Chart Settings> tab contains the following controls:
<I* Components Results and Averaged Component Development>
<Tonal Reproduction, Parameter Histograms,
Hue Angle, and Spectral Distribution>
<General Settings>
The <I* Components Results and Averaged Component Development>
group allows specificity of the I* Components Results chart and Component
Development chart settings.
Fig. 26
To include or exclude any files for plotting, click on the check-boxes in
the “View” column of the Files table. Specify the graphing methods for each
component plotted on the chart (i.e. no plotting, only data points, only trend
line, or both data points and trend line).
WIR i-Star Professional Edition Version 7.2
User Guide (Rev. 2010-01-01)
User Interface. Main Window. Project Chart Settings.
49
Specify which mathematical function is desired to build the trend line bychoosing one of the following functions:
• Exponential
• Exponential EW
• Line
• Logarithmic
• Polynomial 2
• Polynomial 3
• Polynomial 4
• Polynomial 5
• Polynomial 6
• Power
• Spline
The default function is spline. The spline connects each data point to the
next with a straight line.
Specify the color of the date points and trend lines for each plotted file by
first selecting the corresponding cell in the table. Then, choose a color from
the color picker located in the “General settings” group.
The <Tonal Reproduction, Component Histograms, Hue Angle, and Spectral Distribution> box allows specificity of the Tonal Reproductions, Component Histograms, Hue Angle, and Spectral Distribution settings.
Include any files to be plotted by clicking the check-boxes in the “Dist”
and “Trend” columns of the Files table. Specify the graphing method for each
component plotted on the chart (i.e. no plotting, only data points, only trend
line, or both data points and trend line).
For each file on the Tonal Reproduction chart, specify the mathematical
function used to build the trend line. The default setting is “Line” for the
reference file (because the trend line will always be straight for this file) and
“Polynomial 6” for all other files. On some occasions, it is recommended to
lower the degree of the polynomial function for a better fitting graph.
Specify the color of data points and trend lines for each plotted file by first
selecting the corresponding cell in the table. Then choose a color from the
color picker located in the “General Settings” group.
The <General Settings> group allows modification of the date point size
and the width of the plotting lines for new charts. Specify whether the legend
and the backdrop should be displayed and determine the X-axis style (displayWIR i-Star Professional Edition Version 7.2
User Guide (Rev. 2010-01-01)
User Interface. Main Window. Project Chart Settings.
50
ing time units or file numbers). The color picker, as explained earlier, is also
located in this group.
The “Export” and “Import” buttons located on this tab help move data
from one project (or chart only) to another. The “Export” button allows data
to be saved from the <Project Chart Settings> tab to an external .islcs file. The
“Import” button loads a selected .islcs file to the <Project Chart Settings> tab.
Any number of .islcs files may be stored. The “Restore Defaults” button sets
all controls on this tab to default values.
WIR i-Star Professional Edition Version 7.2
User Guide (Rev. 2010-01-01)
User Interface. Main Window.
Permanence
51
The <Permanence> tab contains preference settings related to the calculations of permanence analysis. See (Fig. 27).
Fig. 27
Test conditions ...
- Contains environmental conditions of
the accelerated test applied to all targets
a project. These conditions may include
light level (Lux), light cycle duration
(hours per day), temperature (°C), relative
humidity (%RH), and gas concentration
(ppm).
Predictions for ...
- Allows environmental conditions to be
set for predictive purposes. These conditions may include light level (Lux), light
cycle duration (hours per day), gas fading adjustment (a defined coefficient), and
extra adjustment (another defined coefficient primarily used for reciprocity law
failure).
Timer verification ... Sets a threshold for verification of the time
WIR i-Star Professional Edition Version 7.2
User Guide (Rev. 2010-01-01)
User Interface. Main Window. Permanence
52
and timer stamps when the values differ
on a project description page.
Test time data for each file can be entered into the project description
table as real time in the standard timestamp format and/or as stopwatch timer
values. When both methods are used for the same file, the i-Star application
will crosscheck the two valuess and alert the user when the time discrepancy
is greater than the timer verification value. Measurement data cells with discrepancies are highlighted red. The threshold value is a percent value with a
default set at 2%. When a discrepancy exists within the threshold percentage
value, the i-Star application will rely on the stopwatch timer data and will
ignore the time stamp data.
WIR i-Star Professional Edition Version 7.2
User Guide (Rev. 2010-01-01)
User Interface. Main Window.
Project
Description
Page
53
The <Project Description Page> appears when the i-Star application opens
an existing project or the setup for a new project is complete. The project
page uses a tab arrangement to organize project data and individual project
file results. See (Fig. 28).
Fig. 28
The “Project Description” tab opens the test description page containing a
list of files included in the project, and allows the timer data entry. Individual
files may be added or removed from a project by clicking on « Files : Add to
Project » and « Files : Delete from Project ». To select files for removal, click
on the corresponding tab or row of the “Project Description” table. Files may
only be added or removed one at a time.
The position of any file, except the reference file, can be modified by clicking on the corresponding row of the “Project Description” table and then
choosing « Files : Move Up » or « Files : Move Down ».
Depending on the version of the software, the “Project Description” table
may have cells which specify the project time data.
Entering time data for a file can be accomplished in two ways. Use the
WIR i-Star Professional Edition Version 7.2
User Guide (Rev. 2010-01-01)
User Interface. Main Window. Project Description Page.
54
date/time shortcut to insert the computer clock time into the “Time Started”
and “Time Stopped” columns. Additionally, manual insertion of the date/
time values with proper format is possible. The date/time preference settings
are found in the <General> tab on the “Preferences Page.”
Enter stopwatch timer values in the “Timer Started” and “Timer Stopped”
columns. When both sets of date/time data are entered, the i-Star application
will check for a discrepancy larger than the threshold value set in the “Timer
verification” box of the “Permanence” tab.
The “File” tabs open calculated data sets for individual files embedded in
a project. The calculation results are stored in a set of sub-pages. The subpages may be opened by clicking on the appropriate tab. This data may not
be edited.
WIR i-Star Professional Edition Version 7.2
User Guide (Rev. 2010-01-01)
User Interface. Main Window.
Data
Layout Page
55
Viewing of the <Data Layout Page> appears only when creating a new
project or adding data files to an existing project. This page contains a control panel and a grid with data from the import file. See (Fig. 29). While
loading the data file into the grid, the i-Star application recognizes the file
format and identifies all critical information. When verified, this information
is auto-filled into the panel. When unsuccessful, the DIA engine is enabled.
The i-Star application will attempt to fill the blanks. When both methods fail,
manual data entry is necessary. All cells that require data are colored yellow
by the i-Star application.
Fig. 29
If the file contains more than one data type, the application treats these
formats in the following sequence:
Spectral Data
XYZ Data
LAB Data
Manual changes of data type is possible. Using the grid context menu, select the desired type of data. Next, select a range of data on the grid and mark
this data range using the context menu.
WIR i-Star Professional Edition Version 7.2
User Guide (Rev. 2010-01-01)
User Interface. Main Window. Data Layout Page.
56
After verification of data, choose the “Proceed” button or press the “Discard” button and return to the previous application page. Manual modifications of any data will create a new i-Star readable file reflecting the changes. Modify the name and location of this file under the “Correct File Name”
field.
WIR i-Star Professional Edition Version 7.2
User Guide (Rev. 2010-01-01)
User Interface. Main Window.
About Page
57
The <About Page> is accessed from the main menu by clicking « i-Star:
About i-Star … ». See (Fig. 30). The i-Star application version, other related
release information, and a link to the Wilhelm Imaging Research, Inc. website
exist on this window.
Fig. 30
WIR i-Star Professional Edition Version 7.2
User Guide (Rev. 2010-01-01)
User Interface
Charts Window
58
The <Charts> window allows access to six chart formats. See (Fig. 31).
The window contains two tabs:
<Settings>
<Chart>
The <Settings> tab contains a set of modifiable parameters and controls
similar to those on the “Charts” tab on the “Preferences Page.” For detailed
instructions for these controls, refer to the Chapter on “Project Chart Settings”
in this manual. The <Settings> tab contains the “Save as standard” and “Restore standard” buttons. “Save as standard” copies the parameter settings of
the current tab into the “Project Chart Settings” tab on the “Preferences Page.”
Alternatively, “Restore standard” copies the parameter settings in the “Project
Chart Settings” tab and transfers the information to the current <Settings>
tab.
Fig. 31
WIR i-Star Professional Edition Version 7.2
User Guide (Rev. 2010-01-01)
User Interface. Charts Window
59
The <Chart> tab contains a central frame and a control panel. See (Fig.
32).
Fig. 32
The central frame contains a chart allowing greater control of the chart
width and height. Controlling the central frame dimensions is important when
exporting charts from the i-Star application for external reports. The context
menu associated with the central frame provides the following actions:
Maximize Frame ...
– Reshapes the central frame to cover the
whole accessible area of chart window.
Square Frame Down ...
– Reshapes the central frame as a square,
using the largest value of the initial frame
dimensions to determine the size.
Square Frame Up ...
– Reshapes the central frame as a square using the smallest value of the initial frame
dimensions to determine the size.
Save Chart as .jpg ...
– Exports content of the central frame to the
external file in .jpg format.
WIR i-Star Professional Edition Version 7.2
User Guide (Rev. 2010-01-01)
User Interface. Charts Window
Save Chart as .wmf ...
60
– Exports content of the central frame to the
external file in .wmf format.
The following controls may be accessed depending on contents of the
graph shown in the central frame.
Region of interest ... – Allows selection and viewing of results
for a particular region of interest, defined
in the “Parameters” window.
Statistical Selection ... – This groupbox contains the “use complete
region” and “use the latest measurement
distribution (relative)” checkboxes. When
the “use completed region” is chosen, averaged results for the chosen region of interest are graphed. When unchecked, the
worst 10% of data from the chosen region
will be graphed. Depending on the chart
type, an additional check box labeled “use
the latest measurement distribution (relative)” may appear. This check box posts
filtered data for each file in absolute or
relative terms. Absolute terms plot data
representing data fitting filter criteria for
each file. When relative terms are used,
the data is first screened according to the
filter criteria, and then tracked as a subset
over the project. Absolute versus relative
statistical terms allow for change in color
patches still fitting criteria from different
files. For example, what may have been
the worst 10% of patches in the second
file may differ from those comprising the
worst 10% in the third file, etc.
Show legend ...
– When checked, a legend box is added to
the chart.
Show backdrop ... – When checked, the backdrop is shown.
Go to « Preferences ... : General : Themes
» to change the backdrop.
WIR i-Star Professional Edition Version 7.2
User Guide (Rev. 2010-01-01)
User Interface. Charts Window
61
Use time scale ...
– When checked, the style of the chart Xaxis is defined.
X axis ... – Offers four X-axis unit options. See the
results report options at «Preferences ... :
General : Project Options» for more information.
Y axis ...
– Allows choice between percent value
and actual numerical value to scale the
Y-axis.
Components ...
– Allows selection of the components shown
on the chart.
Step interval ...
– Varies the width of the “bin” used on the
X-axis to chart the component histogram.
Single patch ...
– Allows choice of one patch from the test
target by selecting a column and row. The
spectral data for that patch, the initial color
(the reference measurement data), the and
final color (corresponding to the last plotted measurement) is then displayed. The
initial color is displayed in the left box; the
final color is displayed in the right box.
WIR i-Star Professional Edition Version 7.2
User Guide (Rev. 2010-01-01)
User Interface. Charts Window
62
See (Fig. 33). Select one of the following chart types from the context
menu found on the control panel:
I* Component Results
Tonal Reproduction
Hue Angle Distribution
Component Histograms
Component Development
Spectral Distribution
Interpretation of these chart types is available on the Wilhelm Imaging
Research, Inc. website and in the “How to Interpret the Results” chapter of
this manual.
Fig. 33
WIR i-Star Professional Edition Version 7.2
User Guide (Rev. 2010-01-01)
User Interface.
Target Model
Window
63
The <Target Model> window contains a dedicated target model area for
viewing the test target. See (Fig. 34). The i-Star application converts file data
and displays the color patches in the target model area. The <Target Model>
window contains a control panel allowing selected data to be displayed and
retrieval of colorimetric and I* components from individual patches in the
test target. Colorimetric data may be retrieved in the test window, but the
target model displays corresponding colors and geometric arrangement of the
patches in the entire test target or a region of interest. The <Target Model>
window may be opened multiple times to compare different aspects of a test
target data.
Fig. 34
See (Fig. 35). The control panel of the Target Model window contains the
following features:
Files ... - Allows selection of a project file to display
in the target model area. When a desired
file has been chosen, the target model color patches will update accordingly.
Region of interest ...
- Allows selection of a desired region of in-
WIR i-Star Professional Edition Version 7.2
User Guide (Rev. 2010-01-01)
User Interface. Target Model Window
64
terest (reds, blues, highlights, etc.). The
target model area limits viewable patches
to those that meet the criteria for the chosen target image. The number of patches
meeting the criteria and total number of
patches on the target is displayed.
Use complete region ...
- When checked, the target model area displays all patches meeting the criteria for
the chosen region of interest. When unchecked, the region of interest is statistically filtered. The target model area displays only the worst 10% of patches found
in the chosen region of interest. The number of patches meeting the criteria and the
total number of patches on the target are
displayed.
Components ...
- Used in conjunction with the “Show Markers” check box and the “Min and Max” edit
boxes. See explanation for Show Markers
check box. The type of components chosen may affect the number of patches displayed in the target model area, because
the calculation depends on user settings.
This is especially true when white border
patches are included in the calculations.
Show markers ...
- Used in conjunction with the “Components” and “Min and Max” edit boxes. By
selecting a component (I*c, I*tone, ∆E, L*,
etc.) and the show markers check box, the
target model area will display arrow markers on the patches. These markers identify which patches have numerical values
less than the minimum or greater than the
maximum values entered in the Min and
Max edit boxes. Unmarked patches fall
within the specified range for the chosen
component. The number of patches found
in each of the three intervals is displayed
nearby. Minimum and maximum default
values for each component are preset in
WIR i-Star Professional Edition Version 7.2
User Guide (Rev. 2010-01-01)
User Interface. Target Model Window
65
the Min and Max edit boxes. Manual adjustment of these values is possible. The
I* components are displayed in the target
model as fractional values rather than percentages. For example, I*c ranges from 0
to 1.0 (not 0 to 100%). Enter the appropriate fractional values in the Min and Max
edit boxes.
Min and Max boxes ... - Used in conjunction with the “Show markers” and “Components.” See the description above labeled “Show markers.”
Information palette ...
- When the pointer is dragged over a specific patch in the target model area, the information palette displays corresponding
values for each selected component and
the corresponding column and row numbers. The components list displayed in the
information pallette may be customized to
show only a desired subset of components.
Choose the desired options on the header
of the “Information Palette,” and choose
desired “Component” options. Toggling
the major check box expands or collapses
the list. The I* components are displayed
in the target model as fractional values
rather than percentages. For example, I*c
ranges from 0 to 1.0 (not 0 to 100%).
WIR i-Star Professional Edition Version 7.2
User Guide (Rev. 2010-01-01)
User Interface. Target Model Window
66
Create New Crop ...
- Accesses the <Project Crops> tab on the
“Preferences Page.” If checked, the i-Star
application will fill the Crop table with
patches falling within the min and max
range defined on the <Target Model> window.
Save Target as .jpg ... - Saves the target model area view as a .jpg
file.
Save Target as .wmf ... - Saves the target model area view as a .wmf
file.
Fig. 35
WIR i-Star Professional Edition Version 7.2
User Guide (Rev. 2010-01-01)
User Interface.
67
PDF Report
Preview
Window
View the <PDF Report Preview> window by clicking «Main Menu : View
: PDF Report Prewiew Window». See (Fig. 36). Only one PDF Report Preview Window may be open at one time.
Fig. 36
Information for each project may be separated into thirteen categories:
Summary
Target Info
Test Info
Variables
Regions of Interest
Criteria Set
Results
Worst 10%
Interpolation
Worst 10%
Standard Charts
Extra images
References
WIR i-Star Professional Edition Version 7.2
User Guide (Rev. 2010-01-01)
User Interface. PDF Report Preview Window
68
Including these categories in a final test report is possible by clicking the
check boex found on the top right of the <PDF Report Preview> window. Access the report page information by clicking on one of the thirteen buttons.
The i-Star application provides three preset reporting options located below the category control groups. The three options include:
Complete Report
Wilhelm Imaging Style (short) Report
Custom Report
The “Complete Report” and “Wilhelm Imaging Style (short) Report” are
not modifable. To modify the “Custom Report” click the “Memorize Report
presets” button, or follow the “Preferences Page” interface....
The <Summary> tab contains essential information, for observation of the
test report.
The <Target Info> tab contains information regarding the target used in
the test.
The <Test Info> tab contains information regarding physical aspects of the
procedure performed during the test time.
The <Variables> tab contains observations of the variables used in calculations of the test results.
The <Regions of Interest> tab contains information about regions of interest specified for the current test.
The <Criteria Set> tab contains threshold values for each of the major iStar components used to analyze the image retention.
The <Results> tab contains average calculation results of the major i-Star
components for each region of interest.
The <Worst 10%> tab contains calculation results of the major iStar components averaged for the worst 10% of each region of interest.
The <Interpolation> tab contains interpolated calculation results of the
major i-Star components for each region of interest at a chosen phase of the
test.
The <Worst 10%> tab contains calculation results of the major i-Star comWIR i-Star Professional Edition Version 7.2
User Guide (Rev. 2010-01-01)
User Interface. PDF Report Preview Window
69
ponents averaged for the worst 10% for each region of interest at a certain
phase of the test.
The <Standard Charts> tab contains five standard charts representing the
general test results, including i-Star charts for the whole test target, general
skin tones, dark skin tones, light skin tones, and gray regions of interest.
The <Extra images> tab contains a list of extra images associated with the
test (if any).
The <References> tab contains information about the publicly accessible
article with the explanation of the i-Star metric.
“Create PDF Report” and “Create PDF Reports and Print” buttons complete the procedure of test reporting.
After selecting desired categories of test information, further specificity
by accessing the “Category Page.” Most controls located on category pages
serve primarily for information preview. Test origin and rest result information are found on these pages. If fields show incorrect information, corrections must be made to the whole project, thus requiring a total recalculation.
The list of controls serving specific functions during report printing include:
<File Name> field on Summary page
<Browse> button on Summary page
<at user defined folder> check box on Summary page
<at project folder> check box on Summary page
<at collector folder> check box on Summary page
<Date> field on Summary page
<Supplimental Information> field on Summary page
<Include Limitations> button on Summary page
<Memorize this Information> button on Summary page
<Reference Target notes> field on Target Info page
<Memorize this Information> button on Target Info page
<X-axis units> radio group on Results page
<Comments> field on Results page
<Comments> field on Results Worst 10% page
<test %> field on Interpolation page
<test duration> field on Interpolation page
<Comments> field on Interpolation page
<Comments> field on Interpolation Worst 10% page
<Charts> button group on Standard Charts page
WIR i-Star Professional Edition Version 7.2
User Guide (Rev. 2010-01-01)
User Interface. PDF Report Preview Window
70
<Load All...> button on Extra Images page
<Add...> button on Extra Images page
<Images> table on Extra Images page
The <File Name> field on the Summary page allows creation of a name for
the PDF report.
The <Browse> button on the Summary page allows the PDF report file
name and defined folder to be set.
The <at user defined folder> check box on the Summary page defines
whether the PDF report is created in a defined folder.
The <at project folder> check box on the Summary page defines whether
the PDF report is created in the project folder.
The <at collector folder> check box on the Summary page defines whether
the PDF report is created in the collector folder.
The <Date> field on the Summary page specifies the creation date of the
PDF report.
The <Supplimental Information> field on the Summary page allows the
addition of report specific comments
The <Include Limitations> button on the Summary page allows the addition of copyright/legal information into the report comments.
The <Memorize this Information> button on the Summary page allows
memorization of the Supplimental information field for future use in the current project.
The <Reference Target notes> field on the Target Info page allows the addition of notes about the reference target and test conditions.
The <Memorize this Information> button on the Target Info page allows
memorization of the Reference Target Notes field for future use in the current
project.
The <X-axis units> radio group on the Results page allows specification
of units (Test duration, Exposure, Display time, Adjusted time) for results of
the i-Star component calculations.
WIR i-Star Professional Edition Version 7.2
User Guide (Rev. 2010-01-01)
User Interface. PDF Report Preview Window
71
The <Comments> field on the Results page allows the inclusion of extra
notes.
The <Comments> field on the Results Worst 10% page allows the inclusion of extra notes.
The <test %> field on the Interpolation page allows point specification using the test duration ratio.
The <test duration> field on the Interpolation page allows point specification using the report units.
The <Comments> field on the Interpolation page allows the inclusion of
extra notes.
The <Comments> field on the Interpolation Worst 10% page allows the
inclusion of extra notes.
The <Charts> button group on the Standard Charts page allows access to
all charts for preview in the same frame.
The <Load All...> button on the Extra Images page which loads images
from folders into a report.
The <Add...> button on the Extra Images page allows the addition of a
single image into a report.
The <Images> table on the Extra Images page allows preview of included
images on the same page.
WIR i-Star Professional Edition Version 7.2
User Guide (Rev. 2010-01-01)
User Interface
Spreadsheet
Window
72
The <Spreadsheet> window is located under « Main Menu : Extras : Spreadsheet ». See (Fig. 37). An unlimited number of spreadsheet windows may be
opened. In this case, the windows will be named Spreadsheet 1, Spreadsheet
2, etc.
Fig. 37
The <Spreadsheet> window allows minimization of user action during the
data file preparation process (particularly for the .xls file type), when no preinstalled spreadsheet application exists.
The <Spreadsheet> window, found in the context menu, contains the following items:
New File ...
- Creates a new spreadsheet, saved as a .xls,
.txt, or .csv file format. If the <Spreadsheet> window contains an open file,
this command will disregard all unsaved
changes and clear the window.
Open Data File ...
- Opens an .xls, .txt, or .csv file. Files are
treated according to the literal extension.
Inconsistency between the existing format
and the file extension may lead to unwanted data interpretation.
WIR i-Star Professional Edition Version 7.2
User Guide (Rev. 2010-01-01)
User Interface. Spreadsheet Window
73
Save Data File ...
- Saves information present in the <Spreadsheet> window as .xls, .txt, or .csv file format.
Insert Column(s) ...
- Inserts the same number of columns as the
selected area of a spreadsheet.
Insert Row(s) ...
- Inserts the same number of rows as the
selected area of a spreadsheet.
Remove Column(s) ...
- Removes columns in the selected area of a
spreadsheet.
Remove Row(s) ...
- Removes rows in the currently area of a
spreadsheet.
Standard Column Width ... - Sets the width of each column to a standard value in a spreadsheet.
Standard Row Height ...
- Sets the height of each row to a standard
value in a spreadsheet.
AutoFit ...
- Automatically sizes columns to fit the data
content.
Memorize Geometry ...
- Memorizes current location and size of
the window on the screen. When a new
spreadsheet window is opened in a project, it will be created based on the memorized geometry information.
The shortcut is Ctrl + Shift + m.
Show i-Star Window ...
- Activates the application main window.
The shortcut is Ctrl + Shift + `.
Show Next Window ...
- Activates the next window from the window list.
The shortcut is Ctrl + `.
WIR i-Star Professional Edition Version 7.2
User Guide (Rev. 2010-01-01)
74
Working
with i-Star
This chapter explains how to perform several basic operations and necessary tasks for the successful operation of i-Star.
How to Choose and Prepare a Target
Depending on the intended use of the program, choose an appropriate target (or set of targets) for testing. Most tests will not need any other than the
provided i-Star target. The 800 patches provide a comprehensive understanding of all major color groups from the sRGB Color Space. Although 800
patches is sufficient for most evaluations, the more patches, the more precise
the results. i-Star does not limit the target choice. Modification of the target
to test a certain area of color space can be done. i-Star will process pictorial
targets, but creating them is a rather advanced procedure requiring the ability
to downsample images. The downsample procedure is not explained in this
manual.
How to Create a New i-Star Intelligible Input File
i-Star will best process data input formats originating from Gretag Macbeth Spectro Chart and Measure Tool. If data originates from software other
than these, pre-format the data before proceeding. This function is helpful
when data files will not open from the Data Layout page. When data is available on the Data Layout page, use page controls to specify input data. Templates for creating i-Star compatible input data (Spectral, LAB, and XYZ) are
provided.
To begin, open the appropriate template provided with the program (Template_iStar_lab, Template_iStar_xyz, or Template_iStar_spec). Use the embedded spreadsheet utility or a different spreadsheet program. Next, feed the
data into this file.
How to Create a New i-Star Project
To create a new project, select the « Project : Create New » item from
the application main menu. The “Add File to Project” dialog will open, then
select the reference file. Depending on the preferences, one of the following
scenarios will occur:
1.The i-Star intelligible reference file is automatically imported.
2.The i-Star application needs user confirmation or cannot extract all the
necessary information from the input file. After specifying all necessary information on the Date Layout page, proceed with importing the data file.
WIR i-Star Professional Edition Version 7.2
User Guide (Rev. 2010-01-01)
Working with i-Star
75
To add more files to a project, select the « Files : Add to Project » item from
the main menu and follow the instructions.
How to Interpret the Results
After including at least two data files in a project, set up the project preferences and calculate the project results. The most general results can be observed via the Charts window (in visual form) or via the Results window (in
table form).
When operating with the Charts window, utilize the I* Component Results
chart. The points (I*total, I*c, I*tone, etc.) plotted on this chart are scaled
between 0 and 100%, where 100% represents a perfect retainment quality
with regard to the reference image, and 0% reflect complete inaccuracy. Conversely, a perfect score for the quality control components is 0%, while a
value of 100% reflects complete inaccuracy with the corresponding image.
The display of the I*total graph for the “All Data” region of interest provides
the most direct information about overall image fidelity.
More definite results can be retrieved from observation of the {I*c}
{I*tone} graphs. The{I*c} graph trend displays the change in color accuracy.
The {I*tone} trend displays the change in tonal accuracy. In most cases, the
graphs of I*c and the {I*c} components look the same. Likewise, the graphs
of I*tone and {I*tone} look the same. If trends in these graph pairs split, the
i-Star application has discovered “artifacts” – patches with the I*c or I*tone
values not meeting requirements of the quality control. Rely on graphs of the
truncated components {I*c} and {I*tone} if the project results are to be compared with results of other projects.
The presence of an artifact is a valuable result in itself. An artifact unveils
serious quality loss on the tested image. Refer to the <Target Model> window
to uncover the nature of the quality loss and localize the artifact patches.
To locate the most deviant artifacts, graph the {I*c}, {I*tone}, and quality control points of the worst 10% of the data. In a project where “artifacts”
have been found, the worst 10% results may drastically differ from the complete region results. Create a new region of interest to retrieve more specific
results.
Observation of results from other regions of interest help to localize the
sources of quality loss. If the target does not include patches of the defined
regions of interest, data for those regions will not be plotted and evaluated.
The Tonal Reproduction chart helps to evaluate the trend of tonal accuracy.
WIR i-Star Professional Edition Version 7.2
User Guide (Rev. 2010-01-01)
Working with i-Star
76
The I* metric finds the patches most affected by the light levels and creates a
graph with the trend.
The trend line reference file will always be a straight line (equivalent to
the f(x) = x function). The trend line representing a compared file will either
be a straight line, or it will contain aberrations resulting from artifacts on the
image.
A straight trend line signifies a test file that does not calculate major changes in tonal accuracy. Instead, a shift of lightness or change of the dynamic
range may have occured. Artifacts on a trend line will normally result from
aberrant object shapes on the test image.
The Hue Angle Distribution chart evaluates the hue shift of each individual
patch and the overall image tint. The graph trends reflect the change of patch
hue from the reference image to the compared image. The major lines on the
graph show the overall image tint. This chart helps to evaluate the color accuracy in the project.
The Component Histograms chart displays valuable information of result
distribution for individual patches of the target image. See (Fig. 38). Though
the I* component results may seem acceptable, a non-Gaussian distribution
on the Component Histograms chart would result in a downgrade. For example, even when two projects have comparable I* results, a project with a
distribution further from a standard Gaussian distribution on its Component
Histograms chart will be down-graded because it is more likely to contain
artifacts.
WIR i-Star Professional Edition Version 7.2
User Guide (Rev. 2010-01-01)
Working with i-Star
77
Fig. 38
Fig. 39
WIR i-Star Professional Edition Version 7.2
User Guide (Rev. 2010-01-01)
Working with i-Star
78
The Spectral Distribution chart shows light response across the spectrum
for a selected patch between the reference image and a tested image. See (Fig.
39). This information is helpful in projects involving images with different
light sources. The rainbow-colored line reflects the spectral power distribution of the light source of a reference file. Even though chart trend lines can
represent more than one measurement, the visual patch representations beneath the graph delineate both the reference file and the latest included file.
When spectral data files were not imported for the project, the <Spectral Distribution> chart is unavailable.
WIR i-Star Professional Edition Version 7.2
User Guide (Rev. 2010-01-01)
79
Glossary
reference image
- The image considered to be “ideal” under
conditions of the experiment.
final image
- A version of the reference image used to
evaluate the image appearance fidelity.
test target
- The form of image specially prepared for
a test. The target contains a number of
patches.
patch, sample
- The graphics element of the test target
separated from other elements of the target and characterized by specific color and
a standard size.
test file, data file
- Digital record of target properties stored
in a file.
project
- A set of test files grouped together in context with the i-Star application. Upon
saving, information about all included test
files is stored as an .isf file format.
I* components
- A set of variables calculated by the i-Star
application. When referring to a specific
set of variables, it refers to the set of variables forming the I* metric (including I*c,
I*tone, IcQC, etc.).
CIE LAB - CIE 1976 L*a*b* is one of the most commonly used color models. Used to describe
all colors visible to the human eye. It was
developed by the International Commission on Illumination.
.isf formatted file,
.isf file type
.islr formatted file,
.islr file type
WIR i-Star Professional Edition Version 7.2
- The .isf file format used to store project
information.
- The .islr file format used to store region of
interest information.
User Guide (Rev. 2010-01-01)
Glossary
80
.islc formatted file,
.islc file type
.islcm formatted file,
.islcm file type
.islcs formatted file,
.islcs file type
WIR i-Star Professional Edition Version 7.2
- The .islc file format used to store crop information.
- The .islcm file format used to store color
map information.
- The .islcs file format used to store charts
settings information.
User Guide (Rev. 2010-01-01)
81
Bibliography
1. Mark McCormick-Goodhart, Henry Wilhelm, and Dmitriy Shklyarov, “A Retained Image Appearance Metric For Full Tonal
Scale, Colorimetric Evaluation Of Photographic Image Stability,” presented at IS&T’s NIP20: International Conference on
Digital Printing Technologies, Salt Lake City, Utah, October 31
- November 5, 2004.
WIR i-Star Professional Edition Version 7.2
User Guide (Rev. 2010-01-01)