1
TaqMan® Human
Cytokine Card
Protocol
© Copyright 2001, All rights reserved.
For Research Use Only. Not for use in diagnostic procedures.
Information in this document is subject to change without notice. Applied Biosystems assumes no responsibility for any
errors that may appear in this document. This document is believed to be complete and accurate at the time of publication. In
no event shall Applied Biosystems be liable for incidental, special, multiple, or consequential damages in connection with ir
arising from the use of this document.
NOTICE TO PURCHASER: DISCLAIMER OF LICENSE
The TaqMan® Human Cytokine Card is optimized for use in the Polymerase Chain Reaction (“PCR”) and
5´ nuclease detection methods covered by patents owned by Roche Molecular Systems, Inc. and F. Hoffmann-La Roche Ltd.
No license under these patents to use the PCR process or 5´ nuclease detection methods is conveyed expressly or by
implication to the purchaser by the purchase of this product. A license to use the PCR process for certain research and
development activities accompanies the purchase of certain Applied Biosystems reagents when used in conjunction with an
authorized thermal cycler, or is available from Applied Biosystems. Further information on purchasing licenses to practice
the PCR process may be obtained by contacting the Director of Licensing at Applied Biosystems, 850 Lincoln Centre Drive,
Foster City, California 94404 or at Roche Molecular Systems, Inc., 1145 Atlantic Avenue, Alameda, California 94501.
ABI PRISM and its Design, Applied Biosystems and MicroAmp are registered trademarks of Applera Corporation or its
subsidiaries in the U.S. and certain other countries.
ABI is a trademark of Applera Corporation or its subsidiaries in the U.S. and certain other countries.
AmpErase, AmpliTaq, AmpliTaq Gold, GeneAmp and TaqMan are registered trademarks of Roche Molecular Systems, Inc.
Macintosh is a registered trademark of Apple Computer, Inc.
All other trademarks are the sole property of their respective owners.
07/2001
4307577 Rev. C
Contents
1 Introduction
Getting Started Quickly . . . . . . . . . . . . . . . . . . . . . . . . . . . . . . . . . . . 1-1
Product Overview . . . . . . . . . . . . . . . . . . . . . . . . . . . . . . . . . . . . . . . . 1-1
TaqMan Human Cytokine Card Design . . . . . . . . . . . . . . . . . . . . . . . 1-2
Procedure Flowchart . . . . . . . . . . . . . . . . . . . . . . . . . . . . . . . . . . . . . . 1-3
Virtual Dye Layers . . . . . . . . . . . . . . . . . . . . . . . . . . . . . . . . . . . . . . . 1-4
Genomic DNA Contamination . . . . . . . . . . . . . . . . . . . . . . . . . . . . . . 1-4
Competition Between Multiplexed Reactions . . . . . . . . . . . . . . . . . . 1-5
Quality Control . . . . . . . . . . . . . . . . . . . . . . . . . . . . . . . . . . . . . . . . . . 1-5
System Performance Guarantee . . . . . . . . . . . . . . . . . . . . . . . . . . . . . 1-6
Designing TaqMan Human Cytokine Card Experiments . . . . . . . . . . . . . . . 1-7
About the Comparative CT Method of Relative Quantification . . . . . 1-7
Significance of the Calibrator Sample . . . . . . . . . . . . . . . . . . . . . . . . 1-7
Design Guidelines. . . . . . . . . . . . . . . . . . . . . . . . . . . . . . . . . . . . . . . . 1-8
Preventing Contamination . . . . . . . . . . . . . . . . . . . . . . . . . . . . . . . . . . . . . . . 1-9
Contamination and the 5´ Nuclease Assay . . . . . . . . . . . . . . . . . . . . . 1-9
Using AmpErase UNG . . . . . . . . . . . . . . . . . . . . . . . . . . . . . . . . . . . . 1-9
General PCR Practices . . . . . . . . . . . . . . . . . . . . . . . . . . . . . . . . . . . . 1-9
Materials and Equipment. . . . . . . . . . . . . . . . . . . . . . . . . . . . . . . . . . . . . . . 1-10
TaqMan Card Upgrade Package and Components . . . . . . . . . . . . . . 1-10
Storage Guidelines . . . . . . . . . . . . . . . . . . . . . . . . . . . . . . . . . . . . . . 1-10
Ordering Applied Biosystems Kits and Reagents. . . . . . . . . . . . . . . 1-11
Reagents and Equipment Not Included. . . . . . . . . . . . . . . . . . . . . . . 1-11
Safety . . . . . . . . . . . . . . . . . . . . . . . . . . . . . . . . . . . . . . . . . . . . . . . . . . . . . . 1-12
Documentation User Attention Words . . . . . . . . . . . . . . . . . . . . . . . 1-12
Chemical Hazard Warning . . . . . . . . . . . . . . . . . . . . . . . . . . . . . . . . 1-12
Site Preparation and Safety Guide . . . . . . . . . . . . . . . . . . . . . . . . . . 1-13
iii
Ordering MSDSs . . . . . . . . . . . . . . . . . . . . . . . . . . . . . . . . . . . . . . . 1-13
2 Reverse Transcription
Overview . . . . . . . . . . . . . . . . . . . . . . . . . . . . . . . . . . . . . . . . . . . . . .
Where You Are in the Procedure . . . . . . . . . . . . . . . . . . . . . . . . . . . .
Preparing the RNA Template . . . . . . . . . . . . . . . . . . . . . . . . . . . . . . . . . . . .
Recommended Template . . . . . . . . . . . . . . . . . . . . . . . . . . . . . . . . . .
Template Quality . . . . . . . . . . . . . . . . . . . . . . . . . . . . . . . . . . . . . . . .
Template Quantity . . . . . . . . . . . . . . . . . . . . . . . . . . . . . . . . . . . . . . .
Performing Reverse Transcription . . . . . . . . . . . . . . . . . . . . . . . . . . . . . . . .
Guidelines . . . . . . . . . . . . . . . . . . . . . . . . . . . . . . . . . . . . . . . . . . . . .
Preparing the Reactions . . . . . . . . . . . . . . . . . . . . . . . . . . . . . . . . . . .
Thermal Cycling . . . . . . . . . . . . . . . . . . . . . . . . . . . . . . . . . . . . . . . .
2-1
2-1
2-2
2-2
2-2
2-2
2-3
2-3
2-4
2-6
3 PCR
Overview . . . . . . . . . . . . . . . . . . . . . . . . . . . . . . . . . . . . . . . . . . . . . . 3-1
Where You Are in the Procedure . . . . . . . . . . . . . . . . . . . . . . . . . . . . 3-1
Before Conducting the PCR . . . . . . . . . . . . . . . . . . . . . . . . . . . . . . . . . . . . . 3-2
Adjusting the Exposure Time for Card Runs . . . . . . . . . . . . . . . . . . . 3-2
About the ABI PRISM Filling Station . . . . . . . . . . . . . . . . . . . . . . . . . . . . . . 3-3
Description . . . . . . . . . . . . . . . . . . . . . . . . . . . . . . . . . . . . . . . . . . . . . 3-3
Laboratory Setup . . . . . . . . . . . . . . . . . . . . . . . . . . . . . . . . . . . . . . . . 3-3
Sample Preparation . . . . . . . . . . . . . . . . . . . . . . . . . . . . . . . . . . . . . . . . . . . . 3-4
Guidelines . . . . . . . . . . . . . . . . . . . . . . . . . . . . . . . . . . . . . . . . . . . . . 3-4
Recommended Quantity. . . . . . . . . . . . . . . . . . . . . . . . . . . . . . . . . . . 3-5
Preparing a Sample-Specific PCR Reaction Mix. . . . . . . . . . . . . . . . 3-5
Loading the TaqMan Human Cytokine Card . . . . . . . . . . . . . . . . . . . . . . . . 3-7
About ABI PRISM Cards. . . . . . . . . . . . . . . . . . . . . . . . . . . . . . . . . . . 3-7
Guidelines for Loading Cards . . . . . . . . . . . . . . . . . . . . . . . . . . . . . . 3-8
Preparing a Card. . . . . . . . . . . . . . . . . . . . . . . . . . . . . . . . . . . . . . . . . 3-9
Loading and Sealing a Card . . . . . . . . . . . . . . . . . . . . . . . . . . . . . . . 3-12
Loading a Card into an ABI PRISM 7700 Sequence Detection System . . . 3-14
About the ABI PRISM Card Adaptor Design . . . . . . . . . . . . . . . . . . 3-14
iv
Loading a Card for Sequence Detection . . . . . . . . . . . . . . . . . . . . . . 3-15
Running TaqMan Human Cytokine Cards. . . . . . . . . . . . . . . . . . . . . . . . . . 3-17
About SDS Plate Documents . . . . . . . . . . . . . . . . . . . . . . . . . . . . . . 3-17
Using a Template . . . . . . . . . . . . . . . . . . . . . . . . . . . . . . . . . . . . . . . 3-17
Setting the Thermal Cycling Parameters . . . . . . . . . . . . . . . . . . . . . 3-18
Configuring the Dye Layers . . . . . . . . . . . . . . . . . . . . . . . . . . . . . . . 3-19
Saving the Plate Document as a Template . . . . . . . . . . . . . . . . . . . . 3-21
Running the Card . . . . . . . . . . . . . . . . . . . . . . . . . . . . . . . . . . . . . . . 3-22
4 Data Analysis
Overview. . . . . . . . . . . . . . . . . . . . . . . . . . . . . . . . . . . . . . . . . . . . . . . 4-1
Where You Are in the Procedure. . . . . . . . . . . . . . . . . . . . . . . . . . . . . 4-1
Before the Analysis . . . . . . . . . . . . . . . . . . . . . . . . . . . . . . . . . . . . . . . . . . . . 4-2
Activating Spectral Compensation . . . . . . . . . . . . . . . . . . . . . . . . . . . 4-2
Non-Fluorescent Quencher . . . . . . . . . . . . . . . . . . . . . . . . . . . . . . . . . 4-3
Setting the Baseline Values . . . . . . . . . . . . . . . . . . . . . . . . . . . . . . . . . . . . . . 4-3
Automatic Baseline Calculation . . . . . . . . . . . . . . . . . . . . . . . . . . . . . 4-3
Setting the Threshold Values . . . . . . . . . . . . . . . . . . . . . . . . . . . . . . . . . . . . . 4-4
Threshold Requirements for Relative Quantification . . . . . . . . . . . . . 4-4
Displaying Results on an Amplification Plot . . . . . . . . . . . . . . . . . . . 4-4
Threshold Value Basics . . . . . . . . . . . . . . . . . . . . . . . . . . . . . . . . . . . . 4-5
Guidelines for Setting Thresholds . . . . . . . . . . . . . . . . . . . . . . . . . . . 4-6
Setting the Threshold for the VIC Dye Layer . . . . . . . . . . . . . . . . . . . 4-7
Setting the Threshold for the FAM Dye Layer . . . . . . . . . . . . . . . . . . 4-9
Eliminating Outlying Amplification . . . . . . . . . . . . . . . . . . . . . . . . . . . . . . 4-10
Overview. . . . . . . . . . . . . . . . . . . . . . . . . . . . . . . . . . . . . . . . . . . . . . 4-10
Modes of Outlier Removal . . . . . . . . . . . . . . . . . . . . . . . . . . . . . . . . 4-10
Manual Removal of Outlying Data Using SDS (Optional) . . . . . . . . . . . . . 4-11
Visualizing Outliers . . . . . . . . . . . . . . . . . . . . . . . . . . . . . . . . . . . . . 4-11
Identifying Outlying Replicate Wells . . . . . . . . . . . . . . . . . . . . . . . . 4-12
Eliminating Wells from the Analysis . . . . . . . . . . . . . . . . . . . . . . . . 4-13
Exporting the Analyzed Run as a Results File. . . . . . . . . . . . . . . . . . . . . . . 4-14
Exporting a Results File . . . . . . . . . . . . . . . . . . . . . . . . . . . . . . . . . . 4-14
v
5 Interpreting Results
Overview . . . . . . . . . . . . . . . . . . . . . . . . . . . . . . . . . . . . . . . . . . . . . .
Where You Are in the Procedure . . . . . . . . . . . . . . . . . . . . . . . . . . . .
Calculating Relative Cytokine Gene Expression . . . . . . . . . . . . . . . . . . . . .
Rationale . . . . . . . . . . . . . . . . . . . . . . . . . . . . . . . . . . . . . . . . . . . . . .
References . . . . . . . . . . . . . . . . . . . . . . . . . . . . . . . . . . . . . . . . . . . . .
Configuring the ABI PRISM 7700 Relative Quantification Software . . . . . .
Creating a Template for Card Analyses . . . . . . . . . . . . . . . . . . . . . . .
Interpreting Relative Quantification Results. . . . . . . . . . . . . . . . . . . . . . . . .
About the Results Window. . . . . . . . . . . . . . . . . . . . . . . . . . . . . . . . .
About the Cytokine Gene Expression Profile . . . . . . . . . . . . . . . . . .
X-Axis . . . . . . . . . . . . . . . . . . . . . . . . . . . . . . . . . . . . . . . . . . . . . . . .
Y-Axis . . . . . . . . . . . . . . . . . . . . . . . . . . . . . . . . . . . . . . . . . . . . . . . .
5-1
5-1
5-2
5-2
5-2
5-3
5-3
5-4
5-4
5-5
5-5
5-5
Sample Bars . . . . . . . . . . . . . . . . . . . . . . . . . . . . . . . . . . . . . . . . . . . . 5-6
6 Troubleshooting
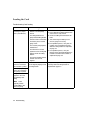
Overview . . . . . . . . . . . . . . . . . . . . . . . . . . . . . . . . . . . . . . . . . . . . . . 6-1
Loading the Card. . . . . . . . . . . . . . . . . . . . . . . . . . . . . . . . . . . . . . . . . . . . . . 6-2
Data Analysis . . . . . . . . . . . . . . . . . . . . . . . . . . . . . . . . . . . . . . . . . . . . . . . . 6-5
Interpreting Results. . . . . . . . . . . . . . . . . . . . . . . . . . . . . . . . . . . . . . . . . . . 6-10
A Theory of Operation
Overview . . . . . . . . . . . . . . . . . . . . . . . . . . . . . . . . . . . . . . . . . . . . . . A-1
TaqMan Human Cytokine Card Chemistry . . . . . . . . . . . . . . . . . . . . . . . . . A-2
RT-PCR . . . . . . . . . . . . . . . . . . . . . . . . . . . . . . . . . . . . . . . . . . . . . . . A-2
Basics of the 5´ Nuclease Assay . . . . . . . . . . . . . . . . . . . . . . . . . . . . A-2
About AmpliTaq Gold DNA Polymerase. . . . . . . . . . . . . . . . . . . . . . A-4
Multicomponent Analysis . . . . . . . . . . . . . . . . . . . . . . . . . . . . . . . . . . . . . . . A-4
Fluorescent Detection . . . . . . . . . . . . . . . . . . . . . . . . . . . . . . . . . . . . A-4
Passive Reference. . . . . . . . . . . . . . . . . . . . . . . . . . . . . . . . . . . . . . . . A-4
Normalization. . . . . . . . . . . . . . . . . . . . . . . . . . . . . . . . . . . . . . . . . . . A-5
Real Time Detection. . . . . . . . . . . . . . . . . . . . . . . . . . . . . . . . . . . . . . A-6
vi
B Demonstrating Performance with Control RNA
Overview. . . . . . . . . . . . . . . . . . . . . . . . . . . . . . . . . . . . . . . . . . . . . . .B-1
System Performance Guarantee. . . . . . . . . . . . . . . . . . . . . . . . . . . . . . . . . . .B-2
Statement. . . . . . . . . . . . . . . . . . . . . . . . . . . . . . . . . . . . . . . . . . . . . . .B-2
Protocol for Analyzing TaqMan Human Control Total RNA . . . . . . . . . . . .B-2
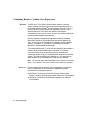
Verifying CT Values Using the SDS Software . . . . . . . . . . . . . . . . . .B-2
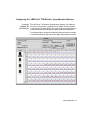
Verifying the Expression Profile of Control RNA . . . . . . . . . . . . . . .B-5
Transferring Data from the Results File . . . . . . . . . . . . . . . . . . . . . . .B-5
Calculating ∆CT . . . . . . . . . . . . . . . . . . . . . . . . . . . . . . . . . . . . . . . . .B-6
Creating an Average ∆CT Table . . . . . . . . . . . . . . . . . . . . . . . . . . . . .B-7
C Contacting Technical Support
Technical Support . . . . . . . . . . . . . . . . . . . . . . . . . . . . . . . . . . . . . . . . . . . . .C-1
Contacting Technical Support. . . . . . . . . . . . . . . . . . . . . . . . . . . . . . .C-1
To Reach Technical Support by E-Mail . . . . . . . . . . . . . . . . . . . . . . .C-1
To Reach Technical Support by Phone or Fax (N. America) . . . . . . .C-2
To Reach Technical Support by Phone or Fax (Outside N. America) C-4
To Reach Technical Support Via the Applied Biosystems Web Site. .C-6
To Obtain Technical Documents. . . . . . . . . . . . . . . . . . . . . . . . . . . . .C-6
To Obtain Customer Training Information . . . . . . . . . . . . . . . . . . . . .C-7
D References
E Limited Warranty Statement
vii
Introduction
1
1
Getting Started If familiar with the theory behind TaqMan® Human Cytokine Card
Quickly chemistry or ABI PRISM ® 7700 Sequence Detection System data
collection, read the sections of this protocol listed below. They contain
the minimum amount of reading required to conduct TaqMan Human
Cytokine Card experiments.
♦ Chapter 1: Introduction
– “Designing TaqMan Human Cytokine Card Experiments” on
pages 1-7 to 1-8
– “Preventing Contamination” on page 1-9
– “Materials and Equipment” on pages 1-10 to 1-11
♦ Chapter 2: Reverse Transcription
♦ Chapter 3: PCR
♦ Chapter 4: Data Analysis
♦ Chapter 5: Interpreting Results
If unfamiliar with the concepts behind the cytokine card chemistry or
ABI PRISM 7700 data collection, read the following sections in addition
to the ones listed above.
♦ Chapter 1: Introduction
– “” on pages 1-1 to 1-6
♦ Appendix A: Theory of Operation
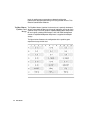
Product Overview The TaqMan Human Cytokine Card is a research tool for profiling
human cytokine gene expression using the Comparative CT Method of
relative quantification. The card evaluates a single cDNA sample
generated from human total RNA in a two-step RT-PCR experiment.
The card functions as the reaction vessel for the PCR/sequence
detection step. The wells of the card contain the fluorogenic 5´ nuclease
assays that detect the amplification of 24 cytokine targets. Relative
Introduction 1-1
levels of cytokine gene expression are determined from the
fluorescence data generated during PCR using the ABI PRISM ® 7700
Relative Quantification Software.
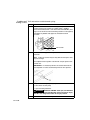
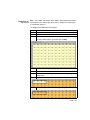
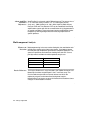
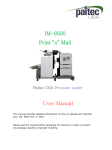
TaqMan Human The TaqMan Human Cytokine Card consists of a specially developed
Cytokine Card 96-well consumable divided into 24 sets of replicates, one set for each
Design cytokine assay. Each well contains TaqMan® MGB probes and primers
for one human cytokine mRNA target. A 20X 18S rRNA endogenous
control of TaqMan® MGB probe and primers is supplied for multiplex
assays.
The figure below illustrates the configuration of the cytokine gene
expression assays on the card.
1-2 Introduction
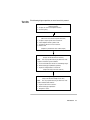
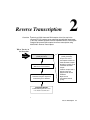
Procedure The following diagram provides an overview of this protocol.
Flowchart
Reverse Transcription
(cDNA generation)
a. Prepare the reverse transcription reactions.
b. Thermal cycling.
PCR
(ABI PRISM 7700 card run/sequence detection)
a. Prepare a sample-specific PCR reaction mix.
b. Load a TaqMan Human Cytokine Card.
c. Program the ABI PRISM 7700 instrument.
d. Run the card.
(Repeat this procedure for each cDNA sample)
Data Analysis
(Analysis of raw data from the card run)
Note
This step is performed using the ABI PRISM 7700
Sequence Detection Systems Software.
a. Set the threshold values for the VIC and FAM dye layers.
b. Eliminate outlying amplification (Optional).
c. Export the analyzed data as a results file.
(Repeat the analysis for each card run)
Interpreting Results
(Analysis of data from multiple results files)
Note
This step is performed using the ABI PRISM 7700
Relative Quantification Software.
a. Import results from the card runs.
b. Eliminate outlying amplification.
c. Analyze the results.
Introduction 1-3
Virtual Dye Layers The TaqMan Human Cytokine Card permits the amplification of
cytokine and endogenous control cDNA using a multiplexed fluorogenic
5´ nuclease assay. The assay consists of two reactions, each a
complete PCR system with corresponding probe and primers.
The fluorogenic probes of the multiplexed assay function as follows:
♦ Probes labeled with the FAM dye detect the amplification of
24 cytokine cDNA targets.
♦ Probes labeled with the VIC™ dye detect the amplification of cDNA
generated from the 18S rRNA endogenous control.
The following conceptual figure illustrates the virtual dye layer
configuration of a TaqMan Human Cytokine Card.
Genomic DNA TaqMan Cytokine Assays
Contamination TaqMan probes and primers for the 24 cytokine target assays span
exon junctions to minimize the contribution of contaminating genomic
DNA. Performance tests demonstrate that TaqMan assays can be run
with samples containing up to 10,000 copies of genomic DNA without
detection of contaminants.
TaqMan 18S rRNA Endogenous Control Assay
The 18S rRNA endogenous control assay is not RNA specific and
consequently is affected by genomic DNA contamination. However,
because of the extremely high expression level of rRNA, even gross
contamination has a negligible effect on the relative quantification
values obtained from the card.
1-4 Introduction
Competition
Between
Multiplexed
Reactions
Because cellular expression of 18S rRNA is several magnitudes greater
than typical cytokine mRNA expression, domination by the 18S reaction
is a concern. To minimize the competition between the reactions, the
18S endogenous control assay is primer limited to prevent it from
competing with the amplification of the cytokine target sequences.
For more information about controlling competition between reactions
and the primer limitation concept, see the following publications:
♦ ABI PRISM 7700 Sequence Detection System User Bulletin #2:
Relative Quantitation of Gene Expression (P/N 4303859)
♦ ABI PRISM 7700 Sequence Detection System User Bulletin #5:
Multiplex PCR with TaqMan VIC Probes (P/N 4306236).
Quality Control Functional verification of the preloaded probes and primers within the
TaqMan Human Cytokine Card is performed as part of the Applied
Biosystems manufacturing quality control process. In this process, the
performance of each cytokine target assay is verified using plasmids
that contain the cytokine’s specific cDNA target sequence.
Introduction 1-5
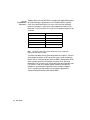
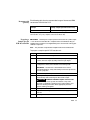
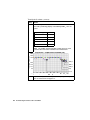
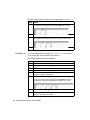
System TaqMan Human Control Total RNA is available from Applied Biosystems
Performance for demonstrating the performance of the TaqMan Human Cytokine
Guarantee Card. If the control total RNA is run in the card using the conditions
below, the average CT value for the 18S endogenous control will be
fewer than 12 cycles and the ∆CT values for five cytokine targets will be
as follows:
Target
∆CTa
IL-10
Below 20
Lymphotoxin-B
Below 20
TGF-B
Below 17
TNF-a
Below 20
TNF-B
Below 17
a. ∆CT = Median CT (FAM CT – VIC CT) for a group of replicates
Note The targets above were chosen because they are significantly
expressed in the control sample.
To achieve the above results, follow the protocol in Chapter 2, “Reverse
Transcription” to perform an RT conversion using 2 µg of control total
RNA in 100 µL of reaction volume. After the RNA is converted to cDNA,
make a sample-specific PCR reaction mix using 150 µL Universal
Master Mix, 118 µL water, 30 µL of 20X 18S Primer and Probe Mix, and
2 µL cDNA. Fill and run a TaqMan Human Cytokine Card with the
reaction mix according to the procedure in this manual (Chapter 3,
“PCR.”). Conduct the data analysis as described in Appendix B,
“Demonstrating Performance with Control RNA.”
1-6 Introduction
Designing TaqMan Human Cytokine Card Experiments
About the
Comparative CT
Method of Relative
Quantification
Relative gene expression values can be obtained from ABI PRISM 7700
run data using the Comparative CT Method for relative quantification. In
the Comparative CT Method, quantity is expressed relative to a
calibrator sample that is used as the basis for comparative results.
Therefore, the calibrator is the 1X sample and all other quantities are
expressed as an n-fold difference relative to the calibrator.
For more information on the Comparative CT Method of Relative
Quantification, see the following publications:
♦ ABI PRISM 7700 Sequence Detection System User Bulletin #2:
Relative Quantitation of Gene Expression
♦ ABI PRISM 7700 Relative Quantification Software User’s Manual
Significance of the All TaqMan Human Cytokine Card relative quantification experiments
Calibrator Sample require data from a calibrator sample. During analysis, the ABI PRISM
7700 Relative Quantification Software calculates the levels of cytokine
gene expression in samples relative to the level of expression in the
calibrator. Thus, the calibrator sample is an integral part of the relative
quantification calculation because it serves as the basis for the
comparative results.
Examples of possible calibrator samples include:
♦ A zero timepoint sample in a timecourse experiment
♦ An untreated sample (versus treated samples)
♦ A resting sample (versus activated samples)
Note For more information on the use of a calibrator sample in relative
quantification, see ABI PRISM 7700 Sequence Detection System User
Bulletin #2: Relative Quantitation of Gene Expression.
Introduction 1-7
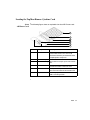
Design Guidelines Observe the following guidelines when designing TaqMan Human
Cytokine Card experiments:
♦ Load each card with sample-specific PCR reaction mix (cDNA
sample + TaqMan® Universal PCR Master Mix + 20X 18S Primer and
Probe Mix) made from a single sample.
Individual cards are not designed to evaluate multiple cDNA samples.
♦ Install the Sequence Detection Systems (SDS) Software
version 1.7.1 or later to all instruments devoted to running TaqMan
Human Cytokine Cards.
♦ Run TaqMan Human Cytokine Cards within 30 minutes of loading
them with sample-specific PCR reaction mix.
To ensure the highest degree of reproducibility, Applied Biosystems
recommends scheduling card runs so that each card is run within
30 minutes of the time it is loaded. When a loaded card sits for an
extended period of time, the probes and primers within the wells of
the card begin to diffuse into the adjoining channels. This diffusion of
critical reagents can diminish the potential signal generated during
the PCR, and can therefore affect the results of the experiment.
♦ Run all TaqMan Human Cytokine Cards from the same comparative
experiment on the same ABI PRISM 7700 instrument.
Running all cards from the same experiment on one ABI PRISM 7700
instrument ensures a high degree of reproducibility and consistency.
♦ When analyzing results with the SDS software:
– Set FAM dye layer threshold values identically for all cards in the
same comparative experiment.
– Set VIC dye layer threshold values identically for all cards in the
same comparative experiment.
To compare the data from different card runs, the threshold values for
each card must match exactly. The ABI PRISM 7700 Relative
Quantification Software cannot analyze data from card runs that have
different threshold values within the respective dye layers.
1-8 Introduction
Preventing Contamination
Contamination PCR using the 5´ nuclease assay requires special laboratory practices
and the to avoid false positive amplifications (Kwok and Higuchi, 1989). The
5´ Nuclease Assay assay’s high-throughput, repetitive nature can potentially amplify a
single DNA molecule (Saiki et al., 1985; Mullis and Faloona, 1987).
Using AmpErase® uracil-N-glycosylase (UNG) is a pure, nuclease-free,
AmpErase UNG 26-kDa recombinant enzyme encoded by the Escherichia coli
uracil-N-glycosylase gene. The gene was inserted into an E. coli host to
direct expression of the native form of the enzyme (Kwok and Higuchi,
1989).
UNG acts on single- and double-stranded dU-containing DNA by
hydrolyzing uracil-glycosidic bonds at dU-containing DNA sites. The
enzyme causes the release of uracil, thereby creating an
alkali-sensitive apyrimidic site in the DNA. The enzyme has no activity
on RNA or dT-containing DNA (Longo et al., 1990).
General PCR Please follow these recommended procedures:
Practices ♦ Wear a clean lab coat (not previously worn while handling amplified
PCR products or used during sample preparation) and clean gloves
when preparing samples for PCR amplification.
♦ Change gloves whenever you suspect that they are contaminated.
♦ Maintain separate areas, dedicated equipment, and supplies for:
– Sample preparation
– PCR setup
– PCR amplification
– Analysis of PCR products
♦ Never bring amplified PCR products into the PCR setup area.
♦ Open and close all sample tubes carefully. Try not to splash or spray
PCR samples.
♦ Keep reactions and components capped as much as possible.
♦ Use positive-displacement pipets or aerosol-resistant pipet tips.
♦ Clean lab benches and equipment with 10% bleach solution.
Introduction 1-9
Materials and Equipment
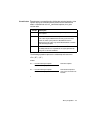
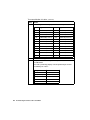
TaqMan Card The TaqMan® Human Cytokine Card Upgrade Package and
Upgrade Package components are available as follows:
and Components
Components
Part Number
TaqMan Card Upgrade
Packagea
4311899
ABI
PRISM®
7700 Relative Quantification Software
ABI
PRISM®
Card Adaptor
4313010
—
ABI PRISM® Card Filling Station
—
TaqMan Human Control Total RNA (50 ng/1 µL)
TaqMan®
Human Cytokine Cards (10 cards)
TaqMan®
Human Cytokine Card Protocol
4307281
4330448
4307577
TaqMan® Universal PCR Master Mixb
4304437
Vacuum tubing and gauge
—
a. Includes all the components listed above and a service installation visit.
b. The TaqMan Universal PCR Master Mix is 2X in concentration and contains sufficient
reagent to perform 33 cards (150 µL each). The mix is optimized for TaqMan reactions and
contains AmpliTaq Gold DNA Polymerase, AmpErase UNG, dNTPs with dUTP, Passive
Reference, and optimized buffer components.
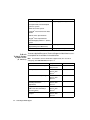
Storage Guidelines The table below lists the storage conditions for the kit materials.
Component
Storage Conditions
TaqMan Human Cytokine Cards
2–8 °C, dark
20X 18S Primer and Probe Mix
–15 to –25 °C
TaqMan Universal PCR Master Mix
2–8 °C, dark
TaqMan Human Control Total RNA
–15 to –25 °C
TaqMan Human Control cDNA
–15 to –25 °C
IMPORTANT Do not remove TaqMan Human Cytokine Cards from the
packaging until ready to load them with reaction mix. Excessive exposure to
light can damage the probes.
1-10 Introduction
Ordering Applied To order additional kits and reagents, please contact Applied
Biosystems Kits Biosystems at one of the regional sales offices listed on the back of this
and Reagents protocol. Have the part number of the kit or reagent of interest available
when ordering.
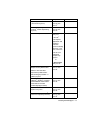
Reagents and In addition to the reagents supplied in the TaqMan Human Cytokine
Equipment Not Card Upgrade Package, other items are required for this protocol.
Included Unless otherwise noted, many of the instruments and materials listed
below are available from major laboratory suppliers (MLS).
User-Supplied Instruments
Instruments
ABI
PRISM®
7700 Sequence Detection System
Source
Applied Biosystemsa
Microcentrifuge
MLS
Welch® DUOSEAL Series Two-Stage, Belt-Drive
Vacuum Pumpb
VWR Catalog
(P/N 54973-075)
Vacuum Trap, Kontes®
VWR Catalog
(P/N KT926300-0021)
a. Contact your local Applied Biosystems Sales Office for the instrument best suited to your
needs. See the back cover of this protocol for office locations.
b. Substitute vacuum pumps must be oil-based and capable of pulling a minimum vacuum
of 2.5x10⁻³ Torr (600 microns).
User-Supplied Materials
Materials
MicroAmp ®
Source
Reaction Tubes with Caps, 0.2-mL
Applied Biosystems
(P/N N801-0612)
Gloves, disposable, powder-free
MLS
Microcentrifuge tubes, sterile 1.5-mL
MLS
Pipettors, positive-displacement or
air-displacement
MLS
Pipette tips, aerosol resistant
MLS
Polypropylene tubes
MLS
Water, RNase-free, distilled, deionized
MLS
Introduction 1-11
Safety
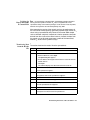
Documentation Five user attention words appear in the text of all Applied Biosystems
User Attention user documentation. Each word implies a particular level of observation
Words or action as described below.
Note
Calls attention to useful information.
IMPORTANT Indicates information that is necessary for proper instrument
operation.
! CAUTION Indicates a potentially hazardous situation which, if not avoided,
may result in minor or moderate injury. It may also be used to alert against
unsafe practices.
! WARNING Indicates a potentially hazardous situation which, if not
avoided, could result in death or serious injury.
! DANGER Indicates an imminently hazardous situation which, if not
avoided, will result in death or serious injury. This signal word is to be limited to
the most extreme situations.
Chemical Hazard ! WARNING CHEMICAL HAZARD. Some of the chemicals used with
Warning Applied Biosystems instruments and protocols are potentially hazardous and
can cause injury, illness, or death.
1-12 Introduction
♦
Read and understand the material safety data sheets (MSDSs)
provided by the chemical manufacturer before you store, handle, or
work with any chemicals or hazardous materials.
♦
Minimize contact with chemicals. Wear appropriate personal
protective equipment when handling chemicals (e.g., safety
glasses, gloves, or protective clothing). For additional safety
guidelines, consult the MSDS.
♦
Minimize the inhalation of chemicals. Do not leave chemical
containers open. Use only with adequate ventilation (e.g., fume
hood). For additional safety guidelines, consult the MSDS.
♦
Check regularly for chemical leaks or spills. If a leak or spill occurs,
follow the manufacturer’s cleanup procedures as recommended on
the MSDS.
♦
Comply with all local, state/provincial, or national laws and
regulations related to chemical storage, handling, and disposal.
Site Preparation A site preparation and safety guide is a separate document sent to all
and Safety Guide customers who have purchased an Applied Biosystems instrument.
Refer to the guide written for your instrument for information on site
preparation, instrument safety, chemical safety, and waste profiles.
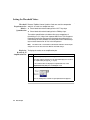
Ordering MSDSs You can order free additional copies of MSDSs for chemicals
manufactured or distributed by Applied Biosystems using the contact
information below..
To order documents by automated telephone service:
1
From the U.S. or Canada, dial 1.800.487.6809, or from outside the
U.S. and Canada, dial 1.858.712.0317.
2
Follow the voice instructions to order documents (for delivery by fax).
Note
There is a limit of five documents per fax request.
To order documents by telephone:
In the U.S.
Dial 1.800.345.5224, and press 1.
♦ To order in English, dial 1.800.668.6913 and press 1,
then 2, then 1
In Canada
♦ To order in French, dial 1.800.668.6913 and press 2,
then 2, then 1
From any
other country
See the specific region under “To Contact Technical
Support by Telephone or Fax (Outside North America)” .
To view, download, or order documents through the Applied Biosystems
web site:
Step
Action
1
Go to http://www.appliedbiosystems.com
2
Click SERVICES & SUPPORT at the top of the page, click
Documents on Demand, then click MSDS.
3
Click MSDS Index, search through the list for the chemical of
interest to you, then click on the MSDS document number for that
chemical to open a pdf of the MSDS.
For chemicals not manufactured or distributed by Applied Biosystems,
call the chemical manufacturer.
Introduction 1-13
Reverse Transcription 2
2
Overview Synthesis of cDNA from total RNA samples is the first step in the
two-step RT-PCR cytokine gene expression quantification experiment.
In this step, random hexamers from the TaqMan® Reverse Transcription
Reagents prime total RNA samples for reverse transcription using
MultiScribe™ Reverse Transcriptase.
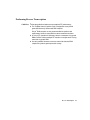
Where You Are in
the Procedure
You
Are Here
Reverse Transcription
(cDNA generation)
PCR
(ABI Prism 7700 Card Run)
Data Analysis
Performed using the Sequence
Detection Systems Software
Reverse Transcription
(cDNA generation)
a. Prepare the reverse
transcription reaction mix
b. Dilute total RNA samples
c. Aliquot the reaction mix to
each dilute total RNA
sample
d. Load the samples onto a
thermal cycler and
program it with the RT
conditions
e. Begin reverse
transcription thermal
cycling
Interpreting Results
Performed using the ABI PRISM
7700 Relative Quantification
Reverse Transcription 2-1
Preparing the RNA Template
Recommended Use only human total RNA samples to generate cDNA for the TaqMan®
Template Human Cytokine Card.
The following table lists the known template incompatibilities:
Template
Poly
A+
Non-human
Explanation
The 18S rRNA endogenous control assay cannot accurately
evaluate cDNA generated from poly A+ RNA samples
because most of the rRNA has been removed from them.
Except for 18S rRNA, all assays on the TaqMan Human
Cytokine Card are human-specific.
Template Quality The quality of your results is directly related to the purity of your RNA
template. Therefore, use only well-purified samples with the TaqMan
Human Cytokine Card. Because ribonuclease and genomic DNA
contamination are common problems in gene expression studies, purify
your samples accordingly to ensure the best results.
Note TaqMan Human Cytokine assays have been experimentally proven not
to detect up to 10,000 copies of contaminating genomic DNA per card.
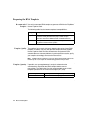
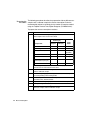
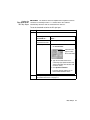
Template Quantity If possible, use spectrophotometric analysis to determine the
concentrations of purified total RNA samples before reverse
transcription. The table below lists the recommended range of initial
template quantities for the reverse transcription (RT) step.
Initial Template
Human Total RNA
2-2 Reverse Transcription
Quantity of total RNA (per 100-µL RT reaction)
60 ng–2 µg
Performing Reverse Transcription
Guidelines Follow the guidelines below to ensure optimal RT performance:
♦ The TaqMan Human Cytokine Card is designed to assay cDNA
generated from only human total RNA samples.
Poly A+ RNA samples are not recommended for cytokine card
experiments, because most rRNA has been removed from them.
♦ A 100-µL RT reaction will efficiently convert a maximum of 2 µg total
RNA to cDNA. Perform multiple RT reactions in multiple wells if using
more than 2 µg total RNA.
♦ Use only random hexamers to reverse transcribe the total RNA
samples for cytokine gene expression assays.
Reverse Transcription 2-3
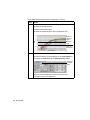
Preparing the The following procedure describes the preparation of three different test
Reactions samples and a calibrator sample for reverse transcription. Scale the
recommended volumes accordingly for the number of samples needed
using the TaqMan Reverse Transcription Reagents (P/N N808-0234).
To prepare the reverse transcription reactions:
Step
1
Action
In a 1.5-mL microcentrifuge tube, prepare a reaction mix for all total
RNA samples to be reverse transcribed.
Volume (µL)a
Per
Sample
Reaction
Mix (x4)
Final
Value
10X RT Buffer
10.0
40.0
1X
25 mM MgCl2
22.0
88.0
5.5 mM
deoxyNTPs Mixture
20.0
80.0
500 µM
per dNTP
Random Hexamers
5.0
20.0
2.5 µM
RNase Inhibitor
2.0
8.0
0.4 U/µL
MultiScribe Reverse
Transcriptase (50 U/µL)
6.25
25.0
3.125 U/µL
Total
65.25
261.0
—
Component
a. If changing the reaction volume, make sure the final proportions are
consistent with the recommended values above.
2-4 Reverse Transcription
2
Label four 1.5-mL microcentrifuge tubes for the three test samples
and the calibrator sample.
3
Transfer 60 ng–2 µg (up to 34.75 µL) of each total RNA sample to
the corresponding microcentrifuge tube.
4
If necessary, dilute each total RNA sample to a volume of 34.75 µL
with RNase-free, deionized water.
5
Cap the tubes and gently tap each to mix the diluted samples.
6
Briefly centrifuge the tubes to eliminate air bubbles in the mixture.
7
Label four 0.2-mL MicroAmp ® Reaction Tubes for the three total
RNA test samples and the calibrator sample.
To prepare the reverse transcription reactions:
Step
(continued)
Action
8
Pipet 65.25 µL of the reaction mix (from step 1) to each MicroAmp
Reaction Tube (from step 7).
9
Transfer 34.75 µL of each dilute total RNA sample to the
corresponding MicroAmp Reaction Tube.
10
Cap the reaction tubes and gently tap each to mix the reactions.
11
Briefly centrifuge the tubes to force the solution to the bottom and to
eliminate air bubbles from the mixture.
Reverse Transcription 2-5
Thermal Cycling To conduct reverse transcription thermal cycling:
Step
Action
1
Load the reactions into a thermal cycler.
2
Program your thermal cycler with the following conditions:
Hexamer
Incubationa
Reverse
Transcription
Reverse
Transcriptase
Inactivation
HOLD
HOLD
HOLD
Temp.
25 °C
37 °C
95 °C
Time
10 min
60 min
5 min
Step
Volume
100 µL
a. When using random hexamers for first-strand cDNA synthesis, a primer
incubation step (25 °C for 10 min) is necessary to maximize primer-RNA
template binding.
3
Begin reverse transcription.
IMPORTANT After thermal cycling, store all cDNA samples at
–15 to –25 °C and proceed to Chapter 3, “PCR.”
2-6 Reverse Transcription
PCR
3
3
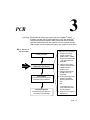
Overview Amplification of cDNA is the second step in the TaqMan ® Human
Cytokine Card two-step RT-PCR experiment. In this step, AmpliTaq ®
Gold DNA polymerase amplifies cDNA synthesized from the original
total RNA sample. Because each cytokine card can evaluate only one
cDNA sample, you must repeat this step for each sample in the analysis.
Where You Are in
the Procedure
Reverse Transcription
(cDNA generation)
You
Are Here
PCR
(ABI Prism 7700 Card run)
PCR
(ABI Prism 7700 Card Run)
a. Prepare PCR samplespecific reaction mix
(cDNA sample + TaqMan
Universal PCR Master Mix
+ 20X 18S Primer and
Probe Mix).
b. Load the PCR samplespecific reaction mix into
a TaqMan Human
Cytokine Card.
c. Load the filled card into
the ABI PRISM 7700
Instrument.
Data Analysis
Performed using the Sequence
Detection Systems Software
d. Create a plate document
template for TaqMan
Human Cytokine Card
runs.
OR
Interpreting Results
Performed using the ABI Prism
7700 Relative Quantification
If a template file exists,
create a plate document
from the template.
e. Begin the PCR sequence
detection run.
PCR 3-1
Before Conducting the PCR
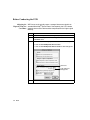
Adjusting the ABI PRISM ® cards typically return a stronger fluorescent signal than
Exposure Time for standard MicroAmp® Optical Plates. Consequently, the CCD camera
Card Runs exposure time must be decreased to compensate for the higher signal
intensity.
Step
Action
1
Launch the Sequence Detection Systems (SDS) software.
2
Select Advanced options from the Diagnostics submenu off of the
Instrument menu.
3
From the Miscellaneous group box, activate the manual setting:
a. Click the Set 7700 Exposure Time checkbox.
b. Click the Set 7700 Exposure Time for Cards text field and type 10.
Click here
Then click here
and type 10
4
3-2 PCR
Click OK.
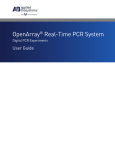
About the ABI PRISM Filling Station
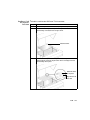
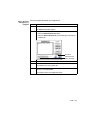
Description Samples are loaded individually into TaqMan Human Cytokine Cards
for PCR thermal cycling using a specialized tool called the ABI PRISM®
Card Filling Station. The Filling Station coordinates loading by first
exposing the channels of the reaction card to a vacuum and then
opening the evacuated card to a sample-specific PCR reaction mix.
1
2
3
4
Number
Component
Description
1
Vacuum
Attachment
The attachment for connecting the Filling
Station to a vacuum pump.
2
Sealing Screw
3
Actuator Screws
IMPORTANT Do not adjust. The Filling
Station screws are extremely sensitive.
4
Actuator
The switch for exposing the card to the PCR
sample or the vacuum.
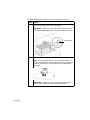
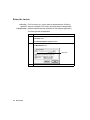
Laboratory Setup The ABI PRISM Filling Station operates in combination with a vacuum
pump, a vacuum trap, and a gauge. The figures below illustrate the
arrangement of the equipment as seen in the laboratory.
PCR 3-3
Sample Preparation
Guidelines Follow the guidelines below to ensure optimal PCR performance:
♦ Load each TaqMan Human Cytokine Card with sample-specific PCR
reaction mix made with a single cDNA sample.
Cytokine cards are not designed to evaluate multiple cDNA samples
simultaneously.
♦ Run each TaqMan Human Cytokine Card within 30 minutes of
loading it.
When loaded cards sit, the TaqMan® probes and primers within the
wells of the card begin to diffuse into the adjoining channels. The
diffusion of critical reagents diminishes the potential signal that can
be generated during PCR and can therefore affect the results of the
experiment.
♦ Run all TaqMan Human Cytokine Cards for a single experiment on
the same ABI PRISM 7700 instrument.
Running all cards on the same instrument ensures a high degree of
reproducibility and consistency in the resulting data.
♦ Load 300 µL of sample-specific PCR reaction mix per card to ensure
adequate filling.
Smaller volumes may result in insufficiently filled cards.
♦ Do not attempt to refill partially-filled cards.
Upon contact, the sample-specific PCR reaction mix resuspends the
dried TaqMan probes and primers within the wells of the card. When
the partially-filled card is evacuated, these reagents are carried away
with the solution.
3-4 PCR
Recommended The following table lists the recommended range of human total RNA
Quantity converted to cDNA for the PCR.
Sample Quantity per Card
(300-µL sample-specific reaction mix)a
Sample
Total RNA converted to cDNA
60 ng–2 µg
a. 300 µL sample-specific PCR reaction mix = (150 µL cDNA sample + 20X 18S Primer
and Probe Mix + H20)(150 µL TaqMan® Universal PCR Master Mix)
Preparing a IMPORTANT Load only one sample-specific PCR reaction mix (cDNA sample
Sample-Specific + 20X 18S Primer and Probe Mix + TaqMan Universal PCR Master Mix) per
PCR Reaction Mix TaqMan Human Cytokine Card. Applied Biosystems recommends running your
calibrator sample first.
Note
This procedure is optimized for TaqMan PCR Universal Master Mix.
To prepare a sample-specific PCR reaction mix:
Step
Action
1
Label a 1.5-mL microcentrifuge tube.
2
Retrieve a cDNA sample from the freezer (see step 3 on page 2–6).
If frozen, thaw the sample by rolling it between your fingers.
3
Transfer the recommended quantity of cDNA sample (up to 150 µL
– endogenous control) to the labeled microcentrifuge tube.
IMPORTANT To avoid cross contamination of the reverse
transcription products, slowly and carefully remove the cap from the
thermal cycling tube.
4
Dilute the sample to 120 µL with RNase-free, deionized water.
5
Add 150 µL of TaqMan PCR Universal Master Mix (2X) to the
microcentrifuge tube containing the dilute cDNA sample.
! CAUTION CHEMICAL HAZARD. TaqMan Universal PCR
Master Mix may cause eye and skin irritation. It may cause
discomfort if swallowed or inhaled. Please read the MSDS, and
follow the handling instructions. Wear appropriate protective
eyewear, clothing, and gloves.
6
Add 30 µL of 20X 18S Primer and Probe Mix.
7
Cap the microcentrifuge tube and mix the solution by gentle
inversion.
8
Centrifuge the tube to eliminate air bubbles from the mixture.
PCR 3-5
To prepare a sample-specific PCR reaction mix:
Step
9
3-6 PCR
(continued)
Action
Place the sample-specific PCR reaction mix on ice and prepare a
TaqMan Human Cytokine Card as described on page 3-9.
Loading the TaqMan Human Cytokine Card
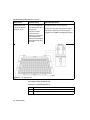
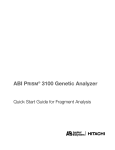
About The following figure shows an exploded view of an ABI PRISM ® card:
ABI PRISM Cards
1
2
3
4
5
6
Number
Component
Description
1
Reaction card
Acts as the vessel for the PCR. The
consumable consists of a series of 96
interconnected wells pre-loaded with dried
TaqMan probes and primers.
2
Adhesive flap
3
Adhesive backing
Used to seal the reaction card after it has
been filled with sample-specific PCR reaction
mix
4
Fill reservoir
A reservoir for the sample-specific PCR
reaction mix before it enters the card
5
Fill consumable
A disposable component that channels fluid
from the fill reservoir into the reaction card
6
Alignment holes
Aid in aligning the card within the
ABI PRISM Filling Station
PCR 3-7
Guidelines for Follow the guidelines below to ensure proper loading of the card.
Loading Cards ♦ Allow a card to adjust to room temperature before loading it.
Low temperatures will prevent efficient fluid transfer through the
microchannels of the fill consumable.
♦ Do not remove a card from its packaging until you are ready to load it
with sample-specific PCR reaction mix.
Excessive exposure to light damages the fluorescent probes.
♦ Do not twist or bend the soft fill consumable.
The seal between the reaction card and the fill consumable is crucial
to the loading procedure. If broken, the seal may leak and result in an
inadequately filled card.
♦ Use caution when opening and closing the ABI PRISM Filling Station.
The station lid is not designed to remain in an open position.
! WARNING PHYSICAL HAZARD. If left open, the ABI PRISM Filling
Station lid may unpredictably close and cause an injury.
3-8 PCR
Preparing a Card
! WARNING PHYSICAL HAZARD. If left open, the ABI PRISM Filling
Station lid may unpredictably close and cause an injury. The lid is not
designed to remain in an open position.
To prepare the TaqMan Human Cytokine Card for loading:
Step
Action
1
Carefully remove a TaqMan Human Cytokine Card from its
packaging.
2
Fold the adhesive flap attached to the card back, in order to
accommodate the fill consumable.
Adhesive
flap
3
Attach a fill consumable to the card.
a. Remove the white adhesive backing from the fill consumable.
b. Align the protruding aperture and two pins on the edge of the fill
consumable to the holes in the card (see below).
c. Once aligned, press gently on across both sides to secure the fill
consumable in place.
Aperture
PCR 3-9
To prepare the TaqMan Human Cytokine Card for loading:
Step
4
(continued)
Action
Carefully load the card into the ABI PRISM Card Filling Station.
a. Orient the card so that the pins on the station align with the holes
in the soft fill consumable as indicated in the figure below.
b. Once the pins are correctly aligned, press down firmly on the top
of the fill consumable to ensure a good fit.
IMPORTANT Do not press down on the junction between the fill
consumable and cytokine card.
IMPORTANT The adhesive flap must be folded away from the fill
consumable for proper operation of the Filling Station.
The following illustration demonstrates the correct technique for
loading a card into the Filling Station.
Fold the adhesive flap
away from the fill
consumable
Fit the card’s fill
consumable alignment
holes to the pins in the
Filling Station
3-10 PCR
To prepare the TaqMan Human Cytokine Card for loading:
Step
5
(continued)
Action
Close the ABI PRISM Card Filling Station lid.
IMPORTANT Press firmly on the top of the ABI PRISM Card Filling
Station to ensure that it is completely closed.
6
If necessary, connect the vacuum hose to the attachment on the
ABI PRISM Filling Station lid. The end of the vacuum hose contains a
quick-release valve that “clicks” when locked into place.
Note Leave the vacuum hose attached to the lid at all times
except during maintenance or transportation of the station.
Vacuum hose
quick-release valve
Vacuum
attachment
7
Turn on the vacuum pump.
Allow the vacuum pump to evacuate the card until the gauge on the
hose stabilizes at or less than 600 microns.
IMPORTANT Do not fill the card at a vacuum greater than
600 microns. Above that reading, the vacuum is not strong enough
to adequately fill the card and may result in the loss of both the
cDNA sample and the card. Do not attempt to refill partially filled
cards.
PCR 3-11
Loading and To fill and seal the card for thermal cycling:
Sealing a Card
Step
1
Action
After the vacuum reaches 600 microns, pipet 300 µL of the
sample-specific PCR reaction mix (cDNA sample + TaqMan
Universal PCR Master Mix + 20X 18S Primer and Probe Mix) from
page 3-5 into the fill reservoir of the Filling Station. Use the pipet tip
to dislodge any bubbles that appear at the bottom of the fill
reservoir.
Fill reservoir
2
In one motion, firmly pull the Filling Station actuator to its maximum
extension.
Note Pulling the actuator may be fairly difficult and require some
physical strength.
The TaqMan Human Cytokine Card fills with sample-specific PCR
reaction mix.
IMPORTANT Do not attempt to force the actuator back into the
closed position. It retracts automatically when the lid is opened.
3
Complete the following as quickly as possible:
a. Turn off the vacuum pump.
b. Open the Filling Station lid.
! WARNING PHYSICAL HAZARD. If left open, the ABI PRISM
Filling Station lid may unpredictably close and cause an injury.
The lid is not designed to remain in an open position.
4
3-12 PCR
Remove the card from the Filling Station.
To fill and seal the card for thermal cycling:
Step
5
(continued)
Action
Detach and discard the fill consumable, then remove any adhesive
remaining on the surface of the card.
IMPORTANT Remove all of the adhesive from the card. The
adhesive may interfere with the card seal and allow the
sample-specific PCR reaction mix to leak during thermal cycling.
6
Bend back the adhesive flap, and peel off the plastic backing.
7
Fold the adhesive flap over the front edge of the card and press
firmly on the flap to ensure an adequate seal.
The card is now filled and ready to be loaded into the
ABI PRISM 7700 Sequence Detection System.
PCR 3-13
Loading a Card into an ABI PRISM 7700 Sequence Detection System
About the The unique design of the TaqMan Human Cytokine Card requires the
ABI PRISM Card use of an ABI PRISM Card Adaptor for use on the ABI PRISM® 7700
Adaptor Design Sequence Detection Systems (SDS) instrument. The card adaptor is a
specialized device that ensures adequate heat transfer and fluorescent
data collection occur during the PCR.
The following figure illustrates the components of the adaptor:
Lens plate
Reaction card
Reflective plate
3-14 PCR
Component
Description
Lens plate
Houses 96 lenses that direct the focal point of the argon
ion laser into the wells of the reaction card. The top of the
lens plate contains a label to indicate the correct
orientation of the plate.
Reaction card
Contains a cDNA sample and the necessary reagents for
the PCR.
Reflective plate
An aluminum plate that ensures efficient conduction and
uniform heat transfer to all wells of the reaction card. The
plate contains a notched corner to aid in correctly
orienting the card for thermal cycling.
Loading a Card To load the card into the ABI PRISM 7700 Instrument:
for Sequence
Step
Action
Detection
1
Slide the sample block cover back, exposing the sample block.
2
Place the reflective plate on top of the sample block so that the
notched edge is located in the far right corner.
Notched corner
3
Place the filled TaqMan Human Cytokine Card on top of the
reflective plate so that the keyed corner of the card aligns with the
notched edge of the plate.
Notched corner
of the plate
Keyed corner of
the card
PCR 3-15
To load the card into the ABI PRISM 7700 Instrument:
Step
4
(continued)
Action
Place the lens plate on top of the card so that the holes in the plate
fit over the alignment pins on the sample block.
IMPORTANT Make sure that the lens plate is oriented so that the
face with the This Side Up label is visible when the plate is in place.
Alignment pin
5
Slide the cover over the sample block and tighten the lid.
Note Because the dimensions of the card sandwich differ from
those of a standard plate, the white alignment line on the tightening
knob may not turn to the same position as with a standard plate
when tight.
IMPORTANT Tighten the cover as much as possible to ensure
that the card is adequately sealed and uniformly heated.
3-16 PCR
Running TaqMan Human Cytokine Cards
About SDS Plate Every TaqMan Human Cytokine Card run on the ABI PRISM 7700
Documents Sequence Detection System requires the creation of a card-specific
plate document within the instrument software. The 7700 instrument
uses the plate document to organize and store the fluorescence data
gathered during the PCR.
Plate documents contain the following information:
♦ Dye layer setup
♦ Target/sample configurations
♦ Thermal cycling parameters
♦ Data collection parameters
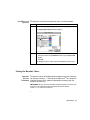
Using a Template A template file alleviates the need for repetitious construction of
TaqMan Human Cytokine Card plate documents. Template files are
identical to plate document files except that they do not contain
fluorescence data from a sequence detection systems run. Once
created, an unlimited number of identical SDS plate documents can be
created from the template. Because comparative analysis involves
multiple runs and SDS plate documents for cards are identical, it is
more efficient to create and use a template file than to create a plate
document for each card run.
PCR 3-17
Setting the To configure the PCR thermal profile for the reverse transcription:
Thermal Cycling
Step
Action
Parameters
1
Launch the Sequence Detection Systems software.
Note If a plate document automatically appears on your screen,
select Close from the File menu to close it.
2
From the File menu, select New "–N.
3
Configure a new plate document with the following attributes.
From menu…
Select…
Plate Type
Single Reporter
Plate Format
The Card
Run
Real Time
Note TaqMan Human Cytokine Cards can only be used with SDS
software version 1.7.1 or later. If the options above do not appear in
the New Plate dialog box, update your instrument software.
4
Click the Thermal Cycler Conditions button.
5
Configure the thermal cycling profile with the following conditions:
Stage
Description
1
2
3
UNG
Activationa
AmpliTaq Gold
Activationb
PCR
HOLD
HOLD
CYCLE (35 cycles)
Denature
Anneal/
Extend
Temperature
50 °C
99 °Cc
99 °Cc
60 °C
Time
2 min
10 min
15 sec
1 min
a. Required for optimal AmpErase UNG enzyme activity.
b. Required for AmpliTaq Gold DNA Polymerase activation.
c. A setting of 99 °C is necessary for this step because of the ABI PRISM card’s unique
thermokinetic properties.
6
3-18 PCR
Click the Sample Volume text field and type 100 µL.
Configuring the Note If the “TARG - RelQ Target” or the “ENDO - RelQ Endogenous Control”
Dye Layers do not appear in the Sample Type pop-up menus, configure the sample types
as explained on page 6-11.
To configure the FAM and VIC dye layers:
Step
Action
1
Select FAM from the Dye Layer pop-up menu.
2
Select all wells of the plate document.
3
Select TARG - RelQ Target from the Sample Type pop-up menu.
The SDS software labels all selected wells as TARG.
4
Select VIC from the Dye Layer pop-up menu.
5
Select all wells of the plate document.
6
Select ENDO – RelQ Endogenous Control from the Sample Type
pop-up menu.
7
Select cells A1–A4.
8
Click the Sample Name text field and type IL-1alpha.
PCR 3-19
To configure the FAM and VIC dye layers:
Step
9
(continued)
Action
Repeat steps step 7–8 for each target cytokine so that the plate
document mirrors the assay configuration of the TaqMan Human
Cytokine Card.
TaqMan Human Cytokine Card Assay Configuration
Plate Document Configuration
3-20 PCR
Saving the Plate To save the plate document as a template file:
Document as a
Step
Action
Template
1
Select Save As from the File menu.
The Save As dialog box appears.
2
Complete the following actions:
a. Click the Stationery Pad radio button.
b. Click the Save this document as text field and type a name for the
template file.
Click here
Click here and
type a file name
3
Select a location for the software to place the template file.
4
Click OK.
The software saves the template file.
5
Select Close from the File menu. When prompted to save the
document, select Don’t Save.
The software closes the template document.
PCR 3-21
Running the Card To run the card using the template file:
Step
Action
1
Select Open from the File menu.
2
Using the browser, select the Cytokine Card Template file.
3
Click Open.
The SDS software creates a plate document with attributes
identical to that of the template file.
4
Click the Show Analysis button to toggle to the Analysis View.
5
Click Run to begin thermal cycling.
Note If a card is run immediately after a plate, the instrument may
pause momentarily before ramping. The unique thermokinetic
properties of the TaqMan Human Cytokine Card require that the
instrument cool the heated cover to 65 °C before initiating thermal
cycling.
When the first card run is complete; prepare, load, and run the next
sample-specific PCR reaction mix in the comparative experiment.
Repeat the PCR step for each of the remaining cDNA samples and
then proceed to Chapter 4, “Data Analysis.”
3-22 PCR
Data Analysis
4
4
Overview Before calculating relative quantification values from the results of the
card run, the raw data must be analyzed and exported to a results file.
The analysis procedure consists of setting threshold values for the
FAM and VIC™ dye layers and eliminating outlying amplification.
Where You Are in
the Procedure
Reverse Transcription
(cDNA generation)
PCR
(ABI Prism 7700 Card Run)
You
Are Here
Data Analysis
Performed using the Sequence
Detection Systems Software
Data Analysis
Performed using the
Sequence Detection
Systems Software
a. Activate Spectral
Compensation
b. Analyze the run data
c. Set Threshold Value for
the VIC Dye Layer
d. Set Threshold Value for
the FAM Dye Layer
Interpreting Results
Performed using the ABI Prism
7700 Relative Quantification
e. Eliminate outlying
amplification
f. Export the analyzed data
for relative quantification
Data Analysis 4-1
Before the Analysis
Activating For all real-time runs, set the spectral compensation to ON during
Spectral analysis of multiplex PCR assays. Activating spectral compensation
Compensation provides improved spectral resolution for multi-reporter applications.
To activate spectral compensation:
Step
1
Action
Select Advanced Options from the Diagnostics submenu off of the
Instrument menu.
The Advanced Options dialog box opens.
2
Click the Use Spectral Compensation for Real Time check box from
the Miscellaneous box.
Click here
3
4-2 Data Analysis
Click OK.
Non-Fluorescent To setup for a non-fluorescent quencher at the 3′ end of the probe:
Quencher
Step
1
Action
From the Sample Type pop-up menu, select Sample Type Setup
The Sample Type Setup dialog box appears.
2
Complete the Sample Type Setup dialog box:
a. Uncheck the box next to Quencher, when using TaqMan® MGB
probes.
b. Click OK.
The dialog box closes, and the plate read window becomes active.
Setting the Baseline Values
Automatic The baseline values for TaqMan® Human Cytokine Card runs cannot be
Baseline set manually. Version 1.7.1 and later of the ABI PRISM® 7700 Sequence
Calculation Detection System (SDS) software automatically calculates and sets
baselines for card runs.
IMPORTANT You must still set the baseline manually for plates run on the 7700
instrument. The automatic baseline calling feature of SDS software
version 1.7.1 is exclusive to card runs.
Data Analysis 4-3
Setting the Threshold Values
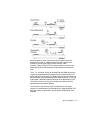
Threshold Because TaqMan Human Cytokine Cards are used for comparative
Requirements for analysis, all cards in a comparison must:
Relative ♦ Share identical threshold settings for the VIC™ dye layer
Quantification
♦
Share identical threshold settings for the FAM dye layer
The relative quantification calculation relies on a comparison of
threshold cycle (CT) values from separate ABI PRISM 7700 Sequence
Detection System runs. Because the threshold value affects the CTs
calculated by the SDS software, the setting within each individual dye
layer must be identical for all files in the comparison.
Note The ABI PRISM® 7700 Relative Quantification Software will not import
multiple SDS results files that have different threshold settings.
Displaying To display the results on an amplification plot:
Results on an
Step
Action
Amplification Plot
1
Select Analyze ("-L) from the Analysis menu.
The SDS software analyzes the raw data and displays the results in
an amplification plot (log ∆Rn vs. Cycle).
If the software does not display the Amplification Plot, select
Amplification Plot ("-G) from the Analysis menu.
2
Select VIC from the Reporter pop-up menu.
The VIC Endogenous Control Assay Amplification Plot appears.
4-4 Data Analysis
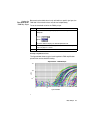
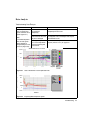
Threshold Value Before exporting the data for relative quantification, the threshold value
Basics of each TaqMan Human Cytokine Card run must be adjusted for
quantification. For any analysis of TaqMan Human Cytokine Cards,
accurate quantification depends on the uniformity of the threshold
values. If the threshold values are not adjusted properly or if they differ
between cards in a comparative experiment, the resulting data will be
invalid for relative quantification.
The threshold value must be determined once for each relative
quantification experiment, typically with the results from the first card
run. Subsequent runs within the same experiment must use the value
determined from the calibrator card. Occasionally, the threshold value
for an analysis group must be readjusted to compensate for a later run.
In those cases, the readjustment is made to the outlying card and then
applied to the others.
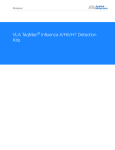
The threshold value of the calibrator card run can be determined by
viewing the amplification plots for the card using the SDS software. The
figure below shows a typical semi-logarithmic VIC amplification plot with
the correct threshold setting.
Product
amplification
Amplification – VIC Example
∆Rn
101
100
Plateau phase
10-1
Exponential
phase
Threshold
10-2
Background
10-3
0
10
20
30
35
Cycle Number
Guidelines for setting the threshold value are explained on the following
page.
Data Analysis 4-5
Guidelines for To set the threshold correctly:
Setting Thresholds ♦ Set the threshold value within the exponential phase of the
semi-logarithmic scale amplification plot.
The exponential phase occurs within the range of data points that
increase linearly when graphed on a semi-log plot.
♦
Set identical FAM thresholds for all cards in the same comparison.
The ABI PRISM 7700 Relative Quantification Software cannot
analyze data from card runs that have different FAM threshold
values.
♦
Set identical VIC thresholds for all cards in the same comparison.
The ABI PRISM 7700 Relative Quantification Software cannot
analyze data from card runs that have different VIC threshold
values.
4-6 Data Analysis
Setting the IMPORTANT The baseline values for TaqMan Human Cytokine Card runs
Threshold for the cannot be set manually. Version 1.7.1 and later of the SDS software
VIC Dye Layer automatically calculates and sets the baseline for card runs.
To set the threshold value for the VIC dye layer:
Step
1
Action
Select from the following:
If setting the
threshold for…
Then...
the first card in an
experimental series
follow steps 2–5 of this procedure.
all subsequent cards
a. Click the Use Threshold text field of
the Threshold box.
Click here and
type the value
for the threshold
b. Type the threshold value for the
current dye layer (determined in step
4 of this procedure from the first card
run in the series).
c. Click Update Calculations.
The SDS software updates the CT
and standard deviation values.
2
Identify the components of the amplification curve as shown in
“Threshold Value Basics” on page 4-5.
Data Analysis 4-7
To set the threshold value for the VIC dye layer:
Step
3
(continued)
Action
Click and drag the threshold line so that it is:
♦ Above the background noise
♦ Below the plateaued region
♦ Within the exponential phase of the amplification curve
∆Rn
Below the
plateaued
region
Within this
range
Above the
background
Cycle Number
4
Record the threshold value.
The software displays the threshold value in the Use Threshold text
field within the Threshold box of the Amplification Plot window.
Record the
threshold
value
Apply the same threshold value to the VIC dye layer of all
subsequent cards in the comparison.
4-8 Data Analysis
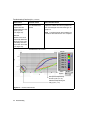
Setting the Because the threshold value is only valid within a specific dye layer, the
Threshold for the FAM and VIC threshold values must be set independently.
FAM Dye Layer To set the threshold value for the FAM dye layer
Step
Action
Select FAM from the Reporter pop-up menu in the Amplification Plot
dialog box.
1
The SDS software displays the FAM Amplification Plot.
2
Follow the procedure for “Setting the Threshold for the VIC Dye
Layer” on pages 4-7 to 4–8.
3
Click OK.
Example Amplification Curve
The figure below shows a typical semi-logarithmic FAM amplification
plot with the correct threshold setting.
Amplification – FAM Example
101
∆Rn
100
10-1
0
10
20
30
35
Cycle Number
Data Analysis 4-9
Eliminating Outlying Amplification
Overview For any PCR, experimental error may cause some wells to amplify
insufficiently or not at all. These wells typically produce CT values that
differ significantly from the average for the associated replicate wells. If
included in the relative quantification calculations, these outliers can
potentially result in erroneous relative gene expression measurements.
Modes of Outlier There are two methods for removing outlying data from the relative
Removal quantification calculation:
♦
Manual removal using the SDS software (optional)
♦
Manual removal using the Relative Quantification software
(recommended)
The following section explains the manual mode for removing outlying
data using the SDS software.
Note The latter method is explained in the ABI PRISM 7700 Relative
Quantification Software User’s Manual.
4-10 Data Analysis
Manual Removal of Outlying Data Using SDS (Optional)
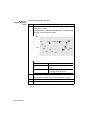
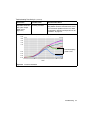
Visualizing To ensure precise relative quantification, replicate groups must be
Outliers carefully scrutinized for outlying wells. The CT vs. Well Position view of
the Amplification Plot allows you to examine each set of replicate wells
for outliers.
To visualize the replicate groups for outlying amplification:
Step
1
Action
From the Analysis menu, select Amplification Plot ("-G).
The SDS software displays the results of the sequence detection
run in an amplification plot of ∆Rn versus CT.
2
From the Viewer pull-down menu, select CT vs. Well position.
The SDS software displays results as a CT vs. Well position plot.
Threshold Cycle (CT)
40.0
35.0
30.0
25.0
20.0
15.0
0
3
10
20
30
40 50 60
Well Position
70
80
90 100
Select FAM from the Reporter pop-up menu.
The SDS software displays the FAM Well versus Threshold Cycle
display.
Data Analysis 4-11
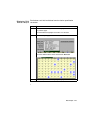
Identifying To identify outlying replicate wells:
Outlying Replicate
Wells Step Action
1
Verify the uniformity of each set of replicate wells by comparing the
groupings of CT values.
The figure below is an example CT vs. Well profile. The outlying wells
have been circled to illustrate the point.
Threshold Cycle (CT)
40.0
35.0
30.0
25.0
20.0
15.0
0
10
20
30
40 50 60
Well Position
70
80
90
Are outliers present?
Then...
Yes
record the well numbers of all outlying
wells.
No
go to “Exporting the Analyzed Run as
a Results File” on page 4-14.
2
From the Reporter pop-up menu, select VIC.
3
Repeat step 1 for the VIC dye layer.
4
Click OK.
The SDS software displays the CTs for the endogenous control.
4-12 Data Analysis
100
Eliminating Wells To eliminate a well with invalid data from the relative quantification
from the Analysis calculation:
Step
1
Action
Hold down the Shift key and click each outlying well identified on
the previous page.
The SDS Software highlights each cell as it is selected.
2
From the Sample Type pull-down menu, select Not In Use.
The SDS software labels all the selected wells Not In Use.
3
Repeat steps 1–2 for the VIC dye layer outlying wells.
Data Analysis 4-13
Exporting the Analyzed Run as a Results File
Exporting a To analyze data from the TaqMan Human Cytokine Card, you must
Results File export the results of the card run to a results file. The SDS software can
export results data from a sequence detection run in a tab-delimited
format that is compatible with the ABI PRISM 7700 Relative
Quantification Software.
To export the run data to an SDS results file:
Step
Action
1
Select Results ("-H) from the Export submenu off of the File menu.
2
Click the Export result data as text box and type a name for the
exported file.
3
Click the Export All Wells radio button.
4
Click Export.
The SDS software exports the data. The 7700 data file icon is
shown below.
data.results
5
4-14 Data Analysis
Close the SDS software.
Interpreting Results 5
5
Overview The ABI PRISM® 7700 Relative Quantification Software calculates
relative cytokine gene expression values from data in exported results
files. To calculate relative quantification values from your exported data,
follow the procedure for multiplex experiments as outlined in the
ABI PRISM 7700 Relative Quantification Software User’s Manual
(P/N 4309937). This chapter contains information to help guide you
through the analysis and to help you interpret the results.
Where You Are in
the Procedure
Reverse Transcription
(cDNA generation)
PCR
(ABI Prism 7700 Card Run)
Data Analysis
Performed using the Sequence
Detection Systems Software
You
Are Here
Interpreting Results
Performed using the ABI Prism
7700 Relative Quantification
Software
Interpreting Results
Performed using the
ABI Prism 7700 Relative
Quantification Software
a. Launch the Relative
Quantification Software
b. Configure the preferences
for a card analysis
(configure the analysis
method and the CT limits)
c. Create a template file for
TaqMan Human Cytokine
Card experiments, or
If a template file exists,
create a relative
quantification document
from the template
d. Import the SDS results
files from the card runs
e. Analyze and interpret the
results
Interpreting Results 5-1
Calculating Relative Cytokine Gene Expression
Rationale The ABI PRISM 7700 Relative Quantification Software calculates
relative cytokine gene expression levels from the threshold cycle (CT)
values obtained from TaqMan® Human Cytokine Card runs. The CT is
the cycle at which the first statistically significant increase in ∆Rn is
detected during the PCR. Wells with greater initial template
concentrations reach their CT values at lower cycle numbers than wells
containing lower template concentrations.
Because amplicons designed and optimized according to Applied
Biosystems guidelines have amplification efficiencies approaching
100%, each PCR cycle corresponds to a twofold increase in product.
Similarly, a change in CT value of one cycle equates to a twofold
difference in initial template concentration.
The relationship between CT value and initial template concentration is
the basis of the relative quantification calculation. The software
calculates relative levels of gene expression by comparing the
normalized cytokine assay CTs of experimental samples to a calibrator
sample. The software displays the calibrator as a 1X sample and all
other quantities as an n-fold difference relative to the calibrator.
Note For more information about Applied Biosystems guidelines for amplicon
design, see the TaqMan® PCR Universal Master Mix Protocol (P/N 4304449).
References For more information on the topic of the Comparative CT Method for
relative quantification of gene expression, Applied Biosystems
recommends the following resources:
♦ ABI PRISM 7700 Sequence Detection Systems Software User
Bulletin 2: Relative Quantification of Gene Expression (P/N 4303859)
♦ ABI PRISM 7700 Relative Quantification Software User’s Manual
(P/N 4309937)
5-2 Interpreting Results
Configuring the ABI PRISM 7700 Relative Quantification Software
Creating a The ABI PRISM 7700 Relative Quantification Software User’s Manual
Template for will instruct you to create a template file for TaqMan Human Cytokine
Card Analyses Card analyses. The template file is time-saving device that will allow you
to skip the laborious task of repetitive plate setup and configuration.
The following figure has been included to provide you with an example
of a template document with the correct target configuration and layout.
Interpreting Results 5-3
Interpreting Relative Quantification Results
About the The ABI PRISM 7700 Relative Quantification Software analyzes the data
Results Window from the exported results files and displays the analysis in the Results
window. The figure below illustrates a typical results window generated
from TaqMan Human Cytokine Card data.
Note The example profiles (shown below and on the following page) were
created using run data from T cell total RNA samples kindly provided by
Dr. R. de Waal Malefyt, DNAX Research Institute, Palo Alto, California, USA.
Cytokine Gene
Expression Profile
Results table
Element
Description
Gene Expression
Profile
A graphic representation of the results of the relative
quantification calculations displayed on a
semi-logarithmic scale. The elements of the profile are
described on the following page.
Results Table
A numerical representation of the sample data at
various stages of the relative quantification calculation.
Note See the ABI PRISM 7700 Relative Quantification
Software User’s Manual for information on the
calculation.
5-4 Interpreting Results
About the The ABI PRISM 7700 Relative Quantification Software displays the
Cytokine Gene results of the cytokine assays as the normalized mRNA level in test
Expression Profile samples relative to the normalized level of that mRNA in the
corresponding calibrator sample.
The gene expression profile is a graphic representation of the results of
the relative quantification calculations. The gene expression profile is
located in the upper panel of the Results window. The following figure
illustrates a typical TaqMan Human Cytokine Card profile.
X-Axis The X-axis of the gene expression profile lists all of the cytokine targets
involved in the analysis. Within each grouping, the software displays the
relative quantity of the target in each sample.
Y-Axis The Y-axis displays the relative quantities of the cytokine targets on a
semi-logarithmic scale. The quantities shown are relative to the
calibrator sample. Each increment corresponds to a ten-fold difference
in gene expression.
Note Because the calibrator sample is compared to itself, the level of cDNA
expression in the calibrator always appears as 1 (1E+00).
Interpreting Results 5-5
Sample Bars Each bar represents the level of target gene expression within a sample
listed in the legend.
Symbol
↑
Definition
Minimum target gene expression level
Displayed on all associated sample bars when:
♦ A calibrator sample produces an Average CT ≥35 cycles
♦ A test sample produces an Average CT <35 cycles
At this level, the calibrator sample does not contain enough
cytokine target cDNA for an accurate comparison. Therefore, the
stated expression level is the minimum possible value for the
associated test sample.
Note The software displays ≥ in the cells of the results table
that correspond to the values displayed in the bar graph.
↓
Maximum target gene expression level
Displayed when:
♦ A test sample produces an Average CT ≥35 cycles
♦ A calibrator sample produces an Average CT <35 cycles
At this level, the test sample does not contain enough cytokine
target cDNA for an accurate comparison with the calibrator
sample. Therefore, the stated expression level is the maximum
possible value for the sample.
Note The software displays ≤ in the cells of the results table
that correspond to the values displayed in the bar graph.
∗
Expression levels cannot be determined from the given data
Displayed when both of the following conditions are met:
♦ A calibrator sample produces an Average CT ≥35 cycles
♦ A test sample produces an Average CT ≥35 cycles
At these levels, the calibrator and test samples do not contain
enough cytokine target cDNA for an accurate comparison.
Because both signals are insufficient, the software cannot
accurately evaluate the expression levels.
Note The software displays Insufficient Signal in the
corresponding cells of the results table.
5-6 Interpreting Results
Troubleshooting
6
6
Overview This chapter provides information on how to troubleshoot the following
areas:
♦ Loading the card
♦ Data analysis
♦ Interpreting the results
Troubleshooting 6-1
Loading the Card
Troubleshooting Card Loading
Observation
Possible Cause(s)
Recommended Action
Vacuum is not
reaching the proper
level (≤600 Microns)
♦ The ABI
Station is not completely
closed
Conduct the following:
♦ The tubing between the
pump and the Filling Station
contains a loose connection
b. Check the tubing and connections for
leaks.
PRISM ® Card Filling
♦ The battery in the vacuum
gauge is low
♦ The vacuum pump requires
maintenance
♦ The ABI PRISM ® Human
Cytokine Card is not aligned
properly inside the Filling
Station
♦ The fill consumable and the
reaction card are not
aligned
The sample does not
enter the card when
the actuator is pulled
The sample partially
enters the card when
the plunger is pulled
Large bubbles
appear in the card
immediately after
filling
Note Cards
typically contain
small bubbles after
thermal cycling.
6-2 Troubleshooting
The card and fill consumable
are not aligned properly inside
the Filling Station
a. Press down on the Filling Station lid to
ensure that it is fully closed.
c. Test and change the battery in the
vacuum gauge if necessary.
d. If the problem persists, verify that the
cytokine card is positioned correctly
within the Filling Station as explained
on page 6-3.
e. If the problem persists, verify the
integrity of the connection between the
reaction card and fill consumable as
explained on page 6-4.
Verify that the cytokine card is positioned
correctly within the Filling Station as
explained on page 6-3.
Verifying the Position of the Card Within the Filling Station
To verify that the card is positioned correctly within the Filling Station:
Step
Action
1
Turn off the vacuum pump.
2
Using a pipet, remove the sample from the reservoir and store it
temporarily on ice.
3
Open the ABI PRISM Filling Station.
4
Inspect the card for the following:
The adhesive flap must
be folded away from the
fill consumable
The holes in the card’s fill
consumable must align with
the pegs in the bay of the
ABI PRISM Filling Station
5
Reposition the cytokine card and re-attempt to load the card.
IMPORTANT Do not attempt to refill partially-filled cards. Upon
contact, the sample-specific PCR reaction mix resuspends the
dried TaqMan® probes and primers within the wells of the card.
When the partially-filled card is evacuated, these reagents are
carried away with the solution.
Troubleshooting 6-3
Verifying the Consumable/Card Connection
The connection between the reaction card and the fill consumable is
crucial for loading TaqMan Human Cytokine Cards.
To verify the integrity of the connection between the reaction card and
the fill consumable:
Step
Action
1
Turn off the vacuum pump.
2
Using a pipet, temporarily remove the sample from the reservoir
and store it on ice.
3
Open the Filling Station.
4
Remove the TaqMan Human Cytokine Card from the Filling Station.
5
Inspect the connection between the reaction card and the fill
consumable.
The consumable design includes two alignment pins and a small
aperture through which the sample enters the card. When situated
correctly, the pins and aperture align with three holes on the keyed
end of the reaction card. The following figures illustrate this
card/consumable relationship from opposing angles.
If the card components do not align as shown above, readjust the
position of the fill consumable to restore the connection.
6
6-4 Troubleshooting
Load the TaqMan Human Cytokine Card into the ABI PRISM Filling
Station and re-attempt the loading procedure.
Data Analysis
Troubleshooting Data Analysis
Observation
Possible Cause
Recommended Action
In the Amplification Plot
view, the fluorescent
signals show little or no
growth (Figure 6-1).
The heated cover was
not tightened
adequately
Remember to tighten the heated cover
completely for future runs.
The O-ring on the lens
plate that seals the card
fill port is damaged
If the problem persists, replace the O-ring on
the top plate of the card adaptor with the part
included with the kit.
The alignment pins on
the 7700 Sample Block
may be interfering with
heat transfer
See “Poor to no amplification in the wells of the
top row (wells A1–A12)” on page 6-8.
AND
In the Multicomponent
View, all well signals
slowly degrade to
background by the end
of the run (Figure 6-2).
Amplification Plot (∆Rn vs. Cycle)
2.000
Samples
VIC – A1
VIC – A2
VIC – A3
VIC – A4
VIC – A5
VIC – A6
VIC – A7
VIC – A8
VIC – A9
1.500
1.000
∆Rn
0.500
0.000
-0.500
-1.000
-1.500
-2.000
0
10
Cycle
30
20
35
Viewer: ∆Rn(Ba..
Reporter: VIC
Figure 6-1 Little or No Growth in the Amplification Plot
Multicomponent View
Fluorescent Intensity
2500
Component Series
VIC
ROX
TAMRA
FAM
BKGND-C7
2000
1500
1000
500
0
–500
0
100
200
300
400
Reading
500
600
700
Figure 6-2 Degrading Multicomponent Signals
Troubleshooting 6-5
Troubleshooting Data Analysis
(continued)
Observation
Possible Cause
Recommended Action
Growth curves from
wells without
amplification drift
upward during the later
cycles (15–35)
(see Figure 6-3)
The plate document file
is in Standard Plate
format
Create a new plate document for a card run and
import the Labview® file from the problem run.
See “Correcting for Plate Document Type” on
page 6-8.
Note The poor precision of the problem run
cannot be corrected after the run is complete.
AND/OR
Growth curves on all
wells slope downward
during the early cycles
correlating with a loss
in precision of the data
(see Figure 6-3)
Amplification Plot (∆Rn vs. Cycle)
10^1
Samples
FAM – C1
FAM – C2
10^0
∆Rn
FAM – C3
FAM – C4
FAM – C5
10^–1
FAM – C6
FAM – C7
FAM – C8
10^–2
FAM – C9
Viewer:
0
10
20
30
35
Reporter:
Cycle
Slow upward slope during
the later cycles (15–35)
Downward slope during the
early cycles (1–10)
Figure 6-3 Incorrect Plate Format
6-6 Troubleshooting
∆Rn (Ba…
VIC
Troubleshooting Data Analysis
(continued)
Observation
Possible Cause
Recommended Action
Some growth curves
slope down toward the
later cycles of large
growth curves
(Figure 6-4)
The instrument is
becoming saturated.
Correcting the problem is optional.
The problem cannot be corrected for the current
run. To avoid this problem in future runs, follow
the procedure “Adjusting the Exposure Time for
Card Runs” on page 3-2.
Amplification Plot (∆Rn vs. Cycle)
2.000
1.800
1.600
1.400
∆Rn
1.200
1.000
0.800
Downward sloping
growth curves
0.600
0.400
0.200
0.000
–0.200
0
10
20
30
35
Cycle
Figure 6-4 Instrument Saturation
Troubleshooting 6-7
Troubleshooting Data Analysis
(continued)
Observation
Possible Cause
Recommended Action
Poor to no
amplification in the
wells of the top row
(wells A1–A12)
The alignment pins on
the 7700 Sample Block
may be interfering with
heat transfer.
Use Figure 6-5 to determine whether the pins
on your instrument must be replaced.
The pins of earlier
instruments (see
Figure 6-5) can prevent
the lens plate of the
ABI PRISM Card Adaptor
from aligning with rows
A and B.
If your instrument does not contain the correct
type of pins, replace them with the new pins
supplied in the TaqMan Card Upgrade Package.
Figure 6-5 Pin Replacement
Correcting for Plate Document Type
To correct a mislabeled document:
Step
6-8 Troubleshooting
Action
1
Save and Close the current plate document.
2
From the File menu, select New "–N.
To correct a mislabeled document:
Step
3
4
(continued)
Action
Configure the new file as follows:
From menu…
Select…
Plate Type
Single Reporter
Plate Format
The Card
Run
Real Time
From the Import submenu off of the File menu, select Labview
Format Raw Data.
5
Using the browser, navigate to the SDS Runs folder of the SDS
software folder on the hard disk of your 7700 instrument.
6
Select the Labview file from the problem run.
The SDS software labels Labview files by the time and date of the
run. Select the file with the correct creation date and time.
7
Click OK.
The SDS software imports the data from the Labview file.
8
Reanalyze the file as described in Chapter 4, “Data Analysis.”
Troubleshooting 6-9
Interpreting Results
Troubleshooting Interpreting Results:
Observation
Possible Cause
Recommended Action
Unable to import card
file into the
ABI PRISM ® 7700
Relative
Quantification
Software
Files may not be the
proper format
Verify that the file you are attempting to import is
a tab-delimited results file exported from a card
run and not the SDS run file. If necessary, export
the files as explained in “Exporting the Analyzed
Run as a Results File” on page 4-14.
Results file
Files may not be
configured with correct
sample types (TARG
and ENDO)
SDS run file
While viewing the card run within the SDS
software, verify the following:
♦ The TARG sample type must be applied to all
wells in the FAM dye layer (see page 3-19 for
the FAM dye layer setup).
♦ The ENDO sample type must be applied to all
wells in the VIC dye layer (see page 3-19 for
the VIC dye layer setup).
If the ENDO and TARG sample types are
incorrectly applied or are absent from the Sample
Type palette:
a. Add the sample types to the palette (see
“Adding the TARG and ENDO Sample Types
to the Dye Palette” on page 6-11).
b. Apply the correct sample types to the SDS file.
c. Re-analyze and export the results.
Threshold values within
the FAM and VIC dye
layers may not be
identical for all of the
results files
While viewing the card run within the SDS
software, verify the following:
♦ The VIC threshold value must match the VIC
thresholds for the other cards in the analysis.
♦ The FAM threshold value must match the FAM
thresholds for the other cards in the analysis.
If the threshold values are not consistent with the
other cards in the analysis, set them accordingly
(see “Setting the Threshold Values” on page 4-4).
6-10 Troubleshooting
Troubleshooting Interpreting Results: (continued)
Observation
Possible Cause
Recommended Action
Average endogenous
control CTs are ≥23
♦ Not enough sample
in the card
a. Verify the type and quantity of the cDNA
sample loaded into the TaqMan Human
Cytokine Card. (See pages 3-4 to 3-5 for the
correct template information.)
♦ Not enough cDNA
from total RNA.
b. Increase the concentration of the cDNA
sample loaded into the card.
Adding the TARG and ENDO Sample Types to the Dye Palette
To add new dyes to the dye palette:
Step
1
Action
From the Setup menu, select Sample Type Palette.
The Sample Type Palette dialog box appears.
2
Click Sample Type Setup.
The Sample Type Setup dialog box appears.
3
Add the TARG – RelQ Target sample type to the palette:
a. Click Add.
A new row appears at the bottom of the dye list.
b. Click the Acronym text field and type TARG.
Click here
c. Click the Name text field and type RelQ Target.
Click here
d. Click the Color field. When the Color pallet dialog box appears,
Select a color for the new dye and click OK.
Double-click
here
The color field for the new dye fills with the new color.
e. From the Reporter pull-down menu, select FAM
.
Select FAM
Troubleshooting 6-11
To add new dyes to the dye palette:
Step
4
(continued)
Action
Add the ENDO – RelQ Endogenous Control sample type to the
palette:
a. Click Add.
A new row appears at the bottom of the dye list.
b. Click the Acronym text field and type ENDO.
c. Click the Name text field and type RelQ Endogenous Control.
d. Click the Color field.
The Color pallet Dialog Box appears.
e. Select a color for the new dye and click OK.
The color field for the new dye fills with the new color.
f. From the Reporter pull-down menu, select VIC
.
Select VIC
5
Click OK.
The new sample types will now be available from the Sample Type
pop-up menu.
6-12 Troubleshooting
Theory of Operation A
A
Overview This appendix provides an overview of the theoretical basis for the
TaqMan® Human Cytokine Card chemistry and ABI PRISM ® 7700
Sequence Detection System data collection.
Theory of Operation A-1
TaqMan Human Cytokine Card Chemistry
RT-PCR The TaqMan Human Cytokine Card evaluates gene expression in a
two-step reverse transcription-polymerase chain reaction (RT-PCR).
The figure below illustrates the assay steps.
In the RT step, cDNA is reverse transcribed from total RNA samples
using random hexamers from the TaqMan Reverse Transcription
Reagents. In the PCR step, products are synthesized from cDNA
samples using the TaqMan Universal PCR Master Mix and target
specific primers/probes.
Basics of the The PCR reaction exploits the 5´ nuclease activity of AmpliTaq Gold
5´ Nuclease Assay DNA Polymerase to cleave a TaqMan® probe during PCR. The TaqMan
probe incorporates a reporter dye (VIC or FAM) at the 5´ end of the
probe and a quencher (TAMRA, or MGB) at the 3´ end of the probe.
During the reaction, cleavage of the probe separates the reporter dye
and the quencher, which results in increased fluorescence of the
reporter. Accumulation of PCR products is detected directly by
monitoring the increase in fluorescence of the reporter dye as shown
below.
A-2 Theory of Operation
When the probe is intact, the proximity of the reporter dye to the
quencher dye results in suppression of the reporter fluorescence
primarily by Förster-type energy transfer (Förster, 1948;
Lakowicz, 1983). During PCR, if the target of interest is present, the
probe specifically anneals between the forward and reverse primer
sites.
The 5´→3´ nucleolytic activity of the AmpliTaq Gold DNA Polymerase
cleaves the probe between the reporter and the quencher only if the
probe hybridizes to the target. The probe fragments are then displaced
from the target, and polymerization of the strand continues. The 3´ end
of the probe is blocked to prevent extension of the probe during PCR.
This process occurs in every cycle and does not interfere with the
exponential accumulation of product.
The increase in fluorescence signal is detected only if the target
sequence is complementary to the probe and is amplified during PCR.
Because of these requirements, any nonspecific amplification is not
detected.
Theory of Operation A-3
About AmpliTaq AmpliTaq Gold is a thermal stable DNA polymerase. The enzyme has a
Gold DNA 5´→3´ nuclease activity, but lacks a 3´→5´ exonuclease activity
Polymerase (Innis et al., 1988; Holland et al.,1991). With AmpliTaq Gold enzyme,
Hot Start PCR and Time Release PCR can be introduced into existing
amplification systems with little or no modification of cycling parameters
or reaction conditions. These techniques improve amplification of most
templates by lowering background and increasing amplification of
specific products.
Multicomponent Analysis
Fluorescent Multicomponenting is the term used to distinguish the contribution each
Detection individual dye makes to the fluorescent spectra. Overlapping spectra
from the pure dye components generate the composite spectrum. This
spectrum represents one fluorescent reading from one well. Current
pure dye menus available for multicomponent analysis are:
Function
Dye
Reporters
FAM, TET, VIC
Quenchers
TAMRA, MGB
Passive reference
ROX
Passive Reference The Passive Reference is a dye included in the TaqMan Universal PCR
Master Mix that does not participate in the 5´ nuclease assay. The
Passive Reference provides an internal reference to which the
reporter-dye signal can be normalized during data analysis.
Normalization is necessary to correct for fluorescent fluctuations due to
changes in concentration or volume.
A-4 Theory of Operation
Normalization Normalization is accomplished by dividing the emission intensity of the
reporter dye by the emission intensity of the Passive Reference to
obtain a ratio defined as the Rn (normalized reporter) for a given
reaction tube.
Variable
Description
Rn+
The Rn value of a reaction containing all components including
the template.
Rn–
The Rn value of an unreacted sample.
This value may be obtained from the early cycles of a Real
Time run, those cycles prior to a detectable increase in
fluorescence. This value may also be obtained from a reaction
not containing template.
∆Rn
The difference between the Rn+ value and the Rn– value.
It reliably indicates the magnitude of the signal generated by
the given set of PCR conditions.
The following equation expresses the relationship of these terms:
∆Rn = (Rn+) – (Rn–)
where:
Rn+ = emission intensity of reporter
PCR with template
emission intensity of passive reference
Rn– = emission intensity of reporter
emission intensity of passive reference
PCR without template or
early cycles of a Real Time
reaction
Theory of Operation A-5
Real Time The threshold cycle or CT value is the cycle at which a statistically
Detection significant increase in ∆Rn is first detected. Threshold is defined as the
average standard deviation of Rn for the early cycles, multiplied by an
adjustable factor. On the graph below, the threshold cycle occurs when
the Sequence Detection Systems software begins to detect the
increase in signal associated with an exponential growth of PCR
product.
A-6 Theory of Operation
Demonstrating
Performance with
Control RNA
B
B
Overview TaqMan Human Control Total RNA is available from Applied Biosystems
for demonstrating the performance of the TaqMan® Human Cytokine
Card. This appendix includes the performance guarantee statement
and protocols for analyzing the Control RNA data.
Demonstrating Performance with Control RNA B-1
System Performance Guarantee
Statement If TaqMan Human Control Total RNA is run in the card using the
conditions in the following protocol, the average CT value for the 18S
endogenous control will be fewer than 12 cycles and the ∆CT values for
five cytokine targets will be as follows:
Target
∆CT
IL-10
Below 20
Lymphotoxin-B
Below 20
TGF-B
Below 17
TNF-a
Below 20
TNF-B
Below 17
Protocol for Analyzing TaqMan Human Control Total RNA
Verifying CT Card performance can be verified immediately after running a control
Values Using the card by examining the threshold cycle (CT) values of each reporter dye
SDS Software layer within the Sequence Detection System (SDS) software.
To verify the CT values:
Step
Action
1
Perform reverse transcription as described in Chapter 2 using 2 µg
of TaqMan Human Control Total RNA in a 100 µL reaction.
2
Make a sample-specific PCR reaction mix using 150 µL TaqMan
Universal PCR Master Mix, 30 µL of 20X 18S Primer and Probe
Mix, 118 µL water, and 2 µL cDNA as described in Chapter 3,
“PCR.” Then, fill and run a TaqMan Human Cytokine Card with the
reaction mix.
B-2 Demonstrating Performance with Control RNA
To verify the CT values:
Step
3
(continued)
Action
After the run is complete, activate the Spectral Compensation
feature:
a. Select Advanced Options from the Diagnostics submenu off of
the Instrument menu.
The Advanced Options dialog box appears.
b. From the Miscellaneous group box, click the Use Spectral
Compensation for Real Time check box.
c. Click OK.
Select Analyze ("-L) from the Analysis menu.
4
The SDS software analyzes the raw data and displays an
amplification plot (log ∆Rn vs. Cycle).
From the Reporter menu, select VIC.
5
The SDS software displays the amplification plot (log ∆Rn vs. Cycle)
for the VIC dye layer.
From the Viewer menu, select CT vs. Well.
6
The SDS software displays the Threshold Value (CT) vs. Well
Position view for the VIC dye.
Because of the high abundance of rRNA, performance integrity
across a entire card can be best assessed by examining the CT
from the 18S rRNA endogenous control.
The card is performing properly if the average VIC CT is <12 cycles.
Amplification – TaqMan Human Total RNA (VIC)
Threshold Cycle (CT)
45.0
40.0
35.0
30.0
25.0
20.0
15.0
10.0
5.0
0.0
-5.0
0
10
20
30
40
50
60
70
80
90
100
Well Position
Demonstrating Performance with Control RNA B-3
To verify the CT values:
Step
7
(continued)
Action
From the Reporter menu, select FAM.
The card is performing properly if the following FAM CTs are <30
cycles:
Cytokine Target
Wells
IL-10
37–40
LT-β
81–84
TGF-β
85–88
TNF-α
89–92
TNF-β
93–96
Note The TaqMan Human Total RNA sample expresses some
cytokines other than those listed above to a limited extent.
Threshold Cycle (Ct)
Amplification – TaqMan Human Total RNA (VIC)
45.0
40.0
35.0
30.0
25.0
20.0
15.0
10.0
5.0
0.0
-5.0
8
TNF-β
TNF-α
TGF-β
LT-β
IL-10
0
10
20
30
50 60
40
Well Position
70
80
90
100
Export the analyzed data as explained in “Exporting the Analyzed
Run as a Results File” on page 4-14.
B-4 Demonstrating Performance with Control RNA
Verifying the Note For the purpose of demonstration, the following procedure illustrates
Expression Profile how to generate a profile of median ∆CT values using Microsoft’s Excel
of Control RNA spreadsheet utility. Other software packages can be used to create the profile,
however the keystrokes and command pathways may differ.
After exporting the results of the control card run, the performance of
the card can be verified again by generating a profile of the median ∆CT
values using a spreadsheet utility. Because the control RNA sample
lacks a calibrator sample for comparison, relative quantities cannot be
derived from the results of the control card run. Instead, the data from
the control run can be used to generate a profile of the normalized,
median CT values for the cytokine assays.
Transferring Data
To transfer data from the results file to the spreadsheet:
from the Results
File
Step
Action
1
Launch Microsoft Excel.
2
Open the results file from the control card run:
a. From the File menu, select Open.
The Open dialog box appears.
b. Use the browser to navigate to and select the results file from the
control card run.
c. Click Open.
The software displays the data within the SDS results file.
3
From the File menu, select New.
A new spreadsheet appears.
4
From the Window menu, select the SDS results file.
The cytokine card results spreadsheet reappears.
5
Select cells A1–A97.
6
From the Edit menu, select Copy.
7
From the Window menu, select the new spreadsheet.
The new spreadsheet file reappears.
8
Click cell A1.
9
From the Edit menu, select Paste.
Excel pastes the data into the new spreadsheet.
Demonstrating Performance with Control RNA B-5
To transfer data from the results file to the spreadsheet:
Step
(continued)
Action
10
Repeat steps 3-7 to copy the FAM CT values in cells F1–F97 from
the results file and paste them into cell B1–B97 of the new file.
11
Click cell B1 and type Ct FAM.
12
Repeat steps 3-7 to copy the VIC CT values in cells F111–F207 from
the results file and paste them into cell C1 of the new Excel file.
13
Click cell C1 and type Ct VIC.
Calculating ∆CT ∆CT is calculated with the equation: ∆CT = CT FAM - CT VIC. To calculate
∆CTs, the formula must be entered into column D.
To enter the equation into the spreadsheet:
Step
Action
1
Click cell D2.
2
Type the equation =B2-C2 and press Return.
3
Click cell D2.
4
From the Edit menu, select Copy.
5
Select cells D3–D97 by clicking and dragging the mouse cursor
down the spreadsheet document.
6
From the Edit menu, select Paste.
Excel pastes copies of the equation into cells D2-D97 of the new
spreadsheet. The program automatically calculates ∆CT values.
7
Click cell D1 and type ∆CT.
8
From the File menu, select Save As.
Save the spreadsheet document.
B-6 Demonstrating Performance with Control RNA
Creating an Now that ∆CT values have been calculated from the cytokine card data,
Average ∆CT Table the results must be organized under the cytokines they detect.
To create a Median ∆CT table:
Step
Action
1
Click cell F1 and type Target.
2
Click and type the following entries into the designated cells:
Click Cell
Type
Click Cell
Type
F2
IL-1alpha
F14
IL-13
F3
IL-1beta
F15
IL-15
F4
IL-2
F16
IL-17
F5
IL-3
F17
IL-18
F6
IL-4
F18
G–CSF
F7
IL-5
F19
GM–CSF
F8
IL-6
F20
M–CSF
F9
IL-7
F21
IFN–gamma
F10
IL-8
F22
LT–beta
F11
IL-10
F23
TGF–beta
F12
IL-12p35
F24
TNF–alpha
F13
IL-12p40
F25
TNF–beta
Demonstrating Performance with Control RNA B-7
To create a Median ∆CT table:
Step
3
(continued)
Action
Click and type the following equations into the designated cells:
Cell
Type
Cell
Type
G2
=MEDIAN(D2:D5)
G14
=MEDIAN(D50:D53)
G3
=MEDIAN(D6:D9)
G15
=MEDIAN(D54:D57)
G4
=MEDIAN(D10:D13)
G16
=MEDIAN(D58:D61)
G5
=MEDIAN(D14:D17)
G17
=MEDIAN(D62:D65)
G6
=MEDIAN(D18:D21)
G18
=MEDIAN(D66:D69)
G7
=MEDIAN(D22:D25)
G19
=MEDIAN(D70:D73)
G8
=MEDIAN(D26:D29)
G20
=MEDIAN(D74:D77)
G9
=MEDIAN(D30:D33)
G21
=MEDIAN(D78:D81)
G10
=MEDIAN(D34:D37)
G22
=MEDIAN(D82:D85)
G11
=MEDIAN(D38:D41)
G23
=MEDIAN(D86:D89)
G12
=MEDIAN(D42:D45)
G24
=MEDIAN(D90:D93)
G13
=MEDIAN(D46:D49)
G25
=MEDIAN(D94:D97)
4
Click cell G1 and type Median∆Ct.
5
Compare the ∆CTs of the targets in the spreadsheet to the values in
the table below.
The card is performing properly if the designated targets achieve
the following ∆CT values:
Target
∆CT
IL-10
Below 20
Lymphotoxin-β
Below 20
TGF-β
Below 17
TNF-α
Below 20
TNF-β
Below 17
B-8 Demonstrating Performance with Control RNA
Contacting
Technical Support C
Technical Support
C
Contacting You can contact Applied Biosystems for technical support:
Technical Support ♦ By e-mail
♦
By telephone or fax
♦
Through the Applied Biosystems web site
You can order Applied Biosystems user documents, MSDSs,
certificates of analysis, and other related documents 24 hours a day. In
addition, you can download documents in PDF format from the Applied
Biosystems web site. (Please see the section “To Obtain Technical
Documents” following the telephone information below)
To Reach To contact Applied Biosystems Technical Support by e-mail for help in
Technical Support the following product areas:
by E-Mail
Product/Product Area
E-mail address
Genetic Analysis (DNA Sequencing)
[email protected]
Sequence Detection Systems and
PCR
[email protected]
Protein Sequencing, Peptide, and
DNA Synthesis
[email protected]
Contacting Technical Support C-1
Product/Product Area
E-mail address
Biochromatography
[email protected]
PerSeptive DNA, PNA and Peptide
Synthesis systems
FMAT 8100 HTS System
CytoFluor® 4000 Fluorescence Plate
Reader
Mariner Mass Spectrometers
Voyager Mass Spectrometers
MassGenotyping Solution 1™ (MGS1)
System
To Reach
Technical Support
by Phone or Fax
(N. America)
LC/MS
(Applied Biosystems/MDS Sciex)
[email protected]
Chemiluminescence (Tropix)
[email protected]
To contact Applied Biosystems Technical Support in North America, use
the telephone or fax numbers in the table below.
Note To schedule a service call for other support needs, or in case of an
emergency, dial 1.800.831.6844, then press 1.
Product/Product Area
Telephone
Fax
1.800.831.6844,
then press 8a
1.650.638.5981
DNA Synthesis
1.800.831.6844,
press 2, then
press 1a
1.650.638.5981
Fluorescent DNA Sequencing
1.800.831.6844,
press 2, then
press 2a
1.650.638.5981
Fluorescent Fragment Analysis
(including GeneScan®
applications)
1.800.831.6844,
press 2, then
press 3a
1.650.638.5981
Integrated Thermal Cyclers
(ABI PRISM® 877 and Catalyst
800 instruments)
1.800.831.6844,
press 2, then
press 4a
1.650.638.5981
ABI PRISM® 3100 Genetic
Analyzer
1.800.831.6844,
press 2, then
press 6a
1.650.638.5981
ABI
PRISM ®
C-2 Contacting Technical Support
3700 DNA Analyzer
Product/Product Area
Telephone
Fax
Peptide Synthesis
(433 and 43x Systems)
1.800.831.6844,
press 3, then
press 1a
1.650.638.5981
Protein Sequencing
(Procise® Protein Sequencing
Systems)
1.800.831.6844,
press 3, then
press 2a
1.650.638.5981
PCR and Sequence Detection
1.800.762.4001,
then press:
1.240.453.4613
1 for PCRa
2 for TaqMan®
applications and
Sequence
Detection
Systems including
ABI Prism‚ 7700,
7900, and 5700a
6 for the 6700
Automated
Sample Prep
Systema
or
1.800.831.6844,
then press 5a
Voyager MALDI-TOF
Biospectrometry Workstations
1.800.899.5858,
press 1, then
press 3b
1.508.383.7855
Biochromatography
(BioCAD®, SPRINT , VISION,
and INTEGRAL® Workstations
and POROS® Perfusion
Chromatography Products)
1.800.899.5858,
press 1, then
press 4b
1.508.383.7855
Expedite Nucleic Acid
Synthesis Systems
1.800.899.5858,
press 1, then
press 5b
1.508.383.7855
Peptide Synthesis (Pioneer and
9050 Plus Peptide Synthesizers)
1.800.899.5858,
press 1, then
press 5b
1.508.383.7855
Mariner ESI-TOF Mass
Spectrometry Workstations
MassGenotyping Solution 1
(MGS1) System
Contacting Technical Support C-3
Product/Product Area
Telephone
Fax
PNA Custom and Synthesis
1.800.899.5858,
press 1, then
press 5b
1.508.383.7855
FMAT 8100 HTS System
1.800.899.5858,
press 1, then
press 6b
1.508.383.7855
Chemiluminescence (Tropix)
1.800.542.2369
(U.S. only),
or
1.781.271.0045c
1.781.275.8581
LC/MS
(Applied Biosystems/MDS Sciex)
1.800.952.4716
1.508.383.7899
CytoFluor®
4000 Fluorescence
Plate Reader
a. 5:30 AM to 5:00 PM Pacific time.
b. 8:00 AM to 6:00 PM Eastern time.
c. 9:00 AM to 5:00 PM Eastern time.
To Reach To contact Applied Biosystems Technical Support or Field Service
Technical Support outside North America, use the telephone or fax numbers below.
by Phone or Fax
Telephone
Fax
(Outside N. Region
Eastern
Asia,
China,
Oceania
America)
Australia (Scoresby, Victoria)
61 3 9730 8600
61 3 9730 8799
China (Beijing)
86 10 64106608 or
86 800 8100497
86 10 64106617
Hong Kong
852 2756 6928
852 2756 6968
India (New Delhi)
91 11 653
3743/3744
91 11 653 3138
Korea (Seoul)
82 2 593 6470/6471
82 2 593 6472
Malaysia (Petaling Jaya)
60 3 79588268
60 3 79549043
Singapore
65 896 2168
65 896 2147
Taiwan (Taipei Hsien)
886 2 2358 2838
886 2 2358 2839
Thailand (Bangkok)
66 2 719 6405
66 2 319 9788
Europe
C-4 Contacting Technical Support
Region
Telephone
Fax
Austria (Wien)
43 (0)1 867 35 75 0
43 (0)1 867 35 75
11
Belgium
32 (0)2 532 4484
32 (0)2 582 1886
Denmark (Naerum)
45 45 58 60 00
45 45 58 60 01
Finland (Espoo)
358 (0)9 251 24 250
358 (0)9 251 24 243
France (Paris)
33 (0)1 69 59 85 85
33 (0)1 69 59 85 00
Germany (Weiterstadt)
49 (0)6150 101 0
49 (0)6150 101 101
Italy (Milano)
39 (0)39 83891
39 (0)39 838 9492
Norway (Oslo)
47 23 12 06 05
47 23 12 05 75
Portugal (Lisboa)
351.(0)22.605.33.14
351.(0)22.605.33.15
Spain (Tres Cantos)
34.(0)91.806.1210
34.(0)91.806.12.06
Sweden (Stockholm)
46 (0)8 619 4400
46 (0)8 619 4401
Switzerland (Rotkreuz)
41 (0)41 799 7777
41 (0)41 790 0676
The Netherlands (Nieuwerkerk
a/d IJssel)
31 (0)180 392400
31 (0)180 392409
or
31 (0)180 392499
United Kingdom (Warrington,
Cheshire)
44 (0)1925 825650
44 (0)1925 282502
European Managed Territories (EMT)
Africa, English speaking
(Johannesburg, South Africa)
27 11 478 0411
27 11 478 0349
Africa, French speaking
(Paris, France)
33 1 69 59 85 11
33 1 69 59 85 00
India (New Delhi)
91 11 653 3743
91 11 653 3138
91 11 653 3744
Poland, Lithuania, Latvia, and
Estonia (Warszawa)
48 22 866 40 10
48 22 866 40 20
For all other EMT countries not
listed (Central and southeast
Europe, CIS, Middle East, and
West Asia)
44 1925 282481
44 1925 282509
Japan
Contacting Technical Support C-5
Region
Telephone
Fax
Japan (Hacchobori, Chuo-Ku,
Tokyo)
81 3 5566 6230
81 3 5566 6507
Latin America
Caribbean countries, Mexico, and
Central America
52 55 35 3610
52 55 66 2308
Brazil
0 800 704 9004 or
55 11 5070 9654
55 11 5070 9694/95
Argentina
800 666 0096
55 11 5070 9694/95
Chile
1230 020 9102
55 11 5070 9694/95
Uruguay
0004 055 654
55 11 5070 9694/95
To Reach
Technical Support To contact Technical Support through the Applied Biosystems web site:
Via the Applied Step Action
Biosystems Web
1
Go to http://www.appliedbiosystems.com
Site
2
Click SERVICES & SUPPORT at the top of the page, then click
Frequently Asked Questions.
3
Click Contact Support in the contents list at the left of the screen.
4
Click your geographic region for the product area of interest.
5
In the Personal Assistance form, enter the requested information and
your question, then click Ask Us RIGHT NOW.
6
In the Customer Information form, enter the requested information,
then click Ask Us RIGHT NOW.
Within 24 to 48 hours, you will receive an e-mail reply to your
question from an Applied Biosystems technical expert.
To Obtain You can obtain technical documents, such as Applied Biosystems user
Technical documents, MSDSs, certificates of analysis, and other related
Documents documents for free, 24 hours a day. You can obtain documents:
♦
By telephone
♦
Through the Applied Biosystems web site
C-6 Contacting Technical Support
Ordering Documents by Telephone
To order documents by telephone:
1
From the U.S. or Canada, dial 1.800.487.6809, or from outside the
U.S. and Canada, dial 1.858.712.0317.
2
Follow the voice instructions to order documents (for delivery by fax).
Note
There is a limit of five documents per fax request.
Obtaining Documents Through the Web Site
To view, download, or order documents through the Applied Biosystems
web site:
Step
Action
1
Go to http://www.appliedbiosystems.com
2
Click SERVICES & SUPPORT at the top of the page, then click
Documents on Demand.
3
In the search form, enter and select search criteria, then click Search
at the bottom of the page.
4
In the results screen, do any of the following:
♦ Click the pdf icon to view a PDF version of the document.
♦ Right-click the pdf icon, then select Save Target As to download a
copy of the PDF file.
♦ Select the Fax check box, then click Deliver Selected Documents
Now to have the document faxed to you.
♦ Select the Email check box, then click Deliver Selected Documents
Now to have the document (PDF format) e-mailed to you.
Note There is a limit of five documents per fax request, but no limit
on the number of documents per e-mail request.
To Obtain To obtain Applied Biosystems training information:
Customer Training
Information Step Action
1
Go to http://www.appliedbiosystems.com
2
Click SERVICES & SUPPORT at the top of the page, then click
Training.
Contacting Technical Support C-7
References
D
D
Förster, V.T. 1948. Zwischenmolekulare Energiewanderung und
Fluoreszenz. Annals of Physics (Leipzig) 2:55–75.
Holland, P.M., Abramson, R.D., Watson, R., and Gelfand, D.H. 1991.
Detection of specific polymerase chain reaction product by utilizing the
5´Æ3´ exonuclease activity of Thermus aquaticus DNA polymerase.
Proc. Natl. Acad. Sci. USA 88:7276–7280.
Innis, M.A., Myambo, K.B., Gelfand, D.H., and Brow, M.A. 1988. DNA
sequencing with Thermus aquaticus DNA polymerase and direct
sequencing of polymerase chain reaction-amplified DNA. Proc. Natl.
Acad. Sci. USA 85:9436–9440.
Kwok, S. and Higuchi, R. 1989. Avoiding false positives with PCR.
Nature 339:237–238.
Lakowicz, J.R. 1983. Principles of Fluorescence Spectroscopy. New
York: Plenum Press. xiv, 496 pp.
Longo, M.C., Berninger, M.S., and Hartley, J.L. 1990. Use of uracil DNA
glycosylase to control carry-over contamination in polymerase chain
reactions. Gene 93:125–128.
Mullis, K.B., and Faloona, F.A. 1987. Specific synthesis of DNA in vitro
via a polymerase-catalyzed chain reaction. Methods Enzymol.
155:335–350.
Saiki, R.K., Scharf, S., Faloona, F., et al. 1985. Enzymatic amplification
of β-globin genomic sequences and restriction site analysis for
diagnosis of sickle cell anemia. Science 230:1350–1354.
References D-1
Limited Warranty
Statement
E
E
Applied Biosystems warrants to the customer that, for a period ending
on the earlier of one year from the completion of installation or fifteen
(15) months from the date of shipment to the customer (the “Warranty
Period”), the TaqMan® Human Cytokine Card Upgrade Package
purchased by the customer (the “Instrument”) will be free from defects
in material and workmanship, and will perform in accordance with the
installation specifications set forth in the ABI PRISM® 7700 and TaqMan
Card Upgrade Installation Manual (the “Specifications”).
During the Warranty Period, if the Instrument's hardware becomes
damaged or contaminated or it the Instrument otherwise fails to meet
the Specifications, Applied Biosystems will repair or replace the
Instrument so that it meets the Specifications, at Applied Biosystems
expense. However, if the ABI PRISM® Card Filling Station or Card
Adaptor become damaged or contaminated or if the performance of the
Instrument otherwise deteriorates due to consumables and/or reagents
other than those supplied or expressly recommended by Applied
Biosystems, Applied Biosystems will return the Instrument to
Specification at the customer's request and at the customer's expense.
After this service is performed, coverage of the parts repaired or
replaced will be restored thereafter for the remainder of the original
Warranty Period.
This Warranty does not extend to any Instrument or part which has
been (a) the subject of an accident, misuse, or neglect, (b) modified or
repaired by a party other than Applied Biosystems, or (c) used in a
manner not in accordance with the instructions contained in the
Instrument User's Manual. This Warranty does not cover the
customer-installable accessories or customer-installable consumable
parts for the Instrument that are listed in the Instrument User's Manual.
Those items are covered by their own warranties.
Limited Warranty Statement E-1
Applied Biosystems obligation under this Warranty is limited to repairs
or replacements that Applied Biosystems deems necessary to correct
those failures of the Instrument to meet the Specifications of which
Applied Biosystems is notified prior to expiration of the Warranty Period.
All repairs and replacements under this Warranty will be performed by
Applied Biosystems on site at the Customer's location at Applied
Biosystems sole expense.
No agent, employee, or representative of Applied Biosystems has any
authority to bind Applied Biosystems to any affirmation, representation,
or warranty concerning the Instrument that is not contained in Applied
Biosystems printed product literature or this Warranty Statement. Any
such affirmation, representation or warranty made by any agent,
employee, or representative of Applied Biosystems will not be binding
on Applied Biosystems.
Applied Biosystems shall not be liable for any incidental, special, or
consequential loss, damage or expense directly or indirectly arising
from the purchase or use of the Instrument. Applied Biosystems makes
no warranty whatsoever with regard to products or parts furnished by
third parties.
This Warranty is limited to the original purchaser and is not transferable.
THIS WARRANTY IS THE SOLE AND EXCLUSIVE WARRANTY AS
TO THE INSTRUMENT AND IS IN LIEU OF ANY OTHER EXPRESS
OR IMPLIED WARRANTIES, INCLUDING, WITHOUT LIMITATION.
ANY IMPLIED WARRANTY OF MERCHANTABILITY OR FITNESS
FOR A PARTICULAR PURPOSE AND IS IN LIEU OF ANY OTHER
OBLIGATION ON THE PART OF APPLIED BIOSYSTEMS.
E-2 Limited Warranty Statement
Headquarters
850 Lincoln Centre Drive
Foster City, CA 94404 USA
Phone: +1 650.638.5800
Toll Free: +1 800.345.5224
Fax: +1 650.638.5884
Worldwide Sales Offices
Applied Biosystems vast distribution and
service network, composed of highly trained
support and applications personnel, reaches
into 150 countries on six continents. For
international office locations, please call our
local office or refer to our web site at
www.appliedbiosystems.com.
www.appliedbiosystems.com
Applera Corporation is committed to providing the
world’s leading technology and information for life
scientists. Applera Corporation consists of the
Applied Biosystems and Celera Genomics
businesses.
Printed in the USA, 06/2001
Part Number 4307577C
an Applera business