1
ModelSim® Advanced Debugging
Student Workbook
December 2002
Copyright Mentor Graphics Corporation 2002. All rights reserved. This document contains information
that is proprietary to Mentor Graphics Corporation and may not be duplicated in whole or in part in any
form without written consent from Mentor Graphics. In accepting this document, the recipient agrees to
make every reasonable effort to prevent the unauthorized use of this information.
This document is for information and instruction purposes. Mentor Graphics reserves the right to make
changes in specifications and other information contained in this publication without prior notice, and the
reader should, in all cases, consult Mentor Graphics to determine whether any changes have been
made.
The terms and conditions governing the sale and licensing of Mentor Graphics products are set forth in
written agreements between Mentor Graphics and its customers. No representation or other affirmation
of fact contained in this publication shall be deemed to be a warranty or give rise to any liability of Mentor
Graphics whatsoever.
MENTOR GRAPHICS MAKES NO WARRANTY OF ANY KIND WITH REGARD TO THIS MATERIAL
INCLUDING, BUT NOT LIMITED TO, THE IMPLIED WARRANTIES OR MERCHANTABILITY AND
FITNESS FOR A PARTICULAR PURPOSE.
MENTOR GRAPHICS SHALL NOT BE LIABLE FOR ANY INCIDENTAL, INDIRECT, SPECIAL, OR
CONSEQUENTIAL DAMAGES WHATSOEVER (INCLUDING BUT NOT LIMITED TO LOST PROFITS)
ARISING OUT OF OR RELATED TO THIS PUBLICATION OR THE INFORMATION CONTAINED IN IT,
EVEN IF MENTOR GRAPHICS CORPORATION HAS BEEN ADVISED OF THE POSSIBILITY OF
SUCH DAMAGES.
RESTRICTED RIGHTS LEGEND 03/97
U.S. Government Restricted Rights. The SOFTWARE and documentation have been developed entirely
at private expense and are commercial computer software provided with restricted rights. Use,
duplication or disclosure by the U.S. Government or a U.S. Government subcontractor is subject to the
restrictions set forth in the license agreement provided with the software pursuant to DFARS 227.72023(a) or as set forth in subparagraph (c)(1) and (2) of the Commercial Computer Software - Restricted
Rights clause at FAR 52.227-19, as applicable.
Contractor/manufacturer is:
Mentor Graphics Corporation
8005 S.W. Boeckman Road, Wilsonville, Oregon 97070-7777.
A complete list of trademark names appears in a separate “Trademark Information” document.
This is an unpublished work of Mentor Graphics Corporation.
Part Number: 069776
Trademark Information
Mentor Graphics Trademarks
The following names are trademarks, registered trademarks, and service marks of Mentor Graphics Corporation:
3D Design, A World of Learning(SM), ABIST, Arithmetic BIST, AccuPARTner, AccuParts, AccuSim, ADEPT, ADVance MS, ADVance RFIC,
AMPLE, Analog Analyst, Analog Station, AppNotes(SM), ARTgrid, ArtRouter, ARTshape, ASICPlan, ASICVector Interfaces, Aspire
Assess2000(SM), AutoActive, AutoCells, AutoDissolve, AutoFilter, AutoFlow, AutoLib, AutoLinear, AutoLink, AutoLogic, AutoLogic
BLOCKS, AutoLogic FPGA, AutoLogic VHDL, AutomotiveLib, AutoPAR, AutoTherm, AutoTherm Duo, AutoThermMCM, AutoView, Autowire
Station, AXEL, AXEL Symbol Genie, BISTArchitect, BIST Compiler(SM), BIST-In-Place(SM), BIST-Ready(SM), Board Architect, Board Designer,
Board Layout, Board Link, Board Process Library, Board Station, Board Station Consumer, BOLD Administrator, BOLD Browser, BOLD Composer,
BSDArchitect, BSPBuilder, Buy on Demand, Cable Analyzer, Cable Station, CAECO Designer, CAEFORM, Calibre, Calibre CB, Calibre DRC,
Calibre DRC-H, Calibre Interactive, Calibre LVS, Calibre LVS-H, Calibre MDPview, Calibre MGC, Calibre OPCpro, Calibre ORC, Calibre
PRINTimage, Calibre PSMgate, Calibre RVE, Calibre WORKbench, Calibre xRC, CAM Station, Capture Station, CAPITAL, CAPITAL Analysis,
CAPITAL Bridges, CAPITAL Documents, CAPITAL H, CAPITAL Harness, CAPITAL Harness Systems, CAPITAL H the complete desktop engineer,
CAPITAL Insight, CAPITAL Integration, CAPITAL Manager, CAPITAL Manufacturer, CAPITAL Support, CAPITAL Systems, Cell Builder, Cell
Station, CellFloor, CellGraph, CellPlace, CellPower, CellRoute, Centricity, CEOC, CheckMate, CHEOS, Chip Station, ChipGraph,
CommLib, Concurrent Board Process(SM), Concurrent Design Environment, Connectivity Dataport, Continuum, Continuum Power Analyst,
CoreAlliance, CoreBIST, Core Builder, Core Factory, CTIntegrator, DataCentric Model, DataFusion, Datapath, Data Solvent, dBUG, Debug
Detective, DC Analyzer, Design Architect, Design Architect Elite, DesignBook, Design Capture, Design Manager, Design Station, DesignView,
DesktopASIC, Destination PCB, DFTAdvisor, DFTArchitect, DFTInsight, DirectConnect(SM), DSV, Direct System Verification, DSV,
Documentation Station, DSS (Decision Support System), ECO Immunity(SM), EDT, Eldo, EldoNet, ePartners, EParts, E3LCable, EDGE (Engineering
Design Guide for Excellence)(SM), Empowering Solutions, Engineer’s Desktop, EngineerView, ENRead, ENWrite, ESim, Exemplar, Exemplar
Logic, Expedition, Expert2000(SM), Explorer CAECO Layout, Explorer CheckMate, Explorer Datapath, Explorer Lsim, Explorer Lsim-C, Explorer
Lsim-S, Explorer Ltime, Explorer Schematic, Explorer VHDLsim, ExpressI/O, FabLink, Falcon, Falcon Framework, FastScan, FastStart,
FastTrack Consulting(SM), First-Pass Design Success, First-Pass success(SM), FlexSim, FlexTest, FDL (Flow Definition Language), FlowTabs,
FlowXpert, FORMA, FormalPro, FPGA Advantage, FPGAdvisor, FPGA BoardLink, FPGA Builder, FPGASim, FPGA Station, FrameConnect,
Galileo, Gate Station, GateGraph, GatePlace, GateRoute, GDT, GDT Core, GDT Designer, GDT Developer, GENIE, GenWare, Geom Genie,
HDL2Graphics, HDL Architect, HDL Architect Station, HDL Author, HDL Designer, HDL Designer Series, HDL Detective, HDL Inventor, HDL
Pilot, HDL Processor, HDL Sim, HDLWrite,Hardware Modeling Library, HIC rules, Hierarchical Injection, Hierarchy Injection, HotPlot, Hybrid
Designer, Hybrid Station, IC Design Station, IC Designer, IC Layout Station, IC Station, ICbasic, ICblocks, ICcheck, ICcompact, ICdevice,
ICextract, ICGen, ICgraph, ICLink, IClister, ICplan, ICRT Controller Lcompiler, ICrules, ICtrace, ICverify, ICview, ICX, ICX Active, ICX
Custom Model, ICX Custom Modeling, ICX Plan, ICX Pro, ICX Project Modeling, ICX Sentry, ICX Standard Library, ICX Verify, ICX Vision,
IDEA Series, Idea Station, INFORM, IFX, Inexia, Integrated Product Development, Integra Station, Integration Tool Kit, INTELLITEST,
Interactive Layout, Interconnect Table, Interface-Based Design, IBD, IntraStep(SM), Inventra, InventraIPX, Inventra Soft Cores, IP Engine , IP
Evaluation Kit, IP Factory, IP -PCB, IP QuickUse, IPSim, IS_Analyzer, IS_Floorplanner, IS_MultiBoard, IS_Optimizer, IS_Synthesizer, ISD
Creation(SM), ITK, It's More than Just Tools(SM), Knowledge Center(SM), Knowledge-Sourcing(SM), LAYOUT, LNL, LBIST, LBISTArchitect,
Language Neutral Licensing, Lc, Lcore, Leaf Cell Toolkit, Led, LED LAYOUT, Leonardo, LeonardoInsight, LeonardoSpectrum, LIBRARIAN,
Library Builder, Logic Analyzer on a Chip(SM), Logic Builder, Logical Cable, LogicLib, logio, Lsim, Lsim DSM, Lsim-Gate, Lsim Net, Lsim
Power Analyst, Lsim-Review, Lsim-Switch, Lsim-XL, Mach PA, Mach TA, Manufacture View, Manufacturing Advisor, Manufacturing Cable,
MaskCompose, MaskPE, MBIST, MBISTArchitect, MCM Designer, MCM Station, MDV, MegaFunction, Memory Builder, Memory Builder
Conductor, Memory Builder Mozart, Memory Designer, Memory Model Builder, Mentor, Mentor Graphics, Mentor Graphics Support CD(SM), Mentor
Graphics SupportBulletin(SM), Mentor Graphics SupportCenter(SM), Mentor Graphics SupportFax(SM), Mentor Graphics SupportNet-Email(SM), Mentor Graphics
SupportNet-FTP(SM), Mentor Graphics SupportNet-Telnet(SM), Mentor Graphics We Mean Business, MicroPlan, MicroRoute, Microtec, Mixed-Signal
Pro, ModelEditor, ModelSim, ModelSim LNL, ModelSim VHDL, ModelSim VLOG, ModelSim SE, ModelStation, Model Technology,
ModelViewer, ModelViewerPlus, MODGEN, Monet, Mslab, Msview, MS Analyzer, MS Architect, MS-Express, MSIMON, MTPI(SM),
Nanokernel, NetCheck, NETED, Online Knowledge Center(SM), OpenDoor(SM), Opsim, OutNet, P&RIntegrator, PACKAGE, PARADE,
ParallelRoute-Autocells, ParallelRoute-MicroRoute, PathLink, Parts SpeciaList, PCB-Gen, PCB-Generator, PCB IGES, PCB Mechanical Interface,
PDLSim, Personal Learning Program, Physical Cable, Physical Test Manager:SITE, PLA Lcompiler, Platform Express, PLDSynthesis, PLDSynthesis
II, Power Analyst, PowerAnalyst Station, Power To Create, Precision, Precision Synthesis, Precision HLS, Precision PNR, Precision PTC, PreSilicon, ProjectXpert, ProtoBoard, ProtoView, QNet, QualityIBIS, QuickCheck, QuickConnect, QuickFault, QuickGrade, QuickHDL,
QuickHDL Express, QuickHDL Pro, QuickPart Builder, QuickPart Tables, QuickParts, QuickPath, QuickSim, QuickSimII, QuickStart, QuickUse,
QuickVHDL, RAM Lcompiler, RC-Delay, RC-Reduction, RapidExpert, REAL Time Solutions!, Registrar, Reinstatement 2000(SM), Reliability
Advisor, Reliability Manager, REMEDI, Renoir, RF Architect, RF Gateway, RISE, ROM Lcompiler, RTL X-Press, Satellite PCB Station,
ScalableModels, Scaleable Verification, SCAP, Scan-Sequential, Scepter, Scepter DFF, Schematic View Compiler, SVC, Schemgen, SDF (Software
Data Formatter), SDL2000 Lcompiler, Seamless, Seamless C-Bridge, Seamless Co-Designer, Seamless CVE, Seamless Express, Selective Promotion,
SignaMask OPC, Signal Spy, Signal Vision, Signature Synthesis, Simulation Manager, SimExpress, SimPilot, SimView, SiteLine2000(SM),
SmartMask, SmartParts, SmartRouter, SmartScripts, Smartshape, SNX, SneakPath Analyzer, SOS Initiative, Source Explorer, SpeedGate,
SpeedGate DSV, SpiceNet, SST Velocity, Standard Power Model Format (SPMF), Structure Recovery, Super C, Super IC Station, Support Services
BaseLine(SM), Support Services ClassLine(SM), Support Services Latitudes(SM), Support Services OpenLine(SM), Support Services PrivateLine(SM), Support
Services SiteLine(SM), Support Services TechLine(SM), Support Services RemoteLine(SM), Symbol Genie, Symbolscript, SYMED, SynthesisWizard,
System Architect, System Design Station, System Modeling Blocks, Systems on Board Initiative, System Vision, Target Manager, Tau, TeraCell,
TeraPlace, TeraPlace-GF, TechNotes, The Ultimate Tool for HDL Simulation, TestKompress, Test Station, Test Structure Builder, The Ultimate Site
For HDL Simulation, TimeCloser, Timing Builder, TNX, ToolBuilder, TrueTiming, Vlog, V-Express, V-Net, VHDLnet, VHDLwrite,
Verinex, ViewCreator, ViewWare, Virtual Library, Virtual Target, Virtual Test Manager:TOP, VR-Process(SM), VRTX, VRTXmc, VRTXoc,
VRTXsa, VRTX32, Waveform DataPort, We Make TMN Easy, Wiz-o-matic, WorkXpert, xCalibre, xCalibrate, Xconfig, XlibCreator, Xpert,
Xpert API, XpertBuilder, Xpert Dialogs, Xpert Profiler, XRAY, XRAY MasterWorks, XSH, Xtrace, Xtrace Daemon, Xtrace Protocol, Zeelan,
Zero Tolerance Verification, Zlibs
TM-iii
Third-Party Trademarks
The following names are trademarks, registered trademarks, and service marks of other companies that appear in Mentor
Graphics product publications:
Adobe, the Adobe logo, Acrobat, the Acrobat logo, Exchange, FrameMaker, FrameViewer, and PostScript are registered trademarks of Adobe Systems
Incorporated.
Altera is a registered trademark of Altera Corp.
AM188, AMD, AMD-K6, and AMD Athlon Processor are trademarks of Advanced Micro Devices, Inc.
Apple and Laserwriter are registered trademarks of Apple Computer, Inc.
ARIES is a registered trademark of Aries Technology.
AMBA, ARM, ARMulator, ARM7TDMI, ARM7TDMI-S, ARM9TDMI, ARM9E-S, ARM946E-S, ARM966E-S, EmbeddedICE, StrongARM, TDMI, and
Thumb are trademarks or registered trademarks of ARM Limited.
ASAP, Aspire, C-FAS, CMPI, Eldo-FAS, EldoHDL, Eldo-Opt, Eldo-UDM, EldoVHDL, Eldo-XL, Elga, Elib, Elib-Plus, ESim, Fidel, Fideldo, GENIE,
GENLIB, HDL-A, MDT, MGS-MEMT, MixVHDL, Model Generator Series (MGS), Opsim, SimLink, SimPilot, SpecEditor, Success, SystemEldo, VHDeLDO
and Xelga are registered trademarks of ANACAD Electrical Engineering Software, a unit of Mentor Graphics Corporation.
Avant! and Star-Hspice are trademarks of Avant! Corporation.
AVR is a registered trademark of Atmel Corporation.
Cadence, Affirma signalscan, Allegro, Analog Artist, Composer, Concept, Design Planner, Dracula, GDSII, GED, HLD Systems, Leapfrog, Logic DP, NCVerilog, OCEAN, Physical DP, Pillar, Silicon Ensemble, Spectre, Verilog, Verilog XL, Veritime, and Virtuoso are trademarks or registered trademarks of
Cadence Design Systems, Inc.
CAE+Plus and ArchGen are registered trademarks of Cynergy System Design.
CalComp is a registered trademark of CalComp, Inc.
Canon is a registered trademark of Canon, Inc. BJ-130, BJ-130e, BJ-330, and Bubble Jet are trademarks of Canon, Inc.
Centronics is a registered trademark of Centronics Data Computer Corporation.
ColdFire and M-Core are registered trademarks of Motorola, Inc.
Ethernet is a registered trademark of Xerox Corporation.
Foresight and Foresight Co-Designer are trademarks of Nu Thena Systems, Inc.
FLEXlm is a trademark of Globetrotter Software, Inc.
GenCAD is a trademark of Teradyne Inc.
Hewlett-Packard (HP), LaserJet, MDS, HP-UX, PA-RISC, APOLLO, DOMAIN and HPare registered trademarks of Hewlett-Packard Company.
HCL-eXceed and HCL-eXceed/W are registered trademark of Hummingbird Communications. Ltd.
HyperHelp is a trademark of Bristol Technology Inc.
Installshield is a registered trademark and service mark of InstallShield Corporation.
IBM, PowerPC, and RISC Systems/6000 are trademarks of International Business Machines Corporation.
I-DEAS and UG/Wiring are registered trademarks of Electronic Data Systems Corporation.
IKON is a trademark of Tahoma Technology.
IKOS and Voyager are registered trademarks of IKOS Systems, Inc.
Imagen, QMS, QMS-PS 820, Innovator, and Real Time Rasterization are registered trademarks of MINOLTA-QMS Inc. imPRESS and UltraScript are
trademarks of MINOLTA-QMS Inc.
ImageGear is a registered trademark of AccuSoft Corporation.
Infineon, TriCore, and C165 are trademarks of Infineon Technologies AG.
Intel, i960, i386, and i486 are registered trademarks of Intel Corporation.
Java and all Java-based trademarks and logos are trademarks or registered trademarks of Sun Microsystems, Inc.
Linux is a registered trademark of Linus Torvalds.
MemoryModeler MemMaker are trademarks of Denali Software, Inc.
MIPS is a trademark of MIPS Technologies, Inc.
MS-DOS, Windows 95, Windows 98, Windows 2000, and Windows NT are registered trademarks of Microsoft Corporation.
MULTI is a registered trademark of Green Hills Software, Inc.
NEC and NEC EWS4800 are trademarks of NEC Corp.
Netscape is a trademark of Netscape Communications Corporation.
Novas, Debussy, and nWave are trademarks or registered trademarks of Novas Software, Inc.
OakDSPCore is a registered trademark for DSP Group, Inc.
Oracle, Oracle8i, and SQL*Plus are trademarks or registered trademarks of Oracle Corporation.
PKZIP is a registered trademark of PKWARE, Inc.
Pro/CABLING and HARNESSDESIGN are trademarks or registered trademarks of Parametric Technology Corporation.
Quantic is a registered trademark of Quantic EMC Inc.
QUASAR is a trademark of ASM Lithography Holding N.V.
Red Hat is a registered trademark of Red Hat Software, Inc.
TM-iv
SCO and the SCO logo are trademarks or registered trademarks of Caldera International, Inc.
Sneak Circuit Analysis Tool (SCAT) is a registered trademark of SoHaR Incorporated.
SPARC is a registered trademark, and SPARCstation is a trademark, of SPARC International, Inc.
Sun Microsystems, Sun Workstation, and NeWS are registered trademarks of Sun Microsystems, Inc. Sun, Sun-2, Sun-3, Sun-4, OpenWindows, SunOS,
SunView, NFS, and NSE are trademarks of Sun Microsystems, Inc.
SuperH is a trademark of Hitachi, Ltd.
Synopsys, Design Compiler, DesignWare, Library Compiler, LM-family, PrimeTime, SmartModel, Speed-Model, Speed Modeling, SimWave, and Chronologic
VCS are trademarks or registered trademark of Synopsys, Inc.
TASKING is a registered trademark of Altium Limited.
Teamwork is a registered trademark of Computer Associates International, Inc.
Tensilica and Xtensa are registered trademarks of Tensilica, Inc.
Times and Helvetica are registered trademarks of Linotype AG.
TimingDesigner and QuickBench are registered trademarks of Forte Design Systems
Tri-State, Tri-State Logic, tri-state, and tri-state logic are registered trademarks of National Semiconductor Corporation.
UNIX, Motif, and OSF/1 are registered trademarks of The Open Group in the United States and other countries.
Versatec is a trademark of Xerox Engineering Systems, Inc.
ViewDraw, Powerview, Motive, and PADS-Perform are registered trademarks of Innoveda, Inc. Crosstalk Toolkit (XTK), Crosstalk Field Solver (XFX), PreRoute Delay Quantifier (PDQ), and Mentor Graphics Board Station Translator (MBX) are trademarks of Innoveda, Inc.
Visula is a registered trademark of Zuken-Redac.
VxSim, VxWorks and Wind River Systems are trademarks or registered trademarks of Wind River Systems, Inc.
XVision is a registered trademark of Tarantella, Inc.
X Window System is a trademark of MIT (Massachusetts Institute of Technology).
Z80 is a registered trademark of Zilog, Inc.
ZSP and ZSP400 are trademarks of LSI Logic Corporation.
Other brand or product names that appear in Mentor Graphics product publications are trademarks or registered trademarks of
their respective holders.
Updated 2/13/02
TM-v
TM-vi
Table of Contents
TABLE OF CONTENTS
Trademark Information .......................................................................................iii
About This Training Workbook .........................................................................xv
Audience ..............................................................................................................xv
What this course is not .........................................................................................xv
Prerequisite Knowledge .......................................................................................xv
About the References ..........................................................................................xvi
Module 1
Review: ModelSim Windows ..............................................................................1-1
Module Overview ...............................................................................................1-2
User Interface ......................................................................................................1-3
Common Window Features ................................................................................1-6
Main Window .....................................................................................................1-7
Project Tab ..........................................................................................................1-9
Library Tab .......................................................................................................1-11
Simulation Tab ..................................................................................................1-12
Multiple Datasets ..............................................................................................1-13
Source Window ................................................................................................1-14
Language Templates .........................................................................................1-16
Signals Window ................................................................................................1-18
Process Window ...............................................................................................1-20
Dataflow Window .............................................................................................1-21
Dataflow Window — Chase X .........................................................................1-24
Variables Window ............................................................................................1-26
Wave Window ..................................................................................................1-28
List Window .....................................................................................................1-32
ModelSim Help .................................................................................................1-35
Summary ...........................................................................................................1-36
Lab 1: Simulation and Debugging with the Dataflow Window .......................1-37
ModelSim Advanced Debugging
December 2002
vii
Table of Contents
TABLE OF CONTENTS (Cont.)
Module 2
Tcl/Tk Overview ..................................................................................................2-1
Module Overview ...............................................................................................2-2
Why Tcl/Tk? .......................................................................................................2-3
Tcl Overview ......................................................................................................2-4
Tk Overview .......................................................................................................2-5
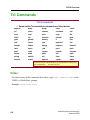
Tcl Commands ....................................................................................................2-6
Basic Tcl Syntax .................................................................................................2-7
Tcl Variables .......................................................................................................2-8
Command Substitution .......................................................................................2-9
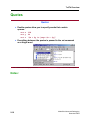
Quotes ...............................................................................................................2-10
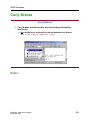
Curly Braces .....................................................................................................2-11
Control Structures .............................................................................................2-12
Simulation Commands ......................................................................................2-13
Tcl Script Example ...........................................................................................2-14
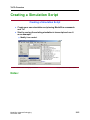
Creating a Simulation Script .............................................................................2-15
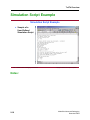
Simulation Script Example ...............................................................................2-16
Tk Widget Overview ........................................................................................2-17
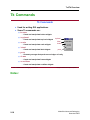
Tk Commands ...................................................................................................2-18
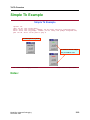
Simple Tk Example ..........................................................................................2-19
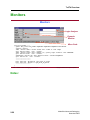
Monitors ............................................................................................................2-20
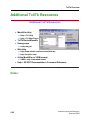
Additional Tcl/Tk Resources ............................................................................2-22
Summary ...........................................................................................................2-23
Lab 2: Using Tcl Scripts and Tk Widgets in Simulation ..................................2-24
Module 3
Test Benches .........................................................................................................3-1
Module Overview ...............................................................................................3-2
Functions .............................................................................................................3-3
Implementation ...................................................................................................3-4
viii
ModelSim Advanced Debugging
December 2002
Table of Contents
TABLE OF CONTENTS (Cont.)
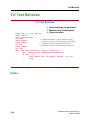
Comparison of Different Test Bench Methods ...................................................3-5
HDL Test Benches ..............................................................................................3-6
VHDL Test Benches, Design Units in Verilog ..................................................3-7
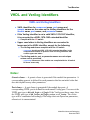
VHDL and Verilog Identifiers ............................................................................3-8
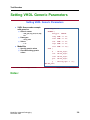
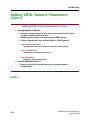
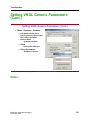
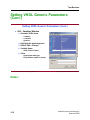
Setting VHDL Generic Parameters ....................................................................3-9
C Test Benches .................................................................................................3-13
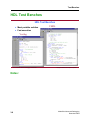
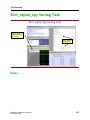
Tcl Test Benches ...............................................................................................3-14
Interactive GUI Test Benches ...........................................................................3-15
3rd Party Test Benches .....................................................................................3-16
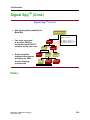
Signal SpyTM ...................................................................................................3-17
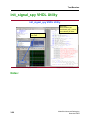
init_signal_spy VHDL Utility ..........................................................................3-20
$init_signal_spy Verilog Task ..........................................................................3-21
Summary ...........................................................................................................3-22
Lab 3a: Tcl/Tk Testbench .................................................................................3-23
Lab 3b: Signal Spy ............................................................................................3-27
Module 4
Analyzing Performance ......................................................................................4-1
Module Overview ...............................................................................................4-2
Challenges ...........................................................................................................4-3
Code Coverage — Integrated Line Coverage .....................................................4-4
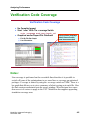
Verification Code Coverage ...............................................................................4-5
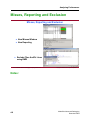
Misses, Reporting and Exclusion .......................................................................4-6
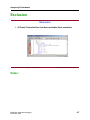
Exclusion ............................................................................................................4-7
Managing Coverage Data ...................................................................................4-8
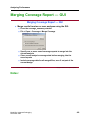
Merging Coverage Report — GUI .....................................................................4-9
Performance Analyzer ......................................................................................4-10
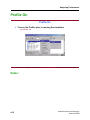
Profile On ..........................................................................................................4-12
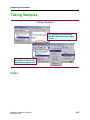
Taking Samples ................................................................................................4-13
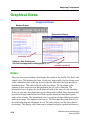
Graphical Views ...............................................................................................4-14
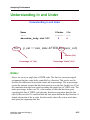
Understanding In and Under .............................................................................4-15
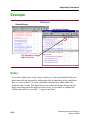
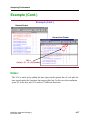
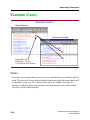
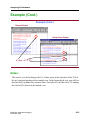
Example ............................................................................................................4-16
ModelSim Advanced Debugging
December 2002
ix
Table of Contents
TABLE OF CONTENTS (Cont.)
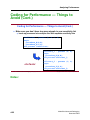
Coding for Performance — Things to Avoid ...................................................4-20
Faster Verilog Simulations ...............................................................................4-23
Verilog Gate-Level ...........................................................................................4-24
vlog Commands ................................................................................................4-26
vlog Commands for Gate-Level Simulation .....................................................4-28
vlog Commands for RTL Simulation ...............................................................4-30
vlog Commands ................................................................................................4-31
vcom Commands ..............................................................................................4-32
Using Elaboration Files ....................................................................................4-33
General Performance Issues .............................................................................4-35
Summary ...........................................................................................................4-37
Lab 4: Analyzing Performance .........................................................................4-38
Module 5
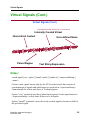
Virtual Signals .....................................................................................................5-1
Module Overview ...............................................................................................5-2
Virtual Objects ....................................................................................................5-3
Virtual Signals ....................................................................................................5-4
Virtual Regions ...................................................................................................5-9
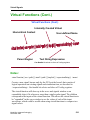
Virtual Functions ..............................................................................................5-10
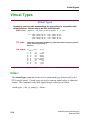
Virtual Types ....................................................................................................5-14
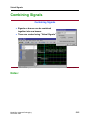
Combining Signals ............................................................................................5-15
Summary ...........................................................................................................5-16
Module 6
Waveform Compare ............................................................................................6-1
Module Overview ...............................................................................................6-2
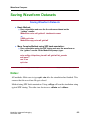
Saving Waveform Datasets .................................................................................6-3
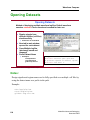
Opening Datasets ................................................................................................6-4
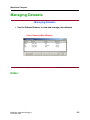
Managing Datasets ..............................................................................................6-5
x
ModelSim Advanced Debugging
December 2002
Table of Contents
TABLE OF CONTENTS (Cont.)
Compare Datasets Using Waveform Compare ...................................................6-6
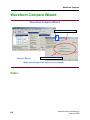
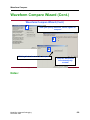
Waveform Compare Wizard ...............................................................................6-8
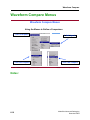
Waveform Compare Menus ..............................................................................6-10
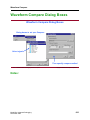
Waveform Compare Dialog Boxes ...................................................................6-11
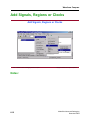
Add Signals, Regions or Clocks .......................................................................6-12
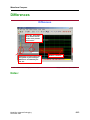
Differences ........................................................................................................6-13
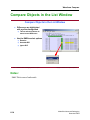
Compare Objects in the List Window ..............................................................6-14
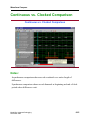
Continuous vs. Clocked Comparison ...............................................................6-15
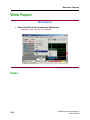
Write Report .....................................................................................................6-16
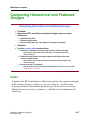
Comparing Hierarchical and Flattened Designs ...............................................6-17
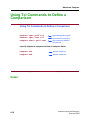
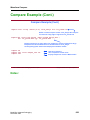
Using Tcl Commands to Define a Comparison ................................................6-18
Tcl Compare Command ....................................................................................6-19
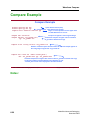
Compare Example ............................................................................................6-20
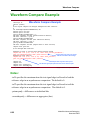
Waveform Compare Example ..........................................................................6-22
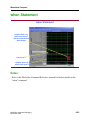
when Statement .................................................................................................6-23
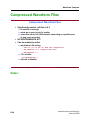
Compressed Waveform Files ............................................................................6-24
Disable/Enable Pop-up .....................................................................................6-25
Summary ...........................................................................................................6-26
Lab 6: Waveform Compare ..............................................................................6-27
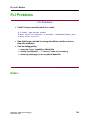
Module 7
FLI and C Models ...............................................................................................7-1
Module Overview ...............................................................................................7-2
What Is FLI? .......................................................................................................7-3
Why FLI? ...........................................................................................................7-5
Who is Using FLI? ..............................................................................................7-7
Benefits of C Interface ........................................................................................7-8
FLI C Functions .................................................................................................7-9
FLI Callbacks ...................................................................................................7-11
Hierarchy Scanning ..........................................................................................7-13
Signals and Variables .......................................................................................7-16
Utilities .............................................................................................................7-19
ModelSim Advanced Debugging
December 2002
xi
Table of Contents
TABLE OF CONTENTS (Cont.)
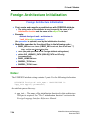
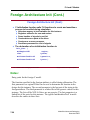
Foreign Architecture Initialization ...................................................................7-24
Mapping Data Types .........................................................................................7-27
Enumerations, Reals and Time .........................................................................7-29
Arrays ...............................................................................................................7-30
Using Checkpoint and Restore With FLI .........................................................7-31
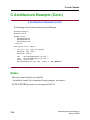
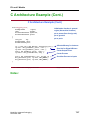
C Architecture Example ..................................................................................7-35
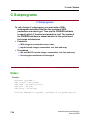
C Subprograms .................................................................................................7-38
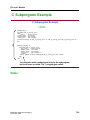
C Subprogram Example ...................................................................................7-39
Enums and Arrays .............................................................................................7-41
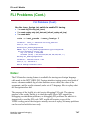
FLI Problems ....................................................................................................7-43
Debugging/Tracing ...........................................................................................7-44
Other Examples ................................................................................................7-48
Summary ...........................................................................................................7-49
Lab 7: FLI Bug in C Code ................................................................................7-50
Module 8
Debugging ............................................................................................................8-1
Module Overview ...............................................................................................8-2
When to Debug? .................................................................................................8-3
Debugging Tasks ................................................................................................8-4
Breakpoints .........................................................................................................8-5
Checkpoint and Restore ......................................................................................8-6
Bus Checks .........................................................................................................8-7
Toggle and Stability Checking ...........................................................................8-8
Verification .........................................................................................................8-9
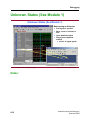
Unknown States (See Module 1) ......................................................................8-10
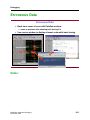
Erroneous Data .................................................................................................8-11
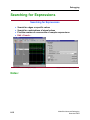
Searching for Expressions ................................................................................8-12
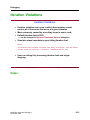
Iteration Violations ...........................................................................................8-13
Mixed Language Issues ....................................................................................8-15
Issues With SDF Instance Specification ...........................................................8-17
SDF Instance Specification ...............................................................................8-18
xii
ModelSim Advanced Debugging
December 2002
Table of Contents
TABLE OF CONTENTS (Cont.)
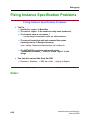
Fixing Instance Specification Problems ...........................................................8-20
Generics Mismatches ........................................................................................8-21
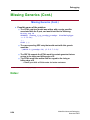
Missing Generics ..............................................................................................8-22
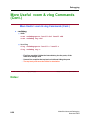
More Useful vcom & vlog Commands .............................................................8-25
Summary ...........................................................................................................8-27
Lab 8: Debug ....................................................................................................8-28
Module 9
Debug Detective ...................................................................................................9-1
Module Overview ...............................................................................................9-2
Design Analysis ..................................................................................................9-3
Debug Detective Option for ModelSim ..............................................................9-5
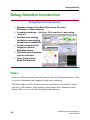
Debug Detective Introduction .............................................................................9-6
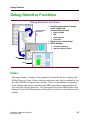
Debug Detective Functions .................................................................................9-7
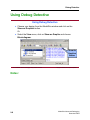
Using Debug Detective .......................................................................................9-8
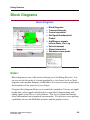
Block Diagrams ..................................................................................................9-9
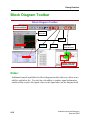
Block Diagram Toolbar ....................................................................................9-10
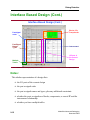
Interface Based Design .....................................................................................9-11
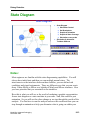
State Diagram ...................................................................................................9-13
Flow Chart ........................................................................................................9-15
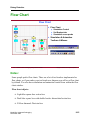
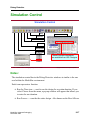
Simulation Control ............................................................................................9-17
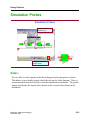
Simulation Probes .............................................................................................9-19
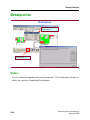
Breakpoints .......................................................................................................9-20
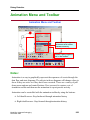
Animation Menu and Toolbar ..........................................................................9-21
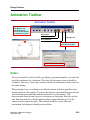
Animation Toolbar ............................................................................................9-23
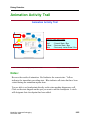
Animation Activity Trail ..................................................................................9-25
Summary ...........................................................................................................9-26
Lab 9: Debug Detective Tutorial (Optional Lab) .............................................9-27
ModelSim Advanced Debugging
December 2002
xiii
Table of Contents
TABLE OF CONTENTS (Cont.)
xiv
ModelSim Advanced Debugging
December 2002
About This Training Workbook
About This Training Workbook
This document is the ModelsSim Advanced Debugging training workbook, which
teaches students the advanced debugging concepts and techniques available using
the Mentor Graphics ModelSim tool.
Audience
The information in this course is intended for HDL designers who have some
prior knowledge of the ModelSim tool, and are seeking to broaden their
knowledge of advanced debugging techniques using ModelSim. It is assumed that
the student has some prior design experience.
What this course is not
• An exhaustive examination of design flow. Instead, this course explores
advanced simulation debugging techniques using ModelSim.
• An explanation of FPGA or ASIC technology, HDL language constructs or
design.
• An introduction to ModelSim.
Prerequisite Knowledge
• Students should have some prior knowledge of the ModelSim tool.
• Students should have the ability to read, write, and understand HDL code.
• Students should understand schematic digital simulation, and HDL design
concepts.
ModelSim Advanced Debugging
December 2002
xv
About This Training Workbook
• Those students who do not have previous experience with ModelSim are
encouraged to take HDL Simulation With ModelSim.
About the References
The ModelSim tool contains online help and/or the complete online manual set.
Students are encouraged to refer to these materials during the course of the class.
xvi
ModelSim Advanced Debugging
December 2002
Module 1
Review: ModelSim Windows
Objectives
Upon completion of this module, you will be able to:
• List the different windows available in ModelSim.
• Describe some basic features of each window.
• Describe where to go for help.
ModelSim Advanced Debugging
December 2002
1-1
Review: ModelSim Windows
Module Overview
Module Overview
In this module we will discuss:
♦ User Interface
♦ Features Common to All Menus
♦ Individual Window Features
♦ Where to Go for Help
1-2 • ModelSim® Advanced Debugging: ModelSim Windows
Copyright © 2002 Mentor Graphics Corporation
Notes:
1-2
ModelSim Advanced Debugging
December 2002
Review: ModelSim Windows
User Interface
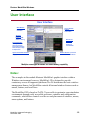
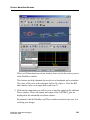
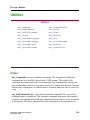
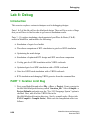
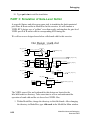
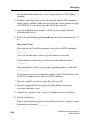
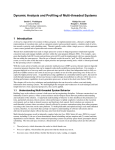
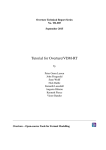
User Interface
Main Window:
controls the
simulation
Structure
Window:
boxes = VHDL
circles = Verilog
Process Window:
VHDL processes &
concurrent signal
assignments; Verilog
initial, always, assign
& implicit wire
Signals & Variables Windows:
display current values of data
Source Window:
editable,
color-coded
Wave & List
Windows:
historical
tracking of
selected data
Dataflow Window: processes
with data read & data driven
Multiple same-type Windows for added debug capability
1-3 • ModelSim® Advanced Debugging: ModelSim Windows
Copyright © 2002 Mentor Graphics Corporation
Notes:
The examples in this module illustrate ModelSim's graphic interface within a
Windows environment; however, ModelSim's UI is designed to provide
consistency across all supported platforms.The OS determines the basic windowmanagement frames, but ModelSim controls all internal window features such as
menus, buttons, and scroll bars.
The ModelSim GUI is based on Tcl/Tk. You are able to customize your simulation
environment through easily accessible preference variables and configuration
commands, which allows control over the use and placement of windows, menus,
menu options, and buttons.
ModelSim Advanced Debugging
December 2002
1-3
Review: ModelSim Windows
The ModelSim simulation and debugging environment consists of nine window
types. Multiple windows of each type can be used during simulation, with the
exception of the Main window. To make additional windows, select
File > New > Window from the Main window.
A brief description of each window follows:
• Main window
The initial window that appears upon startup. All subsequent ModelSim
windows are launched from this one.
• Dataflow window
Displays the physical connectivity of your design and lets you trace events.
• List window
Shows the simulation values of selected VHDL signals and variables and
Verilog nets and register variables in tabular format.
• Process window
Displays a list of processes in the selected design region or selected to run
during the current simulation cycle.
• Signals window
Displays the names and values of VHDL signals, generics and shared
variables along with Verilog nets, register variables, named events and
module parameters in the selected design region.
• Source window
Displays the HDL source code for the design. Your source code may
remain hidden if you wish.
1-4
ModelSim Advanced Debugging
December 2002
Review: ModelSim Windows
• Structure window
Displays the hierarchy of structural elements such as VHDL component
instances, packages, blocks, generate statements, and Verilog model
instances. In ModelSim 5.5 and later, this same information is displayed in
the Main window workspace.
• Variables window
Displays the values of VHDL constants, generics and variables along with
Verilog register variables in the current/selected process.
• Wave window
Displays waveforms and current values for VHDL signals and variables
along with Verilog nets and register variables you have selected. Current
and previous simulations can be compared side-by-side in the Wave
window.
ModelSim Advanced Debugging
December 2002
1-5
Review: ModelSim Windows
Common Window Features
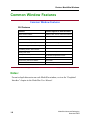
Common Window Features
GUI Features
Feature
Feature applies to these windows
Quick access toolbars
Dataflow, Main, Source and Wave windows
Drag and Drop
All Windows
Command history
Main window command line
Automatic window updating
Dataflow, Process, Signals, Structure
Find, searching for values, locating cursors Various windows
Combining items in List windows
Combining items in Wave window
Wave and List windows
Sorting HDL items
All windows except Dataflow
Multiple window copies
All windows except Main window
Menu tear off
All windows
Customizing menus and buttons
All windows
Tree window hierarchical view
Structure, Signals, Variables, Wave
1-4 • ModelSim® Advanced Debugging: ModelSim Windows
Copyright © 2002 Mentor Graphics Corporation
Notes:
For an in-depth discussion on each ModelSim window, review the “Graphical
Interface” chapter in the ModelSim User Manual.
1-6
ModelSim Advanced Debugging
December 2002
Review: ModelSim Windows
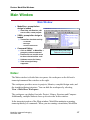
Main Window
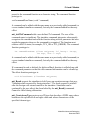
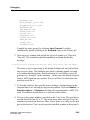
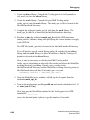
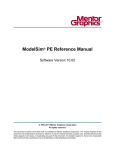
Main Window
♦ ModelSim > prompt before
design is loaded
●
View Help, edit libraries, edit
source code, create projects
♦ VSIM > prompt after design is
loaded
●
Transcribes simulator activity
– Commands
– Messages
– Assertion Statements
♦ Command Editing
●
●
●
●
Click on VSIM > or ModelSim >
prompt to retrieve command
Double-click on compile errors
to show relevant source code
Up/down arrows for history
!cmd unix-style history
supported
1-5 • ModelSim® Advanced Debugging: ModelSim Windows
Project/Library/Sim Tabs
Different views of Design
Copyright © 2002 Mentor Graphics Corporation
Notes:
The Main window is divided into two panes: the workspace on the left and a
transcript/command line window on the right.
The workspace provides access to projects, libraries, compiled design units, and
the simulation/dataset structure. You can hide the workspace by selecting
View > Hide/Show Workspace.
The workspace can display four tabs: Project, Library, Structure and Compare.
Additionally, multiple datasets show up as extra tabs in this window.
In the transcript portion of the Main window, ModelSim maintains a running
transcript history of commands. When you are running a simulation, ModelSim
ModelSim Advanced Debugging
December 2002
1-7
Review: ModelSim Windows
displays a VSIM prompt, which enables you to interactively enter commands
within the graphic interface.
Variable settings determine the filename used for saving the Main window
transcript. Setting the PrefMain and/or TranscriptFile in modelsim.ini logs
output to the specific file. The default is in the modelsim.ini is set to "transcript".
You can use the saved transcript file as a macro (DO file).
1-8
ModelSim Advanced Debugging
December 2002
Review: ModelSim Windows
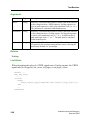
Project Tab
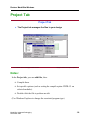
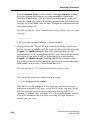
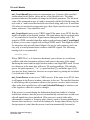
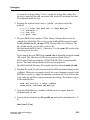
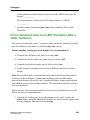
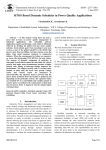
Project Tab
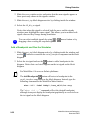
♦ The Project tab manages the files in your design
1-6 • ModelSim® Advanced Debugging: ModelSim Windows
Copyright © 2002 Mentor Graphics Corporation
Notes:
In the Project tab, you can add files, then:
• Compile them.
• Set specific options (such as setting the compile option VHDL-93 on
selected modules).
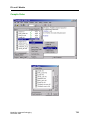
• Double-click the file to perform an edit.
(Use Windows Explorer to change the associated program type)
ModelSim Advanced Debugging
December 2002
1-9
Review: ModelSim Windows
Files can be any type:
• SDF
• Waveform
• Text documents (Tcl, Do, txt, etc.)
• Spreadsheets
• C/C++
• Verilog
• VHDL
1-10
ModelSim Advanced Debugging
December 2002
Review: ModelSim Windows
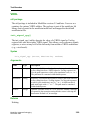
Library Tab
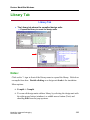
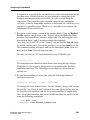
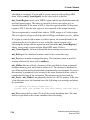
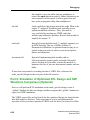
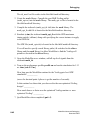
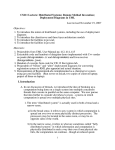
Library Tab
♦ The Library tab shows the compiled design units
●
Expand the library to reveal the design units
1-7 • ModelSim® Advanced Debugging: ModelSim Windows
Copyright © 2002 Mentor Graphics Corporation
Notes:
Click on the '+' sign in front of the library name to expand the library. Refresh or
recompile from here. Double-clicking on a design unit loads it for simulation.
Menu options:
• Compile > Compile
• You can edit design units within a library by selecting the design unit with
the right mouse button (windows) or middle mouse button (Unix) and
choosing Edit from the pop-up menu.
ModelSim Advanced Debugging
December 2002
1-11
Review: ModelSim Windows
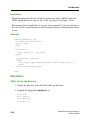
Simulation Tab
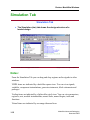
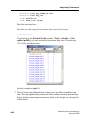
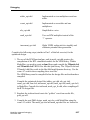
Simulation Tab
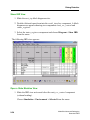
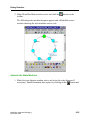
♦ The Simulation (sim) tab shows the design structure of a
loaded design
1-8 • ModelSim® Advanced Debugging: ModelSim Windows
Copyright © 2002 Mentor Graphics Corporation
Notes:
From the Simulation Tab you can drag and drop regions and/or signals to other
windows.
VHDL items are indicated by a dark blue square icon. You can view signals,
variables, component instantiations, generate statements, block statements and
packages.
Verilog items are indicated by a lighter blue circle icon. You can view parameters,
registers, nets, module instantiations, named forks, named begins, tasks and
functions.
Virtual items are indicated by an orange diamond icon.
1-12
ModelSim Advanced Debugging
December 2002
Review: ModelSim Windows
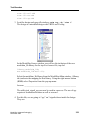
Multiple Datasets
Multiple Datasets
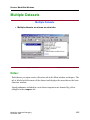
♦ Multiple datasets are shown as extra tabs
1-9 • ModelSim® Advanced Debugging: ModelSim Windows
Copyright © 2002 Mentor Graphics Corporation
Notes:
Each dataset you open creates a Structure tab in the Main window workspace. The
tab is labeled with the name of the dataset and displays the same data as the basic
Structure window.
Signal pathnames included in a waveform comparison are denoted by yellow
triangles in the compare tab.
ModelSim Advanced Debugging
December 2002
1-13
Review: ModelSim Windows
Source Window
Source Window
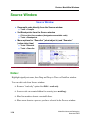
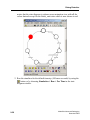
♦ Recompile code directly from the Source window
●
Tools > Compile
♦ Set Breakpoints from the Source window
●
●
Click on blue line numbers (designates executable code)
Tools > Breakpoints
♦ Menu options for “Describe” (what object is) and “Examine”
(value object has)
●
●
Tools > Examine
Tools > Describe
1-10 • ModelSim® Advanced Debugging: ModelSim Windows
Copyright © 2002 Mentor Graphics Corporation
Notes:
Highlight signal/port name, then Drag and Drop to Wave or Dataflow window.
You can edit code from Source window:
• Remove "read only" option first Edit > read only.
• Source code can remain hidden for security (use -nodebug).
• Blue line numbers denote executable lines.
• Blue arrow denotes a process you have selected in the Process window.
1-14
ModelSim Advanced Debugging
December 2002
Review: ModelSim Windows
• Red diamonds denote file-line breakpoints.
• Hollow diamonds denote disabled file-line breakpoints.
• File tabs represent open files.
• Template pane displays Language Templates.
ModelSim Advanced Debugging
December 2002
1-15
Review: ModelSim Windows
Language Templates
Language Templates
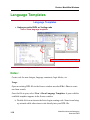
♦ Helps you write VHDL or Verilog code
View > Show language templates
Collection of wizards, menus, and dialogs
1-11 • ModelSim® Advanced Debugging: ModelSim Windows
Copyright © 2002 Mentor Graphics Corporation
Notes:
Create code for new designs, language constructs, logic blocks, etc.
Usage:
Open an existing HDL file in the Source window or select File > New to create
one from scratch.
Once the file is open, select View > Show Language Templates. A pane with the
available templates appears in the Source window.
• Double click on an item in the list to begin creating code. Some items bring
up wizards while others insert code directly into your HDL file.
1-16
ModelSim Advanced Debugging
December 2002
Review: ModelSim Windows
• Code that is inserted into your existing code may contain yellow or gray
highlighted "fields".
o Yellow highlighting indicates a field that needs a name. Double-
clicking the yellow object enables you to enter the name. Note that all
yellow objects with the same label (e.g. "block_label") will change to
whatever name you enter. This ensures matching fields remain in
synch.
o Gray highlighting indicates that a context menu with additional
commands is available.
ModelSim Advanced Debugging
December 2002
1-17
Review: ModelSim Windows
Signals Window
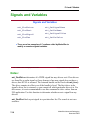
Signals Window
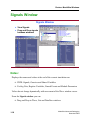
♦ View Signals
♦ Drag and Drop signals
between windows
1-12 • ModelSim® Advanced Debugging: ModelSim Windows
Copyright © 2002 Mentor Graphics Corporation
Notes:
Displays the names and values at the end of the current simulation run.
• VHDL Signals, Generics and Shared Variables
• Verilog Nets, Register Variables, Named Events and Module Parameters
Values do not change dynamically with movement of the Wave window cursor.
From the Signals window you can:
• Drag and Drop to Wave, List and Dataflow windows
1-18
ModelSim Advanced Debugging
December 2002
Review: ModelSim Windows
• Force: Apply Stimulus
• Filter: Choose signal types for viewing (inout, etc)
• View Declarations
• Set Breakpoints
• Structure window and Signals window are linked. Change signals view by
clicking on a different region in the Structure window.
Selecting HDL item types to view
The View > Filter menu selection allows you to specify which HDL items are
shown in the Signals window. Multiple options can be selected.
Forcing signal and net values
The Edit > Force command displays a dialog box that allows you to apply
stimulus to the selected signal or net. Multiple signals can be selected and forced.
The force dialog box remains open until all signals are either forced, skipped or
until the dialog box is closed. To cancel a force command, use the
Edit > NoForce command, or issue the force command from the command line
prompt.
ModelSim Advanced Debugging
December 2002
1-19
Review: ModelSim Windows
Process Window
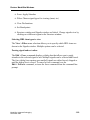
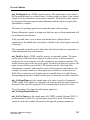
Process Window
♦ Active/ In-Region Processes
♦ Drag and Drop
●
Place all variables of process
into another window
♦ Click on Process
●
●
●
View next statement to be
executed
Local process variables
displayed in window
Select which process of
pending processes to execute
next
♦ Process Status
●
●
●
1-13 • ModelSim® Advanced Debugging: ModelSim Windows
<Ready> ready to execute
<Wait> scheduled for later
<Done> already executed
Copyright © 2002 Mentor Graphics Corporation
Notes:
The Process window shows all active pending processes or all processes in
current region.
Select View > Active to see all processes scheduled to run during the current
simulation cycle.
Select View > In Region to see those processes in the currently selected region
only.
Selecting a process in the Process window updates the Dataflow, Signals, Source,
Structure and Variables window.
1-20
ModelSim Advanced Debugging
December 2002
Review: ModelSim Windows
Dataflow Window
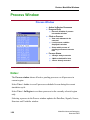
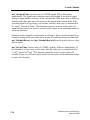
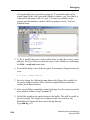
Dataflow Window
♦ Explore physical connectivity of design
♦ Trace events that propagate through design
♦ Identify cause of unexpected outputs
The embedded wave viewer helps you to
trace the cause of an unexpected output
1-14 • ModelSim® Advanced Debugging: ModelSim Windows
Copyright © 2002 Mentor Graphics Corporation
Notes:
The Dataflow window allows you to explore the physical connectivity of your
design.
You can expand the view from process to process which allows you to see the
drivers/receivers of a particular signal, net or register.
Use menu commands, buttons on the toolbar or your mouse to expand the view of
your design.
To expand with the mouse, simply double-click a signal, register or process.
Depending on the item you click the view will expand to show the driving process
and interconnect, the reading process and interconnect, or both.
ModelSim Advanced Debugging
December 2002
1-21
Review: ModelSim Windows
Alternatively, you can select a signal, register or net and use one of the toolbar
buttons or menu commands.
As you expand a view, the "layout" of the design may adjust to best show the
connectivity.
You can quickly transverse through many components in your design. To help
mark the path, the items you have expanded are marked (highlighted) in green.
The Embedded Wave Viewer
The embedded wave viewer closely resembles, in appearance and operation, the
stand-alone Wave window. Access the embedded wave viewer by using the
View > Show Wave command, or clicking on the wave viewer icon in the
dataflow window.
When you place and move cursors in the embedded wave window, the signal
values update in the Dataflow pane.
Another scenario is to select a process in the Dataflow pane, which automatically
adds all the signals attached in the process into the wave viewer pane.
You can find items by name by selecting Edit > Find
Symbol Mapping
An interesting factoid useful for those engineers who want to create their own
symbols:
The Dataflow window has built-in mappings for all Verilog primitives. For
components other than Verilog primitives, you can define a mapping between
processes and built-in symbols. This is done through a file containing name pairs,
one per line, where the first name is the concatenation of the design unit and
process names (DUname.Processname), and the second name is the name of a
built-in symbol. For example:
xorg(only).p1 XOR
org(only).p1 OR
andg(only).p1 AND
1-22
ModelSim Advanced Debugging
December 2002
Review: ModelSim Windows
Entities and modules are mapped the same way.
AND2 AND # a 2-input AND gate
Note that for primitive gate symbols, pin mapping is automatic.
User-defined symbols
You can also define your own symbols using an ASCII symbol library file format
for defining symbol shapes. This capability is made possible by Concept
Engineering's NlviewTM widget Symlib format. For specific details on this
widget, go to www.model.com.products/documentation/nlviewSymlib.html or
read the ModelSim User's Manual.
ModelSim Advanced Debugging
December 2002
1-23
Review: ModelSim Windows
Dataflow Window — Chase X
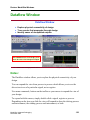
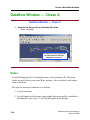
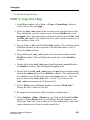
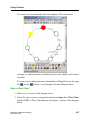
Dataflow Window — Chase X
♦ Jump to the Source of an unknown (X) value
Trace > ChaseX
The unknown on this signal can
be traced back to the high
impedance on test_in
1-15 • ModelSim® Advanced Debugging: ModelSim Windows
Copyright © 2002 Mentor Graphics Corporation
Notes:
A useful debugging tool is locating the source of an unknown (X). Unknown
values are most clearly seen in the Wave window—the waveform is red when a
value is unknown.
The steps for tracing an unknown is as follows:
1. Load your design.
2. Log all signals in the design or any signals that may possibly contribute to
the unknown value (log -r /* will log all signals in the design).
1-24
ModelSim Advanced Debugging
December 2002
Review: ModelSim Windows
3. Add signals to the Wave window or wave viewer pane and run the design
for the desired length of time.
4. Place a cursor on the time at which the signal value is unknown.
5. Add the signal of interest to the Dataflow window, making sure the signal is
selected.
6. Select Trace > Trace X or Trace > Chase X.
These two commands behave as follows:
• Trace > Trace X — Steps back to the last driver of an unknown value.
• Trace > Chase X — "Jumps" to the source of an unknown value.
ModelSim Advanced Debugging
December 2002
1-25
Review: ModelSim Windows
Variables Window
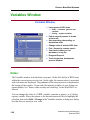
Variables Window
♦ Lists names of HDL items
●
●
VHDL -- constants, generics and
variables
Verilog -- register variables
♦ Path to current process is shown
at lower left
♦ Sort ascending, descending, or
declaration order
♦ Change value of selected HDL item
♦ Find - forward or reverse search
♦ View items in Wave or List
windows or in log file
♦ Drag and Drop out
♦ Track single-step, breakpoints,
process window
1-16 • ModelSim® Advanced Debugging: ModelSim Windows
Copyright © 2002 Mentor Graphics Corporation
Notes:
The Variables window is divided into two panes. On the left, the list of HDL items
within the current process are in view. On the right, the current value(s) associated
with each name are displayed. The pathname of the current process is displayed at
the bottom of the window. If you wish, the internal variables of your design can
remain hidden. See "Source code security and -nodebug” in the ModelSim User
Manual.
You can change the value of a VHDL variable, constant or generic, or a Verilog
register variable. Move the pointer to the desired name and click to highlight the
selection, then select Edit > Change in the Variables window to bring up a dialog
box that lets you specify a new value.
1-26
ModelSim Advanced Debugging
December 2002
Review: ModelSim Windows
Note that "Variable Name" is a term that is used loosely in this case to signify
VHDL constants and generics as well as VHDL and Verilog register variables.
You may enter any value that is valid for that variable. An array value must be
specified as a string without surrounding quotation marks. To modify the values in
a record, you need to change each field separately.
Click on a process in the Process window to change the Variables window.
To find HDL items in the Variables window, select Edit > Find. You can also do
a quick search find from the keyboard. When the Variables window is active, each
time you type a letter the highlighter will move to the next item whose name
begins with that letter.
ModelSim Advanced Debugging
December 2002
1-27
Review: ModelSim Windows
Wave Window
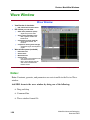
Wave Window
♦ View Results of simulation
●
HDL waveforms and their values
♦ HDL Values you can view
●
VHDL items (dark blue square)
●
Verilog items (light blue circle)
– Signals and process values
– Nets, registers, variables and
named events
●
Virtual items (orange diamond)
– Virtual signals, busses, and
functions
●
Comparison items (yellow triangle)
– Comparison region and comparison
signals
♦ Wave window panes (resizable)
●
●
●
●
Pathname Pane
Values Panes
Waveform Pane
Cursor Panes
– Left - shows current simulation time
and value for each cursor.
– Right - shows absolute value for
each cursor and relative time
between cursors
1-17 • ModelSim® Advanced Debugging: ModelSim Windows
Copyright © 2002 Mentor Graphics Corporation
Notes:
Note: Constants, generics, and parameters are not viewable in the List or Wave
window.
Add HDL items to the wave window by doing one of the following:
• Drag and drop
• Command line
• Wave window format file
1-28
ModelSim Advanced Debugging
December 2002
Review: ModelSim Windows
Dividers
Dividing lines can be placed in the pathname and values window panes by
selecting Insert > Divider from the Wave window. Dividers aid debugging by
allowing you to separate signals from each other.
After you have added a divider, you can change its name and size by clicking the
RMB (windows) or middle mouse button (unix) and select Divider Properties
from the pop-up menu.
Drag and drop a divider to the desired location.
Delete a divider by selecting it and pressing the <Delete> key on your keyboard,
or select Delete from the pop-up menu.
Splitting Window Panes
The pathnames, values and waveform(s) window panes of the Wave window
display can be split to accommodate signals from one or more datasets. Select
Insert > Window Pane from the Wave window. This creates a space below the
selected waveset and makes the new window active.
Combining items in the Wave window
Combine signals in the Wave window to form busses. To create a bus, select one
or more signals in the Wave window, then select Tools > Combine Signals.
The Combine Selected Signals dialog box appears, and allows you to specify the
name of the newly created bus. It also allows you to specify the order the selected
signals are indexed in the bus. You can also choose to remove the selected signals
from the Wave window once the bus is created.
You can also edit and format HDL items from the Wave window. Select the item
in the Wave window, then choose commands from the Edit menu.
You can also click+drag to move items within the pathnames and values panes.
ModelSim Advanced Debugging
December 2002
1-29
Review: ModelSim Windows
Formatting an item
Select the item's label in the pathname, or its waveform in the waveform pane,
then select View > Signals Properties from the Wave window. The resulting
Wave Signal Properties dialog box appears, and has three tabs: View, Format,
and Compare.
Searching for item values in the Wave window
Select an item in the Wave window and then select Edit > Search to bring up the
Wave Signal Search dialog box.
The Wave Signal Search dialog box allows you to search by the following
criteria:
• Search Type: Any Transition
• Search Type: Rising Edge
• Search Type: Falling Edge
• Search Type: Search for Signal Value
• Search Type: Search for Expression
• Search Options: Match Count
Note: If your signal values are displayed in binary radix, see "Searching for binary
signal value”s in the GUI (CR-21) for details on how signal values are mapped
between a binary radix and std_logic.
Using time cursors in the Wave window
When the Wave window is first drawn, there is one cursor located at time zero.
Clicking anywhere in the waveform display brings that cursor to the mouse
location. You can add cursors to the waveform pane by selecting Insert > Cursor,
or by clicking on the Add Cursor button. The selected cursor is drawn as a bold
solid line; all other cursors are drawn with thin dashed lines. Remove cursors by
selecting them and selecting Edit > Delete Cursor.
1-30
ModelSim Advanced Debugging
December 2002
Review: ModelSim Windows
You can choose a specific cursor by selecting View > Cursors, or by clicking a
value in the cursor-value pane.
Making cursor measurements
Each cursor is displayed with a time box showing the precise simulation time at
the bottom. When you have more than one cursor, each time box appears in a
separate track at the bottom of the display. ModelSim also adds a delta
measurement showing the time difference between two adjacent cursor positions.
Clicking in a waveform display allows the cursor closest to the mouse to position
itself to the selected position. Another way to position multiple cursors is to use
the mouse in the time box tracks at the bottom of the display.
There are also toolbar buttons, Find Previous Transition and Find Next
Transition that you can move the cursors with.
ModelSim Advanced Debugging
December 2002
1-31
Review: ModelSim Windows
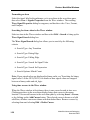
List Window
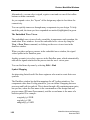
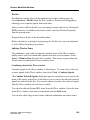
List Window
♦ Display the results of simulation in tabular format
●
Tracks time and delta in the left pane
1-18 • ModelSim® Advanced Debugging: ModelSim Windows
Copyright © 2002 Mentor Graphics Corporation
Notes:
HDL items you can view:
• VHDL items: Signals, processes and shared variables
• Verilog items: Nets and registers variables
• Comparison items: Comparison registers and comparison signals
• Virtual items: Virtual signals and functions
Note: Constants, generics and parameters are not viewable in the List or Wave
windows.
1-32
ModelSim Advanced Debugging
December 2002
Review: ModelSim Windows
Add HDL items to the List window as follows:
• Drag and drop
• Main window command line
You may add items using a List window format file, but you must first save a
format file for the design you are simulating. The saved file can then be used as a
DO file:
• Add HDL items to your List window.
• Edit and format the items to create the view you want.
• Save the format file, start with a blank List window, and run the DO file in
one of two ways:
o From the command line: do <my_list_format>
o Select File > Load from the window menu.
You may also edit and format HDL items in the List window.
To edit: Select the item's label at the top of the List window or one of its values
from the listing. Move, copy or remove the item by selecting commands from the
List window Edit menu.
You can also click+drag to move items within the window.
To format an item, select the item's label at the top of the List window or one of its
values from the listing. Select View > Signal Properties from the List window. A
List Signals Properties dialog box appears which allows you to set the item's label,
label width, triggering and radix.
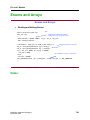
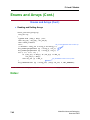
Saving List window data to a file
Select File > Write List in the List window to save the data in either tabular ,
events or TSSI format:
ModelSim Advanced Debugging
December 2002
1-33
Review: ModelSim Windows
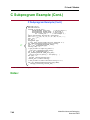
Tabular writes a text file that looks like the window listing.
Ns
0
delta
+0
/a
X
/b
X
/cin
U
/sum
X
/cout
U
Events writes a text file containing transitions during simulation.
@0 +0
/a X
/b X
/cin U
/sum X
/cout U
TSSI writes a file in standard TSSI format.
0 000000000000010?????????
1-34
ModelSim Advanced Debugging
December 2002
Review: ModelSim Windows
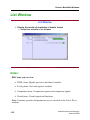
ModelSim Help
ModelSim Help
♦ Help > SE PDF Documentation > Users Manual
♦ For Additional Help, TechNotes, Design Tips and More
www.model.com
1-19 • ModelSim® Advanced Debugging: ModelSim Windows
Copyright © 2002 Mentor Graphics Corporation
Notes:
You can access all of ModelSim's help documentation through the help menu.
ModelSim Advanced Debugging
December 2002
1-35
Review: ModelSim Windows
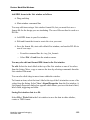
Summary
Summary
♦ Overview of ModelSim Windows
♦ ModelSim Help
1-20 • ModelSim® Advanced Debugging: ModelSim Windows
Copyright © 2002 Mentor Graphics Corporation
Notes:
1-36
ModelSim Advanced Debugging
December 2002
Review: ModelSim Windows
Lab 1: Simulation and Debugging with
the Dataflow Window
Introduction
This lab covers the simulation and debugging of a mixed design using the
ModelSim Dataflow window. The purpose of this lab is to show how fast and easy
it is to simulate a design, and to “Chase X” using the Dataflow window, e.g. to
trace the source of an unknown on the output of a signal.
Preparing and running the simulation
1. Start with one of the following:
• for UNIX at the shell prompt:
vsim
• for Windows - your option - from a Windows shortcut icon, from the
Start menu, or from a DOS prompt:
modelsim.exe
2. Create a new project and call it “mixed”. Make sure that the new project
points to the /labs/lab1 directory.
From the Main window:
File > Change Directory (C:\labs\lab1)
File > New > Project
(mixed)
3. Add source files to the project:
From the Add items to the Project dialog box, select Add Existing File.
Add the following files (select Reference from current location):
cache.v, memory.v, proc.v, set.vhd, top.vhd, util.vhd
The first three files are Verilog files; the last three are the VHDL files.
ModelSim Advanced Debugging
December 2002
1-37
Review: ModelSim Windows
Click Close to close the Add items to the Project dialog box.
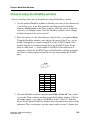
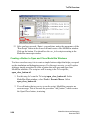
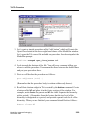
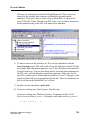
4. Click the RMB in the Project tab view of the Main window. Select Compile
> Compile Order... from the pop-up menu. Click on Auto Generate to
resolve all file dependencies and compile the files. Click OK twice to return
to the ModelSim Main window.
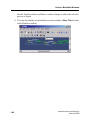
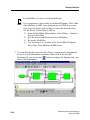
5. Load the “top” design unit into the simulator by expanding the work
library view in the Library tab, use the left mouse button (LMB) and double
click on the top entity.
6. View all windows. Type “view *” or select View > All Windows from the
pulldown menu.
7. We are going to use the Dataflow window to trace back an unknown. We
will need to log the signals in this design to provide the information for
debugging.
At the VSIM prompt, type: add log -r /*
You may not want to do this logging when running regression tests as the
number of signals you log may impact performance! Instead, you may want
to log only a specific hierarchy of the design. For example, “log -r
/top/p/*” logs only the proc (instance “p”) module in this example.
8. Drag and drop “top” from the Main window sim tab to the Wave window.
Select the Verilog module proc (in the Main window sim tab). The signals
for the proc module are now in the Signals window. From the Signals
window, drag and drop the signal t_out to the Wave window.
9. In the Main window type: run -all (or use the run -all icon from the Main
or Wave window toolbar).
Zoom the Wave window full (use the Zoom Full toolbar icon). Look at
t_out; it should go to an unknown state early in the simulation. How do you
find the root cause of the unknown signal?
1-38
ModelSim Advanced Debugging
December 2002
Review: ModelSim Windows
Chase X using the Dataflow window
Now we will trace the cause of an unknown using the Dataflow window.
1. Use the updated Dataflow window to find the root cause of the unknown on
t_out. Select t_out in the Wave window and drag it into the Dataflow
window. Add a cursor to the Wave window. Slide the cursor so that the
value of t_out changes values. Note the Dataflow window values change
with the location of the active cursor!!
2. Place the cursor over the first unknown value for the t_out signal at 65 ns.
Using the Dataflow window, trace back to the cause of the X on t_out by
double-clicking the test input (strength X) of the NAND#24 gate. Next,
double-click the test2 input (strength X) of the NAND#22 gate. Notice
there is a HiZ and a ‘1’ on the inputs of NAND#23 that result in an X
(unknown). Select the NAND#23 gate in the Dataflow window and notice
the Source window updates to the line of code representing this NAND
gate.
A
0
0
0
0
1
1
1
1
B
0
1
X
Z
0
1
X
Z
Y
1
1
1
1
1
0
X
X
3. Clear the Dataflow window using the menu Edit > Erase all. Next, select
t_out in the Wave window and drag it into the Dataflow window. Click on
the output signal, t_out, and use the RMB to select “Chase X” from the
menu. Notice that the Dataflow window shows the path to the source of the
unknown! This is a shortcut to get the same results as step #2. Again, note
ModelSim Advanced Debugging
December 2002
1-39
Review: ModelSim Windows
that the Signals window and Source window change to reflect the selected
process or signal.
4. You can also display an embedded waveform window (Show Wave button
in the Dataflow toolbar).
1-40
ModelSim Advanced Debugging
December 2002
Review: ModelSim Windows
This is a full functional waveform window that is tied to the active process
in the Dataflow window.
This feature can help eliminate the need to set a breakpoint and re-simulate.
The cause of the error is the nand gate on line 24 of proc.v. Note the HiZ
and a known value on its input that result in an X.
5. Click on the component you wish to view to load the signals in the attached
Wave window. Notice the inputs and output of the NAND#23 gate are
displayed in the embedded waveform window.
Experiment with the Dataflow and Wave windows and note how easy it is
to debug your design.
ModelSim Advanced Debugging
December 2002
1-41
Review: ModelSim Windows
6. You are finished. Quit the simulatior by typing “quit -f” at the ModelSim
prompt.
1-42
ModelSim Advanced Debugging
December 2002
Module 2
Tcl/Tk Overview
Objectives
Upon completion of this module, given required tools, students shall:
• Describe key Tcl capabilities
• Describe Tcl syntax and commands
• Describe Tk syntax and commands
• Describe the application of Tcl to ModelSim
• Perform command substitution
• Execute multiple-line commands
• Add buttons to existing windows
• Execute ModelSim commands from Tcl
• Describe where to go for help
ModelSim Advanced Debugging
December 2002
2-1
Tcl/Tk Overview
Module Overview
Module Overview
♦
♦
♦
♦
♦
♦
♦
♦
♦
Tcl capabilities
Examples Tcl syntax
Application of Tcl
Command Substitution
Multiple-Line Commands
Examples of Tk syntax
Adding buttons to existing windows
Executing ModelSim commands from Tcl
Examples of Tcl/Tk scripts
2-2 • ModelSim® Advanced Debugging: Tcl/Tk Overview
Copyright © 2002 Mentor Graphics Corporation
Notes:
2-2
ModelSim Advanced Debugging
December 2002
Tcl/Tk Overview
Why Tcl/Tk?
Why Tcl/Tk?
♦ Tcl/Tk Scripting/User Interface Language of Choice
●
Powerful scripting language
– Allows designers to create their own simulation scripts
– Easy to create scripts in any text editor
– Tcl commands allow designers to control simulation interactively at
the ModelSim prompt
– Tk allows designers to customize the UI
●
●
●
●
Open source
Bind Tcl with objects coded in C or other compiled languages
Easy to port code to different host platforms
No recompilation necessary after UI changes
– Tcl/Tk is interpreted
– Allows rapid prototyping and modifying of application
●
ModelSim has a built-in Tcl interpreter
2-3 • ModelSim® Advanced Debugging: Tcl/Tk Overview
Copyright © 2002 Mentor Graphics Corporation
Notes:
ModelSim Advanced Debugging
December 2002
2-3
Tcl/Tk Overview
Tcl Overview
Tcl Overview
♦ Tcl stands for “Tool Command Language”
●
Application-independent scripting language
♦ Using Tcl with ModelSim gives you these features:
●
●
●
●
●
●
●
●
●
Command history (like that in C shells)
Full expression evaluation and support for all C-language
operators
A full range of math and trig functions
Support of lists and arrays
Regular expression pattern matching
Procedures
The ability to define your own commands
Command substitution (nested commands)
Robust scripting language for macros
2-4 • ModelSim® Advanced Debugging: Tcl/Tk Overview
Copyright © 2002 Mentor Graphics Corporation
Notes:
Some examples of using Tcl script are provided in the ModelSim documentation.
2-4
ModelSim Advanced Debugging
December 2002
Tcl/Tk Overview
Tk Overview
Tk Overview
♦ Tk is the graphical user interface toolkit part of Tcl/Tk
♦ Allows scripts to create graphical objects
●
●
●
Set of calls which can be called from the Tcl language
Creates graphical widgets that can be used to build the interface
to a tool
Used for creating new windows, dialog boxes, menus, buttons,
key bindings, and much more
♦ ModelSim GUI is mostly implemented in Tk
●
Allows easily extensible U/I
– Modify ModelSim U/I or add custom features
♦ 3rd-Party Integration accomplished with Tk
●
Sometimes C is used as well
2-5 • ModelSim® Advanced Debugging: Tcl/Tk Overview
Copyright © 2002 Mentor Graphics Corporation
Notes:
ModelSim Advanced Debugging
December 2002
2-5
Tcl/Tk Overview
Tcl Commands
Tcl Commands
♦ Some builtin Tcl simulation commands are listed below:
append
array
break
case
catch
cd
close
concat
continue
eof
error
eval
exec
expr
file
flush
for
foreach
format
gets
glob
global
history
if
incr
info
insert
join
lappend
list
llength
lindex
lrange
lreplace
lsearch
lsort
open
pid
proc
puts
pwd
read
regexp
regsub
rename
return
scan
seek
set
split
string
switch
tell
time
trace
source
unset
uplevel
upvar
while
For help on any of the commands listed here, type at the ModelSim or VSIM prompt:
help <command name>
2-6 • ModelSim® Advanced Debugging: Tcl/Tk Overview
Ex.: VSIM > help trace
Copyright © 2002 Mentor Graphics Corporation
Notes:
For help on any of the commands listed here, type help <command name> at the
VSIM> or ModelSim> prompt.
Example: VSIM> help force
2-6
ModelSim Advanced Debugging
December 2002
Tcl/Tk Overview
Basic Tcl Syntax
Basic Tcl Syntax
♦ Tcl scripts are made up of commands
●
●
●
●
●
Separate commands by newlines or semicolons
Each command consists of one or more words separated by
spaces
Commands all have the same basic form:
set inc 11
dataset open test2.wlf test
force clk 1 10, 0 20
The following example has four words; one command followed
by three arguments:
expr 4 + 3
This command computes the sum of 4 and 3 and returns 7
♦ All Tcl commands return results
●
Empty string returned if a command has no meaningful result
Reference: Tcl Primer, http://www.scriptics.com/advocacy/primer.html Slides 3-7 — 3-13
2-7 • ModelSim® Advanced Debugging: Tcl/Tk Overview
Copyright © 2002 Mentor Graphics Corporation
Notes:
ModelSim Advanced Debugging
December 2002
2-7
Tcl/Tk Overview
Tcl Variables
Tcl Variables
♦ Tcl enables you to store values in variables
●
●
The set command is used to read and write variables:
set x 64
(The command returns the new value of the variable)
●
set x
(Reads the value of a variable by invoking set with only a single
argument)
●
A variable is created automatically the first time it is set
– Tcl variables don’t have types
– Any variable can hold any value
●
Use variable substitution to use the value of a variable in a
command:
expr $x + 7
(The command adds the value of the variable to seven)
2-8 • ModelSim® Advanced Debugging: Tcl/Tk Overview
Copyright © 2002 Mentor Graphics Corporation
Notes:
2-8
ModelSim Advanced Debugging
December 2002
Tcl/Tk Overview
Command Substitution
Command Substitution
♦ Command Substitution
●
Use the results of one command in an argument to another
command:
set x 64
set y [expr $x*2]
♦ Nested Commands
●
●
●
Tcl treats everything between square brackets [ ] as a nested Tcl
command
The nested command is evaluated and substituted into the
bracketed text
In the example above the second argument of the second set
command will be 128
2-9 • ModelSim® Advanced Debugging: Tcl/Tk Overview
Copyright © 2002 Mentor Graphics Corporation
Notes:
ModelSim Advanced Debugging
December 2002
2-9
Tcl/Tk Overview
Quotes
Quotes
♦ Double quotes allow you to specify words that contain
spaces:
set x
set y
set z
128
64
“$x + $y is [expr $x + $y]”
♦ Everything between the quotes is passed to the set command
as a single word
2-10 • ModelSim® Advanced Debugging: Tcl/Tk Overview
Copyright © 2002 Mentor Graphics Corporation
Notes:
2-10
ModelSim Advanced Debugging
December 2002
Tcl/Tk Overview
Curly Braces
Curly Braces
♦ Curly braces provide another way of grouping information
into words.
●
No substitution is performed on the text between curly braces.
set z {$x + $y is [expr $x + $y]}
2-11 • ModelSim® Advanced Debugging: Tcl/Tk Overview
Copyright © 2002 Mentor Graphics Corporation
Notes:
ModelSim Advanced Debugging
December 2002
2-11
Tcl/Tk Overview
Control Structures
Control Structures
♦ Tcl provides a complete set of control structures
●
●
●
Conditional execution
Looping
Procedures
♦ Tcl command structures are commands that take Tcl scripts as
arguments:
proc setRand {} {
global gotRand noRandSeed
# Create and load the random number seed to the deck
if {$gotRand} {
set seed [expr int(rand()*65536)]
} else {
# If the version of Tcl is pre 8.0, we have no rand or srand
# so we drive an arbitrary value in on seed. Pick another to
# get a different sequence of cards
set seed $noRandSeed
}
# puts "Seed from TCL is $seed."
force /top/seed 10 ${seed}
}
2-12 • ModelSim® Advanced Debugging: Tcl/Tk Overview
Copyright © 2002 Mentor Graphics Corporation
Notes:
2-12
ModelSim Advanced Debugging
December 2002
Tcl/Tk Overview
Simulation Commands
Simulation Commands
♦ ModelSim simulation commands are Tcl based. Some
examples:
●
force
– Force command allows you to apply stimulus interactively to VHDL
signals and Verilog nets and registers
●
run
– The run command advances the simulation by the specified number
of timesteps
●
restore
– The restore command restores the state of a simulation that was
saved with a checkpoint command during the current invocation of
VSIM (called a “warm restore”)
●
quit
– Exits the simulator
●
restart
– Reloads the design and resets the simulation time to zero
2-13 • ModelSim® Advanced Debugging: Tcl/Tk Overview
Copyright © 2002 Mentor Graphics Corporation
Notes:
ModelSim Advanced Debugging
December 2002
2-13
Tcl/Tk Overview
Tcl Script Example
Tcl Script Example
array set comp_command {packages.vhd vcom
aces_Counter.v vlog
game_on.v vlog
accumulator.vhd vcom
FSM_control.v vlog
testbench.vhd vcom }
The “array set” command creates:
comp_command(packages.vhd) = vcom
comp_command(accumulator.vhd) = vcom
comp_command(aces_counter.v) = vlog
comp_command(FSM_control.v) = vlog
comp_command(game_on.v) = vlog
comp_command(testbench.vhd) = vcom
proc bench {amount units} {
set before_run [clock seconds]
run $amount $units
set after_run [clock seconds]
set total_run [expr $after_run - $before_run]
echo "Run Time " $total_run " Seconds"
}
foreach module [array names comp_command] {
$comp_command($module) $module
}
vsim work.testbench
bench 300 us
quit -sim
2-14 • ModelSim® Advanced Debugging: Tcl/Tk Overview
Copyright © 2002 Mentor Graphics Corporation
Notes:
2-14
ModelSim Advanced Debugging
December 2002
Tcl/Tk Overview
Creating a Simulation Script
Creating a Simulation Script
♦ Create your own simulation script using ModelSim commands
and Tcl.
♦ Start by saving the existing simulation’s transcript and use it
as an example.
●
Modify it as needed.
2-15 • ModelSim® Advanced Debugging: Tcl/Tk Overview
Copyright © 2002 Mentor Graphics Corporation
Notes:
ModelSim Advanced Debugging
December 2002
2-15
Tcl/Tk Overview
Simulation Script Example
Simulation Script Example
♦ Sample of a
User-Defined
Simulation Script
2-16 • ModelSim® Advanced Debugging: Tcl/Tk Overview
Copyright © 2002 Mentor Graphics Corporation
Notes:
2-16
ModelSim Advanced Debugging
December 2002
Tcl/Tk Overview
Tk Widget Overview
Tk Widget Overview
♦ Tk widgets
●
Create a Tk widget by a Tcl command of the same name
– Invoking this command allows various ways to manipulate the widget
depending upon the arguments
♦ Pathname
●
Pathname for the Tk root window is a single dot
– i.e. “.”
●
Consists of a child name appended to the pathname of its parent
– Uses the “.” character
– Must be unique among its siblings (other widget children of its parent)
Example:
The pathname of the top level frame whose parent is the Main window
could be:
.frametop
A button widget whose parent is frametop could be:
.frametop.button1
2-17 • ModelSim® Advanced Debugging: Tcl/Tk Overview
Copyright © 2002 Mentor Graphics Corporation
Notes:
ModelSim Advanced Debugging
December 2002
2-17
Tcl/Tk Overview
Tk Commands
Tk Commands
♦ Used for writing GUI applications.
♦ Some Tk commands are:
●
button
– Create and manipulate button widgets
●
toplevel
– Create and manipulate top level widgets
●
scale
– Create and manipulate scale widgets
●
label
button
label
– Create and manipulate label widgets
●
toplevel
pack
pack
– Geometry manager that packs around edges of cavity
●
frame
– Create and manipulate frame widgets
●
scrollbar
– Create and manipulate scrollbar widgets
2-18 • ModelSim® Advanced Debugging: Tcl/Tk Overview
Copyright © 2002 Mentor Graphics Corporation
Notes:
2-18
ModelSim Advanced Debugging
December 2002
Tcl/Tk Overview
Simple Tk Example
Simple Tk Example
toplevel .foo
label .foo.lbl -text “anyone there?”
button .foo.b1 -text “say hello” -command {.foo.lbl config -text hello -foreground green}
button .foo.b2 -text “say goodbye” -command {.foo.lbl config -text goodbye -foreground red}
pack .foo.lbl .foo.b1 .foo.b2 -padx 10 -pady 10
.foo is the top level, or parent
b1 and b2 are buttons widgets
They are children of .foo
2-19 • ModelSim® Advanced Debugging: Tcl/Tk Overview
Copyright © 2002 Mentor Graphics Corporation
Notes:
ModelSim Advanced Debugging
December 2002
2-19
Tcl/Tk Overview
Monitors
Monitors
Logic Analyser
Dymanic
Monitor
Micro Code
proc build_window {} {
global test_lines line_number RegABreak RegABreakV RegBBreak ResultBreak
toplevel .monitor
label .monitor.label1 -relief raised -bd 2 -width 10 -text "RegA"
grid .monitor.label1 -row 1 -column 1
label .monitor.value1 -font {"Tahoma" 16} -justify right -width 20 -text "XXXXXXXX"
grid .monitor.value1 -row 1 -column 2
checkbutton .monitor.cb1 -text "Break On Value" -variable RegABreak
grid .monitor.cb1 -row 1 -column 4
----------------------------------------bind .wave.tree <B1-Motion> +get_value_at_cursor
bind .wave.tree <Button-1> +get_value_at_cursor
--------------------}
2-20 • ModelSim® Advanced Debugging: Tcl/Tk Overview
Copyright © 2002 Mentor Graphics Corporation
Notes:
2-20
ModelSim Advanced Debugging
December 2002
Tcl/Tk Overview
Monitors (Cont.)
Monitors (Cont.)
Bind Cursor Movement
2-21 • ModelSim® Advanced Debugging: Tcl/Tk Overview
Copyright © 2002 Mentor Graphics Corporation
Notes:
ModelSim Advanced Debugging
December 2002
2-21
Tcl/Tk Overview
Additional Tcl/Tk Resources
Additional Tcl/Tk Resources
♦ ModelSim Help
●
●
Help > Tcl Help
Help > Tcl Man Pages
♦ Tcl/Tk Books/Manuals
♦ Newsgroups
●
comp.lang.tcl
♦ Web Help
●
●
http://www.model.com/resources/tcltk.asp
http://scriptics.com
♦ At the ModelSim or VSIM prompt
●
VSIM > help <command name>
♦ Help > SE PDF Documentation> Command Reference
2-22 • ModelSim® Advanced Debugging: Tcl/Tk Overview
Copyright © 2002 Mentor Graphics Corporation
Notes:
2-22
ModelSim Advanced Debugging
December 2002
Tcl/Tk Overview
Summary
Summary
This module introduced and explored the application of the
following topics:
♦ Tcl/Tk syntax
♦ Key Tcl capabilities
♦ The application of Tcl to ModelSim
♦ Command substitution
♦ Multiple-line commands
♦ Creating a Simulation Script Using the Saved Transcript
♦ Adding buttons to existing windows
♦ Executing ModelSim commands from Tcl
♦ Tcl/Tk script examples
2-23 • ModelSim® Advanced Debugging: Tcl/Tk Overview
Copyright © 2002 Mentor Graphics Corporation
Notes:
ModelSim Advanced Debugging
December 2002
2-23
Tcl/Tk Overview
Lab 2: Using Tcl Scripts and Tk Widgets
in Simulation
Introduction
This lab introduces you to the concept of using Tcl/Tk as an aid to simulation and
debugging. The lab combines a mixture of ModelSim commands, Tk widgets and
Tcl scripting. You will see that you can streamline your simulations using Tcl
scripts, and you can add push button ease to your simulations using Tk.
The files we will use for this lab are cordic_core_rtl.vhd and cor_it.do. The
cordic_core_rtl.vhd file contains the code that takes input values from vectors x
and y, performs sine and cosine calculations and adjustments on the inputs, and
outputs the angle and the difference. The cor_it.do file is a scripting file that
contains Tcl commands and serves as the design’s testbench.
Directions
Creating a Tk Button to Run a Simulation Script
1. To set up the lab, invoke ModelSim and change directory to the labs/lab2/
cordic_core directory (use the “cd” command or the File → Change
Directory… menu.
2. First we will create a work library and a logical mapping to it.
ModelSim> vlib work
ModelSim> vmap work work
3. Next we will compile the file cordic_core_rtl.vhd using the -93 switch.
ModelSim> vcom -93 cordic_core_rtl.vhd
4. Now we will load the design into the simulator memory.
ModelSim> vsim cordic_core
5. Once the design is loaded into memory, we can run the Tcl script, cor_it.do.
2-24
ModelSim Advanced Debugging
December 2002
Tcl/Tk Overview
VSIM> do cor_it.do
Watch the ModelSim transcript window. You may have to expand it
horizontally and vertically in order to see the complete table. You should
see a table in the transcript window that shows angles in degrees from 0 to
90 along with corresponding input vectors, actual and calculated values for
sine and cosine, and the differences.
(Note: On the Sun platform, the script runs in the shelltool window, not the
ModelSim transcript window).
When you are done examining the table, quit simulation but leave
ModelSim open.
VSIM> quit -sim
6. Let’s take a look at what the Tcl script is doing. We can open the file using
a text editor by issuing a command from the ModelSim prompt.
ModelSim> notepad cor_it.do
Notice the first thing the script does is to convert bin_in from binary to bcd.
Next, the script uses the simulation command force to drive some signal
values, and uses the set command to set up variables inside the for loop.
Note also that the variable a is declared for the first time in the for loop
parameters as follows:
for {set a 0}{$a < 91} {incr a}
Remember that the dollar sign ($) in front of the variable symbol means
“the value of” the variable.
You may want to open the VHDL source file and study it so that you can
understand what it’s doing and how the Tcl testbench drives the process.
Open the file in Notepad like we did the for the cor_it.do file:
ModelSim> notepad cordic_core_rtl.vhd
ModelSim Advanced Debugging
December 2002
2-25
Tcl/Tk Overview
While we’re at it, let’s add the vcom command at the top of the file,
cor_it.do, so cordic_core_rtl.vhd is compiled when we run the script. Make
sure to add the command to load the design as well:
vcom -93 cordic_core_rtl.vhd
vsim cordic_core
add log /*
Save your changes to the cor_it.do file and run the script.
ModelSim> do cor_it.do
7. Another way to run the script would be to execute the menu option Tools >
Execute Macro, but if you have a lot of debugging to do, it might be faster
to create a Tk button widget so that all you had to do to re-run the script is
click on the button.
8. When you are finished, type quit -sim.
9. For this next part of the lab we will create a button called “Run Script” and
bind it to the “do cor_it.do” command.
Before we create the widget (button), we’ll review a few Tk basics.
Tk widgets are objects such as buttons, scrollbars, lists, pop-up menus, pulldown menus, option menus, the text widget and the canvas widget.Tk also
provides container widgets such as toplevel and frame widgets. You create
widgets by using built-in Tk commands. The Tk extension provides UI
controls for the development of Tcl-based GUI applications. The generic
widget classes determine the appearance and behavior of the widget.
For example, button, radiobutton and checkbutton could all belong to the
Tk button class. Buttons are meant to be clicked and trigger an event or
series of events.
Each Tk widget is its own window and is uniquely identified by its name.
The name of the widget reflects the hierarchy in which it is placed. For
example, .t1.f1.b1 might indicate a top-level frame called .t1, a frame
placed inside of .t1 called .f1, and a button inside of the frame called .b1.
2-26
ModelSim Advanced Debugging
December 2002
Tcl/Tk Overview
Recall from the lecture that the main window widget is “.” and subsequent
levels are separated by a period (.), indicating hierarchy.
Tk commands can be categorized into four groups:
• Commands for creating and destroying widgets
• Commands used to communicate geometry management
• Commands associated with each widget within a particular hierarchy of an
application
• Commands for communication between widgets, other applications and
data
We will create our button widget interactively in the ModelSim transcript
window.
10. The first step is to create the button .b1 widget using the button command:
ModelSim> button .b1 -text “Run Script” -command “do
cor_it.do”
The -text argument tells the Tk interpreter what to call the button widget,
and the -command argument tells it what to do when the button is pressed.
11. After you hit <Enter>, type the following at the ModelSim prompt:
ModelSim> pack .b1 -side left
This command tells the Tk interpreter where to place the button.
ModelSim Advanced Debugging
December 2002
2-27
Tcl/Tk Overview
12. After you have pressed <Enter> a second time, notice the appearance of the
“Run Script” button in the lower left hand corner of the ModelSim window.
Click on the button. You should see the cor_it.do script executing in the
ModelSim transcript window.
Creating a Button to Open and Close ModelSim Windows
You have seen how easy it is to create a simple button widget that helps you speed
up the simulation and debugging process. For this next exercise, we will explore
writing a simple procedure to create a button that will open and close four
ModelSim windows. The script we will be using is the Tcl script file,
open_close_button.tcl.
1. For this step, let’s run the Tcl script open_close_button.tcl. In the
ModelSim Main window, select Tools > Execute Macro. Select
open_close_button.tcl.
2. You will notice that as you try to run the script, ModelSim generates an
error message. This is because the procedure “add_button”, which creates
the Open/Close button, is missing.
2-28
ModelSim Advanced Debugging
December 2002
Tcl/Tk Overview
3. Let’s create a simple procedure called “add_button” which will create the
Open/Close button in the lower right hand corner of the ModelSim window.
Let’s open the Tcl source file and add our procedure. Invoke notepad at the
ModelSim prompt:
ModelSim> notepad open_close_button.tcl
4. Look towards the bottom of the file. You will see a comment telling you
where to add the procedure. Uncomment the lines between the dashed lines
and put your procedure there.
5. First we will declare the procedure as follows:
proc add_button {void} {
(Remember that the procedure body is written within curly braces).
6. Recall that a button widget in Tk is created by the button command. Create
a button called b2 and place it in the footer section of the window. For
example, make footer the parent and b2 the child. Separate the hierarchy
with a period (.). Remember from the lecture that the top level of the
hierarchy is designated as a period, and periods separate each level of the
hierarchy. When you are finished your command should look as follows:
button .footer.b2
ModelSim Advanced Debugging
December 2002
2-29
Tcl/Tk Overview
7. The next step is to configure the button. We will configure the button much
like we configured the button in the first exercise of this lab, but this time
we will use the configure command to describe the functionality of the
button. Configure the button using the -text, -command, and -width
arguments. For example, configure the text to say Open, the command to
read in the open_windows procedure, and the width to be 8. Finish writing
the button’s configuration on the line below, then copy the line to the
open_close_button.tcl file.
.footer.b2 configure________________________________
Here a hint on how to create a procedure within a procedure:
Place the name of the procedure within curly braces, and pass in a value for
the “void” parameter as follows:
-command {open_windows 0}
8. The final line of the procedure should place the button on the lower right
hand side of the ModelSim window. You will do this exactly as you did in
Step 11 of the first exercise. Use the pack command and the -side
argument:
____________________________________________________
Make sure to enclose the entire procedure within curly braces. You should
have typed a left-hand curly brace ({) on the line declaring the procedure (
(Step 5), so you need to place a right-hand curly brace (}) on the final line.
You can reference the file, open_close_button_fixed.tcl if you need help
creating the procedure. The file is located in the labs/lab2/ cordic_core
directory. The finished procedure is included in this file.
9. Once you have finished creating the button procedure, you will notice the
appearance of a button called “Open” in the lower right-hand corner of the
ModelSim window. Try clicking the button several times and see what
happens.
2-30
ModelSim Advanced Debugging
December 2002
Tcl/Tk Overview
When you have finished, you may quit ModelSim.
ModelSim Advanced Debugging
December 2002
2-31
Tcl/Tk Overview
2-32
ModelSim Advanced Debugging
December 2002
Module 3
Test Benches
Objectives
Upon completion of this module, you will be able to:
• List the functions of test benches
• Describe each of the functions of test benches
• List the different test bench implementations
• Describe features, benefits, and trade-offs of each test bench
implementation
ModelSim Advanced Debugging
December 2002
3-1
Test Benches
Module Overview
Module Overview
In this module we will discuss:
♦ Types of Test Benches
♦ Modeling Techniques for Each Test Bench
♦ Pros and Cons of Each Test Bench
♦ vgencomp
♦ VHDL Generics
♦ Signal SpyTM
3-2 • ModelSim® Advanced Debugging: Test Benches
Copyright © 2002 Mentor Graphics Corporation
Notes:
3-2
ModelSim Advanced Debugging
December 2002
Test Benches
Functions
Functions
Test Benches can provide the following functions:
♦
♦
♦
♦
♦
Stimulus Generation for Unit Under Test (UUT)
Stimulus Application to Unit Under Test (UUT)
Monitor of actual outputs of UUT
Compare equivalence of actual outputs of UUT with expected outputs
Assertion Violation for non-equivalence between actual and expected outputs of UUT
Assertion Violations
ModelSim
Reactive Control
Stimulus
Stimulus
Application
Generation
UUT
Monitor
Actual
Results
Stimulus
Data Set
One or Many
3-3 • ModelSim® Advanced Debugging: Test Benches
Reference
Expected
Comparator
Results
Copyright © 2002 Mentor Graphics Corporation
Notes:
ModelSim Advanced Debugging
December 2002
3-3
Test Benches
Implementation
Implementation
♦ Test Bench functions may be implemented as any
combination of the following:
●
●
●
●
●
HDL
C via FLI/PLI
Tcl
Interactive GUI
3rd Party Testbench tools
3-4 • ModelSim® Advanced Debugging: Test Benches
Copyright © 2002 Mentor Graphics Corporation
Notes:
3-4
ModelSim Advanced Debugging
December 2002
Test Benches
Comparison of Different Test Bench
Methods
Comparison of Different Test Bench Methods
HDL
C
Tcl
GUI
3rd Party
Ease of Use Performance Level of Abstraction
medium
fast
medium
hard
fast
low
easy
slow
low
easy
slow
low
medium
fast
high
3-5 • ModelSim® Advanced Debugging: Test Benches
Notes
most portable
requires s/w skills
scripts and do files
difficult to automate
requires $$
Copyright © 2002 Mentor Graphics Corporation
Notes:
ModelSim Advanced Debugging
December 2002
3-5
Test Benches
HDL Test Benches
HDL Test Benches
♦ Most portable solution
♦ Fast execution
VHDL
Verilog
3-6 • ModelSim® Advanced Debugging: Test Benches
Copyright © 2002 Mentor Graphics Corporation
Notes:
3-6
ModelSim Advanced Debugging
December 2002
Test Benches
VHDL Test Benches, Design Units in
Verilog
VHDL Test Benches, Design Units in Verilog
♦ ModelSim automatically detects cross-HDL instantiations
●
●
No wrapper file is needed
The necessary adaptation conversions are performed
automatically
♦ Use VHDL test bench, Verilog design units for best
performance
●
●
●
●
The design unit must be a module (UDPs are not allowed)
The ports are named ports (Verilog allows unnamed ports)
The ports are not connected to bi-directional pass switches
(It is not possible to model pass switches in VHDL)
Instantiate the Verilog module as a component in the VHDL
– The interface to the module is extracted from the library in the form of
a component by running vgencomp
– Given a library and a module name, vgencomp writes a component
declaration to standard output
vgencomp <module_name>
3-7 • ModelSim® Advanced Debugging: Test Benches
Copyright © 2002 Mentor Graphics Corporation
Notes:
ModelSim Advanced Debugging
December 2002
3-7
Test Benches
VHDL and Verilog Identifiers
VHDL and Verilog Identifiers
♦ VHDL identifiers for component name, port names and
generic names are the same as the Verilog identifiers for the
module name, port names, and parameter names.
♦ If the Verilog identifier is not a valid VHDL 1076-1987 identifier,
it is converted to a VHDL 1076-1993 extended identifier
●
Compile with the -93 switch
♦ Upper case letters in Verilog identifiers are converted to
lowercase in the VHDL identifier, except for the following:
●
The Verilog module was compiles with the -93 switch
– vgencomp should use VHDL 1076-1993 extended identifiers in the
component declaration to preserve case in Verilog identifiers that
contain uppercase letters
●
The Verilog module, port, or parameter names are not unique
unless case is preserved.
– vgencomp behaves as if the module was compiled with the -93 switch
for those names only
3-8 • ModelSim® Advanced Debugging: Test Benches
Copyright © 2002 Mentor Graphics Corporation
Notes:
Generic clause — A generic clause is generated if the module has parameters. A
corresponding generic is defined for each parameter that has an initial value that
does not depend on any other parameters.
Port clause — A port clause is generated if the module has ports. A
corresponding VHDL port is defined for each named Verilog port. You can set the
VHDL port type to bit, std_logic or vl_logic. If the Verilog port has a range, then
the VHDL port type is bit_vector, std_logic_vector, or vl_vector. The vector
type will be constrained accordingly if the range does not depend on parameters,
otherwise it is unconstrained.
3-8
ModelSim Advanced Debugging
December 2002
Test Benches
Setting VHDL Generic Parameters
Setting VHDL Generic Parameters
♦ VHDL Source code example
with generics
●
Generic names
– data_pin, treg, trsu, trh, trpr,
trcl
●
Data types
– string, time
●
Values
– 1 ns
♦ ModelSim
●
●
Specify generic values
Override existing generic
values
ENTITY DFF_test
DFF_test IS
IS
ENTITY
GENERIC ((
GENERIC
data_pin :: STRING;
STRING;
data_pin
treg: TIME
TIME :=
:= 11 ns;
ns;
treg:
trsu: TIME
TIME :=
:= 11 ns;
ns;
trsu:
trh :: TIME
TIME :=
:= 11 ns;
ns;
trh
trpr: TIME
TIME :=
:= 11 ns;
ns;
trpr:
trcl: TIME
TIME :=
:= 11 ns);
ns);
trcl:
PORT ((
PORT
dd
IN std_logic;
std_logic;
:: IN
clk :: IN
IN std_logic;
std_logic;
clk
clrn: IN
IN std_logic;
std_logic;
clrn:
prn :: IN
IN std_logic;
std_logic;
prn
OUT std_logic
std_logic :=
:= '0');
'0');
qq :: OUT
END DFF_test;
DFF_test;
END
3-9 • ModelSim® Advanced Debugging: Test Benches
Copyright © 2002 Mentor Graphics Corporation
Notes:
ModelSim Advanced Debugging
December 2002
3-9
Test Benches
Setting VHDL Generic Parameters
(Cont.)
Setting VHDL Generic Parameters (Cont.)
♦ vsim -g<Name>=<Value>
●
●
●
Assigns a value to generics that have not received explicit values
in generic maps or instantiations
<Name> generic name as it appears in the VHDL source
<Value> appropriate value and data type of a VHDL generic
vsim -g/top/u1/tpd=20ns
– tpd generic on the /top/u1 instance assigned a value of 20 ns
vsim -gu1/tpd=20ns
– tpd generic on all instances named u1
vsim -gtpd=20ns
– Affects all generics named tpd
♦ vsim -G<Name>=<Value>
●
Same as -g but will override values set in generic maps or
instantiations
3-10 • ModelSim® Advanced Debugging: Test Benches
Copyright © 2002 Mentor Graphics Corporation
Notes:
3-10
ModelSim Advanced Debugging
December 2002
Test Benches
Setting VHDL Generic Parameters
(Cont.)
Setting VHDL Generic Parameters (Cont.)
♦ Menu - Simulate > Simulate
●
●
●
Add button allows you to
specify generics values within
the current simulation
Generic Name
– -g<Name>=<Value>
Value
– Appropriate data type
●
Override Instance
– -G<Name>=<Value>
3-11 • ModelSim® Advanced Debugging: Test Benches
Copyright © 2002 Mentor Graphics Corporation
Notes:
ModelSim Advanced Debugging
December 2002
3-11
Test Benches
Setting VHDL Generic Parameters
(Cont.)
Setting VHDL Generic Parameters (Cont.)
♦ GUI - Variables Window
●
Viewable VHDL items
– variables
– constants
– generics
●
●
●
Highlight the desired generic
Select: Edit > Change
Variable Name
– VHDL Generic Name
●
Value
– Appropriate data type
– No quotation marks for arrays
3-12 • ModelSim® Advanced Debugging: Test Benches
Copyright © 2002 Mentor Graphics Corporation
Notes:
3-12
ModelSim Advanced Debugging
December 2002
Test Benches
C Test Benches
C Test Benches
♦ Most flexible solution
●
can do virtually
anything in C
♦ Hardest to implement
♦ Least portable
●
especially for VHDL
– (no FLI standard)
3-13 • ModelSim® Advanced Debugging: Test Benches
Copyright © 2002 Mentor Graphics Corporation
Notes:
ModelSim Advanced Debugging
December 2002
3-13
Test Benches
Tcl Test Benches
Tcl Test Benches
♦ Quick and easy to implement
♦ Medium level of abstraction
♦ Slow execution
Force clk 0 0, 1 50 -rep 100
force reset 1
echo “starting test”
run 1000
$ variable substitution, use the variable’s value
force reset 0
“ ” contents passed to Tcl command as single word
force ready 1
[ ] nested command, evaluated & substituted
run 100
{ } grouping command, no substitution performed
force ready 0
run -all
when {clk’event and clk=’1’ and b = “01100111”}{
set c [examine -bin /testbench/uut/txblock/c]
if {$c != 1} {
echo “Error: test of signal C failed. (C = $c)”
stop
}
}
3-14 • ModelSim® Advanced Debugging: Test Benches
Copyright © 2002 Mentor Graphics Corporation
Notes:
3-14
ModelSim Advanced Debugging
December 2002
Test Benches
Interactive GUI Test Benches
Interactive GUI Test Benches
♦ Very interactive
♦ Difficult to automate
♦ Slow execution speed
3-15 • ModelSim® Advanced Debugging: Test Benches
Copyright © 2002 Mentor Graphics Corporation
Notes:
ModelSim Advanced Debugging
December 2002
3-15
Test Benches
3rd Party Test Benches
3rd Party Test Benches
♦ All major test bench development tools are integrated with
ModelSim
SpecMan
♦
♦
♦
♦
Vera
Quickbench
Highest level of abstraction
Fast execution speed
Each has dedicated language for test bench development
Requires purchasing and learning new tools
3-16 • ModelSim® Advanced Debugging: Test Benches
Copyright © 2002 Mentor Graphics Corporation
Notes:
3-16
ModelSim Advanced Debugging
December 2002
Test Benches
Signal SpyTM
Signal SpyTM
♦ Ability to probe through VHDL hierarchy
♦ Ability to probe through MixedHDL designs
♦ New VHDL Procedure (utility)
●
init_signal_spy(source, destination, verbose)
♦ New VHDL library
●
modelsim_lib
♦ New Verilog System Task
●
init_signal_driver( )
signal_force( )
signal_release( )
$init_signal_driver( )
$init_signal_spy(source, destination, verbose) $signal_force( )
$signal_release( )
♦ Why use — Hierarchy access
●
●
●
●
VHDL does not allow hierarchical notation
Cannot directly read or change a VHDL signal, variable, or generic
with a hierarchical reference within a mixed-language design
Cannot directly access a Verilog object in the hierarchy if there is
an interceding VHDL block
Monitor, drive, or force/release an item from anywhere in the
hierarchy
3-17 • ModelSim® Advanced Debugging: Test Benches
Copyright © 2002 Mentor Graphics Corporation
Notes:
Why would you want to or need to use Signal Spy?
1. VHDL does not have an inherent method of allowing you to probe internal
signals like Verilog does.
2. Signal Spy allows you to probe any signal at any level within a VHDL or
mixed VHDL/Verilog design.
Use Signal Spy to probe internal signals from your test bench.
1. Set up Signal Spy. Example: init_signal_spy
ModelSim Advanced Debugging
December 2002
3-17
Test Benches
2. Specify the signal path.
"top/c/s/s0/data_out"
3. Define the destination for the value. Example:
init_signal_spy ("top/c/s/s0/data_out", "/data_out_s0spy" )
4. Use the signal in your testbench.
Example: signal data_out_s0spy: std_logic_vector(15:0);
Now you have access to any signal at any level.
3-18
ModelSim Advanced Debugging
December 2002
Test Benches
Signal SpyTM (Cont.)
Signal SpyTM (Cont.)
♦ New signal probing capability for
ModelSim
♦ Can check any signal
in any other VHDL or
Verilog module WITHOUT
having to modify your code
VHDL testbench
...
signal s, t, r: std_logic;
...
init_signal_spy(“/top/u1/s”, “s”);
init_signal_spy(“/top/u1/t2/v1/s”, “t”);
init_signal_spy(“/top/u1/t2/v2/r”, “r”);
Verilog
VHDL
Verilog
Signal s: std_logic;
♦ Greatly simplifies
testbench development
and debug for VHDL
& mixed-language
environments
VHDL
VHDL
VHDL
Verilog
Verilog
Signal s: std_logic;
Wire r;
Verilog
3-18 • ModelSim® Advanced Debugging: Test Benches
Copyright © 2002 Mentor Graphics Corporation
Notes:
ModelSim Advanced Debugging
December 2002
3-19
Test Benches
init_signal_spy VHDL Utility
init_signal_spy VHDL Utility
library ieee;
library modelsim_lib;
use ieee.std_logic_1164.all;
use modelsim_lib.util.all;
Verilog Signal probed
from VHDL
3-19 • ModelSim® Advanced Debugging: Test Benches
Copyright © 2002 Mentor Graphics Corporation
Notes:
3-20
ModelSim Advanced Debugging
December 2002
Test Benches
$init_signal_spy Verilog Task
$init_signal_spy Verilog Task
signal viewed at
multiple levels of
the design
VHDL instance
Verilog task
3-20 • ModelSim® Advanced Debugging: Test Benches
Copyright © 2002 Mentor Graphics Corporation
Notes:
ModelSim Advanced Debugging
December 2002
3-21
Test Benches
Summary
Summary
This module introduced and explored the application of the
following topics:
♦ Functions of Test Benches
♦ Different Types of Test Benches
♦ Pros & Cons of Each of the Different Types of Test Benches
3-21 • ModelSim® Advanced Debugging: Test Benches
Copyright © 2002 Mentor Graphics Corporation
Notes:
3-22
ModelSim Advanced Debugging
December 2002
Test Benches
Lab 3a: Tcl/Tk Testbench
Introduction
This lab will take you step by step through the design flow using ModelSim. You
will first change the working directory, get the design compiled, simulate it, and
use the power of Tcl/Tk to display simulation results. This will involve adding
some missing Tcl code to finish the design.
The design itself is a self contained Blackjack game written at the RTL (Register
Transfer Level) level. Blackjack is a card game where the aim is to have a hand of
cards that adds up to score 21. Picture cards have a value of 10 and the Ace can
have a value of 1 or 11. Black jack is the name given to a score of 21 with a
picture card and an Ace. The test bench for the design generates the clock and
loads the playing cards into the internal memory.
There is a sequencer in the design that has a pseudo-random number generator
which selects the location in memory of the card to deal next. This card is
presented to the internal state machine that decides whether another card should
be dealt based on a stick value. The stick value can be adjusted as it is a generic on
the entity of the state machine. There is an accumulator that adds the values of the
cards and presents the values at the outputs. The design includes both VHDL and
Verilog RTL code, which is a common problem encountered when using IP. It
shows how simple and straightforward it is to mix HDL's in the simulator and still
have the benefits of full debug.
Directions
1. To set up the lab, invoke ModelSim and change directory to the
labs/lab3/blackjack directory (use the “cd” command or the File → Change
Directory… menu item.
2. Next we need to compile all the design files in the blackjack/Source
directory using a script:
ModelSim> do compile.do
ModelSim Advanced Debugging
December 2002
3-23
Test Benches
3. Click on the Library tab in the Main window, expand the work library and
find the testbench entity. Double-click on it to load the design. Let's add
the top-level signals of the design to the Wave window. First, open the
Wave window by selecting the menu View → Wave. Then, from the
“Sim” tab in the Main window, drag and drop the top-level testbench into
the Wave window. This will add all the signals at that level of hierarchy.
4. Next, we're going to load some Tcl code that displays the blackjack table
and cards. Type “do black.tcl”. This will print a bunch of messages to the
transcript window, and it creates a button labeled “Build” in the lower right
corner of the main window (you may need to grow the main window so you
can see the button). Click on the button to build the blackjack table.
5. We can now run the simulation and play blackjack. Click on the “Start”
button to start the simulation. Let it run for a while so that it plays several
hands. You might notice that the simulation runs too fast to really see who
won each hand. We're going to fix that. Hit the Stop button.
6. There is a signal in the Wave window that goes high after every hand. It is
called “winstrobe”. We can trigger off that signal to stop the simulation.
Now, try to write a “when” expression to detect when the winstrobe signal
goes high. You can execute this in the Main window, because ModelSim
accepts Tcl commands interactively. Show that here:
Answer: ___________________________________________________
7. A common command you would give the “when” statement to execute
when the condition becomes true would be the “stop” command. This tells
the simulator to break when the condition becomes true. In this case, we're
not going to use this, but instead set a Tcl variable that is already defined to
stop the simulation. So, in the body of the “when” command, we'll put the
following Tcl code there:
Set running 1
8. We also want to display who won the hand. The “winner” signal in the
design is high when the dealer won the hand, and low when the player won.
There is also a Tcl function already defined that draws a picture of who
won. The function is “draw_winners_picture”, and it takes one parameter,
3-24
ModelSim Advanced Debugging
December 2002
Test Benches
which is true when the dealer won, and false when the player won. It then
draws the corresponding picture to the screen.
In this exercise, write a Tcl statement that calls the draw function with the
correct parameter to indicate who won. (Hint: use the examine command
and brackets “[]”):
Answer: ___________________________________________________
9. Now if we piece together the “when” command, the “set” command to stop
the simulation, and the tcl statement to draw the winner, we'll have fixed the
design. The following code shows it all together… this is what you need to
enter into ModelSim at the VSIM command prompt to get it to stop and
draw the winner every hand. Type as shown with carriage returns.
when {/testbench/winstrobe == '1'} {
set running 1
draw_winners_picture [examine /testbench/winner]
}
10. After you enter this on the ModelSim command line, and assuming there
weren't any mistakes, you can click the continue button on the blackjack
table to resume the simulation. Now, the simulator will stop after each
hand, so you'll now have to keep hitting continue to keep it running. Notice
the bitmaps of the winner each time.
11. The last step of this lab is to see if you can to change the colors of the
buttons on the blackjack table. Open the black.tcl file to determine where
the buttons are defined. Then change the background colors for the start,
stop, and continue buttons to green, red, and yellow respectively.
12. Use the -background option followed by the color at the end of each line for
the start, stop, and continue buttons.
13. Stop and quit the Blackjack GUI display. Type the following at the
ModelSim prompt:
ModelSim> do black.tcl
ModelSim Advanced Debugging
December 2002
3-25
Test Benches
14. Click on the Build button to see the buttons with the new background
colors.
3-26
ModelSim Advanced Debugging
December 2002
Test Benches
Lab 3b: Signal Spy
Introduction
The ability to access registers or signals though hierarchy has been a strength of
Verilog. VHDL does not have this capability. To traverse hierarchy of a mixed
HDL or VHDL design had required the FLI or PLI. ModelSim v5.5 and newer
introduces a VHDL ability to probe through VHDL hierarchy. The new VHDL
library modelsim_lib is now mapped to in the modelsim.ini file. There is also a
new Verilog system task that provides the same ability with Verilog. This
provides access to all levels of the design regardless of the language.
Verilog
$init_signal_spy
The $init_signal_spy() system task deposits the value of a VHDL signal or
Verilog register/wire onto an existing Verilog register. This system task allows
you to reference VHDL signals at any level of hierarchy from within a Verilog
module or reference Verilog registers/wires at any level of hierarchy from within a
Verilog module when there is an interceding VHDL block.
Syntax
$init_signal_spy (source, destination, verbose)
ModelSim Advanced Debugging
December 2002
3-27
Test Benches
Arguments
Name
Type
Description
source
string
Required. A full hierarchical path (or relative path with reference
to the calling block) to a VHDL signal or Verilog register/wire.
Use the path separator to which your simulation is set (i.e. / or .).
The path must be contained within double quotes.
destination
string
Required. A full hierarchical path (or relative path with reference
to the calling block) to a Verilog register. Use the path separator
to which your simulation is set (i.e., / or .). A full hierarchical
path must begin with a “/” or “.”. The path must be contained
within double quotes.
verbose
integer
Optional. Possible values are 1 or 0. Specifies whether a message
is reported in the transcript stating that the source is driving the
destination. Default is 0, no message.
Returns
Nothing
Limitations
When depositing the value of a VHDL signal onto a Verilog register, the VHDL
signal must be of type bit, bit_vector, std_logic, or std_logic_vector
module ...
Reg top_sig1;
...
initial
begin
$init_signal_spy("/top/uut/inst1/sig1","/top_sig1",1);
end
...
endmodule
3-28
ModelSim Advanced Debugging
December 2002
Test Benches
VHDL
util package
The util package is included in ModelSim versions 5.5 and later. It serves as a
container for various VHDL utilities. The package is part of the modelsim_lib
library that is located in the modelsim install tree and mapped in the default
modelsim.ini file.
init_signal_spy()
The init_signal_spy() utility deposits the value of a VHDL signal or Verilog
register/wire onto an existing VHDL signal. This allows you to reference signals,
registers, or wires at any level of the hierarchy from within a VHDL architecture
(e.g., a test bench).
Syntax
init_signal_spy (source, destination, verbose)
Arguments
Name
Type
Description
source
string
Required. A full hierarchical path (or relative path with reference
to the calling block) to a VHDL signal or Verilog register/wire.
Use the path separator to which your simulation is set (i.e. / or .).
The path must be contained within double quotes.
destination
string
Required. A full hierarchical path (or relative path with reference
to the calling block) to a Verilog register. Use the path separator
to which your simulation is set (i.e., / or .). A full hierarchical
path must begin with a “/” or “.”. The path must be contained
within double quotes.
verbose
integer
Optional. Possible values are 1 or 0. Specifies whether a message
is reported in the transcript stating that the source is driving the
destination. Default is 0, no message.
Returns
Nothing
ModelSim Advanced Debugging
December 2002
3-29
Test Benches
Limitations
When depositing the value of a Verilog register/wire onto a VHDL signal, the
VHDL signal must be of type bit, bit_vector, std_logic, or std_logic_vector.
Referencing slices or single bits of a vector is not supported. If you do reference a
slice or bit of a vector, the function will assume that you are referencing the entire
vector.
Example
Library modelsim_lib;
Use modelsim_lib.util.all;
entitiy top is
end;
archicture ...
signal top_sig1 : std_logic;
begin
...
spy_process : process
begin
init_signal_spy("/top/uut/inst1/sig1","/top_sig1",1);
wait;
end process spy_process;
...
end;
Directions
VHDL on top Lab Exercise
1. Change the directory to the labs/lab3/vhdl_spy directory.
2. Compile the design (do compile.do) or:
vlib
vlog
vlog
vlog
3-30
work
cache.v
memory.v
proc.v
ModelSim Advanced Debugging
December 2002
Test Benches
vcom -93 util.vhd
vcom -93 set.vhd
vcom -93 top.vhd
3. Load the design and open all windows: vsim top -do “view *”
The design is a mixedhdl design with VHDL and Verilog.
In the ModelSim Source window you will see the inclusion of the new
modelsim_lib library for the top-level source file, top.vhd
library modelsim_lib;
use modelsim_lib.util.all;
Select the modelsim_lib library from the ModelSim Main window, (Library
tab) and note the mapping for this library. Using the right mouse button
(RMB) select Properties from the pop-up menu:
Answer: __________________________________________________
The utility init_signal_spy can now be used in a process. The use of spy
requires a destination location as well as a source.
4. For this lab, we are going to “spy” on 3 signals down inside the design.
They are:
ModelSim Advanced Debugging
December 2002
3-31
Test Benches
/top/\c_\/wen
/top/p/addr
/top/\c_\/s1/junk_array
Use the sim tab of the Main window to navigate down to the instances
where these signals are contained. Select the instances as indicated below
and View → Source. Select the signal in the signals window and right-click
to bring up a pop-up window. Choose Signal Declaration. The source
window should now highlight where the signal is declared. If it's not
obvious from looking at the code, you can select the Tools → Describe
menu item in the Source window to display exactly how the signal is
declared.
Write down how the signal is declared here:
/top/\c_\/wen
_______________________________
/top/p/addr
_______________________________
/top/\c_\/s1/junk_array _______________________________
Now select the top design unit and go to the source window. Remove the
read-only flag on the source file by selecting the Edit → Read-Only menu
item. Then add three signal declarations for the mirrored signals which will
hold the values for the lower-level signals. Note that since the top-level is
VHDL, you'll have to use std_logic or std_logic_vector (with a similar
range) for signals that are mirrored from Verilog signals.
signal top_wen_reg : __________________________________
signal top_address_output : _____________________________
signal top_junk_array : _________________________________
Now add the “init_signal_spy” call to the process in the top-level VHDL
code. Find the process, and add 3 lines, one for each “spied” signal. Save
your changes in the source window.
3-32
ModelSim Advanced Debugging
December 2002
Test Benches
Spy_On_Some_Signals : process
begin
-- init_signal_spy("<lower_signal_path>","<top_mirrored_signal>", 1);
wait;
end process Spy_On_Some_Signals;
Now, recompile the top.vhd file with the new changes (vcom -93 top.vhd).
Restart the simulation (restart -f), and add all the top-level signals to the
design (add wave /*). Simulate by doing a “run -all”, and you should see
the spied-on signals in the wave window.
ModelSim Advanced Debugging
December 2002
3-33
Test Benches
3-34
ModelSim Advanced Debugging
December 2002
Module 4
Analyzing Performance
Objectives
Upon completion of this module, you will be able to:
• Describe challenges to achieve the best performance of simulations
• Describe the Performance Analyzer capabilities and value
• Describe Code Coverage Benefits and Value
• Describe things to avoid in models that negatively impact performance
• List the different graphical views of performance analysis results
• Describe the “in” and “under” information in performance analysis results
• List ways to improve Verilog RTL and Verilog gate-level simulations
• List certain Verilog commands
• List certain VHDL commands
ModelSim Advanced Debugging
December 2002
4-1
Analyzing Performance
Module Overview
Module Overview
In this module we will discuss:
♦ Code Coverage
♦ Performance Analyzer
●
●
●
●
●
♦
♦
♦
♦
♦
♦
Turn Profiling On and Off
Clear Profile Results
Enable Profiler and View Results
Interpret Profile Results Fields
Interpret Ranked and Hierarchical Results Differences
Coding For Performance
RTL Optimization
Gate-Level Optimization
vlog commands
vcom commands
Other Performance Tips
4-2 • ModelSim® Advanced Debugging: Analyzing Performance
Copyright © 2002 Mentor Graphics Corporation
Notes:
4-2
ModelSim Advanced Debugging
December 2002
Analyzing Performance
Challenges
Challenges
♦ What’s holding back the
performance of your
simulation environment ?
●
●
●
●
●
the design?
data types?
the test bench?
coding styles?
un-necessary code?
4-3 • ModelSim® Advanced Debugging: Analyzing Performance
Copyright © 2002 Mentor Graphics Corporation
Notes:
ModelSim Advanced Debugging
December 2002
4-3
Analyzing Performance
Code Coverage — Integrated Line
Coverage
Code Coverage — Integrated Line Coverage
♦ Tightly integrated with ModelSim
●
●
●
●
No Learning another Tool
No instrumented code
Approx. 3% performance impact.
Use By ALL designers
♦ Line Coverage Can Give
●
●
●
Statement Coverage
Branch Coverage
Limited State Coverage
♦ Line Coverage Enough For The Majority
●
3rd Party Tool Used For Detailed Analyst
4-4 • ModelSim® Advanced Debugging: Analyzing Performance
Copyright © 2002 Mentor Graphics Corporation
Notes:
4-4
ModelSim Advanced Debugging
December 2002
Analyzing Performance
Verification Code Coverage
Verification Code Coverage
♦ No Compiler Impact
♦ Start “vsim” With The -coverage Switch
vsim -coverage work.test_bench_rtl
♦ Graphical and/or Report File Feedback
●
●
File By File Bar Graph
Line Annotation
4-5 • ModelSim® Advanced Debugging: Analyzing Performance
Extra column displays
which lines of code
have been executed
Copyright © 2002 Mentor Graphics Corporation
Notes:
Line coverage is performed on the executable lines therefore it is possible to
switch off some of the optimizations to see more lines or coverage on optimized
packages. Coverage is started by using the -coverage switch on VSIM. There is a
bar graph that allows you to view a summary of what is going on in each file. Also
the line counts are annotated onto the source window. Most designer have more
then one set of vectors to apply to the UUT. ModelSim also supports appending
simulation coverage runs.
ModelSim Advanced Debugging
December 2002
4-5
Analyzing Performance
Misses, Reporting and Exclusion
Misses, Reporting and Exclusion
♦ New Misses Window
♦ New Reporting
♦ Exclude Files And/Or Lines
using RMB
4-6 • ModelSim® Advanced Debugging: Analyzing Performance
Copyright © 2002 Mentor Graphics Corporation
Notes:
4-6
ModelSim Advanced Debugging
December 2002
Analyzing Performance
Exclusion
Exclusion
♦ A Green X denotes lines has been excluded from execution
4-7 • ModelSim® Advanced Debugging: Analyzing Performance
Copyright © 2002 Mentor Graphics Corporation
Notes:
ModelSim Advanced Debugging
December 2002
4-7
Analyzing Performance
Managing Coverage Data
Managing Coverage Data
♦ Clearing Code Coverage from Previous Simulations
●
All line number execution count data is reset
coverage clear
♦ Creating Coverage Reports
●
Textual output of coverage statistics
coverage report [-file <filename>] ...
♦ Reloading Coverage Data from Previous Reports
●
●
Gather statistics from multiple simulation runs into a single report
Merge coverage results using command line:
coverage reload <filename> [-incremental] [-keep]
4-8 • ModelSim® Advanced Debugging: Analyzing Performance
Copyright © 2002 Mentor Graphics Corporation
Notes:
4-8
ModelSim Advanced Debugging
December 2002
Analyzing Performance
Merging Coverage Report — GUI
Merging Coverage Report — GUI
♦ Merge results from two or more analyses using the GUI:
●
●
●
●
●
From the coverage_summary window
File > Open > Coverage > Merge Coverage
Specify one or more saved coverage reports to merge into the
current analysis
Clear current analysis coverage stats before merging into the
saved reports
Include coverage data for all merged files, even if not part of the
current design
4-9 • ModelSim® Advanced Debugging: Analyzing Performance
Copyright © 2002 Mentor Graphics Corporation
Notes:
ModelSim Advanced Debugging
December 2002
4-9
Analyzing Performance
Performance Analyzer
Performance Analyzer
♦ VHDL, Verilog, Mixed, ‘C’.
♦ Behavioral, Register Transfer Level and Gates
♦ Uncovers The Impact of …….
●
●
●
●
Non-Accelerated VITAL Library Cells
Un-needed Signals On Sensitivity List
Un-necessary Testbench Code
Architectural Bottlenecks
♦ Statistical Profiler
●
●
Shows % Of Run Time Per Line
100 Samples per second (simulation runtime) default
– sample collected every 10 ms
profile interval command
●
3000 to 4000 Samples enough to determine what is happening
4-10 • ModelSim® Advanced Debugging: Analyzing Performance
Copyright © 2002 Mentor Graphics Corporation
Notes:
When a simulation environment is executed, the user normally has to accept the
time required to run the simulation. The performance analyzer built into
ModelSim allows the user to display what parts of the model are taking the largest
percentage of simulation run time. The profiling will work for all modeling
languages supported and also at all levels of abstraction. It can uncover problems
such as a VITAL gate level cell that has not been globally accelerated due to it
being non level 1 compliant. It will uncover processes with un-necessary signals
on th sensitivity list causing it to be triggered too much. Some testbenches include
code that is not necessary for a particular test but still taking simulation time.
Design bottlenecks can also be easily located.
4-10
ModelSim Advanced Debugging
December 2002
Analyzing Performance
The Profiler collects samples with respect to real time not simulation time. A
sample is taken every 10 ms default during the simulation run. At the sample point
the simulator will be executing a line of code or a function of the kernel. All of
these samples are collected and presented to the user in an easy to understand
format based on the amount of simulation time spent in the users code. Because
the method used is statistical it is not necessary to run the simulation for the
complete during. Normally 3000 to 4000 samples is enough to determine what is
happening, this means that the simulation only has to be run for between 30 and
60 seconds.
ModelSim Advanced Debugging
December 2002
4-11
Analyzing Performance
Profile On
Profile On
♦ Turn on the Profiler prior to running the simulation
profile on
4-11 • ModelSim® Advanced Debugging: Analyzing Performance
Copyright © 2002 Mentor Graphics Corporation
Notes:
4-12
ModelSim Advanced Debugging
December 2002
Analyzing Performance
Taking Samples
Taking Samples
As the simulation runs, notice that the
Status Bar will show how many samples
are taken
You can access the
hierarchical or ranked profile
information through the menu
4-12 • ModelSim® Advanced Debugging: Analyzing Performance
Copyright © 2002 Mentor Graphics Corporation
Notes:
ModelSim Advanced Debugging
December 2002
4-13
Analyzing Performance
Graphical Views
Graphical Views
Ranked Output
Hierarchical Output
(sorted by in%)
Options > Edit Preferences
Set PrefCoverage(rankCutoffHighlight) 5
4-13 • ModelSim® Advanced Debugging: Analyzing Performance
(sorted by under%)
Copyright © 2002 Mentor Graphics Corporation
Notes:
There are two report windows that display the results of the profile. The first is the
ranked view. This displays the lines of code in a league table, the line taking most
of the simulation time at the top, down to the line that takes the least amount of
simulation time. This table is based on the In column. The In column is the
amount of time spent on or in that particular line of code or function. The
hierarchical view displays the break down of each of the lines of code hierarchy.
A line of code may have functions or procedures that is called, these functions and
procedures along with the line itself make up the amount of time that is spent
under a line of code. The hierarchical view is sorted in a league table based on the
under percentage. The highest to the lowest. The lines that take more than 5% of
the simulation time are displayed in red. The value that is used for this is the in
percentage. The display value limit can be changed using the options preferences.
4-14
ModelSim Advanced Debugging
December 2002
Analyzing Performance
Understanding In and Under
Understanding In and Under
Name
---decodera_body.vhd:502
%Under
-----9
%In
--4
502 : p_out <= new_state AFTER dlys(new_val);
function (5%)
Percentage “In” (4%)
4-14 • ModelSim® Advanced Debugging: Analyzing Performance
Percentage “Under” (9%)
Copyright © 2002 Mentor Graphics Corporation
Notes:
Above we can see a single line of VHDL code. The line is a concurrent signal
assignment that has a time delay controlled by a function. This can be used to
describe the differences between the under and in percentage. The in percentage
reports the amount on time that has been spent in or on the line. In this case 4% of
the simulation time has been spend executing this single line of VHDL code. The
under percentage, in this case 9%, is the amount of time that has been spent
executing this line of VHDL code plus any function or procedure that this line
calls. In this case the 9% would include the time spent within the dlys function. A
simple subtraction of the in value from the under value tells us how much time
was spent just supporting this line.
ModelSim Advanced Debugging
December 2002
4-15
Analyzing Performance
Example
Example
Ranked Output
Hierarchical Output
19% Simulation Time
Under This Line
4-15 • ModelSim® Advanced Debugging: Analyzing Performance
Copyright © 2002 Mentor Graphics Corporation
Notes:
If we look a little closer at the report windows we can understand how they are
interconnected and can used to understand what is happening in the simulation.
Here we can see that 19% of the simulation time has been taken under this
particular line of code. The hierarchical view orders the parent lines using the
under percentage from the highest to the lowest. It is possible to collapse the
children functions by press the "+" sign on each line.
4-16
ModelSim Advanced Debugging
December 2002
Analyzing Performance
Example (Cont.)
Example (Cont.)
Ranked Output
Hierarchical Output
19% =
4%(in) + (11 + 2 + 2)%(under)
4-16 • ModelSim® Advanced Debugging: Analyzing Performance
Copyright © 2002 Mentor Graphics Corporation
Notes:
The 19% is made up by adding the time spent on this parent line of code plus the
time spend under the functions that support this line. In this case the simulation
spent 4% in the line and 15% under in 3 different functions.
ModelSim Advanced Debugging
December 2002
4-17
Analyzing Performance
Example (Cont.)
Example (Cont.)
Ranked Output
Hierarchical Output
Ranked By In(%)
Highlight > 5%(In)
6% Spent In/On Function
4-17 • ModelSim® Advanced Debugging: Analyzing Performance
Copyright © 2002 Mentor Graphics Corporation
Notes:
If we take a look at the ranked view we can see that the lines are sorted by their in
value. Therefore the line or function that the simulation spent the most time in will
be displayed on the top. The entries in this report are additive therefore if a
function is called by more than one line in the hierarchical view, in the ranked
view they will be added together.
4-18
ModelSim Advanced Debugging
December 2002
Analyzing Performance
Example (Cont.)
Example (Cont.)
Ranked Output
Hierarchical Output
6%(In) = 4% + 2%
4-18 • ModelSim® Advanced Debugging: Analyzing Performance
Copyright © 2002 Mentor Graphics Corporation
Notes:
This can be seen by looking at the 6% of time spent in the function at line 216 of
the std_unsigned package in the ranked view. In the hierarchical view you will see
this line show up under two separate lines. One takes 4% and the other 2% making
the total of 6% shown in the ranked view.
ModelSim Advanced Debugging
December 2002
4-19
Analyzing Performance
Coding for Performance — Things to
Avoid
Coding for Performance — Things to Avoid
♦ Large arrays of signals
●
●
use variables or shared variables if possible
large memory impact - 100x
♦ math operations on std_logic_vectors
●
these operations are accelerated, but still it’s faster to use integers
♦ Gate-level simulation
●
use Verilog gate-level with VHDL testbench - it’s faster than VITAL
♦ Use concurrent assignments rather than processes with wait
statements
●
●
good: clk <= not clk after 100 ns;
bad: Process begin
while not suspend loop
clk <= ‘0’;
wait for 100 ns;
clk <= ‘1’;
end loop;
wait;
end process;
4-19 • ModelSim® Advanced Debugging: Analyzing Performance
Copyright © 2002 Mentor Graphics Corporation
Notes:
4-20
ModelSim Advanced Debugging
December 2002
Analyzing Performance
Coding for Performance — Things to
Avoid (Cont.)
Coding for Performance — Things to Avoid (Cont.)
♦ Initializing constants in loops rather than statically defining
them where they are declared.
♦ Treat vectors as “atomic”; avoid assigning to individual bits if
possible
●
simulator can treat vector as one object rather than “n”.
♦ Make sure to use the -fast switch for Verilog designs!
4-20 • ModelSim® Advanced Debugging: Analyzing Performance
Copyright © 2002 Mentor Graphics Corporation
Notes:
ModelSim Advanced Debugging
December 2002
4-21
Analyzing Performance
Coding for Performance — Things to
Avoid (Cont.)
Coding for Performance — Things to Avoid (Cont.)
♦ Make sure you don’t have too many signals in your sensitivity list
●
break up processes into multiple ones with separate sensitivity lists
inefficient : process (A, B, C, D)
begin
procedure_E(A,B);
procedure_F(C,D);
end process inefficient;
efficient_1 : process (A, B)
begin
procedure_E(A,B);
end process efficient_1;
~2x Faster
4-21 • ModelSim® Advanced Debugging: Analyzing Performance
efficient_2 : process (C, D)
begin
procedure_F(C,D);
end process efficient_2;
Copyright © 2002 Mentor Graphics Corporation
Notes:
4-22
ModelSim Advanced Debugging
December 2002
Analyzing Performance
Faster Verilog Simulations
Faster Verilog Simulations
♦ Use the -fast switch for best performance (Verilog RTL)
●
●
All source files for the design must be compiled in one vlog
invocation to use the -fast switch
Gives an extra 2-3x performance boost
♦ The -O5 switch adds additional optimizations
♦ By Default, ModelSim runs in debug-optimized mode
●
To run ModelSim in performance-optimized mode, add two vlog
command line switches:
vlog –O5 –fast <list of files or -f filelist.txt>
●
●
Significantly faster simulation performance
Module boundaries are flattened and loops are optimized so
some levels of debugging hierarchy are eliminated
4-22 • ModelSim® Advanced Debugging: Analyzing Performance
Copyright © 2002 Mentor Graphics Corporation
Notes:
ModelSim Advanced Debugging
December 2002
4-23
Analyzing Performance
Verilog Gate-Level
Verilog Gate-Level
♦ How do you improve performance?
●
Create separate work directories for the cell library and rest of
design
– Multi-million gate level netlist may require hour(s) to compile
– While working on optimizations you want to limit multiple compiles
to ASIC library ONLY
●
●
●
Compile cell library with -fast
Compile Device Under Test and Testbench WITHOUT -fast
WARNING: Compilation of large netlist with -fast will be very slow
and may require as much memory to compile as it does to
elaborate
– may fill /tmp space before complete
4-23 • ModelSim® Advanced Debugging: Analyzing Performance
Copyright © 2002 Mentor Graphics Corporation
Notes:
4-24
ModelSim Advanced Debugging
December 2002
Analyzing Performance
Verilog Gate-Level (Cont.)
Verilog Gate-Level (Cont.)
♦ Use the -fast switch for cell libraries
♦ 2-3x Faster!
●
●
●
Cached evaluator improves performance
Cache Management Algorithms
Architecture specific optimizations
♦ 2-4x smaller memory footprint use per cell
♦ 2-6x Faster SDF annotation algorithm
●
additional 30% memory reduction
OPTIMIZE
TIMING SHELL
4-24 • ModelSim® Advanced Debugging: Analyzing Performance
Copyright © 2002 Mentor Graphics Corporation
Notes:
ModelSim Advanced Debugging
December 2002
4-25
Analyzing Performance
vlog Commands
vlog Commands
♦ -O5 (capital oh 5)
●
●
●
●
●
Maximum optimization
Optimizes loops and case statements
Recommended use with large sequential blocks only
Other uses may increase compile times
Use with or without –fast
– Verify optimized design behaves the same as the original version
●
Other Levels
– -O0 (minimum)
• Work around bugs
• Increase debugging visibility on a specific cell
• Place breakpoints on source lines that have been optimized out
– -O1
• enable PE-level optimization
– -O4
• enable standard SE optimization
4-25 • ModelSim® Advanced Debugging: Analyzing Performance
Copyright © 2002 Mentor Graphics Corporation
Notes:
4-26
ModelSim Advanced Debugging
December 2002
Analyzing Performance
vlog Commands (Cont.)
vlog Commands (Cont.)
♦ +opt
●
●
●
Optimizes designs that have been previously compiled
unoptimized (without the -fast option)
Supported in ModelSim release 5.5c and newer
Same optimization as -fast
–
–
–
–
–
●
Merges always blocks
Performs cell- and gate-level optimization
In-lines (combines) instantiated modules
Reduces / eliminates events
Improves memory performance
Supports incremental compilation
– Loads design units from the libraries and regenerates optimized code
vlog +opt+[<lib>.]<module>
vlog +opt+cpu_rtl
– Top-level module is cpu_rtl
vlog +opt+testbench+globals
– Design has two top-level modules; testbench & globals
4-26 • ModelSim® Advanced Debugging: Analyzing Performance
Copyright © 2002 Mentor Graphics Corporation
Notes:
ModelSim Advanced Debugging
December 2002
4-27
Analyzing Performance
vlog Commands for Gate-Level
Simulation
vlog Commands for Gate-Level Simulation
♦ -debugCellOpt
●
●
●
Produces Transcript window output that identifies why certain
cells in the design were not optimized
Used only with Verilog gate-level libraries with -fast | +opt switch
write cell_report command produces text file listing all modules
Module: top
Architecture: fast
Module: bottom (cell)
Architecture: fast
– Both top & bottom compiled with -fast
– bottom was optimized
• “(cell)” after the name of optimized module
– top was not optimized
4-27 • ModelSim® Advanced Debugging: Analyzing Performance
Copyright © 2002 Mentor Graphics Corporation
Notes:
4-28
ModelSim Advanced Debugging
December 2002
Analyzing Performance
vlog Commands for Gate-Level
Simulation (Cont.)
vlog Commands for Gate-Level Simulation (Cont.)
♦ +nocheck
●
●
●
Increase the performance of -fast | +opt switch
Supported in ModelSim release 5.5b and newer
Only effective with Verilog gate-level designs with -fast | +opt
+nocheckCLUP
– Allows connectivity loops in a cell to be optimized
+nocheckDNET
– Allows both the port & the delayed port (created for negative
setup/hold) to be used in the functional section of the cell
+nocheckOPRD
– Allows an output port to be read internally by the cell
+nocheckSUDP
– Allows a sequential UDP to drive another sequential UDP
+nocheckALL
– Enables all +nocheck arguments
4-28 • ModelSim® Advanced Debugging: Analyzing Performance
Copyright © 2002 Mentor Graphics Corporation
Notes:
ModelSim Advanced Debugging
December 2002
4-29
Analyzing Performance
vlog Commands for RTL Simulation
vlog Commands for RTL Simulation
♦ Batch Mode can be optimized for Debug or Performance
♦ Object visibility
●
●
●
-fast | +opt impacts design visibility
nets, ports and registers may be unavailable for viewing
PLI access handles may be missing
♦ Use +acc to retain access to specific design objects
●
●
●
●
●
For maximum performance use only as needed
+acc[=<spec>][+module>[.]]
“.” indicates all children of a module
“+” used to separate multiple modules
spec can be
–
–
–
–
–
“r” = access to registers
“n” = access to nets
“p” = access to ports
“b” = access to individual bits of a vector
“l” = access to Line number
4-29 • ModelSim® Advanced Debugging: Analyzing Performance
Copyright © 2002 Mentor Graphics Corporation
Notes:
4-30
ModelSim Advanced Debugging
December 2002
Analyzing Performance
vlog Commands
vlog Commands
♦ -fast
●
Allows parameter propagation and global optimization
Must compile source code for entire design, no incremental
compilation
Once the design is compiled, it can be simulated in the usual way
●
vlog -O5 -fast -debugCellOpt testbench.v cpu_rtl.v
●
●
– Compiles all modules in testbench.v and cpu_rtl.v using global
optimizations
●
vlog -O5 -fast=opt1 -debugCellOpt testbench.v cpu_rtl.v
– Assigns the secondary name “opt1” to the optimized modules
●
vlog -O5 -fast -debugCellOpt +acc=rn testbench.v cpu_rtl.v
– Enables register and net access in all modules
4-30 • ModelSim® Advanced Debugging: Analyzing Performance
Copyright © 2002 Mentor Graphics Corporation
Notes:
ModelSim Advanced Debugging
December 2002
4-31
Analyzing Performance
vcom Commands
vcom Commands
♦ -rangecheck
●
●
Enabled by default
Enables run time range checking
– Verifies that a scalar value defined with a range subtype is always
assigned a value within its range
●
Range checking can be disabled using –norangecheck
♦ -norangecheck
●
●
●
●
●
Disabled by default
Disables run time range checking
Can result in a 2X speed increase
Range checking can be enable using –rangecheck
-noindexcheck for arrays
♦ -O5
●
Same as for vlog
4-31 • ModelSim® Advanced Debugging: Analyzing Performance
Copyright © 2002 Mentor Graphics Corporation
Notes:
4-32
ModelSim Advanced Debugging
December 2002
Analyzing Performance
Using Elaboration Files
Using Elaboration Files
♦ Compile Once (vcom and/or vlog)
♦ Run Elaboration Step Once: vsim -elab filename
♦ Simulate Multiple times: vsim -load_elab filename
Standard ModelSim Flow
vcom
COMPILE
vsim
ELAB
vsim
SIM
ELAB
vsim
SIM
ELAB
SIM
Optional ModelSim Flow using Elaboration File
vcom
COMPILE
vsim
-elab
ELAB
vsim
vsim
vsim
-load_elab -load_elab -load_elab
SIM
4-32 • ModelSim® Advanced Debugging: Analyzing Performance
SIM
Time Savings
SIM
Copyright © 2002 Mentor Graphics Corporation
Notes:
Elaboration refers to the process of generating native code for your platform. The
ModelSim simulator, vsim, elaborates every time you load a design. If elaboration
is a significant part of your overall simulation run time, you can isolate the
elaboration phase to improve your throughput. In other words, you create an
elaboration file once, and then simulate it multiple times. Elaboration files can be
used for RTL or gate-level runs.
For example a multi-million, gate-level run may take 20 minutes to elaborate and
annotate SDF timing, and an additional 20 minutes to run. A second run with
different testbench stimulus also takes 20 minutes to load and 20 minutes to run. If
you generate an elaboration file on the first run, you eliminate the 20-minute
ModelSim Advanced Debugging
December 2002
4-33
Analyzing Performance
elaboration and SDF annotation time for the second and subsequent runs. Loading
an elaboration file takes seconds, instead of minutes.
In many cases design-loading time is not that important. For example if you are
doing iterative design, where you simulate the design, modify the source,
recompile and re-simulate, the load time is just a small part of the overall flow.
However, if your design is locked down and only the test vectors are modified
between runs, loading time may materially impact overall simulation time,
particularly for large designs loading SDF files.
4-34
ModelSim Advanced Debugging
December 2002
Analyzing Performance
General Performance Issues
General Performance Issues
♦ In general, simulation load and run times increase when you
simulate with timing information. The following tips help
maximize simulator performance:
●
●
●
Run on the fastest machine possible. “Fast’ means lots of local
memory and a fast CPU.
If possible, the design being simulated should be located on the
machine running the simulation. Files stored elsewhere have to
cross the network and thus slow run times.
Run the job on a machine that is not running other jobs. The
more tasks the machine is running the less cycles spent on
simulation.
4-33 • ModelSim® Advanced Debugging: Analyzing Performance
Copyright © 2002 Mentor Graphics Corporation
Notes:
ModelSim Advanced Debugging
December 2002
4-35
Analyzing Performance
General Performance Issues (Cont.)
General Performance Issues (Cont.)
♦ The following tips help maximize simulator performance:
●
●
●
●
Wave, List or Log only the signals of interest
Use checkpoint/restore to avoid re-simulating the same portions
of a design
If possible, run in non-GUI or batch mode
Run in a timescale fine enough to catch the smallest events
expected, e.g. if the SDF file units are in nanoseconds and the
values in the timing triplets have only two significant figures
(.12, .23, .32) then 10s of Pico seconds is sufficient
♦ Additional Info:
http://www.model.com/resources/pdf/optimizing_perf_56b.pdf
4-34 • ModelSim® Advanced Debugging: Analyzing Performance
Copyright © 2002 Mentor Graphics Corporation
Notes:
4-36
ModelSim Advanced Debugging
December 2002
Analyzing Performance
Summary
Summary
This module introduced and explored the application of the
following topics:
♦ Code Coverage
♦ Coding for Performance
♦ The Performance Analyzer
♦ Managing the Profiler and Results
♦ RTL Optimization
♦ Gate-Level Optimization
♦ vlog Commands
♦ vcom Commands
♦ General performance Tips
4-35 • ModelSim® Advanced Debugging: Analyzing Performance
Copyright © 2002 Mentor Graphics Corporation
Notes:
ModelSim Advanced Debugging
December 2002
4-37
Analyzing Performance
Lab 4: Analyzing Performance
Introduction
This lab will allow the study of the performance impacts of using different coding
styles, data types and design structure. We will also use code coverage to examine
simulation coverage results. The design is a circuit that decodes 24 Bit InputVectors with 20 comparisons. It is made up of approx. 2500 Gates. It is developed
to study the effect of coding styles of large decode blocks.
Directions
To set up the lab, invoke ModelSim and change directory (File → Change
Directory) to the labs/lab4/decoder20x24 directory. Then create a new project file
by choosing the File → New → Project menu item. For the project name, use
“perflab”. Click on “Add Existing File” in the Add items to the Project dialog
box. Click on “Browse...” and select all the .vhd files in the decoder20x24
directory. Leave the radio-button checked that says “Reference from current
location”. Close the Add items to the Project dialog box after the files have been
added to the project.
1. First we will simulate the decoder design that is implemented as a large
“case” statement.
To do this, select the “decoder_case_stdlogic.vhd” file and right-click on it.
Then select Compile → Compile Selected. Compile the testbench
“top_loop_tb.vhd” by right clicking on it and selecting Compile →
Compile Selected. Click on the “Library” tab, expand the work library,
and notice the top-level entity name is “top_std”. Load top_std into the
simulator with code coverage enabled by typing:
ModelSim> vsim -coverage top_std
Enable the profiler by typing:
VSIM> profile on
Run the simulation for 16 ms by typing:
4-38
ModelSim Advanced Debugging
December 2002
Analyzing Performance
VSIM> time {run 16 ms}
When the simulation is finished, the number of microseconds it took to run
will be printed in the transcript window. Record the number of seconds it
took below (move the decimal point 6 places to get the number of seconds):
Decoder run time for “Case” implementation using stdlogic types with
code coverage:
_______________
View the code coverage results by typing
VSIM> view_coverage
The Coverage Summary window reports 86 executable lines in
decoder_case_stdlogic.vhd with 86 hits (executable lines touched during
the simulation), which equates to 100% code coverage. Click on the
decoder_case_stdlogic.vhd pathname to display the
decoder_case_stdlogic.vhd file in the Source window. Notice the number of
hits for each executable line of code shown along the left-most column in
the Source window.
Export the code coverage results to an ASCII file by typing
VSIM> coverage report -file dec_case_coverage.txt -lines
View this file with notepad by typing
VSIM> notepad dec_case_coverage.txt
View the profile results as a ranked profile by typing
VSIM> view_profile_ranked
Note that 24% of the simulation time is spent on line 32 of the
decoder_case_stdlogic.vhd file. Click on this line in the Ranked Profile
window to display the decoder_case_stdlogic.vhd file in the Source
window. Line 32 is a conversion function converting std_logic_vector to
integer.
ModelSim Advanced Debugging
December 2002
4-39
Analyzing Performance
Close the Ranked Profile window and the Coverage Summary window.
Reset the coverage data statistics by typing coverage clear in the
ModelSim Main window. Quit the current simulation (quit -sim) and
resimulate (vsim top_std) with profiling (profile on) and without code
coverage for 16 ms (time {run 16 ms}). Compare the simulation run time
with code coverage off.
Decoder run time for “Case” implementation using stdlogic types w/o code
coverage:
_______________
Code Coverage consumed minimal overhead run time.
2. Now go back to the “Project” tab and recompile the design, but this time
use the “decoder_if_stdlogic.vhd” file (select the file, right-click and select
Compile → Compile Selected). This will compile the same decoder
implemented as an “if” statement instead of a “case” statement. Recompile
the testbench “top_loop_tb.vhd” by right clicking on it and selecting
Compile → Compile Selected. Load top_std into the simulator (vsim
top_std), turn on the profiler (profile on), and then run the simulation
again (time {run 16 ms}). Enter the run time here:
Decoder run time for “If” implementation using stdlogic types:
_______________
View the profile results as a ranked profile by typing
VSIM> view_profile_ranked
Note that 21% of the simulation time is spent on a conversion function
converting an integer to std_logic_vector; line 30 of the “top_loop_tb.vhd”
file. The std_logic_vector to integer conversion function, line 32 of
“decoder_if_stdlogic.vhd”, consumes 19% of the simulation time. Approx.
40% of the simulation time was spent converting std_logic signals to
integers and vice versa.
4-40
ModelSim Advanced Debugging
December 2002
Analyzing Performance
A logical way to speed up the simulation is to avoid converting between the
two data types. For the next step, we have already re-coded part of the
design to use integers wherever possible, in order to avoid doing the
conversion. This is actually quite common; many designs manipulate
std_logic_vector by doing adds, subtracts, conversions, etc. which are very
expensive in simulation time. Whenever it’s possible to use integers, the
simulation will run much faster.
3. Run the re-coded integer version of the decoder block. Close the Ranked
Profile window, and go back to the “Project” tab of the ModelSim Main
window. First compile the “decoder_integer.vhd” file following the steps
described in Steps 1 and 2, and then compile the testbench
“top_loop_int_tb.vhd”. Go to the “Library” tab and load the top_int entity
by double clicking on it. Turn on the profiler (you can type !prof to do the
last command starting with prof), and run the simulation (time {run 16
ms}), or just !time. Enter the run time here:
Decoder run time for “If” implementation using INTEGER types:
_______________
The simulation time should be much shorter now using the type integer.
ModelSim v5.6 incorporates an aggressive loop optimization for faster
simulation run times. The following exercise may run slower than the
current one.
4. Re-run the simulation one more time using the following arithmetic
increment construct:
address <= address + 1 after cycletime;
Go through the same steps as before. Use the “decoder_integer.vhd” design
file and the “top_fixed_tb.vhd” testbench (the same file as the last run, but
the loop has been replaced with the above increment line).Compile these
files, reload the simulation, turn on the profiler and time the run for 16 ms
using the following commands:
VSIM> quit -sim
ModelSim> vcom decoder_integer.vhd
ModelSim Advanced Debugging
December 2002
4-41
Analyzing Performance
ModelSim> vcom top_fixed_tb.vhd
ModelSim> vsim top_int
VSIM> profile on
VSIM> time {run 16 ms}
Enter the run time here:
Decoder run time using the increment line instead of the loop:
_______________
If you bring up the Ranked Profile window (Tools→ Profile→ View
ranked profile), you can see that the increment line (line 28) used only
12% of the simulation time.
Quit the simulator (quit -f).
5. These various runs illustrate how coding style can affect simulation run
time. We can significantly shorten run times without altering functionality.
Figure out how much improvement we made to the design, by entering the
results below:
4-42
ModelSim Advanced Debugging
December 2002
Analyzing Performance
Slowest simulation run time from the (select one: “case”, “if”,
“integer”,“increment”) run w/o code coverage =
________ seconds
Fastest simulation run time from the (select one: “case”, “if”,
““integer”,“increment”) run w/o code coverage =
________ seconds
Ratio of slowest/fastest run times: ____.__ x faster
ModelSim Advanced Debugging
December 2002
4-43
Analyzing Performance
4-44
ModelSim Advanced Debugging
December 2002
Module 5
Virtual Signals
Objectives
Upon completion of this module, you will be able to:
• Describe what virtual objects are and their role in debugging
• Explain the purpose of virtual signals, regions and functions
• Explain how to create virtual signals, regions and functions
• List some virtual commands and describe how to use them
ModelSim Advanced Debugging
December 2002
5-1
Virtual Signals
Module Overview
Module Overview
In this module we will discuss:
♦ Virtual Objects
●
●
●
●
Virtual Signals
Virtual Regions
Virtual Functions
Virtual Types
5-2 • ModelSim® Advanced Debugging: Virtual Signals
Copyright © 2002 Mentor Graphics Corporation
Notes:
5-2
ModelSim Advanced Debugging
December 2002
Virtual Signals
Virtual Objects
Virtual Objects
♦ Objects created in the user-interface to display combinations
or expressions of logged signals in the design
♦ Do not exist in kernel
♦ Supported in ModelSim v5.3 and newer
♦ Object Types
●
●
●
●
Virtual Signals
Virtual Regions
Virtual Functions
Virtual Types
5-3 • ModelSim® Advanced Debugging: Virtual Signals
Copyright © 2002 Mentor Graphics Corporation
Notes:
Virtual objects are signal-like or region-like objects created in the GUI that do not
exist in the ModelSim simulation kernel. ModelSim supports the following types
of virtual objects:
• Virtual Signals
• Virtual Functions
• Virtual Regions
• Virtual Types
ModelSim Advanced Debugging
December 2002
5-3
Virtual Signals
Virtual Signals
Virtual Signals
♦ Aliases for combinations of signals
♦ Aliases for sub-elements of signals
♦ Can be displayed in …
●
●
●
Signals Window
List Window
Wave Window
♦ Accessed using "examine”
♦ Set using "force"
♦ Created by menu selections or "virtual signal" command
5-4 • ModelSim® Advanced Debugging: Virtual Signals
Copyright © 2002 Mentor Graphics Corporation
Notes:
Virtual signals are aliases for combinations or subelements of signals written to
the logfile by the simulation kernel. Virtual signals may be displayed by the
signals, list or wave window, accessed by the "examine" command, and set using
the "force" command.
Virtual signals may be created by menu selections in the signals, wave or list
windows, or created by the "virtual signal" command
5-4
ModelSim Advanced Debugging
December 2002
Virtual Signals
Virtual Signals (Cont.)
Virtual Signals (Cont.)
Automatically saved with the list or wave format
Internally Created Virtual
Hierarchical Context
Parent Region
5-5 • ModelSim® Advanced Debugging: Virtual Signals
User-defined Name
Text String Expression
Copyright © 2002 Mentor Graphics Corporation
Notes:
virtual signal [-env <path>] [-install <path>] [-implicit] {<expressionString>}
<name>
Creates a new signal, known only by the GUI, not the kernel, that consists of
concatenations of signals and subelements as specified in <expressionString>.
Cannot handle bit selects and slices of Verilog registers.
Option "-env" (optional) specifies a hierarchical context for the signal names in
<expressionString> so they don't all have to be full paths.
Option "-install" (optional) causes the newly-created signal to become a child of
the specified region.
ModelSim Advanced Debugging
December 2002
5-5
Virtual Signals
Option "-implicit" (optional) is used internally to create virtuals that are
automatically saved with the list or wave format.
Arg "{<expressionString>}" (required) is a text string expression in the MTI GUI
expression format. See (TBD) for a full and updated description.
Arg "<name>" (required) is the user-defined name of the virtual signal.
5-6
ModelSim Advanced Debugging
December 2002
Virtual Signals
Virtual Signals (Cont.)
Virtual Signals (Cont.)
virtual signal -install sim:/testbench { /chipa/alu/a(19 downto 13) &
/chipa/decode/inst & /chipa/mode } stuff
/chipa/alu/a is of type std_logic_vector
/chipa/decode/inst is a user-defined enumeration
/chipa/mode is of type integer
Produces sim:/testbench/stuff which is a record type
add wave sim:/testbench/stuff
added to the waveform window
virtual signal { chip.instruction[23:21] } address_mode
Produce alias chip.address_mode
5-6 • ModelSim® Advanced Debugging: Virtual Signals
Copyright © 2002 Mentor Graphics Corporation
Notes:
Examples of virtual signals:
virtual signal -install sim:/testbench { /chipa/alu/a(19 downto 13) &
/chipa/decode/inst & /chipa/mode } stuff
Assuming /chipa/mode is of type integer and /chipa/alu/a is of type
std_logic_vector, and /chipa/decode/inst is a user-defined enumeration, this
example creates a signal sim:/testbench/stuff which is a record type with three
fields corresponding to the three specified signals.
ModelSim Advanced Debugging
December 2002
5-7
Virtual Signals
virtual signal { chip.instruction[23:21] } address_mode
This creates a three-bit signal, chip.address_mode, as an alias to the specified bits.
5-8
ModelSim Advanced Debugging
December 2002
Virtual Signals
Virtual Regions
Virtual Regions
♦ virtual region creates a new user-defined design hierarchy region
virtual region <parentPath> < regionName>
♦ <parentPath>
●
●
Full path to the region that will become the parent of the new region
Required
♦ <regionName>
●
●
Name you want for the new region
Required
5-7 • ModelSim® Advanced Debugging: Virtual Signals
Copyright © 2002 Mentor Graphics Corporation
Notes:
ModelSim Advanced Debugging
December 2002
5-9
Virtual Signals
Virtual Functions
Virtual Functions
♦ Known only by the GUI, not the kernel
♦ Not aliases of combinations or elements of signals logged by
the kernel
♦ Logical operations on logged signals
♦ Can be displayed in …
●
●
●
Signals Window
List Window
Wave Window (Expand Children)
♦ Accessed using "examine”
♦ Can not be set using "force"
♦ Inverse of a signal, a type conversion, or an OR-reduction of
the XOR of two vector signals
5-8 • ModelSim® Advanced Debugging: Virtual Signals
Copyright © 2002 Mentor Graphics Corporation
Notes:
Virtual functions behave in the GUI like signals but are not aliases of
combinations or elements of signals logged by the kernel. They consist of logical
operations on logged signals and may be dependent on simulation time. They may
be displayed in the signals, wave or list windows, accessed by the "examine"
command, but cannot be set by the "force" command.
An example would be a virtual function defined as the inverse of a given signal, a
type conversion on a signal, or a the OR-reduction of the XOR of two vector
signals.
5-10
ModelSim Advanced Debugging
December 2002
Virtual Signals
Virtual Functions (Cont.)
Virtual Functions (Cont.)
Internally Created Virtual
Hierarchical Context
User-defined Name
Text String Expression
Parent Region
Can Handle bit selects or slices of Verilog registers
5-9 • ModelSim® Advanced Debugging: Virtual Signals
Copyright © 2002 Mentor Graphics Corporation
Notes:
virtual function [-env <path>] [-install <path>] [-implicit] {<expressionString>} <name>
Creates a new signal, known only by the GUI, not the kernel, that consists of
logical operations on existing signals and simulation time, as described in
<expressionString>. Can handle bit selects and slices of Verilog registers.
The virtual function will show up in the wave and signals window as an
expandable object if it references more than a single scalar signal. The children
correspond to the inputs of the virtual function. This allows the virtual function to
be "expanded" in the wave window to see the values of each of the input
waveforms, which could be useful when using virtual functions to compare two
signal values.
ModelSim Advanced Debugging
December 2002
5-11
Virtual Signals
Virtual Functions (Cont.)
Virtual Functions (Cont.)
virtual function {not /chip/section1/clk } clk_n
/chip/section1/clk_n becomes inverse
virtual function -install /chip { (std_logic_vector) chip.vlog.rega } rega_slv
Converts and installs into /chip
virtual function {/chip/addr[11:0] == 0xfab } addr_eq_fab
Boolean Signal true when signal equals hex FAB
virtual function {gate:/chip/siga XOR rtl:/chip/siga} siga_diff
High when /chip/siga of the gate-level version of a design does
not match /chip/siga of the rtl version of a design.
add wave siga_diff
(this adds the above function to the waveform window)
5-10 • ModelSim® Advanced Debugging: Virtual Signals
Copyright © 2002 Mentor Graphics Corporation
Notes:
Examples of virtual functions:
virtual function { not /chip/section1/clk } clk_n
Creates a signal /chip/section1/clk_n which is the inverse of /chip/section1/clk.
virtual function -install /chip { (std_logic_vector) &
chip.vlog.rega } rega_slv
Creates a std_logic_vector equivalent of a verilog register "rega" and installs it as
/chip/rega_slv.
5-12
ModelSim Advanced Debugging
December 2002
Virtual Signals
virtual function { /chip/addr[11:0] == 0xfab } addr_eq_fab
Creates a boolean signal /chip/addr_eq_fab that is true when /chip/addr[11:0] is
equal to hex "fab", and false otherwise. It is ok to mix VHDL signal path notation
with Verilog part-select notation.
virtual function { gate:/chip/siga XOR rtl:/chip/siga) } siga_diff
Creates a signal that is non-zero only high during times at which a signal
/chip/siga of the gate-level version of a design does not match /chip/siga of the rtl
version of a design.
ModelSim Advanced Debugging
December 2002
5-13
Virtual Signals
Virtual Types
Virtual Types
Commonly used to create enumerations for array values, in conjunction with
virtual functions. Known only by the GUI, not the kernel.
VHDL code: signal s: std_logic_vector(2 downto 0) := “101”;
...
s <= "000"
"010"
"100"
"110"
TCL code:
List output:
after
after
after
after
10
30
50
70
ns,
ns,
ns,
ns,
"001"
"011"
"101"
"111"
after
after
after
after
20
40
60
80
ns,
ns,
ns,
ns;
virtual type { state0 State1 STATE2 my_state3 foobar4 az5 rose6 yoyo7} mystate
virtual function {(mystate)s} cs
add list cs
ns
0
10
20
30
40
50
60
70
80
/az/s
delta
+0
+0
+0
+0
+0
+0
+0
+0
+0
/az/cs
101
az5
000
state0
001
State1
010
STATE2
011 my_state3
100
foobar4
101
az5
110
rose6
111
yoyo7
5-11 • ModelSim® Advanced Debugging: Virtual Signals
Copyright © 2002 Mentor Graphics Corporation
Notes:
The virtual type command creates a new enumerated type, known only by the
GUI, not the kernel. Virtual types are used to convert signal values to character
strings. The command works with signed integer values up to 64 bits.
virtual types {<list_of_strings>} <name>
5-14
ModelSim Advanced Debugging
December 2002
Virtual Signals
Combining Signals
Combining Signals
♦ Signals or busses can be combined
together into new busses
♦ These are created using “Virtual Signals”
5-12 • ModelSim® Advanced Debugging: Virtual Signals
Copyright © 2002 Mentor Graphics Corporation
Notes:
ModelSim Advanced Debugging
December 2002
5-15
Virtual Signals
Summary
Summary
This module introduced and explored the application of the
following topics:
♦ Virtual objects
●
●
●
●
Signals
Regions
Functions
Types
♦ How to create and use virtual objects
5-13 • ModelSim® Advanced Debugging: Virtual Signals
Copyright © 2002 Mentor Graphics Corporation
Notes:
5-16
ModelSim Advanced Debugging
December 2002
Module 6
Waveform Compare
Objectives
Upon completion of this module, you will be able to:
• Describe Waveform Compare features
• Describe the asynchronous and synchronous Waveform Compare
capabilities
• Demonstrate the Waveform Compare Wizard
• List Tcl commands applicable to Waveform Compare
• Describe compressed waveform files .wlf (wolf files)
ModelSim Advanced Debugging
December 2002
6-1
Waveform Compare
Module Overview
Module Overview
In this module we will discuss:
♦ Saving Waveform Datasets
♦ Opening Datasets
♦ Viewing Dataset Structure
♦ Managing Datasets
♦ Comparing Waveforms
♦ Adding Signals, Regions, and Clocks
♦ Compare Objects in List Window
♦ Comparing Hierarchical and Flattened Designs
♦ Datasets and Tcl Commands
6-2 • ModelSim® Advanced Debugging: Waveform Compare
Copyright © 2002 Mentor Graphics Corporation
Notes:
6-2
ModelSim Advanced Debugging
December 2002
Waveform Compare
Saving Waveform Datasets
Saving Waveform Datasets
♦ Basic Method:
●
Run a simulation and save the the reference dataset as the
“golden” results:
ModelSim> vsim -wlf gold.wlf <testbench name>
or
VSIM> quit -sim
ModelSim>copy vsim.wlf gold.wlf
♦ More Complex Method using SDF back-annotation:
●
Run a simulation using the SDF timing and save the waveform as
the “golden” results. At the ModelSim prompt, type:
vsim -sdftyp /chip=time_sim.sdf -wlf gold.wlf tst_pseudo
add wave / *
run 10 us
quit -sim
6-3 • ModelSim® Advanced Debugging: Waveform Compare
Copyright © 2002 Mentor Graphics Corporation
Notes:
All methods: Make sure to type quit -sim after the simulation has finished. This
ensures that the waveform file gets closed.
Method using SDF back-annotation: Using -sdftyp will run the simulation using
typical SDF timing. The other two choices are -sdfmin and -sdfmax.
ModelSim Advanced Debugging
December 2002
6-3
Waveform Compare
Opening Datasets
Opening Datasets
Method of displaying multiple waveform logfiles. Default waveform
saved as vsim.wlf. Can be saved and renamed for later use.
as
♦ Display signals from
different logfiles (.wlf files)
simultaneously
●
Same wave or list window
♦ New tab in main window
opened for each dataset
♦ Open Multiple logfiles
(previously saved and
renamed)
♦ Prefix Dataset Name
●
Examples:
sim:/top/alu/out
view:/top/alu/out
golden:.top.alu.out
6-4 • ModelSim® Advanced Debugging: Waveform Compare
Example:
ModelSim> dataset open gold.wlf
# gold.wlf opened as dataset “gold”
ModelSim> add wave /*
Copyright © 2002 Mentor Graphics Corporation
Notes:
Design signals and region names can be fully specified over multiple .wlf files by
using the dataset name as a prefix in the path.
Example:
sim:/top/alu/out
view:/top/alu/out
golden:.top.alu.out
6-4
ModelSim Advanced Debugging
December 2002
Waveform Compare
Managing Datasets
Managing Datasets
♦ Use the Dataset Browser to view and manage your datasets
View > Datasets (Main Window)
6-5 • ModelSim® Advanced Debugging: Waveform Compare
Copyright © 2002 Mentor Graphics Corporation
Notes:
ModelSim Advanced Debugging
December 2002
6-5
Waveform Compare
Compare Datasets Using Waveform
Compare
Compare Datasets Using Waveform Compare
♦ Compare the results of simulation:
●
●
●
The current simulation against a saved waveform file
A save waveform file against another saved waveform file
Different parts of the current simulation
♦ Two modes of operation:
●
Continuous comparison
– With or without tolerances
– Specify the maximum time a test signal edge is allowed to lead or
trail a reference signal
●
Clocked comparison
– Rising or Falling edge
– Delayed Clock Compare
♦ Ease of use
●
●
●
Scrollbars identify mis-compared areas
Search for next/previous mis-compare
Annotate comments to waveform
6-6 • ModelSim® Advanced Debugging: Waveform Compare
Copyright © 2002 Mentor Graphics Corporation
Notes:
6-6
ModelSim Advanced Debugging
December 2002
Waveform Compare
Compare Datasets Using Waveform
Compare (Cont.)
Compare Datasets Using Waveform Compare (Cont.)
♦ The Waveform Compare feature can be run in 3 different
ways:
●
●
●
Using the Comparison Wizard
Using the Menus
Using TCL commands
♦ Can be run in batch mode or interactively
♦ Can perform a transaction-based compare
♦ Integrated with waveform database
6-7 • ModelSim® Advanced Debugging: Waveform Compare
Copyright © 2002 Mentor Graphics Corporation
Notes:
ModelSim Advanced Debugging
December 2002
6-7
Waveform Compare
Waveform Compare Wizard
Waveform Compare Wizard
Specify reference dataset name
1
Compare Wizard
Use current sim or test dataset
Walks you through all the steps to do a compare!
6-8 • ModelSim® Advanced Debugging: Waveform Compare
Copyright © 2002 Mentor Graphics Corporation
Notes:
6-8
ModelSim Advanced Debugging
December 2002
Waveform Compare
Waveform Compare Wizard (Cont.)
Waveform Compare Wizard (Cont.)
2
After you specify datasets, select signals to
compare
3
4
Clicking the button runs the compare
6-9 • ModelSim® Advanced Debugging: Waveform Compare
Compare waveforms
are automatically
created!
Copyright © 2002 Mentor Graphics Corporation
Notes:
ModelSim Advanced Debugging
December 2002
6-9
Waveform Compare
Waveform Compare Menus
Waveform Compare Menus
Using the Menus to Define a Comparison
1. Start a compare
3. Run the compare
6-10 • ModelSim® Advanced Debugging: Waveform Compare
2. Add signals
4. End the compare
Copyright © 2002 Mentor Graphics Corporation
Notes:
6-10
ModelSim Advanced Debugging
December 2002
Waveform Compare
Waveform Compare Dialog Boxes
Waveform Compare Dialog Boxes
Dialog boxes to set up a Compare
Select signals
Then specify compare method
6-11 • ModelSim® Advanced Debugging: Waveform Compare
Copyright © 2002 Mentor Graphics Corporation
Notes:
ModelSim Advanced Debugging
December 2002
6-11
Waveform Compare
Add Signals, Regions or Clocks
Add Signals, Regions or Clocks
6-12 • ModelSim® Advanced Debugging: Waveform Compare
Copyright © 2002 Mentor Graphics Corporation
Notes:
6-12
ModelSim Advanced Debugging
December 2002
Waveform Compare
Differences
Differences
The “diff” designation
in the Values column
relates to the position
of the cursor
Pathnames of all test signals are
designated as yellow triangles.
Differences are marked by the
red “Xs”
6-13 • ModelSim® Advanced Debugging: Waveform Compare
Difference markers
Copyright © 2002 Mentor Graphics Corporation
Notes:
ModelSim Advanced Debugging
December 2002
6-13
Waveform Compare
Compare Objects in the List Window
Compare Objects in the List Window
♦ Differences are highlighted
with a yellow background
●
Tab on selected column to
move to next difference
♦ Use the RMB to select options
●
●
●
Examine
Annotate Diff
Ignore Diff
6-14 • ModelSim® Advanced Debugging: Waveform Compare
Copyright © 2002 Mentor Graphics Corporation
Notes:
Shift-Tab to move backwards.
6-14
ModelSim Advanced Debugging
December 2002
Waveform Compare
Continuous vs. Clocked Comparison
Continuous vs. Clocked Comparison
6-15 • ModelSim® Advanced Debugging: Waveform Compare
Copyright © 2002 Mentor Graphics Corporation
Notes:
Asynchronous comparison shown as red crosshatch over entire length of
differences.
Synchronous comparison shown as red diamonds at beginning and end of clock
period where differences exist.
ModelSim Advanced Debugging
December 2002
6-15
Waveform Compare
Write Report
Write Report
♦ Save a text file of the comparison differences
compare info -write <filename>
6-16 • ModelSim® Advanced Debugging: Waveform Compare
Copyright © 2002 Mentor Graphics Corporation
Notes:
6-16
ModelSim Advanced Debugging
December 2002
Waveform Compare
Comparing Hierarchical and Flattened
Designs
Comparing Hierarchical and Flattened Designs
! Problem:
♦ Hierarchical RTL and flattened synthesis designs may have some
differences
●
●
●
Different hierarchies
Different signal names
Buses broken down into 1-bit signals at the gate level design
! Solution:
♦ Use the compare add command when
●
Hierarchy is different in the test design and the reference design
− Specify which region path in the test design corresponds to that in the
reference design
●
Flattened design causes test signal names to be different from the
reference signal names
– Specify which signal in the test design corresponds to which signal in the
reference design
●
Buses have been “bit-blasted”
– Rebuild the bus in the test design to look at differences from one bus to another
compare add -rebuild
6-17 • ModelSim® Advanced Debugging: Waveform Compare
Copyright © 2002 Mentor Graphics Corporation
Notes:
If signals in the RTL test design are different in type from the synthesized signals
in the reference design — registers vs. nets, for example — the Waveform
Comparison feature will automatically do the type conversion for you. If type
differences are too extreme (e.g. integer vs. real) Waveform Comparison will
inform you.
ModelSim Advanced Debugging
December 2002
6-17
Waveform Compare
Using Tcl Commands to Define a
Comparison
Using Tcl Commands to Define a Comparison
dataset open gold.wlf
dataset open test.wlf
compare start gold test
Open dataset gold.wlf (gold)
Open dataset test.wlf (test)
Start comparison between
gold and test
<specify signals to compare and how to compare them>
compare run
compare end
6-18 • ModelSim® Advanced Debugging: Waveform Compare
Run the comparison
End the comparison
Copyright © 2002 Mentor Graphics Corporation
Notes:
6-18
ModelSim Advanced Debugging
December 2002
Waveform Compare
Tcl Compare Command
Tcl Compare Command
compare
compare
compare
compare
compare
compare
compare
compare
compare
compare
compare
compare
compare
compare
compare
compare
compare
compare
compare
add <arguments>
annotate <arguments>
clock <arguments>
configure <arguments>
continue
delete [-recursive] <objectPath>
end
info <arguments>
list [-expand]
options <arguments>
reload <rulesFilename> <diffsFilename>
reset
run [<startTime>] [<endTime>]
savediffs < diffsFilename>
saverules [-expand] <rulesFilename>
see <arguments>
start <arguments>
stop
update
Refer to the ModelSim Command Reference manual for further details on the “compare” command
6-19 • ModelSim® Advanced Debugging: Waveform Compare
Copyright © 2002 Mentor Graphics Corporation
Notes:
Refer to the ModelSim Command Reference manual for further details on the
"compare" command.
ModelSim Advanced Debugging
December 2002
6-19
Waveform Compare
Compare Example
Compare Example
dataset open min.wlf min
dataset open typ.wlf typ
compare start -maxtotal 1000 min typ
compare add -recursive
compare add min:.tst_pseudo.clk \
typ:.tst_pseudo.clk
Open dataset min.wlf (min)
Open dataset typ.wlf (typ)
Begin a new comparison and set upper limit
to 1000 differences to record
Compare all signals in entire region/design
Continuous Compare of signal ‘clk’ from module
tst_pseudo in dataset min & typ
compare clock -rising clk min:.tst_pseudo.clk
Define a clocked compare strobe named ‘clk’ that will sample signals on
the rising edge of signal min:.tst_pseudo.clk
compare add -clock clk -label clocked_data \
min:.tst_pseudo.data typ:.tst_pseudo.data
Clocked comparison of signal ‘data’ from module tst_pseudo in dataset min & typ
Comparison will be evaluated based on the definition of ‘clk’
‘clocked_data’ will be name displayed in the Wave window
6-20 • ModelSim® Advanced Debugging: Waveform Compare
Copyright © 2002 Mentor Graphics Corporation
Notes:
6-20
ModelSim Advanced Debugging
December 2002
Waveform Compare
Compare Example (Cont.)
Compare Example (Cont.)
compare clock -rising -offset {4 ns} clock_delay4
min:.tst_pseudo.clk
Define a clocked compare strobe ‘clock_delay4’ that samples
4 ns after the rising edge of signal min:.tst_pseudo.clk
compare add -clock clock_delay4 -label clocked_delay4_data \
min:.tst_pseudo.data typ:.tst_pseudo.data
Clocked comparison of signal ‘data’ from module tst_pseudo in dataset min & typ
Comparison will be evaluated based on the definition of ‘clock_delay4’
‘clocked_delay4_data’ will be name displayed in the Wave window
compare run
compare info -write compare_info.txt
compare info
6-21 • ModelSim® Advanced Debugging: Waveform Compare
Run the comparison
Save comparison results to file
Display comparison results in Main window
Copyright © 2002 Mentor Graphics Corporation
Notes:
ModelSim Advanced Debugging
December 2002
6-21
Waveform Compare
Waveform Compare Example
Waveform Compare Example
transcript on
onerror {resume}
#
# Test asynch compare with delayed subexpression when condition
#
set PrefCompare(defaultVHDLXMatches) XU
dataset open 0.wlf gold
dataset open 5.wlf test
quietly WaveActivateNextPane {} 0
add wave -noupdate -divider {Golden Simulation Results}
add wave -radix hex -r gold:/*
quietly WaveActivateNextPane
add wave -noupdate -divider {Test Simulation Results}
add wave -radix hex -r test:/*
quietly WaveActivateNextPane
add wave -noupdate -divider {Compare data if reset inactive}
compare start gold test
# test delayed when condition:
#compare if reset is inactive 20ns before and data change
compare add -tolL {3 ns} -tolT {2 ns} -label reset_inactive_20nsbefore \
gold:/tst_pseudo/chip/data -when {#-200 reset==1}
Compare data only when reset equal 1
#compare if reset inactive
200 time units before data change
compare add -tolL {3 ns} -tolT {2 ns} -label reset_inactive \
gold:/tst_pseudo/chip/data -when {reset==1}
compare
compare
compare
compare
run
info
info -primaryonly
info -secondaryonly
Compare data only when reset equal 1
Test dataset signal path optional if same as the reference path
6-22 • ModelSim® Advanced Debugging: Waveform Compare
Copyright © 2002 Mentor Graphics Corporation
Notes:
-tolL specifies the maximum time the test signal edge is allowed to lead the
reference edge in an asynchronous comparison. The default is 0.
-tolT specifies the maximum time the test signal edge is allowed to trail the
reference edge in an asynchronous comparison. The default is 0.
-primaryonly = differences on individual bits
-secondaryonly = differences on aggregates (bus)
6-22
ModelSim Advanced Debugging
December 2002
Waveform Compare
when Statement
when Statement
compare data only
when reset equal 1
200 time units before
data change
reset equal 1
compare data only
when reset equal 1
6-23 • ModelSim® Advanced Debugging: Waveform Compare
Copyright © 2002 Mentor Graphics Corporation
Notes:
Refer to the ModelSim Command Reference manual for further details on the
"when" command.
ModelSim Advanced Debugging
December 2002
6-23
Waveform Compare
Compressed Waveform Files
Compressed Waveform Files
♦ Significantly smaller .wlf files in 5.5
●
●
●
6x smaller on average
worst we’ve seen is only 3x smaller
some files will be 100-1000x smaller (depending on repetitiveness
of data, such as clocks)
♦ NO PERFORMANCE HIT!
♦ Can be enabled by either
●
modelsim.ini file setting:
; Turn on (1) or off (0) WLF file compression.
; The default is 1; compress WLF file.
; WLFCompress = 1
●
TCL variable:
Set WLFCompress 1
●
defaults to Enabled
6-24 • ModelSim® Advanced Debugging: Waveform Compare
Copyright © 2002 Mentor Graphics Corporation
Notes:
6-24
ModelSim Advanced Debugging
December 2002
Waveform Compare
Disable/Enable Pop-up
Disable/Enable Pop-up
install_dir/tcl/vsim/pref.tcl
#
#
#
#
#
#
The following control the popup info box.
By setting the popup off delay to 0, the popup will remain indefinitely
or until there is mouse motion.
The value is time in milliseconds. The time for the popup to appear is
controlled by the popup delay.
The popup can be disabled altogether using the popup enabled flag.
Set to non zero value
to modify duration of popup
set PrefCompare(PopupDelay)
1000
set PrefCompare(PopupOff)
0
set PrefCompare(PopupEnabled) 1
Set to zero and popup remains
until mouse movement
Set to zero to disable popup
6-25 • ModelSim® Advanced Debugging: Waveform Compare
Copyright © 2002 Mentor Graphics Corporation
Notes:
ModelSim Advanced Debugging
December 2002
6-25
Waveform Compare
Summary
Summary
This module introduced and explored the application of the
following topics:
♦ Waveform Datasets
♦ Dataset and ModelSim Commands
♦ Comparing Waveforms
♦ Adding Signals, Regions, and Clocks
♦ Setting Compare Objects in the List Window
♦ Saving Compare Differences
6-26 • ModelSim® Advanced Debugging: Waveform Compare
Copyright © 2002 Mentor Graphics Corporation
Notes:
6-26
ModelSim Advanced Debugging
December 2002
Waveform Compare
Lab 6: Waveform Compare
Introduction
The purpose of this lab is to familiarize you with how to do waveform
comparisons. Many customers will want to use this feature to verify that their
design changes didn't break anything unexpected. Without this feature, users have
in the past had to resort to saving VCD or list window files, and writing C or perl
scripts to validate that the results are still correct.
Setting up a waveform compare is very easy. In this lab, you'll run two
simulations and compare the differences. Then you'll run a compare against two
existing waveform files using an existing script.
Directions
1. Open ModelSim and create a new project file. Pick the menu item File →
New → Project. Type in “wavecomp” for your project name, and put it in
the labs/lab6/ directory.
2. Add the files by using the right mouse button (RMB) and select Add to
Project → Existing File. Make sure the radio button labeled “Reference
from current location” is selected. Click the Browse button, navigate to the
labs/lab6 directory, and select all the files. Then click Open.
3. Compile all the files in the project. Do this by picking the Compile →
Compile All menu item.
4. Run a simulation using SDF typical timing. The waveforms from this run
will be used for comparisons against subsequent runs. Save the waveforms
as the “golden” results.
vsim -sdftyp /chip=time_sim.sdf -wlf gold.wlf tst_pseudo
add wave /*
run 10 us
quit -sim
<- THIS IS IMPORTANT
so the waveform file gets closed!
ModelSim Advanced Debugging
December 2002
6-27
Waveform Compare
5. Now let's re-run the simulation, but this time, we'll run with SDF maximum
timing. Invoke vsim as before, but with the -sdfmax switch instead, and
specifying a different .wlf file. Also add the top-level signals to the
waveform window.
vsim -sdfmax /chip=time_sim.sdf -wlf max.wlf tst_pseudo
add wave /*
6. Invoke the Compare Wizard. Choose the menu pick Tools → Waveform
Compare → Comparison Wizard. For the reference dataset, use the
Browse button and select the gold.wlf file created earlier. For the test
dataset, use the current simulation. Also check the box labeled “Update
comparison after each run”. Then select “Next”.
7. Choose the “Compare All Signals” option, and click Next. Click Next again
(answer no to when it asks you if you want to add more signals). Then click
on the button that says “Compute Differences Now”. Finally, click Finish.
8. Run the simulation for 10 us. The comparison results will automatically
appear in the wave window, and the transcript window will show you a
summary of the differences.
9. You can zoom in on the differences in the wave window. If you click on the
“find first difference” icon in the wave window (the leftmost red transition
icon), a cursor will be put on top of the first difference, and the signal that
failed is selected. You will probably need to zoom in a lot to see the
difference. When you've zoomed in enough to see the red highlighted
difference, place your mouse cursor over the difference and right-click it.
Try the “Diff Info”, “Annotate Diff”, “Ignore Diff” menu items. Notice
how the highlighting of the difference changes each time.
10. Also try expanding and collapsing the signal that had the difference. When
it's expanded, you can see the golden “gold” (typical timing) signal next to
the test “sim” (maximum timing) signal.
11. Now we'll close the current comparison, and also the current simulation.
Select the menu item Tools → Waveform Compare → End Comparison.
Then type quit -sim to quit vsim, but keep ModelSim up.
6-28
ModelSim Advanced Debugging
December 2002
Waveform Compare
12. Now we'll perform a more complicated comparison, but this time there is a
script to do it all for you.
Go back to the ModelSim Main window. Select Tools → Execute Macro,
and double-click on the cmp2.do file. This will execute the macro file,
which loads two datasets, and sets up a comparison. The interesting part
here is that the miscompares of the signals are being “filtered” by the
“when” condition set up in the macro.
If you edit the cmp2.do file (type notepad cmp2.do), look at the “compare
signal” lines. There are two comparisons for signal a and two for signal b.
The first comparison for each signal is a straightforward continuous
compare. The second compare only compares the signals when the “state”
signal has a value of “reading”.
Maximize the wave window so you can see the waveforms in detail. Look
at the red markings for signal “a” and signal “a_reading”. Signal
“a_reading” is the “gated” compare, and you can see that there are less
differences than those on signal “a”. Same is true for signal “b”.
There were also tolerances put on the signal comparisons. Zoom in on some
of the differences and see if you can find where the tolerances removed all
or part of the miscompares. Use the cursors to measure the area of the
differences that were affected by the tolerances.
Was this a leading or trailing tolerance? _____________
What was its value? _____________
For signal a, how many differences between the simple compare and the
complex compare were filtered by the when “reading” condition? _______
How many differences were filtered by the tolerances? _____________
When finished, close the current comparison (Tools > Waveform Compare >
End Comparison) and close ModelSim (quit -f).
ModelSim Advanced Debugging
December 2002
6-29
Waveform Compare
6-30
ModelSim Advanced Debugging
December 2002
Module 7
FLI and C Models
Objectives
At the end of this module, you will be able to:
• Define Foreign Language Interface (FLI)
• Describe how to use FLI
• Describe ModelSim supported FLI capabilities
• Describe the Benefits of C Modeling
• Describe How to Declare Foreign models (“C” models) within VHDL
designs
• Explain How FLI Maps to VHDL Datatypes
• Describe How to Use Checkpoint and Restore Using FLI
• Describe How to Debug FLI problems
ModelSim Advanced Debugging
December 2002
7-1
FLI and C Models
Module Overview
Module Overview
In this module we will discuss:
♦ What FLI is and how we use it
♦ The Benefits of C Modeling
●
●
●
●
♦
♦
♦
♦
♦
♦
C Functions
C Callbacks
C Subprograms
Examples of MTI functions
Initializing Foreign Architecture
Mapping Datatypes
Using Checkpoint and Restore with FLI
C Architecture Example
C Subprogram Example
Debugging Example
7-2 • ModelSim® Advanced Debugging: FLI and C Models
Copyright © 2002 Mentor Graphics Corporation
Notes:
7-2
ModelSim Advanced Debugging
December 2002
FLI and C Models
What Is FLI?
What Is FLI?
♦ Procedural interface between VHDL simulator and other
software programs
●
●
●
C interface into ModelSim
VHDL architectures, functions and procedures can be replaced with
C code
Other software programs can read or modify simulated values
during simulation
– Delay, logic values
– Design structure (read only)
♦ Use to link virtually any type of application into an HDL
simulation:
●
●
●
●
●
●
●
Delay calculators and back annotators
Custom output displays
C-language models
Hardware modelers
Co-simulation environments (e.g.: digital and analog simulators)
Custom user interfaces and debug utilities
Reading/writing test vector files
7-3 • ModelSim® Advanced Debugging: FLI and C Models
Copyright © 2002 Mentor Graphics Corporation
Notes:
FLI routines are C programming language functions that provide procedural
access to information within ModelSim. A user-written application can use these
functions to traverse the hierarchy of an HDL design, get information about and
set the values of VHDL objects in the design, get information about a simulation,
and control to some extent, a simulation run. The header file mti.h externs all of
the FLI functions and types that can be used by an FLI app.
Some definitions:
Foreign Architecture — A foreign architecture is a design unit that is instantiated
in a design but that does not generally contain any VHDL code. Instead it is a link
to a C model that can communicate to the rest of the design through the ports of
ModelSim Advanced Debugging
December 2002
7-3
FLI and C Models
the foreign architecture. Normally you would use a C model to create processes
and read and drive signal values. Used much in the way VHDL is used, but with
the advantage of C with its ease of reading/writing files and communicating with
other system functions.
Foreign Subprogram — A foreign subprogram is a VHDL function or procedure
that is implemented in C as opposed to VHDL. A foreign subprogram reads its in
and inout parameters, performs some operation(s) which may include accessing
simulator information through FLI function calls, writes its inout and out
parameters, and returns a value (function).
Callback — A callback is a C function that is registered with the simulator for a
specific reason. The registered function is called whenever the reason occurs.
Callback functions generally perform special processing whenever certain
simulation conditions occur.
Process — A process is a VHDL process that is created through the FLI. It can
either be scheduled for a specific time or be made sensitive to one or more signals
that trigger the process to run. The process associated with a C function is
executed whenever the process is run by the simulator.
7-4
ModelSim Advanced Debugging
December 2002
FLI and C Models
Why FLI?
Why FLI?
♦ Ability to integrate models developed in C/C++ into VHDL
design
●
●
FLI C++ libraries now supported
Why Use?
– A C/C++ model is available from a Silicon vendor who does not want
to give out synthesizable code
●
Ability to use the power of C/C++ to accomplish tasks that would
otherwise be difficult in VHDL
– allows VHDL sub-programs to be replaced by a C/C++ function
●
Access to the internal state of the simulation for easy integration
of third party tools
♦ To use the FLI we create a foreign architecture and compile it.
♦ VHDL ’87 and ‘93 define a mechanism for loading foreign
architectures and subprograms
●
●
Attribute FOREIGN : string;
FOREIGN attribute declared in package STANDARD for VHDL ‘93
7-4 • ModelSim® Advanced Debugging: FLI and C Models
Copyright © 2002 Mentor Graphics Corporation
Notes:
The string value of the attribute is used to specify the name of a C initialization
function and the name of an object file to load. When the simulator elaborates the
architecture, the initialization function is called. Parameters to the function
include a list of ports and a list of generics. See "Mapping to VHDL data Types”
in the Foreign Language Interface Manual.
Declaring the FOREIGN String — Starting with VHDL ‘93, the FOREIGN
attribute is declared in package STANDARD. With the 1987 version, you need to
declare the attribute yourself. You can declare it in a separate package, or you can
declare it directly in the architecture. (This will also work with VHDL ‘93).
ModelSim Advanced Debugging
December 2002
7-5
FLI and C Models
The FOREIGN Attribute String — The value of the FOREIGN attribute is a string
containing three parts. For the following declaration:
ATTRIBUTE foreign of arch_name : ARCHITECTIRE IS
"app_init app.so; parameter";
The attribute string parses as follows:
• app_init — The name of the initialization function for this architecture.
This part is required.
• app.so — The path to the shared object file to load. This part is required.
• parameter — A string that is passed to the initialization function. This part
is optional and is preceded by a semicolon.
Page 7-24 discusses the foreign init as well.
7-6
ModelSim Advanced Debugging
December 2002
FLI and C Models
Who is Using FLI?
Who is Using FLI?
♦ Third Party Tools
●
●
●
Power tools
Backplane tools
Internal co-simulation tools
♦ Model developers
●
●
Logic Modeling, etc.
Customers
♦ Those who prefer C for complex functions and procedures
●
Customers
7-5 • ModelSim® Advanced Debugging: FLI and C Models
Copyright © 2002 Mentor Graphics Corporation
Notes:
ModelSim Advanced Debugging
December 2002
7-7
FLI and C Models
Benefits of C Interface
Benefits of C Interface
♦ Faster
●
●
●
Dynamic allocation of RAMs and ROMs
File I/O
String Formatting
♦ More Capabilities and Flexibility
●
●
C libraries are more mature and robust than VHDL
Some capabilities are limited in VHDL
– String Formatting
– File access
– System resources
♦ Silicon vendors protect their synthesizable code while
providing simulation model.
7-6 • ModelSim® Advanced Debugging: FLI and C Models
Copyright © 2002 Mentor Graphics Corporation
Notes:
We'll limit the discussion to C from here on out. Refer to the Foreign Language
Interface Reference Manual for information on how to compile and use C++.
7-8
ModelSim Advanced Debugging
December 2002
FLI and C Models
FLI C Functions
FLI C Functions
♦ FLI Callbacks Routines in the C program that ModelSim will
call when certain conditions are met (i.e. elaboration complete,
simulator exiting, restart, save, restore, starting and stopping a
run, etc.)
♦ Hierarchy Scanning Routines for traversing the hierarchy of a
design
♦ Reading and Setting Signals and Variables
♦ Utilities Routines for allocating memory, executing commands,
issuing messages, etc.
Reference the ModelSim FLI Manual, “FLI Function Definitions”
7-7 • ModelSim® Advanced Debugging: FLI and C Models
Copyright © 2002 Mentor Graphics Corporation
Notes:
There are many FLI callback functions. Refer to the ModelSim Foreign Language
Interface Reference Manual, "FLI Function Definitions" section. A few functions
will be discussed here.
Keep in mind the following:
• There are several FLI functions that work only during certain simulator
phases (e.g. mti_GetVarImage() ), or only when called from a certain
context (e.g., from either inside of a process
(mti_GetNextNextEventTime() ) or outside of a process
(mti_GetNextEventTime() )).
ModelSim Advanced Debugging
December 2002
7-9
FLI and C Models
• There are others that have slightly different behavior depending on when
they are called and from which context (e.g., mti_GetCurrentRegion() and
mti_GetCallingRegion() ).
• There are also several FLI functions that can be used on Verilog regions in
addition to VHDL regions (e.g. mti_GetTopRegion() ).
• Functions arguments are required unless marked as optional.
7-10
ModelSim Advanced Debugging
December 2002
FLI and C Models
FLI Callbacks
FLI Callbacks
mti_ScheduleWakeup
mti_AddEnvCB
mti_AddLoadDoneCB
mti_AddQuitCB
mti_AddRestartCB
mti_AddRestoreCB
mti_AddSimStatusCB
♦ These are a few examples of C routines called by ModelSim
when certain conditions are met.
7-8 • ModelSim® Advanced Debugging: FLI and C Models
Copyright © 2002 Mentor Graphics Corporation
Notes:
mti_ScheduleWakeup schedules a VHDL process to wake up at a specific time.
A process can have no more than one pending wake-up call. A call to
mti_ScheduleWakeup() cancels a prior pending wake-up call for the specified
process regardless of the delay values. Delay time units are equivalent to the
current simulator time unit setting.
mti_AddEnvCB add an environment change callback. The same function can be
added multiple times, with possibly a different parameter each time. Whenever the
simulator environment changes (for example, when the environment command is
used), all callbacks in this list are called with their respective parameters plus a
second parameter that is a pointer to the current context.
ModelSim Advanced Debugging
December 2002
7-11
FLI and C Models
mti_AddLoadDoneCB adds the specified function to the elaboration done
callback list. The same function can be added multiple times, possibly with a
different parameter each time. At the end of the elaboration, all callbacks in the
list are called with their respective parameters. These callbacks are also called at
the end of a restart of a cold restore (vsim -restore). mti_AddLoadDoneCB ()
must be called from a foreign initialization function in order for the callback to
work. Specify the function either in the foreign attribute string of a foreign
architecture or in the -foreign string option of a vsim command.
mti_AddQuitCB adds a simulator exit callback. The same function can be added
multiple times, with possibly a different parameter each time. When the simulator
exits, all callbacks in the list are called with their respective parameters. When the
"quit -sim" command is given to vsim, quit callbacks are not called because the
simulator is not quitting completely. Only restart callbacks are called.
mti_AddRestartCB adds a simulator restart callback.The same function can be
added multiple times, with possibly a different parameter each time. When the
simulator restarts, all callbacks in the list are called with their respective
parameters before the simulator is restarted. The callback function should do a
cleanup operation including freeing any allocated memory and resetting
global/static variables. When "quit -sim" command is given to vsim, restart
callbacks are called because the simulator is not completely quitting but may be
restarting the previous design or loading a new design.
mti_AddRestoreCB adds a simulator restore callback. The same function can be
added multiple times, with possibly a different parameter each time. During a
restore, all callbacks in the list are called with their respective parameters. The
callback function should restore its saved state at this time. mti_AddRestoreCB
() must be called from a foreign initialization function in order for the callback to
work. Specify the function either in the foreign attribute string of a foreign
architecture or in the -foreign string option of a vsim command.
mti_AddSimStatusCB adds a simulator run status change callback. The same
function can be added multiple times, with possibly a different parameter each
time. Whenever the simulator run status changes, all callbacks in the list are called
with their respective parameters pull a second parameter of type int which is 1
when the simulator is about to start a run and 0 when the run completes.
7-12
ModelSim Advanced Debugging
December 2002
FLI and C Models
Hierarchy Scanning
Hierarchy Scanning
mti_GetTopRegion
mti_NextRegion
mti_GetCurrentRegion
mti_FirstProcess
mti_FirstSignal
mti_NextProcess
mti_NextSignal
mti_GetPrimaryName
mti_FirstLowerRegion
mti_GetSecondaryName
mti_GetProcessName
♦ These are a few examples of C routines called by ModelSim to
traverse the hierarchy.
7-9 • ModelSim® Advanced Debugging: FLI and C Models
Copyright © 2002 Mentor Graphics Corporation
Notes:
mti_GetTopRegion returns the region ID of the first top-level region in the
design hierarchy. This function can be used to get additional top-level regions.
Top-level regions are VHDL architectures and packages and Verilog modules. If
the region_id is a handle to a Verilog region, then it can be used with PLI
functions to obtain information about and access objects in the Verilog region.
mti_GetCurrentRegion gets the current elaboration region during elaboration or
the current environment during simulation. During elaboration, this function
returns the region ID of the current elaboration region. During simulation, the
function returns the region ID of the current environment set by the environment
command. The region ID returned can be either a VHDL region or a Verilog
ModelSim Advanced Debugging
December 2002
7-13
FLI and C Models
region. A handle to a Verilog region can be used with PLI functions to obtain
information about or access objects in the Verilog region.
mti_FirstSignal returns a handle to the first VHDL signal in the specified region.
Can be used to get the subsequent VHDL signals in the specified region.
mti_FirstSignal resets the region used by previous calls to mti_FirstSignal ()
and mti_NextSignal(); therefor the function always uses the region set by the
latest call to mti_FirstSignal .
mti_NextSignal returns a handle to the next signal in the region set by the latest
call to mti_NextSignal (). Function returns NULL if there are no more signals.
mti_FirstLowerRegion returns a handle to the first subregion of the specified
region. mti_NextRegion() can be used to get the subsequent subregions of the
specified region. The function can be used to get the subsequent subregions of the
specified region.
mti_NextRegion gets the next region at the same level as a region. Returns a
handle to the next VHDL or Verilog region at the same level of hierarchy as the
specified VHDL or Verilog region. The function returns NULL if there are no
more regions at this level. If the next_reg_id is a handle to a Verilog region then it
can be used with PLI functions to obtain information about or access objects in the
Verilog region.
mti_FirstProcess gets the first VHDL process in a region. Returns a handle to the
first process in the specified region. Can be used to get the subsequent processes
in the specified region. mti_FirstProcess () resets the region used by previous
calls to mti_FirstProcess () and mti_NextProcess (); therefor the function
always uses the region set by the latest call to mti_FirstProcess ().
mti_NextProcess gets the next VHDL process in a region. Returns a handle to the
next process in the region set by the latest call to mti_FirstProcess () .Function
returns NULL if there are no more processes.
mti_GetPrimaryName gets the primary name of a region (entity, package or
module). Returns the primary name of the specified VHDL or Verilog region
(that, an entity, package, or module name). If the region is not a primary design
unit, then the parent primary design unit is used. The return pointer must not be
freed.
7-14
ModelSim Advanced Debugging
December 2002
FLI and C Models
mti_GetSecondaryName gets the secondary name of a VHDL region, namely, an
architecture name. If the region is not a secondary design unit, then the parent
secondary design unit is used. NULL is returned if the region is a VHDL package
or a Verilog region that was not compiled with -fast.
mti_GetProcessName gets the name of a VHDL process. The returned pointer
must not be freed.
ModelSim Advanced Debugging
December 2002
7-15
FLI and C Models
Signals and Variables
Signals and Variables
mti_FindDriver
mti_GetSignalName
mti_FindPort
mti_GetVarName
mti_FindSignal
mti_SetSignalValue
mti_FindVar
mti_SetVarValue
♦ These are a few examples of C routines called by ModelSim to
modify or examine signals/variables
7-10 • ModelSim® Advanced Debugging: FLI and C Models
Copyright © 2002 Mentor Graphics Corporation
Notes:
mti_FindDriver determines if a VHDL signal has any drivers on it. If no drivers
are found for a scalar signal or if any element of an array signal does not have a
driver, then NULL is returned. The returned handle can be freed with mti_free().
The driver remains in effect even if the handle is freed. The first driver in the
signal's driver list is returned, so you cannot tell which particular driver it is. For
this reason, it is not recommended to use this command to drive values from an
FLI application. Use this function to determine whether or not a signal has any
drivers.
mti_FindPort finds a port signal in a port interface list. The search is not casesensitive.
7-16
ModelSim Advanced Debugging
December 2002
FLI and C Models
mti_FindSignal finds a VHDL signal by name. The signal name can be either a
full hierarchical name or a relative name. A relative name is relative to the current
region set by the simulator's environment command. The default current region is
the foreign architecture region during elaboration and the top-level region after
elaboration is complete.
The name of a package signal must contain the name of the package.
During elaboration, signals in design units that have not yet been instantiated will
not be found by the function.
If the specified name is for an input port that has been collapsed due to
optimizations, the handle that is returned is a handle to the actual signal connected
to that port.
This command can not be used to find either sub elements that are composites or
multi-dimensional array sub elements.
mti_FindVar finds a VHDL variable, generic, or constant by name. The name
can be either a full hierarchical name or a relative name. A relative name is
relative to the current regions set by the simulator's environment command. The
default current region is the top-level region. For objects declared in a process, the
name must include the process label. The function can be called only after
elaboration is complete, and cannot be used to find composite sub elements. For
example, the name cannot be a subscripted array element or a selected record
field. Also, it cannot be used to find a process variable when it is called from a
foreign subprogram that is called from the process where the variable is declared.
mti_GetSignalName gets the simple name of a scalar or top-level composite
VHDL signal. If the signal is a composite sub element, then the name returned is
the name of the top-level composite. The returned pointer must not be freed.
To get the name of a composite sub element signal, use
mti_GetSignalNameIndirect().
mti_GetVarName gets the simple name of a VHDL variable. Returns NULL if
no information is found. The return pointer must not be freed. This function
cannot be used with variable Ids passed as foreign sub program parameters.
ModelSim Advanced Debugging
December 2002
7-17
FLI and C Models
mti_SetSignalValue sets the value of a VHDL signal. Effect takes place
immediately. The signal can be either an unresolved signal or a resolved signal.
Setting a signal marks it as active in the current delta. If the new value is different
from the old value, then an event occurs on the signal in the current delta. If the
specified signal is of type array, real or time, then the value type is considered to
be "void*" instead of "long". This function cannot be used to set the value of a
signal of type record, but it can be used to set the values on the individual scalar or
array sub elements.
Setting a resolved signal is not the same as driving it. After a resolved signal is set
it may be changed to a new value the next time its resolution function is executed.
mti_ScheduleDriver() and mti_ScheduleDriver64() can be used to drive a value
onto a signal.
mti_SetVarValue sets the value of a VHDL variable. Effective immediately. If
the variable is of type array, real or time, then the value type is considered to be
"void*" instead of "long". This function cannot be used to set the value of a
variable of type record, but it can be used to set the values of the individual scalar
or array sub elements.
7-18
ModelSim Advanced Debugging
December 2002
FLI and C Models
Utilities
Utilities
mti_Command
mti_AddCommand
mti_AddTclCommand
mti_Break
mti_CreateArrayType
mti_CreateEnumType
mti_CreateSignal
mti_CreateProcess
7-11 • ModelSim® Advanced Debugging: FLI and C Models
mti_CreateRegion
mti_Delta
mti_Free
mti_Malloc
mti_Now
mti_PrintMessage
mti_Realloc
mti_FatalError
Copyright © 2002 Mentor Graphics Corporation
Notes:
mti_Command executes a simulator command. The string must contain the
command just as it would be typed at the VSIM prompt. The results of the
command are transcribed in the vsim transcript. Any command that changes the
state of simulation (such as run, restart, restore, etc.) cannot be sent from a foreign
architecture, subprogram, or callback that is executing under the direct control of
vsim.
mti_AddCommand adds a user-defined simulator command. The case of the
command name is significant. The simulator command interpreter subsequently
recognizes the command and calls the command function whenever the command
is recognized. The entire command line (the command and any arguments) is
ModelSim Advanced Debugging
December 2002
7-19
FLI and C Models
passed to the command function as a character string. The command function
prototype is:
void commandFuncName (void * command)
A command can be added with the same name as a previously added command (or
even a standard simulator command), but only the command added last has any
effect.
mti_AddTclCommand adds a user-defined Tcl command. The case of the
command name is significant. The simulator command interpreter subsequently
recognizes the command and calls the function along with its parameter and usersupplied arguments whenever the command is recognized. The function must
return a valid Tcl status (for example, TCL_OK or TCL_ERROR). The command
function prototype is:
int commandFuncName (Client cmd_param, Tcl_Interp * interp,
int argc, char ** argv)
A command can be added with the same name as a previously added command (or
even a standard simulator command), but only the command added last has any
effect.
If a command is read or deleted, the delete callback function is called along with
the command parameter so that the old command information can be cleaned up.
The delete function prototype is:
void deleteCBname (ClientData cmd_param)
mti_Break requests the simulator to halt. Issues an assertion message that says,
"Simulation halt requested by foreign interface". The break request is satisfied
after the foreign code returns control to the simulator. Simulation can be
continued by the user after it has been halted by the mti_Break() command.
Cannot be called during elaboration.
mti_CreateArrayType creates a new ID type that describes a VHDL array whose
bounds are the specified left and right values and whose elements are of the
specified element type.
7-20
ModelSim Advanced Debugging
December 2002
FLI and C Models
mti_CreateEnumType creates an enumeration type. Consists of the specified
enumeration literals and its values and are of the specified size. The count
parameter indicates the number of strings in the literals parameter. The left-most
value of the enumeration type is 0 and is associated with the first literal string, the
next value is 1 and is associated with the next literal string, and so on. If more than
256 values are used in the enumeration type, then 4 bytes must be used to store the
values, otherwise 1 byte should be used.
mti_CreateSignal creates a new VHDL signal If the name is not NULL then the
signal will appear in the Signals window. All signal names that do not begin with
a '\' are converted to lowercase. Signal names starting and ending with '\' are
treated as VHDL extended identifiers and are used unchanged. mti_CreateSignal
() allows you to create a signal with an illegal VHDL name. This might be useful
for integrators who provide shared libraries for use by end customers, and is an
easy way to avoid potential name conflicts with HDL signals. The following
naming style is recommended:
<PREFIX_name>
Where PREFIX is 3 or 4 characters that denote your software (to avoid name
conflicts with other integration software) and name is the name of the signal.
Enclosing the entire name in angle brackets makes it an illegal HDL name. Do not
use characters in the name that will cause Tcl parsing problems. This includes
spaces, the path separator ( '/' or '.'), square brackets ([]), and dollar signs ($). If
you must use these characters, then use an escaped name by putting the backslash
(\) at both ends of the name.
mti_CreateProcess creates a new VHDL process. If the name is not NULL, then
it will appear in the Process window; otherwise it does not. The specified function
is called along with its parameter whenever the process executes, and it executes
either at the time specified in a call to mti_ScheduleWakeup() or whenever one
of the signals to which it is sensitive changes.
If the process is created during the elaboration phase from inside of a foreign
architecture instance, then the process is automatically executed once at time zero
after all signals have been initialized. If the process is created either after
elaboration is complete or from any other context (such as from an initialization
function that executes as a result of the loading of a foreign shared library by the foreign option to vsim) then the process is not run automatically but must be
ModelSim Advanced Debugging
December 2002
7-21
FLI and C Models
scheduled or sensitized. You are able to create a process with an illegal HDL
name. Refer to mti_CreateSignal() for the rules on how to do this.
mti_CreateRegion creates a new VHDL region with the specified name under the
specified parent region. The name is converted to lower case unless it is an
extended identifier.If the name is NULL, then the region is hidden. If the parent
region is NULL, then the new region is not connected to the design hierarchy.
The new region can be created below either a VHDL region or a Verilog region.
The new region is of type accForeign and of fulltype accShadow (see acc_vhdl.h).
If a region is created with no name or with no parent, the returned handle to the
region must be saved as there is no way to find the region by name or by
traversing the design with the region traversal functions. mti_CreateRegion ()
allows you to create a region with an illegal HDL name. Refer to
mti_CreateSignal() for more information about naming conventions and style.
mti_Delta gets the simulator iteration count for the current time step.
mti_Free frees simulator-managed memory. This function cannot be used for
memory allocated by direct calls to malloc().
mti_Malloc allocates a block of memory of the specified size from an internal
simulator memory pool and returns a pointer to it. The memory is initialized to
zero.Memory allocated by this function is automatically checkpointed. On restore,
this memory is guaranteed to be restored to the same location with the values it
contained at the time of the checkpoint. This memory can be freed only by
mti_Free(). mti_Malloc() automatically checks for a NULL pointer. In the case
of an allocation error, the function issues the following error message and aborts
the simulation:
*****Memory allocation function*****
Please check your system for available memory and swap space.
mti_Now returns the low order 32 bits of the current simulation time. The time
units are equivalent to the current simulator time unit setting.
7-22
ModelSim Advanced Debugging
December 2002
FLI and C Models
mti_PrintMessage prints a message to the Main window and in the transcript file.
One or more newline characters can be included in the message string; however, a
newline character is provided at the end of the message by default.
mti_Realloc this function works like the C realloc() function on memory
allocated by mti_Malloc(). If the specified size is larger than the size of memory
already allocated to the origptr parameter, then new memory of the required size is
allocated and initialized to zero, the entire content of the old memory is copied
into the new memory, and a pointer to the new memory is returned. Otherwise, a
pointer to the old memory is returned.
Any memory allocated by mti_Realloc () is guaranteed to be checkpointed and
restored just like memory allocated by mti_Malloc() . Memory allocated by
mti_Realloc() can be freed only by mti_Free(). mti_Realloc () automatically
checks for NULL pointer. In the case of an allocation error, the function issues the
same error message as mti_Malloc().
mti_FatalError requests the simulator to immediately halt the simulation and
issue an assertion message with the text:
**Fatal: Foreign module requested halt.
A call to this function does not return control to the caller, and simulation cannot
be continued.
ModelSim Advanced Debugging
December 2002
7-23
FLI and C Models
Foreign Architecture Initialization
Foreign Architecture Initialization
♦ First, create and compile an architecture with FOREIGN attribute.
●
The string value of the attribute is used to specify the name of a C
initialization function and the name of the object file to load.
♦ Example:
attribute foreign of mult : architecture is
“mult_init mult.so; parameter”;
(the parameter is optional, used by the initialization function)
♦ ModelSim searches for the object files in the following order :
●
$MGC_WD/<so> or ./<so> (If MGC_WD is not set, then it will use ".")
Note: .so files are shared object files.
●
●
●
●
●
<so> (the path specified in the Foreign attribute string above)
within $LD_LIBRARY_PATH ($SHLIB_PATH on HP only)
(recommended)
$MGC_HOME/lib/<so>
$MODEL_TECH/<so>
$MODEL_TECH/../<so>
7-12 • ModelSim® Advanced Debugging: FLI and C Models
Copyright © 2002 Mentor Graphics Corporation
Notes:
The FOREIGN attribute string contains 3 parts. For the following declaration:
ATTRIBUTE foreign OF arch_name : ARCHITECTURE IS
"app_init app.so; parameter";
the attribute parses this way:
• app_init — The name of the initialization function for this architecture.
This part is required. See "The C initialization function" section in the
Foreign Language Interface Reference Manual.
7-24
ModelSim Advanced Debugging
December 2002
FLI and C Models
• app.so — The .so file extension is the extension for the shared object file.
ModelSim does a search for these types of files in order to parse foreign
attributes strings.
• The path to the shared object file to load. This part is required. See
"Location of shared object files" section in the Foreign Language Interface
Reference Manual.
• Parameter — A string that is passed to the initialization function. This part
is preceded by a semicolon and is optional.
If the initialization function has a leading '+' or '-', the VHDL architecture body
will be elaborated in addition to the foreign code. If '+' is used (see example
below) the VHDL will be elaborated first. If '-' is used, the VHDL will be
elaborated after the foreign initialization function is called.
Unix environment variables can also be used within the string as in this example:
ATTRIBUTE foreign of arch_name : ARCHITECTURE IS
"+app_init $CAE/app.so";
ModelSim Advanced Debugging
December 2002
7-25
FLI and C Models
Foreign Architecture Init (Cont.)
Foreign Architecture Init (Cont.)
♦ C Initialization function calls FLI functions to create and sensitize a
process to be called during simulation
●
●
●
●
●
●
Allocates memory to hold variables for this instance
Registers callbacks for save and restore
Saves handles of signals in port list
Creates drivers on ports to be driven
Creates one or more processes
Sensitizes processes to a list of signals
♦ The declaration of an initialization function is:
init_func (
mtiRegionIdT
char
mtiInterfaceListT
mtiInterfaceListT
region,
*param,
*generics,
*ports )
7-13 • ModelSim® Advanced Debugging: FLI and C Models
Copyright © 2002 Mentor Graphics Corporation
Notes:
Entry point for the foreign C model.
The function specified in the foreign attribute is called during elaboration. The
first parameter is a region ID that can be used to determine the location in the
design for this instance. The second parameter is the last part of the string in the
foreign attribute. The third parameter is a linked list of the generic values for this
instance. The list will be NULL if there are no generics. The last parameter is a
linked list of the ports for this instance. The typedef mtiInterfaceListT in mti.h
describes the entries in these lists.
7-26
ModelSim Advanced Debugging
December 2002
FLI and C Models
Mapping Data Types
Mapping Data Types
♦ Many FLI functions have parameters and return values that
represent VHDL object values.
♦ Object values are mapped to the various VHDL data types by a
typeID handle identified in the C interface.
♦ For a given typeID handle, mti_GetTypeKind() returns a C
enumeration of mtiTypeKindT. The mapping between
mtiTypeKindT values and VHDL data types is as follows:
mtiTypeKindT value
MTI_TYPE_ACCESS
MTI_TYPE_ARRAY
MTI_TYPE_ENUM
MTI_TYPE_FILE
MTI_TYPE_REAL
MTI_TYPE_RECORD
MTI_TYPE_SCALAR
MTI_TYPE_TIME
7-14 • ModelSim® Advanced Debugging: FLI and C Models
VHDL data type
Access type (pointer)
Array composite type
Enumeration scalar type
File type
Floating point scalar type
Record composite type
Integer & physical scalar types
Time type
Copyright © 2002 Mentor Graphics Corporation
Notes:
The typeID handle:
• Can be obtained for a signal by calling mti_GetSignalType
• Can be obtained for a variable by calling mti_GetVarType
VHDL data types are identified in the C interface by a type ID. A type ID can be
obtained for a signal by calling mti_GetSignalType (), and for a variable by
calling mti_GetVarType().
ModelSim Advanced Debugging
December 2002
7-27
FLI and C Models
Alternatively, the mti_CreateScalarType(), mti_RealType(),
mti_CreateTimeType(), mti_CreateEnumType(), and mti_CreateArrayType()
functions return type IDs for the data types they create.
Object values for access and file types are not supported by the C interface.
Values for record types are supported at the non-record sub element level.
Effectively, this leaves scalar types and arrays of scalar types as valid types for C
interface object values. In addition, multi-dimensional arrays are accessed in the
same manner as arrays of arrays.
Scalar and physical types use 4 bytes of memory; TIME and REAL types use 8
bytes. An enumeration type uses either 1 or 4 bytes, depending on how many
values are in the enumeration. If it has 256 or fewer values, then it uses 1 byte;
otherwise it uses 4 bytes. In some cases, all scalar types are cast to "long" before
being passes as a non-array scalar object value of any non-array scalar signal
except TIME and REAL types, which can be retrieved using
mti_GetSignalValue(). Use mti_GetVarValue() and mti_GetVarValueIndirect()
for variables.
7-28
ModelSim Advanced Debugging
December 2002
FLI and C Models
Enumerations, Reals and Time
Enumerations, Reals and Time
♦ Enumeration object values are
equated to the position number
of the corresponding identifier
in a VHDL type declaration. For
example :
-- C Interface Values
Type std_ulogic is
(‘U’, -- 0
‘X’, -- 1
‘0’, -- 2
‘1’, -- 3
‘Z’, -- 4
‘W’, -- 5
‘L’, -- 6
‘H’, -- 7
‘-’, -- 8
);
7-15 • ModelSim® Advanced Debugging: FLI and C Models
♦ Real and Time types (signals
and variables) require eight
bytes to store them. Equivalent
to the following structures :●
●
mtiTime64 structure defined in
mti.h defines low word and
high word
C “double” data type
♦ GetSignalValueIndirect used to
obtain pointer to Signals
♦ GetVarValueIndirect used to
obtain pointer to Variables
Copyright © 2002 Mentor Graphics Corporation
Notes:
ModelSim Advanced Debugging
December 2002
7-29
FLI and C Models
Arrays
Arrays
♦ Arrays
●
The C type “void*” is used for array type object values to point to
the first element of the array of C type:
–
–
–
–
●
●
●
“char” for enumerated types
“double” for REAL types
“mtiTime64T” for TIME types
“mtiInit32T” in all other cases
First element equals left bound of index range
Last element equals right bound of index range
Reminder : std_ulogic_vector is an array of Enumerations. The
array is not NULL terminated as you would expect for a C string,
so you must call mti_TickLength() to get its length.
7-16 • ModelSim® Advanced Debugging: FLI and C Models
Copyright © 2002 Mentor Graphics Corporation
Notes:
A STRING data type is represented as an array of enumeration values. The array
is not NULL terminated as you would expect for a C string, so you must call
mti_TickLength() to get its length.
7-30
ModelSim Advanced Debugging
December 2002
FLI and C Models
Using Checkpoint and Restore With FLI
Using Checkpoint and Restore With FLI
In order to use checkpoint/restore with the FLI, any data
structures that have been allocated in foreign models and
certain IDs passed back from mti function calls must be
explicitly saved and restored.
♦ Main Feature: Set of Memory Allocation Functions
●
Automatically restored to same memory location
– Uses pointers
●
Must use a set of MTI memory allocation function calls
– mti_Malloc() and mti_Free()
●
Memory allocated by a function call will be restored to the same
location in memory automatically
7-17 • ModelSim® Advanced Debugging: FLI and C Models
Copyright © 2002 Mentor Graphics Corporation
Notes:
Memory allocated by one of the functions will be automatically restored for you
to the same location in memory, ensuring that pointers into the memory will still
be valid.
mti_Realloc() works like the C realloc() function on memory allocated by
mti_Malloc(). If the specified size is larger than the size of memory already
allocated to the origptr parameter, then new memory of the required size is
allocated and initialized to zero, the entire content of the old memory is copied
into the memory, and a pointer to the new memory is returned. Otherwise, a
pointer to the old memory is returned.
ModelSim Advanced Debugging
December 2002
7-31
FLI and C Models
Any memory allocate by mti_Realloc() is guaranteed to be checkpointed and
restored just like memory allocated by mti_Malloc(). Memory allocated by
mti_Realloc() can be freed only by mti_Free().
Mti_Realloc() automatically checks for a NULL pointer. In the case of an
allocation error, mti_Realloc() issues the following error message and aborts the
simulation:
****** Memory allocation failure.******
Please check your system for available memory and swap space.
7-32
ModelSim Advanced Debugging
December 2002
FLI and C Models
Using Checkpoint and Restore With FLI
(Cont.)
Using Checkpoint and Restore With FLI (Cont.)
♦ Second Feature: Explicit Functions to Save and Restore Data
●
Use to save pointers to data structures and IDs returned from FLI
functions
– Pointers must be global, not variables
●
Must explicitly save and restore your allocated memory
structures if you choose not to use the provided MTI memory
allocation functions
♦ Note: The restores must be performed in the same order as
the saves
●
●
●
The save and restore of data structures is maintained by
simulation kernel
If user declares own data storage, the user is responsible for
saving and restoring that memory
Model must be coded assuming that the code could reside in a
different memory location when restored
Reference the ModelSim FLI Manual for list of checkpoint and restore commands
7-18 • ModelSim® Advanced Debugging: FLI and C Models
Copyright © 2002 Mentor Graphics Corporation
Notes:
There are other FLI functions that are part of checkpoint and restore:
• mti_RestoreBlock
• mti_RestoreChar
• mti_RestoreLong
• mti_RestoreShort
• mti_RestoreString
ModelSim Advanced Debugging
December 2002
7-33
FLI and C Models
• mti_SaveBlock
• mti_SaveList
• mti_SaveLong
• mti_SaveShort
• mti_saveString
The above list is not by any means a comprehensive list of all of the FLI
checkpoint and restore commands. For a description of checkpoint and restore
commands/functions and what they do, see the ModelSim Foreign Language
Interface Manual.
7-34
ModelSim Advanced Debugging
December 2002
FLI and C Models
C Architecture Example
C Architecture Example
entity and_gate is
port(in1, in2 : bit;
out1 : out bit);
end;
VHDL
Initialization function
Object code
architecture only of and_gate is
attribute foreign : string;
attribute foreign of only : architecture is "and_gate_init gates.so";
begin
end;
7-19 • ModelSim® Advanced Debugging: FLI and C Models
Copyright © 2002 Mentor Graphics Corporation
Notes:
Starting with VHDL ‘93, the FOREIGN attribute is declared in package
STANDARD. With the 1987 version, you need to declare it yourself. Declare it in
a separate package or directly in the architecture. This also works with VHDL ‘93.
ModelSim Advanced Debugging
December 2002
7-35
FLI and C Models
C Architecture Example (Cont.)
C Architecture Example (Cont.)
The following is the C model of the two-input AND gate:
#include <stdio.h>
#include "mti.h"
typedef struct {
mtiSignalIdT in1;
mtiSignalIdT in2;
mtiDriverIdT out1;
} inst_rec;
void do_and( void * param )
{
inst_rec * ip = (inst_rec *)param;
mtiInt32T val1, val2;
mtiInt32T result;
val1
= mti_GetSignalValue( ip->in1 );
val2
= mti_GetSignalValue( ip->in2 );
result = val1 & val2;
mti_ScheduleDriver( ip-> out1, result, 0, MTI_INERTIAL );
}
7-20 • ModelSim® Advanced Debugging: FLI and C Models
Copyright © 2002 Mentor Graphics Corporation
Notes:
This is the same model as provided in
/<modeltech_install_dir>/examples/foreign/example_two/gates.c
NOTE: RECORD generics are not supported in FLI.
7-36
ModelSim Advanced Debugging
December 2002
FLI and C Models
C Architecture Example (Cont.)
C Architecture Example (Cont.)
void and_gate_init(
mtiRegionIdT
region,
char
*param,
mtiInterfaceListT *generics,
mtiInterfaceListT *ports
)
{
inst_rec
*ip;
mtiSignalIdT outp;
mtiProcessIdT proc;
ip = (inst_rec *)mti_Malloc( sizeof(inst_rec) );
ip->in1 = mti_FindPort( ports, "in1" );
ip->in2 = mti_FindPort( ports, "in2" );
outp = mti_FindPort( ports, "out1" );
ip->out1 = mti_CreateDriver( outp );
proc = mti_CreateProcess( "p1", do_and, ip );
mti_Sensitize( proc, ip->in1, MTI_EVENT );
mti_Sensitize( proc, ip->in2, MTI_EVENT );
Initialization function is passed:
region (hierarchical location)
ptr to param (from foreign attr)
ptr to generics
ptr to ports
Allocate Memory for Instance
Save Ids for Signals/Drivers
Create Output Driver
Create Process
Sensitize Process to Inputs
}
7-21 • ModelSim® Advanced Debugging: FLI and C Models
Copyright © 2002 Mentor Graphics Corporation
Notes:
ModelSim Advanced Debugging
December 2002
7-37
FLI and C Models
C Subprograms
C Subprograms
To call a foreign C subprogram, you must write a VHDL
subprogram declaration that has the equivalent VHDL
parameters and return type. Then use the FOREIGN attribute
to specify which C function and module to load. The syntax of
the FOREIGN attribute is almost identical to the syntax used
for foreign architectures.
♦ Functions
●
●
With integer or enumeration return value
Inputs include integer, enumeration, real, time and array
♦ Procedures
●
●
INs and INOUTs include integer, enumeration, real, time and array
Access types not allowed of class signal
7-22 • ModelSim® Advanced Debugging: FLI and C Models
Copyright © 2002 Mentor Graphics Corporation
Notes:
Example:
procedure in_params (
vhdl_integer : IN integer;
vhdl_enum : IN severity_level;
vhdl_real : IN real;
vhdl_array : IN string);
attribute FOREIGN of in_params : procedure is "in_params app.so";
7-38
ModelSim Advanced Debugging
December 2002
FLI and C Models
C Subprogram Example
C Subprogram Example
VHDL
package pkg is
procedure sdk_to_string_sulv (
vhdl_array
: IN bit_vector;
format_array : IN string;
return_array : OUT string;
return_len
: OUT integer);
attribute foreign of sdk _to_string_sulv is “sdk_to_string_sulv sdk_to_string_sulv.so”;
end;
package body pkg is
procedure sdk _to_string_ sulv (
vhdl_array
: IN bit_vector;
format_array : IN string;
return_array : OUT string;
return_len
: OUT integer) is
begin
report “ERROR: foreign subprogram sdk_to_string_sulv not called”;
end;
end;
You must also write a subprogram body for the subprogram,
but it will never be called. The C program gets called.
7-23 • ModelSim® Advanced Debugging: FLI and C Models
Copyright © 2002 Mentor Graphics Corporation
Notes:
ModelSim Advanced Debugging
December 2002
7-39
FLI and C Models
C Subprogram Example (Cont.)
C Subprogram Example (Cont.)
#include "mti.h"
#include <stdio.h>
void sdk _to_string_sulv (
/* IN bit_vector */
mtiVariableIdT vhdl_array,
mtiVariableIdT format_array, /* IN string */
mtiVariableIdT return_array, /* OUT string */
int *return_ len
/* OUT integer */ )
{
static char buf[32],fstring [32], rstring[64];
char * sul [] = {"U","X","0","1","Z","W","L","H","-"};
char foo, * val ;
int len, i;
mtiTypeIdT type;
C
/* copy vhdl string format and null terminate it */
mti _GetArrayVarValue(format_array, fstring );
mti_ GetVarType(format_array);
type =
len = mti _ TickLength(type);
fstring [len] = 0;
/* get pointer to input bit_vector */
type = mti _GetVarType ( vhdl_array);
len = mti _ TickLength (type);
mti_ GetArrayVarValue (vhdl_array,buf);
for(i=0;i< len;i++){buf[i] = *sul[buf[i]];
buf [len] = 0;
}
sprintf (rstring,fstring, buf );
*return_len = ( strlen rstring );
/* Get pointer to result and store string to it */
val = mti_GetArrayVarValue(return_array,NULL);
strncpy,( val rstring,*return_len);
}
7-24 • ModelSim® Advanced Debugging: FLI and C Models
Copyright © 2002 Mentor Graphics Corporation
Notes:
7-40
ModelSim Advanced Debugging
December 2002
FLI and C Models
Enums and Arrays
Enums and Arrays
♦ Reading and Setting Enums
Hint:
static void eval_enum (ip)
inst_rec *ip;
DefineEnums to Make Code Readable
Example:
std_ ulogic {U,X,0,1,Z,W,L,H,-}
{
enum boolean { FALSE, TRUE } val_a, val_b, val_out;
char **enum_literals;
/* Evaluate : enum_out <= enum_a and enum_b */
val_a = mti_GetSignalValue (ip-> enum_a);
val_b = mti_GetSignalValue (ip -> enum_b);
if (( val_a == TRUE) && (val_b == TRUE))
mti _GetSignalValueused to read enums
val_out = TRUE;
mti _ScheduleDriver used to set enum values
else
val_out = FALSE;
mti_ScheduleDriver (ip -> enum_out, (long) val_out, 0, MTI_INERTIAL);
}
7-25 • ModelSim® Advanced Debugging: FLI and C Models
Copyright © 2002 Mentor Graphics Corporation
Notes:
ModelSim Advanced Debugging
December 2002
7-41
FLI and C Models
Enums and Arrays (Cont.)
Enums and Arrays (Cont.)
♦ Reading and Setting Arrays
static_void eval_array(ip)
inst_rec *ip;
{
typedef enum { BIT_0, BIT_1 } bit;
char val_a[8], val_b[8], val_out[8];
char **enum_literals;
mti_GetArraySignalValue used to read arrays
int i;
/* Evaluate: array_out <= array_a and array_b */
mti_GetArraySignalValue (ip -> array_a, val_a);
mti_GetArraySignalValue (ip -> array_b, val_b);
for (i = 0; i< 8; i++) {
if ((val_a[i] == BIT_1) && (val_b[i] == BIT_1))
val_out[i] = BIT_1;
else val_out [i] = BIT_0;
mti_ScheduleDriver used to set array values
}
mti_ScheduleDriver (ip -> array_out, (long) val_out, 0, MTI_INERTIAL);
7-26 • ModelSim® Advanced Debugging: FLI and C Models
Copyright © 2002 Mentor Graphics Corporation
Notes:
7-42
ModelSim Advanced Debugging
December 2002
FLI and C Models
FLI Problems
FLI Problems
♦ Fatal FLI errors usually result in a crash.
# ** Fatal: bad pointer access
# Time: 63700 ns Iteration: 5 Instance: /testbench/textio_inst
# Fatal error at line 0
♦ Non-fatal bugs can lead to wrong simulation results or errors
from the simulator.
♦ Can be debugged by:
●
●
●
using the “trace” capability of ModelSim
adding “fprintf(stderr, …)” calls to C code and re-running
attaching a debugger (such as gdb) to ModelSim
7-27 • ModelSim® Advanced Debugging: FLI and C Models
Copyright © 2002 Mentor Graphics Corporation
Notes:
ModelSim Advanced Debugging
December 2002
7-43
FLI and C Models
Debugging/Tracing
Debugging/Tracing
♦ FLI Tracing - Creates a logfile to aid the debugging of FLI
code.
●
●
●
Captures FLI calling sequence in an ASCII file
FLI can be replayed (at MTI) without user’s compiled code to
debug problems
If design is crashing, this feature can be used to find out which
call is crashing the simulator. Most probable cause is bad
pointer provided by the user code
♦ Invoke the trace: vsim -trace_foreign <action> [-tag <name>]
7-28 • ModelSim® Advanced Debugging: FLI and C Models
Copyright © 2002 Mentor Graphics Corporation
Notes:
The purpose of the logfile is to aid you in debugging FLI code. The primary
purpose of the replay facility is to send the replay file to MTI support for
debugging co-simulation problems, or debugging FLI problems for which it is
impractical to send the FLI code. MTI would still require a copy of the
VHDL/Verilog part of the design to actually execute a replay, but many problems
can be resolved with the trace only.
7-44
ModelSim Advanced Debugging
December 2002
FLI and C Models
Debugging/Tracing (Cont.)
Debugging/Tracing (Cont.)
♦ FLI tracing
●
vsim -trace_foreign 1 mydesign
(Creates a logfile)
●
vsim -trace_foreign 3 mydesign
(Creates a logfile and a set of replay files)
●
vsim -trace_foreign 1 -tag 2 mydesign
(Creates a logfile with a tag of "2”)
♦ Add debug information to the ‘C’ function
●
●
printf() or mti_printmessage()
ifdef debug
♦ Add commands to FLI to dump internal data / print status
●
mti_AddCommand or mti_AddTclCommand
♦ Create internal signals
●
mti_CreateSignal()
7-29 • ModelSim® Advanced Debugging: FLI and C Models
Copyright © 2002 Mentor Graphics Corporation
Notes:
In order to debug your FLI code in a debugger, your application code must be
compiled with the debugging information (for example, by using the -g option).
You must then load vsim into a debugger. Even though vsim is stripped, most
debuggers will still execute it.
On Solaris, AIX, and Linux you can use either gdb or ddd (e.g. ddd 'which
vsim'). On HP-UX you can use the wdb debugger from HP (e.g. wdb 'which
vsim;). It is available for download at www.hp.com/go/wdb.
Since initially the debugger recognizes only vsim's FLI function symbols, you
need to place a breakpoint in the first FLI function that is called by your
application code. An easy way to set an entry point is to put a call to
ModelSim Advanced Debugging
December 2002
7-45
FLI and C Models
mti_GetProduct() as the first executable statement in your application code. Then,
after vsim has been loaded into the debugger, set a breakpoint in this function.
Once you have set the breakpoint, run vsim with the usual arguments (e.g. "run -c
top").
On HP-UX you might see some warning messages that vsim doesn't have
debugging information available. This is normal. If you are using Exceed to
access an HP machine, it is recommended that you run vsim in command line or
batch mode because the NT machine might hang if you run vsim in GUI mode.
Click on the "go" button, or use F5 to execute vsim in wdb.
When the breakpoint is reached the shared library containing your application
code has been loaded. In some debuggers you must use the share command to
load the FLI application's symbols.
Again, on HP-UX you might see a warning about not finding "_dld_flags" in the
object file. This warning can be ignored. You should see a list of libraries loaded
into the debugger. It should include the library for your FLI application.
Alternatively, you use "share" to load only a single library.
At this point all of the FLI application's symbols should be visible. You can now
set breakpoints in and single step through your FLI application code.
7-46
ModelSim Advanced Debugging
December 2002
FLI and C Models
FLI Problems (Cont.)
FLI Problems (Cont.)
Use the -trace_foreign <n> switch to enable FLI tracing
♦ 1 = create log file only (mti_trace)
♦ 2 = create replay only (mti_data,mti_init,mti_replay,mti_top)
♦ 3 = create both
vsim -c test_pseudo -trace_foreign 3
Callback 1: trace_0 = 0x2411023 for array_monitor1
Time (0, 100); Iteration 1
Entering mti_GetArraySignalValue
ERROR: arg 1 to mti_GetArraySignalValue type mtiSignalIdT
was not supplied by an mti call
arg 2 is (void*) = 0x24189f8
returned (void*) { 0x2,0x2,0x2,0x2,0x2,0x2,0x2,0x2, 0 }
Exiting mti_GetArraySignalValue
Callback 1: returned status = 0x0
Time (0, 0); Iteration 0
End of foreign interface trace
7-30 • ModelSim® Advanced Debugging: FLI and C Models
Copyright © 2002 Mentor Graphics Corporation
Notes:
The FLI interface tracing feature is available for tracing user foreign language
calls made to the MTI VHDL FLI. Foreign interface tracing creates two kinds of
traces: a human-readable log of what functions were called, the value of the
arguments, and the results returned; and a set of C-language files to replay what
the foreign interface did.
The purpose of the logfile is to aid you in debugging FLI code. The primary
purpose of the replay facility is to send the replay file to MTI support for
debugging co-simulation problems, or debugging FLI problems for which it is
impractical to send the FLI code. MTI would still require a copy of the
VHDL/verilog part of the design to actually execute a replay, but many problems
can be resolved with the trace only.
ModelSim Advanced Debugging
December 2002
7-47
FLI and C Models
Other Examples
Other Examples
♦ Other examples are located in the ModelSim installation
directory $MODELSIM_HOME/modeltech/examples/foreign
●
●
●
●
Example 1 - FLI test example is to illustrate how to create processes and
sensitize them to signals and how to read and drive signals from these
processes.
Example 2 - FLI test example is to illustrate traversal of the design
hierarchy, creation of a simple gate function, creation and sensitization of
a process, and loading of multiple foreign shared libraries.
Example 3 - FLI test example is to illustrate how to read a test vector file
and use it to stimulate and test a design via FLI function calls.
Example 4 - FLI test example is to illustrate how to create and use foreign
subprograms.
7-31 • ModelSim® Advanced Debugging: FLI and C Models
Copyright © 2002 Mentor Graphics Corporation
Notes:
7-48
ModelSim Advanced Debugging
December 2002
FLI and C Models
Summary
Summary
This module introduced and explored the application of the
following topics:
♦ The Foreign Language Interface (FLI)
♦ Benefits of C Interface
♦ FLI C Functions
●
●
●
●
♦
♦
♦
♦
♦
Callbacks
Hierarchy Scanning
Signals and Variables
Utilities
Foreign Architecture Init
Mapping of Data Types
Using Checkpoint and Restore with FLI
FLI C functions and Subprogram Examples
Debugging and Tracing FLI Problems
7-32 • ModelSim® Advanced Debugging: FLI and C Models
Copyright © 2002 Mentor Graphics Corporation
Notes:
ModelSim Advanced Debugging
December 2002
7-49
FLI and C Models
Lab 7: FLI Bug in C Code
Introduction
This lab explores various techniques used in debugging an FLI bug in C code. We
will use a slightly different version of the blackjack design used in the Tcl/Tk
testbench lab exercise. There will be a bug that you will have to find in order to
get correct simulation results.
Directions
1. To set up the lab, invoke ModelSim and change directory to the
labs/lab7/blackjack directory (use the “cd” command or the File → Change
Directory… menu item. Open ModelSim and select File → Open →
Project. Choose the Fli.mpf project to load.
2. Once loaded, recompile the entire project. In the ModelSim Main window,
click once using the right mouse button (RMB). Select Compile →
Compile Order. When the Compile Order window loads, select Auto
Generate.
7-50
ModelSim Advanced Debugging
December 2002
FLI and C Models
Compile Order
ModelSim Advanced Debugging
December 2002
7-51
FLI and C Models
3. Compile the C file, testbench_error.c after compiling the VHDL files:
Solaris (Note: You may also compile the C file by executing
compile_c_error_sol at the unix shell prompt):
gcc -c -I$MTI_HOME/include ./Source/error/testbench_error.c
ld -G -o tbio_error.sl testbench_error.o
HP:(Note: You may also compile the C file by executing
compile_c_error_hpu at the unix shell prompt):
gcc -c -fpic -I$MTI_HOME/include
./Source/error/testbench_error.c
(cont. next line)
ld -b -o tbio_error.sl testbench_error.o
Windows:
Compile & link testbench_error.c with the following commands
from the DOS command prompt:
cd \labs\lab7\blackjack
cl -c -I%MTI_HOME%/include Source\error\testbench_error.c
link -dll -export:init_tbio testbench_error.obj (cont. next line)
%MTI_HOME%\win32\mtipli.lib /out:tbio_error.sl
4. Load the simulation: click on the “+” sign in front of the work library in the
Library tab of the Main window. Double click on the “testbench” entity in
the Library tab.
5. Notice that the last message during the elaboration phase was “Loading
./tbio_error.sl”. This is the compiled object for the C code used in the test
bench.
6. Run the design by typing: run –all.
7. The design will stop abruptly and print a message similar to this:
# ** Fatal: Bad pointer access
#
Time: 63700 ns Iteration: 5
# Fatal error at line 0
7-52
Instance: /testbench/textio_inst
ModelSim Advanced Debugging
December 2002
FLI and C Models
This error is coming from inside the ModelSim kernel. These errors are
caused by the internal data structures in ModelSim getting trashed
somehow. This can be due to either a bug in ModelSim, or a bug in the
user’s PLI or FLI code. This lab uses FLI code, so we would be suspicious
of the problem being in the FLI code and not the simulator.
8. To narrow down on the problem, we’ll re-run the simulation with the trace_foreign switch. This will create a trace file that shows what FLI calls
were made, and what their arguments were. This will help us determine the
location of the bug. You can also debug this by inserting print statements in
the FLI code, and watching how many print messages come out, but the
trace file is much easier. A third option would be to use a C debugger, such
as gdb, but that will be too complicated for this lab. There is information on
how to do this in the ModelSim User’s Guide.
9. Quit the current simulation. (quit -sim).
10. If you are working on a Unix System, skip this step.
If you are working on a Windows System: Comment out line 154 of
Source\error\testbench_error.c. Recompile and relink testbench_error.c.
// ip = (void *) - 1;
ModelSim Advanced Debugging
December 2002
7-53
FLI and C Models
11. Re-run ModelSim with the trace_foreign switch, as follows:
vsim –trace_foreign 3 testbench
There are different levels of tracing; level 3 gives the most detailed
information. It also outputs some other files that can be used to emulate the
FLI code’s interaction with the simulator. This can be useful to create a test
case to MTI if you think you’ve found a bug in the FLI interface.
12. Run the simulation again with run –all.
The ModelSim GUI may close after executing this command however the
mti_trace file will still be generated. Relaunch ModelSim and continue
with step 13.
13. You can now look at the generated file by typing notepad mti_trace at the
ModelSim prompt.
14. Look at this file, and you’ll see for each FLI call the C code makes to the
simulator, the simulator recorded entering the function and exiting it, and
what the parameters were. Go to the bottom of the file, and you see that it
entered a function called mti_GetSignalValue, but never exited. So the
crash occurred in this function.
15. Look up the file a few lines and you’ll see a line similar to:
Callback 66: trace_14 = 0x2921396 for Prt_Bust
Time (0, 63700); Iteration 5
(Note: If you have difficulty finding the line, do a search for Prt_Bust. The
Callback number and/or time may be somewhat different from the line
above).
This shows that the FLI code that called the crashing function called from a
process named Prt_Bust. This process was created in the FLI code by this
statement:
procBust = mti_CreateProcess("Prt_Bust",
(mitVoidFuncPtrT)evalBust, ip);
7-54
(cont. next line)
ModelSim Advanced Debugging
December 2002
FLI and C Models
16. Open the C code used in the design by going to the Project tab in the main
window, and double-clicking on the file “testbench_error.c”. Go to line
68 and you’ll see the above line. The first parameter to mti_CreateProcess
is the process name to create (this is the one with the problem). The second
parameter is the name of the C function to call when the process is
scheduled. So, this is the part of the C code that called mti_GetSignalValue
when it crashed.
17. Now search down the source file for the function named “evalBust”. It is at
line 150. If you look a couple lines down in the function, you see it calls
mti_GetSignalValue. Whenever an FLI object calls one of the FLI
interface functions (functions that start with mti_), and that FLI interface
function crashes, there is a good chance that one of the parameters is wrong.
In this case, mti_GetSignalValue only takes one parameter, and that is a
mtiSignalIDT pointer for the signal whose value it is to get.
18. The parameter is “ip” which is the instance pointer to the whole data
structure used by the FLI code. If you look down a line, there is a print
statement that is trying to print the total. This parameter to
mti_GetSignalValue should really be a pointer to the signal value, which is
ip->Total, not ip. That is the bug.
19. Fix the C code by editing line 155 of testbench_error.c with the following:
val = mti_GetSignalValue(ip->Total)
If you are on a Unix System, comment out line 154 of testbench_error.c
// ip = (void *) - 1;
Quit the simulator (quit -sim) if necessary and recompile and relink
testbench_error.c.
Reload the simulator (vsim testbench).
Run the simulator (run -all).
You should now observe a successful simulation run. Click on the Break
icon to stop the simulation. You have successfully corrected the FLI error.
ModelSim Advanced Debugging
December 2002
7-55
FLI and C Models
Note: Line 154 of testbench_error.c is a construct just for this lab to make
sure the ModelSim will reliably crash on every platform (step 7).
7-56
ModelSim Advanced Debugging
December 2002
Module 8
Debugging
Objectives
Upon completion of this module, you will be able to:
• Describe reasons to debug
• List the sequence of debugging tasks
• Describe each of the two types of breakpoints
• Describe assertions and an example of an application of assertions
• Describe different methods of gathering and storing symptoms of errors
• Describe how to determine possible causes of errors
• List three different methods to isolate exact causes of errors
• Describe how-to resolve the following types of errors:
o Erroneous Data
o Erratic Data
o Iteration Violations
o SDF Problems
• Demonstrate debugging methods
ModelSim Advanced Debugging
December 2002
8-1
Debugging
Module Overview
Module Overview
In this module we will discuss:
♦ When to debug?
♦ Debugging Tasks
♦ Breakpoints
♦ Checkpoint and Restore
♦ Bus Checks
♦ Toggle and Stability Checking
♦ Batch Mode Simulation
♦ Unknown States
♦ Erroneous Data
♦ Iteration Violations
♦ Mixed Language Issues
♦ SDF Instance Specification
♦ Generic Mismatches
♦ More Useful vcom and vlog Commands
8-2 • ModelSim® Advanced Debugging: Debugging
Copyright © 2002 Mentor Graphics Corporation
Notes:
8-2
ModelSim Advanced Debugging
December 2002
Debugging
When to Debug?
When to Debug?
♦ Not getting successful compilation
●
●
●
Code syntax errors
Library problems
Dependencies
♦ Not getting correct or expected simulation results
●
●
●
●
●
Testbench issues
Assert messages to main window
Value Change Dump (VCD) compares
Waveform compares
List output differences
♦ ModelSim user interface has many powerful debugging
capabilities
8-3 • ModelSim® Advanced Debugging: Debugging
Copyright © 2002 Mentor Graphics Corporation
Notes:
ModelSim Advanced Debugging
December 2002
8-3
Debugging
Debugging Tasks
Debugging Tasks
♦
♦
♦
♦
♦
♦
Detection (Test Bench)
Symptoms (Capture, Store, & Analyze Data)
Possible Causes (Window Cross-Probing, Backtracking)
Isolation (Design Probing & Control, Virtuals & TCL/TK)
Resolution
Verification
8-4 • ModelSim® Advanced Debugging: Debugging
Copyright © 2002 Mentor Graphics Corporation
Notes:
8-4
ModelSim Advanced Debugging
December 2002
Debugging
Breakpoints
Breakpoints
♦ Two types of breakpoints are supported
●
Breakpoints on lines of source code
– Click on line of code
– or use bp command: bp <filename> <line#>
• If filename and line number missing then existing breakpoints are
displayed
–
–
–
–
●
RMB to disable/remove breakpoint
or use bd command: bd <filename> <line#>
Toggles - click again to enable/disable existing breakpoint
No limit to the number of break points
Conditional break points
when <condition> <action>
when {b=1 and c/=0} stop
– Used with VHDL signals and Verilog nets and registers
– Also use bp command with Tcl commands:
bp <filename> <line#> {if {$now /= 100} then {cont}}
♦ GUI access via menu Tools > Breakpoints...
8-5 • ModelSim® Advanced Debugging: Debugging
Copyright © 2002 Mentor Graphics Corporation
Notes:
ModelSim Advanced Debugging
December 2002
8-5
Debugging
Checkpoint and Restore
Checkpoint and Restore
♦ Checkpoint saves the simulation kernel state of the design
●
This includes the vsim.wlf file, the list of the HDL items shown in the List &
Wave windows, the file pointer postions for files opened, and the state of
foreign architectures.
checkpoint <filename>
♦ Restore restores the “state” of the design saved by checkpoint
restore <filename>
or
vsim -restore <filename>
♦ Useful for long simulations
●
●
Put in periodic checkpoints in anticipation of simulation error
Restore back to “state” prior to simulation error
– Add more signals to monitor for debugging purposes
– Continue simulation
* Note: Only supported when using the same version of ModelSim.
8-6 • ModelSim® Advanced Debugging: Debugging
Copyright © 2002 Mentor Graphics Corporation
Notes:
8-6
ModelSim Advanced Debugging
December 2002
Debugging
Bus Checks
Bus Checks
♦ Bus Contention
●
●
●
●
●
Detects conflicts on nodes with multiple drivers
Error message issued identifying problem nodes
You have to specify nodes to be checked
Write checking messages to a file, default is to screen.
Commands
check contention add <node_name>
check contention config [-file <filename>] [-time <limit>]
check contention off <node_name>
♦ Bus Float
●
●
Time limit that a node may be in contention
Detects nodes that are in the high impedance state for a userdefined limit
Commands
check float add <node_name>
check float config [-file <filename>] [-time <limit>]
check float off <node_name>
Time limit that a node may be floating
8-7 • ModelSim® Advanced Debugging: Debugging
Copyright © 2002 Mentor Graphics Corporation
Notes:
ModelSim Advanced Debugging
December 2002
8-7
Debugging
Toggle and Stability Checking
Toggle and Stability Checking
♦ Toggle checking
●
●
●
●
●
Counts transitions on specified signals
Issues report of toggle statistics
Can help identify areas in the design that have high activity
Can help identify areas in the design that are not properly simulated
Commands
toggle add <node_name>
toggle report [-file <filename>]
toggle reset <node_name>
♦ Stability checking
●
●
●
●
Detects when activity has not settled within a defined period
User specifies clock period, strobe time
Monitors the entire design
Commands
clock period
elapsed time within each clock cycle
check stable off
check stable on [-file <filename>] [-period <time>] [-strobe <time>]
8-8 • ModelSim® Advanced Debugging: Debugging
Copyright © 2002 Mentor Graphics Corporation
Notes:
8-8
ModelSim Advanced Debugging
December 2002
Debugging
Verification
Verification
♦ Run simulation in batch mode, monitoring desired signals
●
Can be used from the command line (no GUI, -c = command line)
vsim -c -wlf batchrun1.wlf testbench < my_batch1.do
♦ Invoke simulation with -view option
●
●
●
●
Invokes the simulator to view a saved vsim.wlf file
Does not consume a full simulator license
You can view multiple data sets (.wlf files)
Permits easy, fast viewing of signals
vsim -view batchrun1.wlf
* Note: The -view option is only supported if viewing the vsim.wlf file
in the SAME version of ModelSim as the one used to generate it.
8-9 • ModelSim® Advanced Debugging: Debugging
Copyright © 2002 Mentor Graphics Corporation
Notes:
ModelSim Advanced Debugging
December 2002
8-9
Debugging
Unknown States (See Module 1)
Unknown States (See Module 1)
Back tracing an Unknown
♦ Find signal in question
♦ Move cursor to unknown’s
time
♦ Open dataflow window
♦ Drag signal to dataflow
window
● drivers of signal appear
8-10 • ModelSim® Advanced Debugging: Debugging
Copyright © 2002 Mentor Graphics Corporation
Notes:
8-10
ModelSim Advanced Debugging
December 2002
Debugging
Erroneous Data
Erroneous Data
♦ Back trace cause of error with Dataflow window
●
same as previous slide showing back tracing X’s
♦ Use source window to display relevant code while back tracing
8-11 • ModelSim® Advanced Debugging: Debugging
Copyright © 2002 Mentor Graphics Corporation
Notes:
ModelSim Advanced Debugging
December 2002
8-11
Debugging
Searching for Expressions
Searching for Expressions
♦
♦
♦
♦
Search for edges or specific values
Search for combinations of signal values
Find the number of occurrences of complex expressions
Edit > Search...
8-12 • ModelSim® Advanced Debugging: Debugging
Copyright © 2002 Mentor Graphics Corporation
Notes:
8-12
ModelSim Advanced Debugging
December 2002
Debugging
Iteration Violations
Iteration Violations
♦ Iteration violations are errors in which the simulator cannot
resolve all of the events that occur at a given timestep.
♦ Most commonly caused by zero-delay loops in user’s code.
♦ Default iteration limit is 5000
●
can be changed in Options->Simulation Options dialog box
♦ Simulator stops immediately upon hitting iteration limit
Error:
# Iteration limit reached. Possible zero delay oscillation. See the manual.
# Time: 63700 ns Iteration: 5 Instance: /testbench/textio_inst
♦ User can debug it by increasing iteration limit and singlestepping.
8-13 • ModelSim® Advanced Debugging: Debugging
Copyright © 2002 Mentor Graphics Corporation
Notes:
ModelSim Advanced Debugging
December 2002
8-13
Debugging
Iteration Violations (Cont.)
Iteration Violations (Cont.)
♦ When debugging iteration limit problems, look for situations like
the following:
●
●
●
●
●
Missing or incorrectly applied SDF annotation to a netlist
RTL-level design with an asynchronous feedback loop with no delays
Event ordering in Verilog
Long string assignments (VHDL):
a1 <= a0;
a2 <= a1;
...
a500 <=a499;
Processes without wait statements or sensitivity lists:
a <= not b;
b <= not a;
8-14 • ModelSim® Advanced Debugging: Debugging
Copyright © 2002 Mentor Graphics Corporation
Notes:
8-14
ModelSim Advanced Debugging
December 2002
Debugging
Mixed Language Issues
Mixed Language Issues
♦ ModelSim offers the capability to do mixed language simulation
●
Mixture of VHDL & Verilog design files, testbenches, and libraries
♦ Hierarchical access
●
●
●
Cannot directly read or change a VHDL signal, variable, or generic
with a hierarchical reference within a mixed-language design
Cannot directly access a Verilog object in the hierarchy if there is an
interceding VHDL block
Two options
– Propagate the value through the ports of all design units in the hierarchy
– Use the Signal Spy function
• $init_signal_spy
• init_signal_spy()
if referencing within a Verilog module
if referencing within a VHDL module
♦ Verilog identifiers
●
Use the vcom or vlog -93 switch if names are unique by case only
8-15 • ModelSim® Advanced Debugging: Debugging
Copyright © 2002 Mentor Graphics Corporation
Notes:
ModelSim Advanced Debugging
December 2002
8-15
Debugging
Mixed Language Issues (Cont.)
Mixed Language Issues (Cont.)
♦ Compiling mixed designs with -fast
●
●
All children of Verilog must be Verilog also
Can instantiate Verilog compiled with -fast in VHDL
– VHDL cannot modify the parameters of the Verilog module
♦ Verilog gate-level simulation
●
●
Faster runtimes vs. VHDL
Do not need overhead of VITAL models
♦ SDF for mixed VHDL & Verilog designs
VITAL cells & Verilog cells can be annotated from the same SDF file
●
access via SDF command-line options
-sdfmin | -sdftyp | -sdfmax [<instance>=]<sdf_filename>
●
♦ Search Libraries
●
vsim -L command searches the specified library for precompiled
modules
– Use in Verilog SDF simulation to specify cell primitives & work libraries
8-16 • ModelSim® Advanced Debugging: Debugging
Copyright © 2002 Mentor Graphics Corporation
Notes:
8-16
ModelSim Advanced Debugging
December 2002
Debugging
Issues With SDF Instance Specification
Issues With SDF Instance Specification
♦ Use the simulator’s SDF command line options to specify the
SDF files, the desired timing values, and design instances:
●
●
●
-sdfmin
-sdftyp
-sdfmax
[<instance>=]<filename>
vsim -sdfmax /testbench/u1=uart_top.sdf testbench
♦ Make sure the SDF file points to the correct instance
●
●
Instance paths in the SDF file are relative to the instance to which
the SDF is applied.
If the instance name is omitted, the SDF file is applied to the toplevel of the design.
– Usually incorrect
– The model is usually instantiated under a testbench or larger system
simulation
8-17 • ModelSim® Advanced Debugging: Debugging
Copyright © 2002 Mentor Graphics Corporation
Notes:
ModelSim Advanced Debugging
December 2002
8-17
Debugging
SDF Instance Specification
SDF Instance Specification
♦ Example:
testbench
dut
ramwrn_1
block_1
8-18 • ModelSim® Advanced Debugging: Debugging
Copyright © 2002 Mentor Graphics Corporation
Notes:
8-18
ModelSim Advanced Debugging
December 2002
Debugging
Issues With SDF Instance Specification
(Cont.)
Issues With SDF Instance Specification (Cont.)
♦ Example:
# ERROR: C:/Designs/annotations/interface.sdf(15):
Failed to find INSTANCE ‘/testbench/ramwrn_1’
# ERROR: C:/Designs/annotations/interface.sdf(24):
Failed to find INSTANCE ‘/testbench/block_1’
# WARNING: C:/Designs/annotations/interface.sdf:
This file is probably applied to the wrong instance.
♦ The problem
●
●
The instance hierarchical path mentioned does not exist
(‘/testbench/ramwrn_1’) in the loaded design
By default, the hierarchical path that is used is the top-level entity
concatenated with the instance path that exists in the sdf file;
ramwrn_1 and block_1
8-19 • ModelSim® Advanced Debugging: Debugging
Copyright © 2002 Mentor Graphics Corporation
Notes:
ModelSim Advanced Debugging
December 2002
8-19
Debugging
Fixing Instance Specification Problems
Fixing Instance Specification Problems
♦ The Fix
●
●
●
Specify the “region” in ModelSim
The correct “region” is the testbench entity name (testbench)
The instance name is not ramwrn_1
– It is the design’s instantiation name, dut, within testbench
●
●
The correct hierarchical path and command line syntax
(working from the C:/Designs directory):
vsim -sdftyp /testbench/dut=interface.sdf testbench
The INSTANCE hierarchical path would now be
“/testbench/dut/ramwrn_1” which is a valid “region” in this
design
♦ You can also correct this from the GUI:
●
Simulate > Simulate… > SDF tab > Add… > Apply to Region
8-20 • ModelSim® Advanced Debugging: Debugging
Copyright © 2002 Mentor Graphics Corporation
Notes:
8-20
ModelSim Advanced Debugging
December 2002
Debugging
Generics Mismatches
Generics Mismatches
♦ SDF errors can occur when there are generic mismatches in
the SDF file and the instance being annotated
♦ Example:
# ERROR: test.sdf(28): Instance ‘/test/reg1’ does not have a
generic named ‘tpd_cp_q_posedge’.
# ERROR: test.sdf(33): Instance ‘/test/reg1’ does not have a
generic named ‘tpw_cp_negedge’.
# ERROR: test.sdf(32): Instance ‘/test/reg1’ does not have a
generic named ‘tpw_cp_posedge’.
# ERROR: test.sdf(35): Instance ‘/test/reg1’ does not have a
generic named ‘tsetup_d_cp_negedge_posedge’.
# ERROR: test.sdf(34): Instance ‘/test/reg1’ does not have a
generic named ‘tsetup_d_cp_posedge_posedge’.
# Error loading design.
8-21 • ModelSim® Advanced Debugging: Debugging
Copyright © 2002 Mentor Graphics Corporation
Notes:
ModelSim Advanced Debugging
December 2002
8-21
Debugging
Missing Generics
Missing Generics
♦ The Problem
●
●
●
The SDF file contains delay and timing constraint data for cell
instances in the design
Each type of SDF timing construct is mapped to the name of a
generic
When those specific generics do not exist in the cell instance, an
error will occur
♦ The Solution
●
●
Get the generics in the VITAL (VHDL) gate-level model(s) to
match the SDF file
This may require
– a change in the SDF file
– a change in the VITAL models, or
– a change of which VITAL models are being referenced
●
●
There are no command line switches or ModelSim commands
that can resolve the errors
ModelSim is merely reporting a mismatch in the existing data
8-22 • ModelSim® Advanced Debugging: Debugging
Copyright © 2002 Mentor Graphics Corporation
Notes:
8-22
ModelSim Advanced Debugging
December 2002
Debugging
Missing Generics (Cont.)
Missing Generics (Cont.)
♦ The last two generics in the example are:
tsetup_d_cp_negedge_posedge
tsetup_d_cp_posedge_posedge
♦ The associated lines in the SDF file are:
(CELL
(CELLTYPE “reg”)
(INSTANCE reg1)
…
(TIMINGCHECK
(SETUP (negedge D) (posedge CP) (0.5:0.7:0.9))
8-23 • ModelSim® Advanced Debugging: Debugging
Copyright © 2002 Mentor Graphics Corporation
Notes:
ModelSim Advanced Debugging
December 2002
8-23
Debugging
Missing Generics (Cont.)
Missing Generics (Cont.)
♦ Possible cause of the problem
●
●
●
●
The VITAL gate-level model was written with no edge specifier
associated with the D port, and would look like the following:
Entity reg IS
GENERIC (tsetup_d_cp_noedge_posedge: VitalDelayType
:= 0.75 ns);
…);
PORT (…);
The corresponding SDF entry that would work with this generic
would be:
“(SETUP D (posedge CP) (0.5:0.7:0.9)”
The SDF file expects the VITAL model to contain generics that are
unique to the rising and falling edge of D
The VITAL model was written with no regard to the rising or
falling edge of D
– Contact your ASIC or FPGA vendor for further assistance
8-24 • ModelSim® Advanced Debugging: Debugging
Copyright © 2002 Mentor Graphics Corporation
Notes:
8-24
ModelSim Advanced Debugging
December 2002
Debugging
More Useful vcom & vlog Commands
More Useful vcom & vlog Commands
♦ -nodebug
●
●
Not a speed switch
Disables debugging data
– Models compiled with no debugging features
●
●
Do not compile with this option until done debugging
Cannot see inside the model
– Cannot set breakpoints
– Cannot single step within the code
– No internal views in Source, Structure, Signal, Process and Variable
windows
●
Design units compiled with -nodebug can only instantiate other
-nodebug design units
8-25 • ModelSim® Advanced Debugging: Debugging
Copyright © 2002 Mentor Graphics Corporation
Notes:
-nodebug provides protection for proprietary design information. The Verilog
'protect compiler directive provides similar protection, but this directive is a
proprietary Cadence encryption algorithm that is not available to ModelSim.
All Design units that are compiled with -nodebug can only instantiate design
units or modules that are also compiled with -nodebug.
ModelSim Advanced Debugging
December 2002
8-25
Debugging
More Useful vcom & vlog Commands
(Cont.)
More Useful vcom & vlog Commands (Cont.)
♦ -nodebug
●
VHDL
vcom –nodebug=ports level3.vhd level2.vhd
vcom –nodebug top.vhd
●
Verilog
vlog –nodebug=ports level3.v level2.v
vlog –nodebug top.v
– First line compiles & hides the internal data, plus the ports, of the
lower-level design units
– Second line compiles the top-level unit without hiding the ports
– The top-level ports must be visible for simulation
8-26 • ModelSim® Advanced Debugging: Debugging
Copyright © 2002 Mentor Graphics Corporation
Notes:
8-26
ModelSim Advanced Debugging
December 2002
Debugging
Summary
Summary
This Module introduced and explored the application of the following topics:
♦ Reasons for debug
♦ Debugging Tasks
♦ Breakpoints
♦ Checkpoint and Restore
♦ Bus Checks
♦ Toggle and Stability Checking
♦ Batch Mode Simulation
♦ Unknown States
♦ Erroneous Data
♦ Iteration Violations
♦ Mixed Language Issues
♦ SDF Instance Specification
♦ Generic Mismatches
♦ More Useful vcom and vlog Commands
8-27 • ModelSim® Advanced Debugging: Debugging
Copyright © 2002 Mentor Graphics Corporation
Notes:
ModelSim Advanced Debugging
December 2002
8-27
Debugging
Lab 8: Debug
Introduction
This exercise explores various techniques used in debugging designs.
Parts 1 & 2 of this lab will use the blackjack design. There will be a series of bugs
that you will have to find in order to get correct simulation results.
Parts 3 - 10 explore simulating a back-annotated post Place & Route (P & R)
netlist in ModelSim, and includes the following:
• Simulation of a gate-level netlist
• Waveform comparison of RTL simulation to gate-level SDF simulation
• Optimizing the math design
• Simulation of optimized RTL design and SDF waveform comparison
• Verilog gate-level SDF simulation with a VHDL testbench
• Optimized gate-level SDF simulation with a VHDL testbench
• Gate-level SDF batch simulation with a VHDL testbench
• RTL simulation and changing VHDL generics from the command line
PART 1: Iteration Limit Bug
1. First, open ModelSim and select File → New → Project. Create a project in
the labs/lab8/blackjack directory called “iteration_lab”. Select Compile →
Project Defaults and make sure the “Use 1993 Language Syntax” option is
checked. Next, add all of the VHDL files in the
labs/lab8/blackjack/iteration directory. Sort by compile order (Project tab:
RMB Compile > Compile Order). Make sure the compilation order is as
follows:
8-28
ModelSim Advanced Debugging
December 2002
Debugging
packages.vhd
Aces_Counter_error.vhd
Accumulator_error.vhd
DataPath.vhd
FSM_Control.vhd
Black_Jack.vhd
Dealer.vhd
sequencer.vhd
winner_calc.vhd
Game_On.vhd
Loader.vhd
TestBench.vhd
Compile the entire project by selecting Auto Generate. Load the
simulation by double-clicking on the testbench entity in the Library tab.
2. Open the wave window and add all the top-level signals to it. Then do a
“run –all”. The simulation should immediately stop and display this
message:
# Iteration limit reached. Possible zero delay oscillation. See the manual.
This error is due to some logic in the design feeding back on itself without
any non-zero delay. The simulator gets stuck evaluating signals over and
over without advancing time. Each evaluation of a zero-delay event will
generate one “iteration” in the simulator. In this case, the default iteration
limit of 5000 iterations was reached. Now we will have to find where the
problem is and fix it.
3. To find the problem, first open the source window, and then bump up the
iteration limit so we can single-step past the problem. Click on Simulate →
Simulate Options → Defaults and change the iteration limit to 5020. The
extra 20 iterations should allow us to run just a little further.
4. Now go to the source window, and click on the “step” icon. The next line to
execute should be line 36 or 37. Step a few more times, and you’ll see the
simulator gets stuck on those two lines. Notice there is no delay on the and
gate or the inverter. You can also open the dataflow window at this point. It
ModelSim Advanced Debugging
December 2002
8-29
Debugging
will graphically show you what is going on. If you double-click on the
output signal of the ‘and’ gate in the dataflow window, you’ll see that it is
connected to the input of the ‘or’ gate. You can keep clicking on the
outputs, and the dataflow window will keep going in circles. You have
found the loop.
5. To fix it, modify the source code to add a delay to either the inverter or the
and gate. First you’ll have to make the source code editable by unchecking
the Edit → read only menu item.
6. Now add the delay to one of the two gates. For example, change the inverter
to be:
b <= not c after 100 ns;
7. Save the change by clicking the save button (the floppy drive symbol) in
the source window toolbar. Then click the compile button in the same
toolbar (the leftmost button).
8. After successfully recompiling, restart the design. Use the restart icon in the
main window toolbar or type “restart –f”.
9. Add all the signals in the entire design to the logfile. This will be useful in
the next section. The signals won’t appear in the wave window, but
ModelSim will capture all their values during this run.
Type add log –r /*
8-30
ModelSim Advanced Debugging
December 2002
Debugging
10. Run the design for 50 us.
PART 2: Logic Error Bug
1. In the Wave window, select View → Zoom → Zoom Range. Enter the
values 38us to 48us and Apply.
2. Select the total_value signal in the waveform view and right mouse click.
This will display a context sensitive menu. Select the Radix and set it to
unsigned. Notice that when the jack of hearts is dealt (look at the delt_card
and delt_suit signal), 20 is added to the total_value which is incorrect, as a
face card has a value of 10.
3. Choose View → All in the ModelSim Main window. This will bring all the
ModelSim windows to the foreground. Close the List window, since it
blocks the Wave window.
4. Drag and Drop the total_value signal in the waveform window into the
DataFlow window. This will display the signal driver in the Dataflow
window.
5. Double click on the total_value input signal in the out_convert block in
the Dataflow window. This will display the pr0 process.
6. Double click the total_card_value input to the pr0 process and then singleclick on the counter process in the Dataflow window. This will display the
Accumulator_error.vhd file and point to the counter process. This is the
process that sets the total_value value. On line 31 you can see that
total_value is incremented by 20 instead of 10.
7. Use the Edit menu in the Source window to uncheck “Read Only”.
Change the 20 to 10 and save the file.
8. Re-compile the accumulator.vhd file using the compile button.
9. Select Simulate → Run → Restart or type “!res” in the ModelSim Main
window; clicking Restart will save all settings. Run the design for 50 us
(Hint: type “!ru”) and verify a value of 10 is now added to the “total value”
signal when the jack of hearts is dealt around 44 us.
ModelSim Advanced Debugging
December 2002
8-31
Debugging
10. Type quit -sim to end the simulation.
PART 3: Simulation of Gate-Level Netlist
A powerful feature and often error-prone task is simulating the back-annotated
post Place & Route netlist in ModelSim. In this exercise, we will simulate a
VHDL RTL design, save a “golden” waveform result, and simulate the gate-level
VHDL post P & R netlist with its corresponding SDF timing file.
We will use a new design shown below called math.vhd for this exercise.
Our Design : math.vhd
CONSTANT w: POSITIVE := 8;
data_a[w-1:0]
mult.vhd
a[w-1:0]
a[w-1:w/2]
X
clock
reset
a[w/2-1:0]
p
Product[w-1:0]
clock
reset
adder.vhd
data_b[w-1:0]
a[w-1:w/2]
b[w-1:0]
clock
b[w-1:w/2]
a[w/2-1:0]
reset
b[w/2-1:0]
+
y
fsm.vhd
Sum[3:0] 8 state
data_out[2:0]
clock
reset
clock
reset
c[w-1:0]
fsm_out[2]
clock
reset
clock
reset
fsm_out[2:0]
fsm
+
sel
data_c[w-1:0]
add_out[w/2-1:0]
count.vhd
UpDn
Counter
count_out[w-1:0]
fsm_out[2]
increment.vhd
a[w-1:0]
b[w-1:0]
c[w-1:0]
alu.vhd
ALU
f[w-1:0]
Increment
s[w-1:0]
increment_out[w-1:0]
clock
reset
The VHDL source files and testbench for this design are located in the
labs/lab8/math/src directory. Take some time to review and understand the
operation of math.vhd and the six lower-level VHDL files.
1. Within ModelSim, change the directory to labs/lab8/math. After changing
the directory in ModelSim, type vlib work in the ModelSim Main window
8-32
ModelSim Advanced Debugging
December 2002
Debugging
to create the working library. Next, compile the design files (adder.vhd,
alu.vhd, count.vhd, fsm.vhd, increment.vhd, mult.vhd, and math.vhd) and
the testbench (math_tb.vhd).
2. Simulate the testbench and create a “golden” waveform results file,
gold.wlf.
ModelSim> vsim -wlf gold.wlf -t 100ps math_tb
VSIM> add wave /*
VSIM> run -all
VSIM> quit -sim
3. The post-P&R netlist contains VITAL library elements that need to be
compiled by ModelSim. We need to create an alt_vtl library and compile
the alt_vtl.vhd and alt_vtl.cmp VHDL files into this alt_vtl library. The
alt_vtl.vhd and alt_vtl.cmp files reside in the
labs/lab8/math/vhdl93/vital/v3_0 directory. Use the vcom -93 switch when
compiling these two files.
Now compile the post-P&R design, math.vho in ModelSim using the vcom
-93 switch. The .vho and .sdo files were generated from Altera’s
MAX+plus II tool targeting the ACEX EP1K50FC256-1 programmable
device. The math.vho and math.sdo files are located in the
labs/lab8/math/sdf directory. Recompile also the testbench math_tb.vhd.
4. Simulate the math_tb.vhd testbench with the SDF maximum timing switch
(-sdfmax). Make sure to properly specify the correct instance to apply to the
SDF file as you do so. Apply the simulator resolution of 100 ps because this
is the value the sdf file is using to annotate the timing. (See header section
of the math.sdo file).
vsim -wlf sim.wlf -t 100ps -sdfmax
/math_tb/t=./sdf/math.sdo math_tb
5. Open the ModelSim wave window, add all top-level signals from the
testbench math_tb.vhd.
6. Turn on the performance profiler profile on and run the simulation for 5.13
us
time {run 5.13 us}
ModelSim Advanced Debugging
December 2002
8-33
Debugging
How long was the ModelSim runtime for the gate-level SDF
simulation?____________
(Move the decimal point 6 places to get the number of seconds)
If all went correctly, you should be looking at a successful gate-level
VHDL post-P&R netlist simulation with its corresponding SDF timing file.
If you encountered errors, continue to debug. You most likely will have
trouble with your “vsim -sdfmax” command for ModelSim. Refer back to
the lecture notes for assistance.
Upon completion, do not close ModelSim. Continue on to Part 4.
Part 4: Waveform Comparison of RTL Simulation to
Gate-Level SDF Simulation (Optional)
Now we will perform a waveform comparison of the RTL simulation to the gatelevel SDF simulation. Instead of using the GUI, we want to use “compare”
commands from the command line within the ModelSim Main window. Refer
back to the lecture notes for assistance.
1. Open the “golden” waveform results file, gold.wlf.
2. Start the comparison between gold.wlf (gold) and the current open
waveform simulation (sim).
3. Compare the “product” and “count_out” outputs from the two datasets.
4. Run the comparison.
What is the medium propagation delay (difference) for the “product” output
between the two datasets? __________
What is the medium propagation delay (difference) for the “count_out”
output between the two datasets? __________
What is the propagation delay from “data_c” input equal ‘7’ to
“increment_out” output equal to ‘7’? __________
8-34
ModelSim Advanced Debugging
December 2002
Debugging
5. Let’s say that upon review of our design spec, I can tolerate a 6 ns pin-topin Tco for the “product” output and an 8 ns pin-to-pin Tco for the
“count_out” output. End the current waveform comparison (compare end)
and start a new comparison with trailing edge tolerance (-tolT) of 6 ns for
“product” and 8 ns for “count_out”.
We are only interested in trailing edge tolerances, due to the RTL
simulation being an edge-triggered functional simulation while the gatelevel post-P&R SDF simulation has timing and propagation delays
calculated in the paths and gates.
Disregarding the initial differences at t=0 when some bits are undefined,
were the differences in the “product” output filtered out? __________
Were the differences in the “count_out” filtered out? __________
Continue to examine the comparison of other outputs and different trailing
edge tolerances.
6. End the comparison when you are completed. Close the “gold” dataset and
quit the current simulation, but do not close ModelSim.
Part 5: Optimizing the Math Design (Optional)
Upon examination of the math.vhd design, hopefully you have spotted
opportunities to rewrite some of the VHDL in the lower-level modules to result in
faster simulation run times, synthesis into fewer gates, synthesis into faster
maximum frequency operation and less propagation delay, and simplification of
the VHDL code in general.
adder.vhd
Instead of using two adders and one multiplexor, rewrite
this module to use two multiplexors and one adder.
Adders are more expensive with regards to silicon gates/
area and have more propagation delay than multiplexors.
counter.vhd
Instead of using one adder, one subtractor, and one
multiplexor to control the updn direction control, rewrite
ModelSim Advanced Debugging
December 2002
8-35
Debugging
this module to use one adder and one multiplexer to
control the updn direction control. Adders/subtractors are
more expensive with respect to silicon gates/area and
have more propagation delay than multiplexers.
alu.vhd
Look carefully at this design and do the math. What is the
output “f” assigned? Synthesis tools typically do not
optimize arithmetic structure. Thus, you must be
very careful when writing any VHDL code that
includes any arithmetic operators. Rewrite this module to
simplify the output “f”.
mult.vhd
Instead of using the behavioral ‘*’ multiply operator, use
an LPM function. The use of LPMs (Library of
Parameterized Modules) or optimized macros may be required at times in order to achieve your desired performance and utilization.
increment.vhd
Instead of implementing this module with an
8-bit incrementer/counter (and a potential 8-bit multiplexer) feeding an 8-bit adder, rewrite this module to
guarantee the use of just one incrementer/counter and one
adder.
If time does not permit for rewriting the above VHDL files, reference the
math_opt.vhd design for the next part of this lab exercise.
Part 6: Simulation of Optimized RTL Design and SDF
Waveform Comparison (Optional)
Next we will perform RTL simulation on the math_opt.vhd design, create a
“golden” database for this new design, and then compare this “golden” database to
a gate-level SDF simulation.
The VHDL source files and test bench for this optimized design are located in the
labs/lab8/math/src directory. Take some time to review and understand the
operation of the re-written, optimized VHDL code for these five lower-level files.
8-36
ModelSim Advanced Debugging
December 2002
Debugging
adder_opt.vhd
Implemented as two multiplexers and one
adder.
count_opt.vhd
Implemented as one adder and one
multiplexer.
alu_opt.vhd
Simplified to a wire.
mult_opt.vhd
Uses an LPM multiplier instead of the
‘*’ operator.
increment_opt.vhd
Slight VHDL coding trick to simplify and
eliminate potential mux generation.
Complete the following steps (similar to Part 3 of this lab exercise) for the
optimized design.
1. The use of the LPM function lpm_mult in mult_opt.vhd requires the
compilation of the RTL simulation models for the LPM library. Within
ModelSim, you need to create an lpm library and compile the 220pack.vhd
and 220model.vhd VHDL files into this lpm library. The 220pack.vhd and
220model.vhd files reside in the labs/lab8/math/lpmsim directory. Use the
vcom -87 switch when compiling these two files.
The LPM library must be compiled before the design files and testbench are
compiled.
Compile the optimized design files (adder_opt.vhd, alu_opt.vhd,
count_opt.vhd, fsm.vhd, increment_opt.vhd, mult_opt.vhd, math_opt.vhd)
in ModelSim. Compile the testbench, math_opt_tb.vhd, after compiling all
the RTL design files.
2. Simulate the testbench and create the “golden” waveform results file,
gold_opt.wlf.
3. Compile the post-P&R design, math_opt.vho, with ModelSim using the
vcom -93 switch. The math_opt.vho and math_opt.sdo files are located in
ModelSim Advanced Debugging
December 2002
8-37
Debugging
the labs/lab8/math/sdf directory. Don’t forget about the VITAL library
elements.
4. Simulate (vsim) the math_opt_tb.vhd testbench with the SDF maximum
timing switch (-sdfmax) along with specifying the correct instance to apply
to the SDF file. Use the name sim_opt.wlf for the results fle.
5. Open the ModelSim wave window, add all top-level signals from the
testbench math_opt_tb.
6. Turn on the performance profiler profile on and run the simulation for 5.13
us.
time {run 5.13 us}
How long was the ModelSim runtime for the gate-level SDF simulation?
__________
(move the decimal point 6 places to get the number of seconds)
Is this runtime less than what you observed in the math.sdo design?
__________
How much slower or faster was the math_opt.vhd runtime vs. math.vhd?
__________
Now perform a waveform comparison (similar to Part 4 of this lab exercise)
of the RTL simulation to the gate-level SDF simulation.
7. Open the “golden” waveform results file, gold_opt.wlf.
8. Start the comparison between gold.wlf (gold) and the current open
waveform simulation (sim)
9. Compare the “product” and “count_out” outputs from the two datasets.
10. Run the comparison.
What is the medium propagation delay (difference) for the “product” output
between the two datasets? __________
8-38
ModelSim Advanced Debugging
December 2002
Debugging
What is the medium propagation delay (difference) for the “count_out”
output between the two datasets? __________
What is the propagation delay from “data_c” input equal ‘7’ to
“increment_out” output equal to ‘7’?
Is this propagation delay less than what you observed in the math.vhd
design? __________
Why or why not?______________________________________________
____________________________________________________________
11. End the comparison when you are completed. Close the gold_opt dataset
and quit the current simulation, but do not close ModelSim.
Part 7: Verilog Gate-Level SDF Simulation with a VHDL
Testbench
ModelSim offers the capability to do mixed language simulation. This could be
any mixture of VHDL and Verilog design files, testbenches, and libraries. Many
people like to use Verilog gate-level simulation due to faster runtimes vs. VHDL
gate-level simulations using VITAL models.
In this exercise we will examine the steps involved with this form of mixed
language simulation. We will use the VHDL testbench (math_opt_tb.vhd) with a
Verilog gate-level netlist (math_opt.vo), SDF timing file, (math_opt.sdo), and
Verilog UDP and cell primitives (alt_max2.vo). The .vo and .sdo files were
generated from Altera’s MAX+plus II tool targeting the ACEX EP1K50FC256-1
programmable device.
The post-P&R Verilog netlist contains Verilog cell library elements that need to
be compiled by ModelSim We need to create an altera library and compile the
alt_max2.vo file into this altera library. The alt_max2.vo file resides in the
labs/lab8/math/sdf directory and must be compiled before the design file and
testbench are compiled.
ModelSim Advanced Debugging
December 2002
8-39
Debugging
1. Create an altera library. Compile the Verilog gate-level cell primatives
(alt_max2.vo) into the altera library.
2. Create the work library. Compile the post P&R Verilog netlist
(math_opt.vo) into the work library. The math_opt.vo file is located in the
labs/lab8/math/sdf directory.
3. Compile the testbench (math_opt_tb.vhd) into the work library. The
math_opt_tb.vhd file is located in the labs/lab8/math/src directory.
4. Simulate (vsim) the testbench math_opt_tb with the SDF maximum
timing switch (-sdfmax) along with specifying the correct instance to apply
to the SDF file.
The SDF file (math_opt.sdo) is located in the labs/lab8/math/sdf directory.
You will need to specify search library paths (-L switches for the altera
library and the work library) to allow ModelSim to find the Verilog cell
primitives located in the altera library.
Also, it may be necessary to edit the post-P&R Verilog netlist
(math_opt.vo) depending on where the file resides and where the ModelSim
working directory is pointing. If math_opt.vo resides in the
labs/lab8/math/sdf directory and the ModelSim working directory points to
labs/lab8/math, then edit line 58 of math_opt.vo to read:
parameter SDFFILE = “sdf/math_opt.sdo”;
5. Open the ModelSim wave window, add all top-level signals from the
testbench math_opt_tb.
6. Turn on the performance profiler profile on and run the simulation for 5.13
us: time {run 5.13 us}
How long was the ModelSim runtime for the Verilog gate-level SDF
simulation? __________
(move the decimal point 6 places to get the number of seconds)
8-40
ModelSim Advanced Debugging
December 2002
Debugging
Is this runtime less than what you observed in the VHDL math_opt.sdo
design? __________
How much slower or faster was the Verilog runtime vs. VHDL?
__________
7. Quit the current simulation (quit -sim) when completed. Do not quit
ModelSim.
Part 8: Optimized Gate-Level SDF Simulation With a
VHDL Testbench
This exercise is identical to part 7 except we will compile the optimized Verilog
gate-level libraries (alt_max2.vo) with the vlog -fast switch.
When compiling Verilog gate-level designs, it is recommended to:
• Compile the cell library (alt_max2.vo) using -fast
• Compile the device under test (math_opt.vo) without -fast
• Compile the testbench (math_opt_tb.vhd) without -fast
• Create separate work directories for the cell library and the rest of the
design
Note: Do not follow this recommendation when the testbench has hierarchical
references in the cell library. Optimizing the library alone would result in
unresolved references. In such a case, compile the library, design and testbench
with -fast in one invocation of the compiler. The hierarchical reference cells are
then not optimized.
In this exercise, there are no hierarchical references in the testbench so we will
follow the above recommendations.
1. Compile the Verilog gate-level cell primatives (alt_max2.vo) into the
altera library using the -fast switch. Enable access to internal registers and
nets by using the +acc=rn switch with vlog.
ModelSim Advanced Debugging
December 2002
8-41
Debugging
The alt_max2.vo file resides in the labs/lab8/math/sdf directory.
2. Create the work library. Compile the post P&R Verilog netlist
(math_opt.vo) into the work library. The math_opt.vo file is located in the
labs/lab8/math/sdf directory.
3. Compile the testbench (math_opt_tb.vhd) into the work library. The
math_opt_tb.vhd file is located in the labs/lab8/math/src directory.
4. Simulate (vsim) the testbench math_opt_tb with the SDF maximum
timing switch (-sdfmax) along with specifying the correct instance to apply
to the SDF file.
The SDF file (math_opt.sdo) is located in the labs/lab8/math/sdf directory.
You will need to specify search library paths (-L switches for the altera
library and the work library) to allow ModelSim to find the Verilog cell
primitives located in the altera library.
5. Open the ModelSim wave window, add all top-level signals from the
testbench math_tb.
6. Turn on the performance profiler profile on and run the simulation for 5.13
us: time {run 5.13 us}
How long was the ModelSim runtime for the Verilog gate-level SDF
simulation? __________
(move the decimal point 6 places to get the number of seconds)
Is this runtime less than what you observed in the non-optimized Verilog
design? __________
How much slower or faster was the optimized Verilog runtime vs. nonoptimized Verilog? __________
7. Quit ModelSim when completed (quit -f).
8-42
ModelSim Advanced Debugging
December 2002
Debugging
Part 9: Batch Simulation With Elaboration File
In this exercise we will generate an elaboration file and use this file as source for a
batch simulation.
The ModelSim compiler generates a library format that is compatible across
platforms. This means the simulator can load your design on any supported
platform without having to recompile first. Though this architecture offers a
benefit, it also comes with a possible detriment: the simulator has to generate
platform-specific code every time you load your design. This impacts the speed
with which the design is loaded.
In many cases design loading time is not that important. For example, if you’re
doing "iterative design," where you simulate the design, modify the source,
recompile and resimulate, the load time is just a small part of the overall flow.
However, if your design is locked down and only the test vectors are modified
between runs, loading time may materially impact overall simulation time,
particularly for large designs loading SDF files.
1. Open a new UNIX Shell window or a Command Prompt on Windows.
2. Change the working directory to labs/lab8/math.
3. Create a new elaboration file using the following command at the shell
prompt:
vsim -elab math_opt_elab -t 100ps -sdfmax
/math_opt_tb/t=sdf/math_opt.sdo -L work -L altera
math_opt_tb
The -elab option generates a file math_opt_elab which contains the whole
elaborated design including all sdf information. Use the “ls -l” command or
Windows Explorer to check the size of the math_opt_elab file.
4. Start a batch simulation using the previously generated elaboration file:
vsim -c -load_elab math_opt_elab -do sim_elab.do
ModelSim Advanced Debugging
December 2002
8-43
Debugging
The sim_elab.do file contains the following commands:
add log /*
profile on
time {run 5.13 us}
profile off;
5. Is this runtime less than what you observed in the previous simulation using
the ModelSim GUI? __________
6. Open the vsim.wlf file with the -view option of vsim. Add all signals to the
wave window and look at the results.
7. Quit ModelSim when completed (quit -f).
Part 10: RTL Simulation and Changing VHDL Generics
From the Command Line (Optional)
Both the math.vhd and the math_opt.vhd designs were written with extensive use
of VHDL generics. Generics are very useful in VHDL designs to allow for quick
design changes, without the need to change parameter values throughout the
design hierarchy and in multiple design files.
Now let’s use ModelSim to assign the value of the generic “N” in counter_opt.vhd
during a RTL simulation.
1. Compile the optimized counter (count_opt.vhd) in ModelSim.
2. Simulate the counter_opt and assign the generic “N” with a value of 16.
Use the vsim -g<Name>=<Value> or -G<Name>=<Value> option.
The -g<Name>=<Value> option assigns a value to all specified VHDL
generics that have not received explicit values in generic maps and
instantiations. There is no space between -g and <Name>=<Value>
The -G<Name>=<Value> option will override generics that received
explicit values in generic maps and instantiations in the VHDL source files.
There is no space between -G and <Name>=<Value>
8-44
ModelSim Advanced Debugging
December 2002
Debugging
3. Set a few Force values to toggle the clock (clk), the active low reset (rst),
and the updn direction control (LO=count down, HI=count up).
4. Run the simulation for an adequate amount of time to test count up, count
down, and rollover.
5. Examine the /count_opt/q output in the ModelSim wave window and verify
that it is 16 bits.
6. Simulate counter_opt again and assign the generic “N” with a different
value.
ModelSim provides the capability to debug your code and exercise what-if
scenarios by changing the value of generics within ModelSim before going
back to the VHDL source files and updating the generic values.
7. Quit ModelSim when completed (quit -f).
Lab 8 Scripts
Part 3, step 1:labs/lab8/math/compile.do
Part 3, step 2:labs/lab8/math/sim_gold.do
Part 3, steps 3-6:labs/lab8/math/math_mp2_vhdl_gate.do
Part 4, steps 1-4:labs/lab8/math/part4_compare_1.do
Part 4, steps 5:labs/lab8/math/part4_compare_2.do
Part 4, steps 6:labs/lab8/math/part4_compare_3.do
Part 6, step 1:labs/lab8/math/compile_opt.do
Part 6, step 2:labs/lab8/math/sim_gold_opt.do
Part 6, steps 3-6:labs/lab8/math/math_opt_mp2_vhdl_gate.do
Part 6, steps 7-10:labs/lab8/math/part6_compare_1.do
ModelSim Advanced Debugging
December 2002
8-45
Debugging
Part 6, steps 11:labs/lab8/math/part6_compare_2.do
Part 7, steps 1-6:labs/lab8/math/math_opt_mp2_verilog_gate.do
(type quit -sim before going to next script)
Part 8, steps 1-6:labs/lab8/math/math_opt_mp2_verilog_gate_fast.do
(type quit -sim when done
Part 10, steps 1-4:labs/lab8/math/sim_generic.do
8-46
ModelSim Advanced Debugging
December 2002
Module 9
Debug Detective
Objectives
Upon completion of this module, you will be able to:
• Describe the primary functions of Debug Detective.
• List and describe block diagrams, state diagrams, and flow charts.
• Locate the descriptions of the Debug Detective GUI short cuts.
• Demonstrate the use of strokes within Debug Detective windows.
• Demonstrate opening Debug Detective parent and child design views.
• Add and remove signals to and from the ModelSim Wave and List
windows.
• Add and remove simulation probes.
• Report and manipulate breakpoints from Debug Detective windows.
• Run the simulator with Debug Detective capabilities active.
• Animate state diagrams.
ModelSim Advanced Debugging
December 2002
9-1
Debug Detective
Module Overview
Module Overview
In this module we will discuss:
♦ Debug Detective Design Analysis
♦ Debug Detective ModelSim
♦ Debug Detective Functions
♦ Debug Detective User Interface
♦ Simulation Toolbar
♦ Highlighting/Reporting Signal Information
♦ Adding/Removing Simulation Probes
♦ Manipulating/Reporting on Breakpoints
♦ Setting Simulator Environment
♦ Running the Simulator
♦ Restarting the Simulator
♦ Animating State Diagrams
9-2 • ModelSim® Advanced Debugging: Debug Detective Overview
Copyright © 2002 Mentor Graphics Corporation
Notes:
Debug Detective is an add-on product to ModelSim. If you are interested in
getting Debug Detective, please contact your sales representative.
9-2
ModelSim Advanced Debugging
December 2002
Debug Detective
Design Analysis
Design Analysis
♦ VHDL, Verilog & Mixed language capabilities
♦ Code comprehension for Re-use and Review
●
●
Design Navigation
Design Visualization
♦ Design Documentation
●
●
Creation
Maintenance
♦ Design Debug
●
●
●
Graphical rendering
Simulation control & cross-probing
Animation
9-3 • ModelSim® Advanced Debugging: Debug Detective Overview
Copyright © 2002 Mentor Graphics Corporation
Notes:
These capabilities exist to assist you in identifying the areas of the design that you
want to take a closer look at. The graphical representation is important because it
is easier to comprehend relationships of objects. It is much easier than
understanding relationships based on a textual representation. What the Debug
Detective capabilities provide is a way to render the graphics so that you see the
relationships graphically.
Graphical analysis includes generating graphical representations of your textbased designs, controlling the simulation from these graphical representations,
and animating state diagrams and flow charts. You can start or stop the simulation
and save information throughout your simulation from the graphical
representations. You can then replay and animate the state diagrams and flow
ModelSim Advanced Debugging
December 2002
9-3
Debug Detective
charts to view transitions. The states and transitions will change color as you step
through the simulation. The block diagrams will also show change in signal
values as different colors. The graphical representation and animation capabilities
of Debug Detective provide considerable debugging value.
9-4
ModelSim Advanced Debugging
December 2002
Debug Detective
Debug Detective Option for ModelSim
Debug Detective Option for ModelSim
♦ Focused on graphical debug of text-based designs.
♦ Available as ”snap-on” option to ModelSim
●
●
No impact on designer’s existing design flow
No save, print, export etc
♦ Also available with HDL Detective and HDL Designer Series
♦ Compliments ModelSim “dataflow” window
♦ Rapid on-the-fly graphical rendering for debug purposes
●
●
●
●
Block Diagram (Instances & Processes)
Interface Based Design (IBD)
State Machine
Flow Chart
♦ Simulation cross-probing / cross-referencing
♦ Animation
9-4 • ModelSim® Advanced Debugging: Debug Detective Overview
Copyright © 2002 Mentor Graphics Corporation
Notes:
There are four different representations — Block Diagrams, Interface Base
Design, State machines and Flow charts. Simulation cross probing is available
between the graphical representations, animation and the simulation environment.
ModelSim Advanced Debugging
December 2002
9-5
Debug Detective
Debug Detective Introduction
Debug Detective Introduction
♦ Diagrams rendered from ModelSim Source, Structure,
Workspace or Wave windows
♦ In memory rendering — No Save, Print, export etc. when using
“snap-on”
♦ Provides most existing
simulation cross-probing
and animation capabilities
♦ Control simulation from
Graphical view and
ModelSim directly
♦ Optionally specify diagram
type for each level
♦ Cross Probe to/from
ModelSim Windows
9-5 • ModelSim® Advanced Debugging: Debug Detective Overview
Copyright © 2002 Mentor Graphics Corporation
Notes:
Notice the different colored states that appear in the State Diagram window. This
is a result of animation and stepping through your simulation.
The block diagram will be discussed in more detail later in this module. Notice
that each of the windows of the graphic representation have additional control
buttons. These are to control the simulation and animation.
9-6
ModelSim Advanced Debugging
December 2002
Debug Detective
Debug Detective Functions
Debug Detective Functions
Source files &
Hierarchy
♦ Graphical generation of design
levels further aids
understanding of code
●
●
●
●
Block diagram
IBD
State machine
Flow chart
♦ Single level or hierarchical
♦ Block Diagram
●
●
Compact rendering
Improved Place & Route
IBD
Block
9-6 • ModelSim® Advanced Debugging: Debug Detective Overview
Copyright © 2002 Mentor Graphics Corporation
Notes:
This page displays examples of the graphical design aids that are available with
Debug Detective. Some of these windows and menus may only be available if you
have the full HDL Designer Series product. These screens display the graphical
block diagram and interface based design (IBD) spreadsheet representations of
your text-based design hierarchy. You can toggle between the IBD and the block
diagram. Each of the different types of objects are described in detail later in this
module.
ModelSim Advanced Debugging
December 2002
9-7
Debug Detective
Using Debug Detective
Using Debug Detective
♦ Choose your design from the ModelSim window and click on the
Show as Graphics button.
Or
♦ Select the View menu, click on Show as Graphic and choose
Block diagram.
Show As
Graphics
Button
9-7 • ModelSim® Advanced Debugging: Debug Detective Overview
Copyright © 2002 Mentor Graphics Corporation
Notes:
9-8
ModelSim Advanced Debugging
December 2002
Debug Detective
Block Diagrams
Block Diagrams
♦
♦
♦
♦
♦
♦
♦
♦
9-8 • ModelSim® Advanced Debugging: Debug Detective Overview
Block Diagrams
Traverse Hierarchy
Control simulation
Set Signal Breakpoints &
Probes
Add/Remove signals
to/from Wave, List, Log
Set environment
Object information
Simulation cross-probe
Copyright © 2002 Mentor Graphics Corporation
Notes:
Block diagrams are one of the most useful aspects of the Debug Detective. You
can traverse the hierarchy of a design graphically to view lower-levels as block
diagrams, state machine diagram, or truth tables. It is easy to traverse up and down
the hierarchies of the structure of your design.
Using the block diagram allows you to control the simulation. You can set signal
breakpoints, select signals and add probes to your block diagram along with
adding signals to the Wave or List windows. This let you control and monitor
object information from a graphical representation. You also have cross-probing
capabilities between the ModelSim windows and the graphical views.
ModelSim Advanced Debugging
December 2002
9-9
Debug Detective
Block Diagram Toolbar
Block Diagram Toolbar
1st select the signals
in the block diagram
Add Wave
Delete Wave
Highlight
Object
Add List
Delete List
Signal Info
Add Probe
Delete Probe
Delete All Probes
Show the value while
simulation proceeds
9-9 • ModelSim® Advanced Debugging: Debug Detective Overview
Copyright © 2002 Mentor Graphics Corporation
Notes:
Additional control capabilities for block diagrams include add wave, delete wave,
add list, and delete list. You also have the ability to explore signal information
and the ability to place the signal values or the signal states on the diagram itself.
9-10
ModelSim Advanced Debugging
December 2002
Debug Detective
Interface Based Design
Interface Based Design
♦ The IBD is an alternative view for block diagram. You can
switch from one to the other.
♦ The IBD was built on the block diagram data model which
means that most of the features of the block diagram editor
will be available in IBD.
♦ The tool preserves the full synchronization between both
views after editing.
Table → Show Block Diagram
Diagram → Show IBD
View as
Block Diagram
View
as IBD
9-10 • ModelSim® Advanced Debugging: Debug Detective Overview
Copyright © 2002 Mentor Graphics Corporation
Notes:
The interface based design, or IBD, is a tabular representation of a design. You
can toggle between the block diagram view and the IBD view. The IBD might be
a faster way to interpret the design, depending on the type of information you are
seeking.
ModelSim Advanced Debugging
December 2002
9-11
Debug Detective
Interface Based Design (Cont.)
Interface Based Design (Cont.)
Port/signal
order
Port/Signal
Names,
Types
Multiple
Tables
9-11 • ModelSim® Advanced Debugging: Debug Detective Overview
Blocks, IPs,
Components
Interconnect
IO Ports of
the Current
Design
Copyright © 2002 Mentor Graphics Corporation
Notes:
This tabular representation of a design lists:
• the I/O ports of the current design
• the port or signal order
• the port or signal names and types, plus any additional constraints
• whether the ports or signals are blocks, components, or reused IP and the
interconnect relationship
• whether you have multiple tables
9-12
ModelSim Advanced Debugging
December 2002
Debug Detective
State Diagram
State Diagram
♦ State Diagram
● Simulation Control
● Set Breakpoints
● Graphical Animation
● Graphical State Coverage
● Simulation cross-probe
♦ Simulation & Animation
Toolbars & Menus
9-12 • ModelSim® Advanced Debugging: Debug Detective Overview
Copyright © 2002 Mentor Graphics Corporation
Notes:
Most engineers are familiar with the state diagramming capabilities. You will
always have initial state and then you can multiple normal states. The
interconnects or the interfaces between those bubbles, you can define both
conditions and signal assignments. There are different ways that you can create
them. Either Mealy or Moore or a hybrids of Mealy and Moore machines. Also
you have priorities that you can attach to the interfaces.
Here this is what you will see as the result of rendering a graphic representation
from a state diagram or a state machine in your code. And, this would be post
animation. So you will see the colors change as we step through the results of the
analysis. You first have to run the analysis and save the results and then you can
step through an animation to help you determine what is going on within your
ModelSim Advanced Debugging
December 2002
9-13
Debug Detective
state machine. You have animation and simulation control within the state
diagram.
9-14
ModelSim Advanced Debugging
December 2002
Debug Detective
Flow Chart
Flow Chart
♦ Flow Chart
●
●
●
Simulation Control
Set Breakpoints
Simulation cross-probe
♦ Simulation & Animation
Toolbars & Menus
9-13 • ModelSim® Advanced Debugging: Debug Detective Overview
Copyright © 2002 Mentor Graphics Corporation
Notes:
Some people prefer flow charts. There are a lot of test benches implemented as
flow charts, so if you render your test bench as a diagram you will see a flow chart
by default. You also have simulation and animation control from within the flow
chart window.
Flow chart objects:
• Light blue square box: action box
• Dark blue square box with double border: hierarchical action box
• Yellow diamond: Decision box
ModelSim Advanced Debugging
December 2002
9-15
Debug Detective
• Red octagonal box: wait box
• Purple rounded rectangle: Start/End box
• Green oval: Start/end loop box
• Yellow polygon: start/end case box
9-16
ModelSim Advanced Debugging
December 2002
Debug Detective
Simulation Control
Simulation Control
Step
Restart Simulator
Step Over
Run to Next Event
Continue
Run Forever
Run For Time
These Simulator commands
are available from HDL Designer
9-14 • ModelSim® Advanced Debugging: Debug Detective Overview
Copyright © 2002 Mentor Graphics Corporation
Notes:
The simulation control bar in the Debug Detective windows is similar to the one
used within the ModelSim environment.
Each icon represents a function.
• Run for Time icon — used to run the design for a certain duration. If you
select Choose from the menu, a pop-up window will appear that allows you
to enter the run duration.
• Run Forever — runs the the entire design. Also known as the Run All icon.
ModelSim Advanced Debugging
December 2002
9-17
Debug Detective
• Run to Next Event — runs until the first break. To resume design
execution, click on the Continue icon.
• Step — single step through the design. To exit from a loop use the Step
Over icon.
• Restart Simulator — restarts the simulation.
9-18
ModelSim Advanced Debugging
December 2002
Debug Detective
Simulation Probes
Simulation Probes
Add a probe from the
Simulation menu
Add a probe from from the
Simulation toolbar
9-15 • ModelSim® Advanced Debugging: Debug Detective Overview
Copyright © 2002 Mentor Graphics Corporation
Notes:
You are able to select signals in the block diagram and assign probes to them.
This allows you to display signal values directly on the block diagram. There is
synchronization between the probes and the simulation environment. The probes
update and display the signal values based on the current selected time in the
simulation.
ModelSim Advanced Debugging
December 2002
9-19
Debug Detective
Breakpoints
Breakpoints
Set a breakpoint from the
Simulation menu
Set a breakpoint from the
Simulation menu
9-16 • ModelSim® Advanced Debugging: Debug Detective Overview
Copyright © 2002 Mentor Graphics Corporation
Notes:
You can control breakpoints and create breakpoints. The breakpoint(s) dialog box
allows the creation of conditional breakpoints.
9-20
ModelSim Advanced Debugging
December 2002
Debug Detective
Animation Menu and Toolbar
Animation Menu and Toolbar
Global Data Capture applies to
all instances in the current
simulation hierarchy
Global Capture options
not in the toolbar!
9-17 • ModelSim® Advanced Debugging: Debug Detective Overview
Copyright © 2002 Mentor Graphics Corporation
Notes:
Animation is a way to graphically represent the sequences of events through the
data flow and state diagrams. The objects in those diagrams will change colors to
show if they are active or if they have been executed. There are a variety of pull
down menu options and control buttons. First you need to capture a set of
simulation results and then run the animation as a post-process activity.
Animation can be controlled with the animation toolbar by using the buttons:
• Left double arrow: Step backward through animation history
• Right double arrow: Step forward through animation history
ModelSim Advanced Debugging
December 2002
9-21
Debug Detective
• Right arrow with circle: Sets view mode to step by states
• Right arrow with hourglass: Move to a specified simulation time
• Left arrow with line: Move to the start of simulation time
• Right arrow with line: Move to latest simulation time
The button on the right that looks like gears is the "Cause" button. It moves the
ModelSim Wave and List windows to the current animation time.
The rightmost button that looks like a broken chain is the "Link Diagrams" button.
It links all currently animated diagrams.
9-22
ModelSim Advanced Debugging
December 2002
Debug Detective
Animation Toolbar
Animation Toolbar
In Capture mode the
State Machine and
Flow Chart objects
become white to display
the simulation progress
Data Capture
Clear Captured Events
Activity Trails
Show Animation
Applies to all windows in
the current simulation
Control the animation activity
9-18 • ModelSim® Advanced Debugging: Debug Detective Overview
Copyright © 2002 Mentor Graphics Corporation
Notes:
You can control the activity trail by specifying a maximum number of events and
specified conditions for evaluation. This data will determine when it should be
evaluated. The active clock edges setting controls the animation activity based on
the clock timing.
When starting, leave everything in its default position, which is typically where
most people leave the settings. If you are already into your simulation process and
you know that your problems manifest themselves at, for instance, 300
microseconds down stream, then you can run just to that point. Start the activity
trail from that point for a fixed length and then capture that data set. Use the
camera icon to capture the data. This method should be a more efficient
mechanism for helping to identify your problem.
ModelSim Advanced Debugging
December 2002
9-23
Debug Detective
When you go back to view your diagram and look at the animation, you may see
some differences. Initially, there are no colors displayed. As you step through the
animation, you will see the changes in color.
9-24
ModelSim Advanced Debugging
December 2002
Debug Detective
Animation Activity Trail
Animation Activity Trail
Current
Activity Trails color code
Previous
9-19 • ModelSim® Advanced Debugging: Debug Detective Overview
Red
Yellow
Blue
: Current State / Box
: Previous State / Box
: Previously visited State / Box
Copyright © 2002 Mentor Graphics Corporation
Notes:
Here are the results of animation. Red indicates the current state. Yellow
indicates the immediate preceding state. Blue indicates all states that have been
visited during the animation capture time.
You are able to set breakpoints directly on the state machine diagram as well.
Click on the state diagram on the spot you want to add the breakpoint. A circle
will designate that a breakpoint has been added.
ModelSim Advanced Debugging
December 2002
9-25
Debug Detective
Summary
Summary
♦
♦
♦
♦
♦
♦
♦
♦
♦
♦
♦
Debug Detective Design Analysis
Debug Detective ModelSim
Debug Detective Functions
Debug Detective User Interface
Simulation Toolbar
Highlighting/Reporting Signal Information
Adding/Removing Simulation Probes
Manipulating/Reporting on Breakpoints
Running the Simulator
Restarting the Simulator
Animating State Diagrams
9-20 • ModelSim® Advanced Debugging: Debug Detective Overview
Copyright © 2002 Mentor Graphics Corporation
Notes:
9-26
ModelSim Advanced Debugging
December 2002
Debug Detective
Lab 9: Debug Detective Tutorial
(Optional Lab)
Introduction
Debug Detective provides the text based designer with the ability to visualize and
debug a chosen design under test. This gives the designer the ability to render
Block Diagrams, Interface Based Design (IBD), State Machine and Flow Chart
descriptions on the fly whilst simulating designs in the ModelSim simulator.
This exercise shows how to use Debug Detective from the ModelSim Simulator
and use HDL Designer Series (HDS) diagrams to drive simulation by adding
probing signals and breakpoints to a design. State Machines can also be animated
allowing you to visualize the dynamics of the state machine code.
Debug Detective can be used when a compiled HDL design unit is double-clicked
and loaded into a ModelSim project. The compiled design is then rendered in
Debug Detective allowing the user to show each design component graphically.
Directions
Invoke ModelSim
Start with one of the following:
• for UNIX at the shell prompt:
vsim
• for Windows - your option - from a Windows shortcut icon, from the
Start menu, or from a DOS prompt:
modelsim.exe
Project Files
The files that we will use in this lab are located at:
Windows: c:\labs\lab9\dd_tutorial_ref\uart_vhdl
Unix: /users/student/labs/lab9/dd_tutorial_ref/uart_vhdl/
ModelSim Advanced Debugging
December 2002
9-27
Debug Detective
Create a New Project
1. Select File > New > Project... from the menu. The Create Project dialog
box will appear.
2. Enter the following information into the Create Project dialog box.
Project Name: UART
Project Location:
Windows: c:\labs\lab9\dd_tutorial_ref\uart_vhdl
Unix: /users/student/labs/lab9/dd_tutorial_ref/uart_vhdl
Default Library Name: work
The message # Loading Project UART will appear in the ModelSim
window.
3. Click on Close in the Add items to the Project dialog box.
Create a New Library
1. Using the right mouse button (RMB), click in the Main window in the
library tab and select New > Library from the pop-up menu. The Create
a New Library dialog box will appear.
2. Select the map to an existing library button and enter the following
information into the Create a New Library dialog box.
Library Name: UART
Library Maps to: select work from the drop down menu pick
(PROMPT: vlib UART
vmap UART work)
3. Click the OK button.
9-28
ModelSim Advanced Debugging
December 2002
Debug Detective
Compile the HDL Files
To compile the HDL files run the following command from the ModelSim
simulator:
do compile.do
Load the Design
1. Expand the work library in the library tab of the Main window. Using the
left mouse button (LMB), double click on uart_tb. This will load the
design.
2. The ModelSim window now appears in Debug Detective mode. The
compiled design should now appear in the window on the sim tab in the
ModelSim window. Notice that the Show As Graphics
button
appears on the ModelSim toolbar. This button will enable you to view HDL
Designer Series (HDS) diagrams on the fly while simulating designs in the
ModelSim simulator.
Open a Block Diagram
1. Select uart_top design unit from the ModelSim sim tab window and click
the
button from the toolbar.
Two messages should now appear in the ModelSim window as the block
diagram opens for the first time:
HDS is starting up... Connected to HDS
The uart_top block diagram now appears directly underneath the ModelSim
window once a connection has been made to the Debug Detective.
The uart_top design consists of four components: address_decode,
cpu_interface, serial_interface and clock_divider.
ModelSim Advanced Debugging
December 2002
9-29
Debug Detective
For ModelSim v5.6 users on Solaris platforms:
Note
If you experience various items in the Block Diagram, Flow Chart,
State Machine, or IBD views being shown as all black, you may
need to set the Private Colour Map to restore the desired colors.
Set the Private Colour Map as follows:
1) From the ModelSim Main window, select Debug -> Options ->
Private Colour Map
2) Quit the current simulation and close ModelSim
3) Re-invoke ModelSim
4) You should now see desired colors for the Block Diagram,
Flow Chart, State Machine, & IBD views
2. You can identify the names of each of these components by dragging the
mouse to reveal information contained within each of the tool tips.
Alternatively, you can use the
button to enlarge the diagram and view
each of the components.
9-30
ModelSim Advanced Debugging
December 2002
Debug Detective
Once the diagram is opened from ModelSim an additional simulation
toolbar becomes available. This will enable you to support cross-probing
between the simulator and source design objects in Debug Detective.
i
Toolbars are normally displayed automatically at the bottom of the
diagram windows. However, they can be undocked, moved, docked or
hidden in the same way as the other toolbars in the HDL Designer Series
tools.
Add Probes to the Design
1. Make the uart_top block diagram active.
2. Choose Edit > Select All from the menu and select all of the signals on the
diagram. Finally, click the
button in the block diagram toolbar to add
probes to the design.
You will notice that the probes are added to the block diagram and they also
appear as a list in the ModelSim window.
i
You can use the shortcut Ctrl+A to select all of the signals in a block
diagram.
3. Add a wave window to the design by using the
button in the block
diagram toolbar. This will display all of the selected signals.
View and Monitor the Signals
Debug Detective allows you to monitor signal values as they change during
simulation. This can be achieved by using either the signals or the wave
window ModelSim.
1. Make the ModelSim window active and choose View > Signals from the
menu. The signals window will appear showing all the signals on the block
diagram.
The message view signals will appear in the ModelSim window.
ModelSim Advanced Debugging
December 2002
9-31
Debug Detective
2. Make the wave window active and notice that the same signals appear as
those previously shown in the signals window.
3. Make the uart_top block diagram active by clicking inside the window.
4. Select the clk_div_en signal.
Notice that when this signal is selected both the wave and the signals
windows now highlight the same signal. This allows you to monitor both
signal values as they change during simulation.
i
You can select multiple signals by using
+
dragging a box crossing the required signals.
mouse button or by
Add a Breakpoint and Run the Simulator
1. Make the uart_top block diagram active by clicking inside the window and
use the
button to zoom into the serial_interface component on the block
diagram.
2. Select the int signal and use the
button to add a breakpoint to the
diagram. Notice that a red circle appears on the int signal on the block
diagram.
For ModelSim v5.6 users on Solaris platforms:
Note
The Add Breakpoint
button will not set a breakpoint in the
serial_interface component on the block diagram. Instead, type the
following command in the ModelSim Main window:
when -id 1 -label hdsbp1 /uart_tb/i1/int stop
The “when -id ...” command will set the desired breakpoint,
although it may not display the breakpoint graphically as a red circle on
the int signal on the block diagram.
9-32
ModelSim Advanced Debugging
December 2002
Debug Detective
3. Run the simulator for the default timestep (100 nano-seconds) by using the
button or by choosing Simulation > Run > For Time from the menu in
the block diagram window.
Notice that the ModelSim window shows the message:
# Simulation stop requested
This indicates that a breakpoint has been set and that the simulator has been
stopped temporarily.
Notice that yellow boxes now appear on some of the signals on the block
diagram. These boxes indicate that no change has occurred to the value of
each of these signals.
4. Run the simulator until there are no more events scheduled by using the
button from the simulation tool bar or by choosing Simulation > Run >
Forever from the block diagram menu.
A change in value of the int signal from 0 to 1 occurs and now appears on
the block diagram.
Make the wave window active once more and notice that the same signal int
also shows the value 1. This corresponds to the signal shown on the block
diagram.
5. Make the uart_top block diagram active.
6. Use the
button from the Simulation toolbar or choose Simulation >
Display > Add List from the block diagram menu to add the selected
signals to a simulator list window. From the List window, notice that int
goes from ‘0’ to ‘1’ at 9750 ns.
i
You can optionally add signals to the simulation log without displaying
them in the Wave or List window by choosing Simulation > Display >
Add Log.
You can also open any other simulator window by choosing Simulation >
View from the menu. For example, you may wish to use this menu to open
the ModelSim Source or Structure windows.
ModelSim Advanced Debugging
December 2002
9-33
Debug Detective
Show IBD View
1. Make the uart_top block diagram active.
2. Double-click and open down into the serial_interface component. A block
diagram now appears showing two components: xmit_rcv_control and
status_registers.
3. Select the status_registers component and choose Diagram > Show IBD
from the menu.
The following IBD view appears:
Open a State Machine View
1. Make the IBD view active and select the xmit_rcv_control component
(column heading).
Choose Simulation > Environment > Selected from the menu.
9-34
ModelSim Advanced Debugging
December 2002
Debug Detective
2. Make ModelSim Main window active and click the
toolbar.
button on the
The following state machine diagram appears and a ModelSim source
window showing the state machine source code.
Animate the State Machine
1. Make the state diagram window active and resize the state diagram (if
necessary). Enable animation data capture by clicking on the
button and
ModelSim Advanced Debugging
December 2002
9-35
Debug Detective
notice that the state diagram is redrawn as an animation view with all the
colors drained except for the finish_xmit state which is now shown in red:
2. Run the simulator for the default timestep (100 nano-seconds) by using the
button or by choosing Simulation > Run > For Time in the state
diagram window.
9-36
ModelSim Advanced Debugging
December 2002
Debug Detective
Two states are now animated in the state diagram: The current state
(waiting_to_xmit) shown in red and the previous state (finish_xmit) shown
in yellow.
You can review a limited amount of animation in Debug Detective by using
the
and the
buttons to step through each state diagram object.
Open a Flow Chart
1. Make serial_interface block diagram active.
2. Select the status_registers component and choose Open As > Flow Chart
with the RMB. A Flow Chart diagram will appear as shown in the diagram
below:
ModelSim Advanced Debugging
December 2002
9-37
Debug Detective
3. Close the project you have been working on by choosing File > Close >
Project from the ModelSim Main window.
4. Exit the ModelSim simulator by choosing File > Quit from the ModelSim
Main window.
For the latest information about Debug Detective, see the web site at:
http://www.debugdetective.com
For the latest information about HDL Designer Series, see the web site at:
http://www.hdldesigner.com
For customer support contact:
[email protected]
9-38
ModelSim Advanced Debugging
December 2002
NOTES:
ModelSim Advanced Debugging
December 2002
Part Number: 069776