1
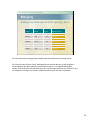
Welcome to Data Academy. Data Academy is a series of online training modules to help Ryan White Grantees be more proficient in collecting, storing, and sharing their data. Let’s get started with the module “Getting Data from Existing Sources.”
1
Collecting Data from Existing Sources
This module, Getting Data from Existing Sources, will explain how to identify and access data from existing data sources. We’ll also show you the basics of getting, or extracting, electronic data, and how to combine data from multiple electronic sources for reporting and other program activities. 2
Learning Objectives
By the end of this module, you will be able to…
•
•
•
•
Explain how collecting electronic data from existing sources can help meet your data needs
Describe strategies to identify existing electronic data sources
Discuss strategies to access data from existing sources
Understand basic information about how electronic data can be moved from one data source to another
By the end of this module you will be able to:
•
Explain how collecting electronic data from existing sources can help meet your data needs,
•
Describe strategies to identify existing electronic data sources,
•
Discuss strategies to access data from existing sources, and
•
Understand basic information about how electronic data can be moved from one data source to another. This module is not a how‐to guide for extracting data. Rather, it is designed to help you
think about where the data you need is stored, how to look for that data, and how to help program administrators, clinical staff, project managers and data analysts talk to each other about what data they need, and how to get it.
3
Why use existing sources? •
•
•
•
Identify data you need to report to HRSA Identify data for other program needs
Save time
May reduce data entry errors
Often, the data you need are already being collected. A review of existing sources, such as electronic medical records or laboratory software, may help you identify some or all the data you need to report to HRSA, the Health Resources and Services Administration, and for your other program needs. Similarly, your own program data may be in more than one database or spreadsheet.
If the data you need are already available in an existing database or software program, you won’t need to gather the information again or enter it from paper forms. This saves time, and may reduce data entry errors because data are only entered once. 4
Why use existing sources? RSR requires client CD4 test results and visit RSR requires client CD4 test results and visit dates from all Ryan White medical providers
dates from all Ryan White medical providers
You enter the data into your database from You enter the data into your database from paper laboratory results
paper laboratory results
The laboratory has this data electronically…and The laboratory has this data electronically…and will share it with you for RSR reporting!
will share it with you for RSR reporting!
Consider the following example. We know that the Ryan White Services Report, or RSR requires medical providers to report all CD4 tests and their associated visit dates. Let’s assume your program receives paper copies of laboratory reports for each test, and then you enter the data into your HIV client database. These paper lab results are easy to access because they are sent directly to your clinic. However, the lab is already collecting all of your clients’ CD4 test results and visit dates in their database. After talking with the lab you learn that their data is in a format that will allow you to easily report data that will meet the requirements of the RSR. Using the lab’s data not only saves you from finding and re‐entering data from paper forms, it may also be more complete and accurate.
5
Where do you start? Four questions to help you identify,
request, and extract data:
1. What will you use the data for?
2. Where can you look for the data you need? 3. How do you request the data?
4. What electronic format(s) will meet your needs?
Here are four questions to help you identify, request and extract data from existing sources:
•First, what will you use the data for? In other words, what questions are you trying to answer?
•Second, where can you look for the data you need? •Third, how do you request the data? and
•Finally, what electronic format(s) will meet your needs?
The rest of this module will show you how to answer these questions. You will learn to identify and request data from existing sources, and you’ll understand the importance of getting your electronic data in a format that meets your program’s needs.
6
What Will the Data be Used For?
Before you begin to think about where to find data and how to request it, you need to consider how it will be used. Think about the end product. Will the data be used to answer a specific question about your program, such as how many clients receive a particular service? Will it be reported to HRSA? Stay focused on the end use. This will help you figure out whether or not data from a particular source will meet your needs.
7
What do you need data for? Reporting
•
•
Review reporting requirements and compare with the data you need.
For every required variable:
• Do you have electronic data? Can you use it for reporting?
• Are there other electronic data sets? Will they meet the requirements?
What are some specific ways to use data? First, you need data to meet reporting requirements for the RSR, and for other funders. Review these requirements in detail, and compare them with the data you already collect. For every variable, or data element, consider these questions: Do you already have any electronic data for this requirement? Can you use your electronic data to meet this reporting requirement? Are there other electronic data sets that contain that data? If so, can these other data sets be used to meet your reporting requirements?
8
What do you need data for? Program improvement and decision‐making
•
•
Can you get what you need from your electronic data?
Where else can you look?
Your organization also needs data for program improvement and decision‐making purposes. Consider the individual reports, presentations and program management tools your program prepares each year. Chances are you’re already collecting a lot of the data you need for program management, planning and allocations, and quality monitoring. Can you get what you need from your electronic data? If not, where else might it be located?
9
Where can you look for the data you need?
If the data you need for reporting are already collected somewhere else, how do you find them? Where do you look? 10
Possible Data Sources
List internal and external data sources
•
Within your Ryan White Program
•
•
•
State or vendor system “Home‐grown” system
Within your larger institution
• Laboratory data system
• Electronic medical record (EMR)
•
Outside your institution
• Data from contracted service providers or vendors
Make a list of the different data sources where your clients’ data may be located. Consider both internal and external sources. Start by looking within your Ryan White program. Many grantees and providers use state or vendor‐developed client management software to collect and report data. For example, you may be required to use specific software, like CareWARE, ARIES, or Lab Tracker, by your state or local jurisdiction, or you may choose to use one of these systems. You may have developed a home‐grown system in Access or even Excel, to manage some or all of your client data. If your program is part of a larger institution, such as a hospital or a health department, look for other data sources outside of your program, but within your institution. For example, if you are a direct service provider in a hospital, you may be able to look in a laboratory database for information about the types of tests administered, as well as test dates. Similarly, data from a hospital Electronic Medical Record may help you capture the number of client visits for a particular Ryan White service category. You may find helpful information outside your institution. For example, valuable data may be collected for your program by contracted service providers or vendors. 11
Review Data Sources
Request existing documentation
•
•
Existing documentation Other available information
Source: RSR Data Dictionary Version 1.3
Now that you have created a list of where to look, determine what data elements are stored in each database or captured in the software. For each of the data sources you are considering, find out if there is an existing data dictionary, codebook, user manual or other written document to help you understand how the data elements were set up. This kind of information is often referred to as documentation. 12
Review Data Sources
Client Level Data
Request existing documentation
Other available information
ID
Variable Name
•
5
EthnicityID
•
•
Definition
Required
Occurrence
Allowed Values
Schema
Client’s ethnicity.
Yes
1 per client
EthnicityID:
1 = Hispanic/Latino
2 = Non-Hispanic/Latino
3 = Unknown
<ClientReport CLD_ID="1"/>
<EthnicityID>1-3</EthnicityID>
</ClientReport>
Client’s race.
Yes
1-5 per client
RaceID:
1 = White
2 = Black or African
American
3 = Asian
4 = Native
Hawaiian/Pacific Islander
5 = American Indian or
Alaska Native
6 = Unknown
Within the following schema section, multiple
RaceIDs may be reported
<ClientReportRace CLD_ID="1">
<RaceID>1-6</RaceID>
…
<RaceID>1-6</RaceID>
</ClientReportRace>
Client’s current
gender.
Yes
1 per client
GenderID:
1 = Male
2 = Female
3 = Transgender
4 = Unknown
<ClientReport CLD_ID="1"/>
<GenderID>1-4</GenderID>
</ClientReport>
Captured exactly as you need it OR allow Existing documentation you to calculate what you need
Other available information
Make sure the source includes data from the time period you need.
6
RaceID
7
GenderID
Source: RSR Data Dictionary Version 1.3
Let’s take the RSR as an example The RSR data dictionary provides the variable name, definition, whether it is required, and what the allowed values – or response options are for each data element or variable. We will talk more about what these terms mean later in the module.
If you can’t find formal documentation, ask for any available information ‐ such as a simple list of data elements and response options and any data collection forms. If no written documentation is available, you may have to spend time learning about and exploring the data source to determine what is being collected. 13
Review Data Sources
Other available information
•
•
Captured exactly as you need it OR allow you to calculate what you need
Make sure the source includes data from the time period you need.
Source: RSR Data Dictionary Version 1.3
Compare the data you need with what’s available from each individual source. The data from this new source should either be captured exactly as you need it, or you should be able to use the data to calculate what you need.
If you need data from a specific time period, make sure that the source you are considering includes those months, quarters or years.
14
How Do You Request the Data?
Now that you have identified the source of the data you need, how do you request the data? 15
Requesting Data •
•
•
Internal requests are usually less formal External requests may require a data sharing agreement See module
See module
See module
See module
Clearly explain:
“Ensuring the “Building Data “Ensuring the “Building Data •
•
•
•
Security of Your Partnerships with Staff Security of Your When you need the data Partnerships with Staff and Contractors”
and Contractors”
Clients’
Clients’ Data”
Data”
What data you need
What kind of electronic file you will need
How the data will be transmitted The details of your data request will depend on whether it comes from within your organization or not.
Asking for data from within your organization is usually a more informal process, because your organization already owns the data.
There are a number of ways to request data from another organization. If there is an existing partnership, you may have a general data sharing agreement in place. If not, you may want a legally binding contract, or it may be enough to document your data needs in a written data use agreement or memorandum of understanding. Consider legal and organizational data sharing regulations to determine what type of agreement is appropriate. To learn more about creating successful data sharing relationships, see the Data Academy module, Building Data Partnerships with Staff and Contractors.
Regardless of who you are requesting data from, provide a clear explanation of what data you are asking for. Document the details of when you’ll need the data, exactly what data you need, and what kind of electronic data file, or data extract, you will need to receive. We’ll talk more about data extracts in just a minute. You may also want to include details about how the data should be transmitted. To learn more about transmitting data, see our module, Ensuring the Security of Your Clients’ Data.
If you have an existing data sharing agreement, make sure that this agreement is revised to include new dates, data elements, file format requirements and details about how the data will be transmitted. 16
What is a Data Extract?
So far we’ve talked about where to look for and how to request the data you need. Next, the requested data will be pulled, or extracted, from their current database or software, and provided to you electronically. This file is called a data extract. 17
Data Extraction Basics
Understanding the basics can help you:
•
•
•
•
Talk with data sharing partners
Communicate with programmers and analysts
Get help creating reports and meeting your data needs
Two types of data extracts
•
•
Canned reports
Raw data extracts
Even if you are not extracting the data yourself, understanding the basics of data extraction will help you talk with your data sharing partners, as well as your own programmer or data analyst, about what data you need and in what format. They can also help you determine how to work with the data extract to create reports and meet your other data needs.
We’ll begin by talking about two types of data extracts: canned reports and raw data extracts.
18
Canned Reports •
•
•
•
•
•
Easy to read summary
Client‐level or aggregate Helpful if you need the same information regularly
Not for additional analysis May come with your data system Can be customized for your program
One common format for data extracts is an automated or canned report. Canned reports are typically easy‐to‐read data tables or charts, designed to give you a summary of data about your client population, or about the progress of an individual client. Canned reports can present client level or aggregate data. They are particularly helpful when you need to see the same information, summarized in the same way, on a regular basis. Canned reports can provide you with specific information, but are not designed do to any further data analysis. You may be able to specify certain information before you run a canned report – for example, you may be able to choose the time period, or date range, for the report, or you may be able to select which programs or sites are included in the report.
If you purchased your data system, it may include some built‐in canned reports. Customized reports can also be programmed to meet your specific needs. 19
Canned Reports Pros and Cons
•
•
•
Quick and easy reports when you need them
May not meet all your needs
Time and resources to build or customize reports
Why would you want to use canned reports? Not only are they easy to run with very basic training, but they can also be run whenever you need data, as long as data entry is up to date.
Canned reports have their limitations and may not meet all your data needs. Perhaps they don’t include all the data elements you need to answer a particular question. Or, maybe they don’t divide your clients into specific sub‐populations. It takes time and resources to create new canned reports or to customize those that came built‐in to your system. 20
Types of Raw Data Extracts Electronic raw data or source data
•
•
•
•
•
•
More flexibility
Move data between data sources
Combine data from multiple sources
Extract in a variety of formats
Required for RSR data submission Often included in vendor systems
If you need data for more detailed operations, you may need to extract raw data from your database or software. Raw data, also known as source data, is useful because of its flexibility. It has been collected, but it has not yet been processed or analyzed. In other words, it’s not in a presentable form. Raw data can be extracted in a variety of electronic formats ‐ we’ll show you some examples in a few minutes.
By extracting raw data, you – or your programmer or data analyst ‐ can move electronic data from one data source into another data source so that the data can be analyzed and reported to meet your needs and specifications.
Using data extraction, you can also combine data from two or more sources so that all of the data on each of your clients is in one place. This will allow you to report data on your entire client population. Raw data can be extracted from a variety of different electronic formats. This is particularly important for data reporting. For example, HAB requires that RSR data be submitted in a specific raw data format called extensible markup language, or XML so that they can combine Ryan White grantees data and understand how services are delivered across the country. Many common vendor systems now include a feature to help programs generate raw data extract files for RSR reporting. 21
Types of Raw Data Extracts Manual chart or record extraction
•
•
•
Find and transfer data one record at a time
Time consuming for more than a few records
Helpful for targeted reviews and studies
Not all data extraction is electronic. It is possible to extract raw data manually from a paper chart or an electronic file. This process is called manual chart or record extraction. Manual chart extraction involves looking at an individual’s paper or electronic record ‐ and transferring this information, one record at a time, onto a paper log or into another database or software. Your RSR report needs to include all clients receiving Ryan White funded services, so unless you have a very small program, manual chart extraction is probably not feasible for RSR reporting. Instead, chart extraction is often used when specific information is needed for a sample of clients. This can be particularly helpful for targeted quality improvement studies. 22
What Does a Raw Data Extract Look Like? What does a raw data extract look like? We’ve mentioned that raw data extracts don’t always look the same – but they do include some common characteristics. Let’s take a look at the components of raw data extracts.
23
Records ClientID
GenderID
CD4 Test Date
CD4 Count
TV12345
1 (Male)
09/20/2007
528
OH23456
2 (Female)
11/05/2006
992
ZZ58585
3 (Transgender)
10/02/06
679
AA36363
1 (Male)
02/11/03
398
•
•
Information about individual clients is separated into records
In this example, each record is a row
For client‐level data, information about individual clients is separated into records.
Many raw data extracts are made up of rows. In more basic data extracts, such as spreadsheets, each record is one row. Next, let’s discuss client identifiers. 24
Client Identifiers •
•
ClientID
GenderID
CD4 Test Date
CD4 Count
TV12345
1 (Male)
09/20/2007
528
OH23456
2 (Female)
11/05/2006
992
ZZ58585
3 (Transgender)
10/02/2006
679
AA36363
1 (Male)
02/11/2003
398
Reduces duplication
For HAB reporting, Unique Client Identifier (UCI) is required
www.careacttarget.org
In a raw data extract, a client identifier or client ID tells you which client’s data is contained in the record.
Client IDs can be made up of letters, numbers, or both. One of the most important purposes of the Client ID is to reduce duplication. For example, even if two clients have the same name, you can keep their data separate by using the Client ID – instead of a name.
By reducing duplication, you will have a better idea of how many clients you are really serving. Your data will be more accurate for reporting, and you will be able to rely on your data as you plan for service delivery. When you report your client data to HAB, you will need to use a specified format for the Client ID called the UCI, or unique client identifier. Visit the TARGET Center website to learn more about the UCI format, and about RSR reporting.
25
Data Elements
ClientID
GenderID
CD4 Test Date
CD4 Count
TV12345
Male
09/20/2007
528
OH23456
Female
11/05/2006
992
ZZ58585
ZZ58585
Transgender
Transgender
10/02/06
10/02/2006
679
679
AA36363
AA36363
Male
Male
02/11/03
02/11/2003
398
398
•
•
Data elements are the units of information collected on your clients
In this example, data elements are organized into columns
Every data extract will contain information about one or more data elements. Sometimes called variables or fields, data elements are the units of information collected on your clients. In basic data extracts such as spreadsheets, data elements are organized in columns.
Gender is an example of a data element. In the RSR the variable name for gender is GenderID. As you can see in the highlighted column, the top row tells you that that the column contains information about gender. This top row is often called the header row. Data on the gender of each client will be located in this column. You can find the gender for a particular client by looking for his or her client ID, and then following that row over to the “gender” column.
26
Values
ClientID
GenderID
CD4 Test Date
CD4 Count
TV12345
1 (Male)
09/20/2007
528
MG45236
1 (Male)
05/01/2005
300
ZZ58585
3 (Transgender)
10/02/2006
679
OH23456
2 (Female)
11/05/2006
992
GW45204
4 (Unknown)
05/23/2009
345
RW79843
2 (Female)
07/13/2009
1100
AA36363
1 (Male)
02/11/2003
398
•
•
•
Data recorded in each cell is a value
Values are used for more efficient storage
Values correspond to each possible answer
Each of the data elements in your data extract contains specific information. That information is called a value. If you think of each data element as a question, the value is how the answer is stored in your database or software. In other words, each value represents a response option. Values are often numbers, but can also include letters. Values are used instead of full text for more efficient data storage.
As we’ve discussed, the data element is shown in the top row for each column. In this example, the data element, or question is “What is the client’s gender?” The answer can be female, male, transgender, or unknown. In the RSR, there is another data element called TransgenderID that captures whether transgender clients are transgender male to female, or transgender female to male. In databases, a value is assigned to each possible answer. In the case of gender in the RSR, the values are 1 for male, 2 for female, 3 for transgender, and 4 for unknown. 27
Record Identifiers One record per client
ClientID
Date of Birth
Gender
TV12345
08/12/1975
1 (Male)
OH23456
02/26/1956
2 (Female)
ZZ58585
10/25/1947
3 (Transgender)
AA36363
01/18/1981
1 (Male)
We’ve already talked about how a Client ID can help you tell one client’s record from another client’s record. A record ID, or record identifier allows you tell one record from another.
For information that is collected only once per client – such as gender or date of birth –
data can be stored in a single record. In such cases, each client only needs one record, and the Client ID can be used as a record identifier. 28
Record Identifiers More than one record for a single client
ClientID
Visit
DateDate
of Birth
CD4 Test Date
Gender
CD4 Count
TV12345
06/03/2006
08/12/1975
06/03/2006
1
(Male)
825
TV12345
OH23456
10/22/2006
02/26/1956
10/22/2006
2
(Female)
853
TV12345
ZZ58585
04/25/2007
10/25/1947
04/25/2007
3
(Transgender)
658
ZZ58585
AA36363
02/23/06
01/18/1981
02/23/06
1
(Male)
300
AA36363
08/16/07
08/16/07
723
TV12345
09/20/2007
09/20/2007
528
Can be one data element or based on a combination of data elements Other data elements are collected multiple times for a single client. For example, let’s say that a client has a CD4 test on June third, showing a CD4 count of 825 and another on October 22, showing a CD4 count of 853. Information about these two tests will be stored in two separate records. In this case, because multiple records are associated with each client, the client ID alone cannot be used as the record ID. Record IDs can be based on a combination of existing data elements, or can be automatically generated in a database. In this example, the record identifier is based on a combination of the Client ID and the visit date, allowing you to keep track of all the visits by a single client. 29
Data Extract Formats Data extracts can be in a variety of formats
•
•
•
Almost all data extracts can be translated or made to “talk to each other”
Each format has strengths and weaknesses
Format should meet your needs
Common formats
•
•
•
Text files
Spreadsheets
XML files
We’ve mentioned that data extracts can be created in a variety of formats. You’ll want to make sure that your program data and any data you request are in an electronic format that will meet your needs.
In many cases, data can move seamlessly between software applications. With the right software and technical skills, almost all data extracts can be translated, or made to “talk to each other.”
Each data extraction format has strengths and weaknesses. Before you request data, determine which format will be flexible enough to meet your needs. For example, the format of the data should be compatible with the software you will be using to process the data. Let’s take a look at three common file formats for data extraction: text files, spreadsheets, and XML files.
30
Text File
•
•
•
Each row is a record
Compatible with any
software program
Fixed or delimited
Example: Fixed Text File
CLD_ID CD4 Count
CD4 ServiceDate
1
22001,01,2008
1
32002,01,2008
2
22001,01,2008
2
32002,01,2008
Example: Delimited Text File
CLD_ID,CD4 Count,
CD4 ServiceDate
1,220,"01,01,2008"
1,320,"02,01,2008"
2,220,"01,01,2008"
2,320,"02,01,2008"
Here’s an example of a text file. As we’ve discussed ‐ each row is one record.
One of the advantages of a text file is that it is compatible with any software program. Regardless of the version you are using, your software will be able to read simple text files.
There are two common formats for text files: fixed and delimited. This first example is a fixed text file. You can visually distinguish between the different data elements because they are organized by column.
The second example is a delimited text file. Notice that there is still one row for each record, but the data elements are not separated into columns. Instead, each data element is separated by a tab or by a particular character such as a colon – or, in this example, a comma. Here – in both examples ‐ you can see the values for three different fields: client ID, CD4 count – or test result – and the service date for each CD4 test. This example includes data for two separate clients, and includes two sets of test results for each client.
31
Spreadsheet •
•
•
•
Easy to work with
Easy to look at the data
Sort and analyze data
Useful for creating charts and graphs
Here is how your data might appear in a spreadsheet. You may have heard of, or used, Microsoft Excel. Excel is a spreadsheet program that is widely used to create data extracts.
In this example you can see the values for three different fields as they might appear in a spreadsheet. Here are the client IDs, the CD4 counts, and the service date for each of the CD4 tests.
Of all the data extract file formats, spreadsheets are the easiest to work with and to look at. Spreadsheets can be used to sort and analyze your data. They can tell you how many records you have, or what values you have for a particular data element. Spreadsheets are also useful for creating charts and graphs.
32
XML File •
•
•
•
•
XML = eXtensible Markup Language
Standard, simple and widely adopted method
Exchange across platforms, languages, and applications
Maintain structure and format of your data set
Required by HRSA/HAB for RSR submission
Another common format for data extraction is XML. XML is a type of file format that is written in extensible markup language.
XML is a standard, simple, and widely adopted method of formatting text and data so that it can be exchanged across all of the different computer platforms, languages, and applications.
XML files allow you to maintain the details of how the data should be organized and are often used for transmitting data. Starting in 2009, you will use XML to submit your RSR data to HAB.
33
XML File Data look a bit different in XML. Here’s how the same data from the previous examples might look in XML. As you can see, XML is not set up with rows or columns, but all the information for each client is stored together. This example shows CD4 counts and service dates for two different clients. Take a look at the client ID for each client, their CD4 counts, and the service date for each CD4 test.
34
Combining Data Sets
Two ways to combine data sets
•
•
Merging
Appending (also called concatenating)
Combine data elements from two or more sources
As we’ve discussed, you may find that the data you need are located in more than one data source. Perhaps data from a laboratory report is in a separate database – and you need to combine this information with the rest of your clients’ data.
There are two ways to combine data sets: merging and appending or concatenating. Both processes involve taking two or more data sets and combining them into one. 35
Merging
Adding new data elements for existing clients
Client ID
GenderID
BirthYear
MedicalInsuranceID
TV12345
1 (Male)
1956
3 (Medicaid)
MG45236
1 (Male)
1974
2 (Medicare)
ZZ58585
3 (Transgender)
1963
1 (Private)
OH23456
2 (Female)
1940
4 (Other Public)
GW45204
4 (Unknown)
1982
7 (Unknown)
RW79843
2 (Female)
1985
3 (Medicaid)
AA36363
1 (Male)
1998
3 (Medicaid)
For most client data, merging means adding new data elements for existing clients. Let’s say that most of your clients’ demographic and service data are in your program’s client database. But their medical insurance information is in a separate billing data system. As long as both of these data sets use a common data element, like a client ID, you can combine, or merge, your clients’ medical insurance with the rest of their data.
36
Appending Data Combining records from two or more data sets
RecordID
SiteID
CounselorSatisf
PersonalProgress
Recommend
206
1 (First Avenue Clinic)
1 (Very Satisfied)
3 (Somewhat Unsatisfied)
1 (Yes)
197
1 (First Avenue Clinic)
2 (Somewhat Satisfied)
1 (Very Satisfied)
1 (Yes)
002
1 (First Avenue Clinic)
2 (Somewhat Satisfied)
2 (Somewhat Satisfied)
1 (Yes)
056
2 (Main Street Clinic)
1 (Very Satisfied)
1 (Very Satisfied)
1 (Yes)
067
2 (Main Street Clinic)
4 (Very Unsatisfied)
1 (Very Satisfied)
2 (No)
128
2 (Main Street Clinic)
2 (Somewhat Satisfied)
2 (Somewhat Satisfied)
1 (Yes)
085
2 (Main Street Clinic)
1 (Very Satisfied)
1 (Very Satisfied)
1 (Yes)
Another way to combine data sets is to append, or concatenate the data. This process involves combining records from two or more datasets into a single dataset. This new data set contains all of the records from both of the original data sets. When you append data, it’s best if all of the data elements are the same across your data sets. However appending is possible with datasets that do not have identical data elements, as long as there is some overlap. Let’s say your organization funds six programs to provide case management services. Each year you ask these programs to administer an anonymous satisfaction survey to their clients. After collecting the data, each organization enters their client surveys into a spreadsheet that you have prepared and the results are electronically submitted to you.
When you receive the spreadsheets you copy and paste the records from each program into one file. By adding all the data from these satisfaction survey spreadsheets together, you have appended your data set. Now you can look at client satisfaction across all of your funded programs.
Appending also applies to adding new clients or sites to your existing database. Again, all the same data elements are collected, but you are adding, or appending new records.
Remember, the purpose of this module is not to learn how to merge or append your data. Rather, by understanding these concepts and definitions you will be able to talk with program administrators, clinical staff, project managers, and data programmers about what data they need and how to get it. Now let’s talk a little more about what needs to be in place for combining data sets.
37
Combining Data Sets
1. Is your Record ID formatted the same in both data sets?
2. Do your values line up? •
•
Merge: line up the data elements you merge on
Append: line up all data elements
When combining data sets, you need to make sure that your data elements will link up correctly. Before you merge or append data sets, ask yourself these three important questions.
Is your Record Identifier formatted the same in both data sets? As we’ve discussed, the Record ID is the data element, or combination of data elements, that allows you to distinguish between records. If your record ID is formatted the same in both data sets, you can add new variables for existing clients. This means that your record IDs must have the same number of characters in both data sets, and must be formatted in the same way –
either text or numeric.
Do your values line up?
As we’ve discussed, values are the possible response options for a particular data element. Before you combine data sets, look carefully to make sure that the values have been assigned consistently for any data elements that they have in common. Lining up values is a little different for merging than it is for appending. When you merge data, or add data elements, you only need to make sure that the data elements
you merge on are the same. RecordID, ClientID and visit date are examples of data elements that are commonly used for merging. When you append data, or add records, all of the common data elements must be in the same format. Because you are adding new data for every single data element in your data set, it is best to make sure that all the values match.
38
Combining Data Sets
You want to pull case management data from your electronic medical record (EMR)
Two data sets, both including gender data
Two data sets, both including gender data
How is “case management”
defined in the EMR?
Make sure your values line up!
Is everyone using the same definition?
Does 1 = female, or male?
Does 1 = female, or male?
For example, if you are appending data and both of your data sets include gender, you’ll want to be sure that all of the values line up beforehand. You could find that the number “1” signifies a female client in one database and a male client in the other. In this case, if you appended the data, you would end up re‐categorizing all of your female clients from one source as males in another!
39
Combining Data Sets
3. Are the definitions consistent? •
Make sure everyone uses the same definitions
Are the definitions consistent? All staff and contractors, and anyone else that collects the data, should be using the same definitions for each data element. 40
Combining Data Sets
You want to pull case management data from You want to pull case management data from your your electronic medical record (EMR)
Two data sets, both including gender data
Two data sets, both including gender data
electronic medical record (EMR)
electronic medical record (EMR)
How is “case management”
defined in the EMR?
How is “case management”
defined in the EMR?
Make sure your values line up!
Is everyone using the same definition?
Is everyone using the same definition?
Is everyone using the same definition?
For example, let’s say that you want to pull case management visit data from an EMR, or electronic medical record. Before you do, make sure that the definition of case management used in the EMR is consistent with your Ryan White program’s definition for case management. Along these lines, if you are combining data sets from multiple contracted service providers, make sure that they are all using the same definitions. 41
Combining Data Sets
3. Are the definitions consistent? •
Make sure everyone uses the same definitions
•
Use definitions from RSR instruction manual
For new data sources, check on definitions
•
Carefully review the RSR instruction manual, and use the definitions provided there for all required data elements. And when you are exploring alternative data sources, find out what definitions were used for data collection so that you can determine whether this new source will meet your needs.
Combining data sets can be a simple process if you take the time to make sure they will link up correctly. By using the same format for your record ID, lining up your values, and using consistent definitions, you will be well on your way to successfully combining data sets. 42
How does this apply to you? •
•
Data from multiple sources
Instead of combining data by hand…extract or merge data
•
•
More efficient for twice‐annual RSR reporting Software modules may already exist to import data from other databases
So, how does this apply to you? Many grantees have client data stored in multiple locations. For example, you may have some client data in a local HIV program database, while the rest of the data you need is either in your hospital electronic medical record, or in a lab database. What do you do when it’s time to report data for the RSR? In the past, you may have scrambled at the last minute to enter data from one data source into another by hand, simply to generate a report. Being able to merge or append data from multiple, existing datasets can make your data collection process more efficient.
Data extraction is an important option to consider for transferring or merging data on a regular basis. With the RSR data being required twice a year, efficiency is critical. Before extracting data, talk with the developer of the database or software program you’ll be using to report RSR data. Software modules may already exist to help you import data from other databases.
43
Additional Support If you need other help getting the data out:
•
•
•
Data reporting TA from HRSA
Other grantees using your same system/approach
Staff and contracted service providers
www.careacttarget.org
We’ve addressed ways to help you think about how to find the data you need from existing sources, and to better understand the data extraction process. If you need additional support, there are resources to help you think about how to extract and report data. First, be sure to explore all of the data‐related technical assistance and training resources available from HRSA. These resources are available to help you collect and report RSR data. Start at the TARGET center website. The TARGET center website is also a good place to start looking for resources and solutions that are being developed by other grantees and providers.
Finally, don’t forget to ask your own staff and contractors. They may have relevant data experience to share, or ideas on where to find additional resources.
44
What have you learned...?
•
•
•
Value of using external sources
How to find, review, and request data
Common types of raw data extracts
•
•
•
•
Simple or plain text
Spreadsheet
XML file
How to combine data from multiple sources (i.e. merging and appending)
In this module, we discussed the value of looking at a variety of existing data sources to get the data you need. The data you need may already be collected somewhere. When you identify existing data sources, make sure you can get the data you need in a format you can use. And when you request data, be clear about when you’ll need the data, what data you’ll need, what kind of data extract you’ll need to receive, and how the data should be transmitted to you. For sources outside your institution, make sure that a data sharing agreement is in place. We also reviewed different formats for data extraction – canned or automated reports and raw data extracts. Raw data extracts always have the same components – records, data elements, values, client IDs, and record IDs. We looked at three common raw data extract formats: simple text files, spreadsheets, and XML. Finally, we discussed how to merge and append data from multiple sources. And we provided questions to ask before you merge or append datasets to make sure data will combine correctly and that you will be able to get what you need. 45
Additional resources and modules
•
View more modules at the Data Academy Website www.careacttarget.org/dataacademy
•
For more resources, visit the TARGET Center website www.careacttarget.org
You have now reached the end of this module. We hope that you enjoyed the module and that it helped you build skills for collecting, reporting, using and sharing data. To view more Data Academy modules, visit the Data Academy home page. And to learn about other resources for Ryan White HIV/AIDS Program grantees, visit the TARGET Center website.
46