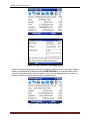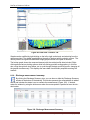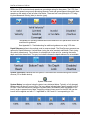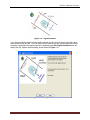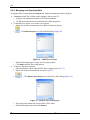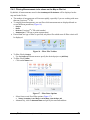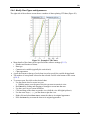
1
SonTek, a Division of YSI Inc. 7.7. Discharge Measurement - Data Collection Below is a detailed procedure for conducting a discharge measurement. In general the process has five steps which include the following: 1. Start a Measurement 2. Start Edge 3. Start Moving/Transect 4. End Edge 5. End Transect Once a measurement is started, the software prompts you at each step, allowing you to focus on the measurement. 7.7.1. Starting the measurement To start data collection using the moving boat method, select START from the Main Menu view (Figure 78). The system starts “pinging” and collecting data profiles. Figure 78. Main Menu – Start Data Collection Appendix A provides a description and list of icons used on the software’s status bar. Note that icons are color coded – typically moving from the color blue (indicating optimal status) to red (indicating nonfunctional). Gray indicates the option is not installed. 7.7.2. Start Edge By pressing the soft key corresponding to Start Edge (Figure 79) you are prompted to enter Starting Edge (Left or Right bank), Method (slope bank, vertical bank, user input), and Distance (i.e., distance from Starting edge) as displayed in Figure 80. After entering the edge information, select OK to view start-edge samples. In order to collect precise and accurate information, make sure the boat is as motionless as possible RiverSurveyor S5/M9 System Manual (July 2012) 67 SonTek, a Division of YSI Inc. Figure 79. Data collection - Start Edge Figure 80. Data Collection - Start Edge Inputs Figure 81 shows the RiverSurveyor collecting data after entering START EDGE inputs. Collect at least 10 profiles/samples edge and select START MOVING to go to the next step. At this point, it is important to make sure the system is running and collecting samples. It is also important to confirm the status icons are valid (see Appendix A). Figure 81. Data Screen After Start Edge 68 RiverSurveyor S5/M9 System Manual (July 2012) SonTek, a Division of YSI Inc. 7.7.3. Start Moving Before moving the vessel across the transect, press Start Moving. Now start moving the system smoothly and slowly across the channel. Figure 82 displays the Start Moving screen. Figure 82. Data collection - Start Moving This window shows the data as it’s being collected across the channel. Additional views are available to display the other data parameters being collected. Press the Menu key to select the data display to view. The number keys 1, 2, 3 or 4 can also be used to change the views, as shown in Figure 83. Figure 83. Data Collection – Start Moving Data View 7.7.4. End Edge After arriving at the opposite bank, select END EDGE (Figure 84). You are then prompted (Figure 85) to enter Method (Vertical Bank, Sloped Bank, User Input) and Distance (i.e., distance from ending edge). If you set Method to User Input, use the User Flow field to enter an estimate of flow for this area starting from the ending edge. Select OK to go to the END TRANSECT menu. Be sure the vessel stays as motionless as possible to collect the best edge data. Collect at least 10 samples/profiles before going to the End Transect step. RiverSurveyor S5/M9 System Manual (July 2012) 69 SonTek, a Division of YSI Inc. Figure 84. Data collection - End Edge Figure 85. Data collection - End Edge information 7.7.5. End Transect Figure 86 shows the End Transect screen. Press the End Transect button to complete the measurement. Figure 86. End Transect Screen 70 RiverSurveyor S5/M9 System Manual (July 2012) SonTek, a Division of YSI Inc. After the transect ends, the Measurement Summary screen appears (Figure 87). It shows data from each transect as well as statistical calculations. Arrow keys allow movement from cell to cell. Using the Select key in the left column includes/excludes transects, which changes the statistics. This lets you discard invalid transects, making the final discharge calculation available in the field. Figure 87. Discharge Measurement Summary Screen Select CONTINUE to make another measurement, or MENU and DONE to go to Main Menu. At any step in the moving boat process, you select MENU and then ABORT to cancel the measurement and go back to main menu. Also at any step, you can select MENU and then DISCONNECT to disconnect the Mobile device from the system, but leave the system still running. You can reconnect to the ADP with the same or different Mobile device, or with a PC, all while the system continues to collect data without losing any information. Figure 88 displays the Abort and Disconnect options. Figure 88. Data Collection - Abort and Disconnect Options 7.7.6. Data collection - Swapping between Mobile Device and PC The RiverSurveyor Live software allows you to swap between measurement devices (Mobile device and PC) while the system is collecting data. Data collected by the RiverSurveyor system (ADP) is stored inside the ADP, so there is no risk of losing data when swapping between devices. More importantly, the data will not be lost if communications to the ADP is interrupted for any reason. RiverSurveyor S5/M9 System Manual (July 2012) 71 SonTek, a Division of YSI Inc. To swap from the Mobile device to a PC, disconnect from the system during data collection. This is done by pressing the Menu button and then Disconnect as displayed in Figure 88. Simply connect to the system with a PC or other Mobile device to continue with the measurement. 7.7.7. Transferring Data from Mobile Device to PC Transferring data files from the Mobile device to the PC is done by simply connecting the Mobile device to the PC via a USB cable. Make sure that ActiveSync is installed on the PC so the Mobile device and PC can communicate. After the Mobile device is powered on and connected to the PC, ActiveSync will recognize the Mobile device and display it as a Mobile device on the PC in Windows Explorer. You can then go to the appropriate folder that contains the collected data (data files have a .riv extension) and download (Save, Copy and Paste, or Cut and Paste) the files to the desired folder on the PC. The PC folder is where you will access the data for viewing, post-processing, and analysis using the RiverSurveyor Live for PC software. Figure 89 shows the Main Menu window for RiverSurveyor Live for PC. In the section titled Data Files (highlighted in red), files can be selected manually, or they can be opened using hot links to the most recently used files. Figure 89. Main Menu for RiverSurveyor Live for PC 72 RiverSurveyor S5/M9 System Manual (July 2012) SonTek, a Division of YSI Inc. Section 8. Reviewing Data Files/Post-Processing 8.1. Overview This section is to be used as a guide to open, view and post-process data files using the RiverSurveyor Live for PC software. An initial explanation will describe the layout of the data and the various tabular views. A detailed description of the post-processing options will follow. 8.2. Opening Data Files To open and process data in RiverSurveyor Live for PC, all data files must have the .riv extension. Figure 90 shows three ways to open data files. Click the open file icon (the folder) on the top toolbar to browse for and select a file. Alternatively, you can click on the Open file (Ctrl+O) link or one of the most recently viewed files. Figure 90. Open Data Files in RiverSurveyor Live for PC RiverSurveyor S5/M9 System Manual (July 2012) 73 SonTek, a Division of YSI Inc. 8.3. Application Layout The application layout is divided into seven sections, shown below in Figure 91. Figure 91. Application Layout for PC Software 8.3.1. Main Toolbar Icons The Main Toolbar at the top of the screen provides quick links to open files, connect to an ADP and change the program views and settings. Below is an explanation of each: Open File (Ctrl + O) – Opens a window to select files for viewing and post-processing. Connect (Ctrl + N) – Allows the selection of communications types with the RiverSurveyor: for a direct connect option or a SS radio connection select a Com Port, while Bluetooth users should click on the tick-box at the bottom of the window. Show/Hide Processing Toolbox (Ctrl + T) – Toggle button shows or hides the Processing Toolbox for post-processing analysis. Show/Hide Discharge Summary (Ctrl + S) – Toggle button shows or hides the Discharge Summary for post-processing analysis. Load GIS Shape File – Opens a window and presents options to look for and load pre-saved geo-referenced Shape File that can be used as a background for the data collected. This is a useful visualization tool for user in post-processing. Change Program Settings – Opens a pop-up window which presents default program settings--English or Metric Units for example. View Documentation – Presents help documents. 74 RiverSurveyor S5/M9 System Manual (July 2012) SonTek, a Division of YSI Inc. 8.3.2. Data file Tabs ( ) Figure 91 highlights the location of the Data file tabs. Each tab is an open file with the year, month, day, hour, minute, second format (i.e. YYYYMMDDHHMMSS). The tabs are used to toggle between open data files. Multiple files can be opened simultaneously. Users can swap between tabs by clicking or using Ctrl+Tab or Ctrl+Shift+Tab. To close tabs, click the X or use the Ctrl+F4 hot key. 8.3.3. Sidebar The Sidebar displays the status icons as well as customizable tabular data and a profile graph for the current sample. Status icons are explained in Appendix A. Right-click on the tabular data to select the display options shown in Figure 92. In addition to the various data display options, there is an “Add all” option to include all data fields or a “Reset to default” option to apply the standard view. Figure 92. Sidebar Tabular Data with Right Clicking Menu Options. The graph portion of the Sidebar displays the vertical profile through the water column. Doubleclick on the axes to change the scale. Right-click on the graph to display a pop-up menu that allows for further customization of the graph. Below is an example for viewing the velocity profile. After right clicking on the graph, select WaterTrack and then Velocity. This will display each velocity component along with the Standard Deviation as a shaded band around each line (Figure 93). RiverSurveyor S5/M9 System Manual (July 2012) 75 SonTek, a Division of YSI Inc. Figure 93. Profile View – WaterTrack Another useful plot for the profile graph is to select Summary and then Discharge. This will present a graph that plots the profile extrapolation with the area under the graph being the incremental discharge for the sample/profile. 8.3.4. Tab Windows Selection There are five views or data tabs in the software. Each tab presents a specific view of the data explained below. 8.3.5. Tab Window Display The Tab Window (Figure 94) shows different views of the data as different tabs are selected. When a tab is selected, it becomes the active tab for all data files which are open in the program. The PageUp and PageDown keys can be used to toggle between the tabs. Below is an explanation of each Tab Window. Figure 94. Tab Window Display 76 RiverSurveyor S5/M9 System Manual (July 2012) SonTek, a Division of YSI Inc. System Tab Figure 95 shows the System tab view of a data file in RiverSurveyor Live for PC. To alternate between the views, select the tabs at the bottom of the window to view and analyze the data. Figure 95. System Tab The information on the Systems tab shows the following user inputs and settings. Measurement Type shows the method used to collect the data. Moving Boat is the only option available at this time. Other measurement types will be available in future releases. Site Information shows a summary of Site Information entered before data collection. System Configuration shows the System Configuration used during data collection. System Settings shows a summary of the System Settings. Information in this block can be modified for post-processing by clicking Change System Settings. Discharge Measurement shows a summary of Measurement Settings. This information can be modified for post-processing by clicking on Change Measurement Settings. Edge Estimates shows a summary of information entered during the measurement. Profile Extrapolation shows a summary of how the profile data was extrapolated for velocity profiles and discharge measurement. Important: You can modify the presentation of graphic and tabular data displays by right clicking and selecting from the options in the context menu. Samples Tab The Samples tab (Figure 96) displays tabular data for all samples collected along with a contour and profile graph. The left side shows status icons for each sample. The main window shows tabular transect data. You can scroll through the data using the up/down keys or predefined Hotkeys/Accelerators (Section 8.4) for viewing and post-processing. The graphics at the bottom show vertical profile data and complete transect data. You can toggle through the vertical profile data using the up/down keys to browse the samples and use the left/right arrow keys to start at the left/right bank respectively. RiverSurveyor S5/M9 System Manual (July 2012) 77 SonTek, a Division of YSI Inc. Figure 96. Samples Tab Navigation Tab The Navigation tab (Figure 97) has three sections – incremental profile data (left), navigational graphics (main area) and transect view (bottom). The navigational graphics show system trajectory or navigation during the measurement. You can also view collected data superimposed over your own background graphic. Figure 97 Data View – Navigation Tab 78 RiverSurveyor S5/M9 System Manual (July 2012) SonTek, a Division of YSI Inc. Edges Tab The Edges tab (Figure 98) provides a detailed tool for evaluating data collected on the start/end edges of a discharge measurement. The Edges tab has three sections – incremental profile data (left), navigation data for both edges (main) and transect data for both edges (bottom). Figure 98. Data View – Edges Tab Incremental Profile Data – Presents the incremental profile data collected in the field. The up/down keys page through the data one sample at a time. The left arrow key goes to the first profile of the starting edge; the right arrow key goes to the last profile of the ending edge. The information presented in this section allows evaluation of the data from each sample. Status icons help to determine system performance. Navigation Graphics – Present a view of the trajectory of the system during a measurement. The left arrow key goes to the first profile of the starting edge; the right arrow key goes to the last profile of the ending edge. The up/down keys cycle through the data. Edge Graphics – Presents a view for evaluating starting and ending edges. The left arrow key goes to the first profile of the starting edge; the right arrow key goes to the last profile of the starting edge. The up/down keys cycle through the data. Transect Tab The Transect tab (Figure 99) has three sections – incremental profile data (left), user-selected graphics (main area) and transect view (bottom). As an example, the top graph in Figure 99 shows the depth-to-bottom information taken from the vertical beam data (blue) and the transducer data (green). RiverSurveyor S5/M9 System Manual (July 2012) 79 SonTek, a Division of YSI Inc. Figure 99. Data View -Transect Tab Graphs can be modified by right-clicking on the left or right vertical axis and selecting from the options provided. The middle graph displays the path of the boat with the velocity vectors. The velocity vectors at a good site should be roughly perpendicular to the path of the boat. The bottom graph shows the measured transect with the vertical profile data included. Rightclicking allows various plotting options, while left-clicking provides scaling options. In this window, using the up/down keys allows you to cycle through the data, profile by profile, changing all the graphs simultaneously. This displays the same data from different perspectives along the transect. 8.3.6. Discharge measurement summary By clicking the Discharge Summary icon, you can show or hide the Discharge Summary window at the bottom of the desktop. This window presents the collected data in tabular format and includes the status icons to evaluate the measurement (Figure 100). If desired, resize the window by using the slider arrow when the mouse pointer is positioned over the window border. Figure 100. Discharge Measurement Summary 80 RiverSurveyor S5/M9 System Manual (July 2012) SonTek, a Division of YSI Inc. All records are ordered by date/time with icons for starting edge, depth and track reference and coordinate system. All records can be selected or deselected by clicking with the mouse; this affects the statistics presented and is a quick and easy way to understand what effect each measurement has on the overall average of the measurements for the site. Additionally, you can select data to include or exclude from the discharge calculation by simply clicking to activate or deactivate the check box. The Discharge Summary has the following options that can be used in post processing: Discharge Summary Report: Generates a printer friendly report that summarizes all data used in the discharge calculation as well as the associated statistics (unchecked records are not displayed). Export Discharge Summary to ASCII: Exports the information found in the discharge summary to an ASCII file (.txt). Delete selected discharge record(s): Deletes the selected records (the ones with the red check). These records will not be used for the discharge calculation. Delete all discharge records: Deletes all records present, essentially removing all transects for discharge calculation Links between open files and records on the discharge summary are as follows: An open file will update its corresponding discharge record with changes to settings or as sample number changes. Closing a file leaves the record displayed in the discharge measurement summary, but the record will no longer update Deleting the record severs the link to the data file. To add the record back, the file must be reopened. Click on a record to switch to the matching data file. Delete or uncheck a record to recomputed statistics. 8.3.7. Processing toolbox The Processing Toolbox (Figure 101) gives you access to tools to post-process the discharge data. The Processing Toolbox has the following options in its dropdown menu: System Settings, Edge Estimates, Profile extrapolation and Thresholds. Each is described in detail below. The two icons in the top right corner are always present in the Processing Toolbox. The Reset icon allows you to reset all modified values back to those entered in the field. Since any changes to the settings have an impact on the discharge calculation, this option is important for users to have the option of post-processing, but the luxury of not losing the initial field settings. The MATLAB icon exports data from RiverSurveyor Live to a MATLAB friendly format explained in Appendix C. The velocities, track and summary data are exported in the reference and coordinate system that are set at the time of export. To export the raw ADP data, and therefore complete all the velocity coordinate transformations, track referencing and processing manually in MATLAB, you will need to follow this procedure: RiverSurveyor S5/M9 System Manual (July 2012) 81 SonTek, a Division of YSI Inc. 1. 2. 3. 4. 5. 6. Open the data file you need to export Open the Processing Toolbox Select the System Settings page Set the Track/Velocity Reference to “System” Set the Coordinate System to “Beam” Press the Export to MATLAB button Processing Toolbox Discharge Summary Figure 101. Discharge Measurement Summary and Processing Toolbox Processing Toolbox dropdown menu System Settings – Allows post-processing of the data collected in the field. Figure 102 displays the options available. Transducer depth, Screening Distance, Salinity, and Magnetic Declination require a manual entry. The Track/Velocity Reference, Depth Reference, and Coordinate System icons allows the user to see the prior setting and change that setting by simply clicking on the icon. Click the “Apply” button to make the changes to a single data file. Use the “Apply to all” button to apply the post-processing changes to all of the data files that are open. Be sure all of the open files have identical settings before using the “Apply to all” button. The previous settings cannot be retrieved. 82 RiverSurveyor S5/M9 System Manual (July 2012) SonTek, a Division of YSI Inc. Figure 102. System Settings - Processing Toolbox Edge Estimates (Figure 103) – Allows the modification of Left/Right Bank settings in order to better define the characteristics regarding channel width and the slope of the edges. These settings have an important impact on the discharge calculation. Left/Right Method are selected from a dropdown box. Left/Right Distance and Estimated Flow are manual entry fields. Figure 103. Edge Estimates - Processing Toolbox RiverSurveyor S5/M9 System Manual (July 2012) 83 SonTek, a Division of YSI Inc. Profile Extrapolation (Figure 104) – Allows you to change the way the top/bottom estimates are calculated. In general, the default settings are adequate for most applications. The Method, Cells to Use, and % of Profile fields have dropdown menus. The Coefficient, Discard Last, and Cell(s) fields are manual entries. Figure 104. Profile Extrapolations - Processing Toolbox Thresholds (Figure 105) – Shows an option to set the minimum beam SNR threshold used for water velocity calculations (default = 1.0 dB). This value corresponds to the minimum SNR value needed to make a water velocity measurement. In clear water the SNR values are lower, and an adjustment can be made to the threshold to compensate for low sediment load. Important: No changes will be made to the calculated discharge or associated data until Apply or Apply to All has been clicked. Apply only applies the post-processing options to the open/active tab; Apply to All applies the post-processing changes to all the active tabs. Figure 105. Thresholds - Processing Toolbox 84 RiverSurveyor S5/M9 System Manual (July 2012) SonTek, a Division of YSI Inc. 8.4. Hot Keys/Accelerators Table 3 presents a list of Hotkeys/Accelerators which can be used via the keyboard, often in place of a mouse click. These Hot Keys are useful in many processes including data collection, data processing, managing data files and viewing data. It is also important to remember for graphic and tabular display, a right-click presents data viewing options. Table 3. Summary of Hotkeys/Accelerators for RiverSurveyor Live for PC Hot Keys F5 F8 Ctrl+N Ctrl+O Ctrl+T Ctrl+S Ctrl+R Ctrl+Tab Ctrl+Shift+Tab PageUp PageDown Ctrl+F4 Ctrl++ Ctrl-Z Shift+Z Left Arrow Right Arrow Up Arrow Down Arrow Ctrl+Up Arrow Ctrl+Down Arrow Ctrl+Shift+Up Arrow Ctrl+Shift+Down Arrow 8.5. Description/Function Go to Next Step Abort Connect to RiverSurveyor System Open a data file Show/Hide Processing Toolbox Show/Hide Discharge Measurement Summary Show Discharge Summary Report Next File/Connection Tab (top of screen) Previous File/Connection Tab (top of screen) Next Display Tab (bottom of screen) Previous Display Tab (bottom of screen) Close Current Tab Increase Vector Length Decrease Vector Length Zoom in Zoom out First Sample Last Sample Previous Sample Next Sample Back 20 Samples Forward 20 Samples Back 100 Samples Forward 100 Samples Location/Process Data Collection Data Collection Start Data Collection Data Processing Data Processing Data Processing Data Processing Data Processing Data Processing Data Processing Data Processing Data Processing Track Window Track Window Track Window Track Window Data Files Data Files Data Files Data Files Data Files Data Files Data Files Data Files Processing Data Files – Step by Step This section is a guide for analyzing and post-processing data files collected in the field. 1. Open all files from a measurement site (the same measurement site with the same flow conditions). o Review the System settings. Be sure that the settings are consistent amongst files. To do this go to the Systems tab and cycle through each file (Click on each tab individually or use Ctrl+Tab). o If necessary, change the Track and Depth reference to best represent the best field measurement (in Processing Toolbox – System Settings). o Select the Navigation tab to evaluate the collected data across the channel. Deactivate the UTM Display and activate the AutoScale option: available by right clicking. o Use the Sidebar tabular data to evaluate specific settings (i.e. Duration of the measurement, GPS Quality). Visually review each measurement by clicking on each tab or by using Ctrl+Tab RiverSurveyor S5/M9 System Manual (July 2012) 85 SonTek, a Division of YSI Inc. Evaluate BottomTrack vs. GPS (if applicable) to observe any compass, GPS or moving bed issues. Make sure the magnetic declination is set appropriately for the site (the default setting is zero). Make sure that the GC-BC (angle of average GPS course since start of transect minus ADP bottom-track course; value near 0 is desired) is less than 2 degrees and the D(BT)/D(GPS) (Ratio of Bottom Track track distance to GPS track distance) is approximately 1 (Sidebar data). Be sure the number of GPS satellites is good and the GPS quality is valid 2. On the Transect tab, evaluate different plots by right-clicking on the vertical axes. o Plot the depth measured by the Vertical Beam as well as Bottom Track depth. Make sure the VB and BT depth scales are the same. Check for any major discrepancies. o Evaluate Boat Speed and Water speed plotted on the same graph. Ideally, the Boat speed should not exceed the water speed where possible. o Make sure that Heading/Pitch/Roll and Temperature are relatively constant. o Verify that the SNR data and beams are valid with special focus on the edges and shallow water. o Verify water velocity in ENU: U (up) and D (Delta) should be close to zero. o Make sure that discharge curve and profile extrapolation is applicable (using Processing Toolbox – Profile Extrapolation). o Verify that the SNRs are valid for the contour (graph at the bottom). o Verify that the velocity cell cutoff on the contour plot is valid, also look at the screening distance and make sure that is graphically correct. 3. In the Discharge Measurement Summary make sure that: 86 o References and Coordinates should be the same o Starting edges should alternate o Date/times should be consecutive o Duration of measurements should be similar o Use the Statistics to identify any outliers o Channel width and discharge areas should be similar o Uncheck or delete problematic records RiverSurveyor S5/M9 System Manual (July 2012) SonTek, a Division of YSI Inc. Appendix A. Description of RiverSurveyor Live Icons Bluetooth is a wireless short-range communications technology allowing data transmission over short distances from fixed and mobile devices. When users apply this method of communication between their PC or Mobile device and the ADP, a blue icon indicates that Bluetooth is active, while a red icon represents inactive (icons below). Bluetooth signal strength is indicated with a green icon square, a full square indicates a strong Bluetooth signal, while squares not completely filled indicates proportional signal strength. BT Active BT Inactive Bottom Track is used to remove vessel motion from measured water velocity to determine the “true” water velocity, track distance and depth. That is, when you mount the ADP to a vessel, bottom-track measures the velocity and direction of the ADP/vessel movement over ground. There are four icons (below) for bottom track quality: blue corresponding to depth and track data (optimal); yellow means bottom track only depth is valid (functional); red indicates that bottom track does not have a lock; and the grey icon indicates that the feature is not available. RTK GPS is the essential GGA GPS fix data which provides 3-D location and accuracy data for the system. This data string includes: Latitude, Longitude, Fix quality, Number of satellites used, Altitude as well as many other types of information. There are five icons for RTK GPS, as seen below, ranging from RTK (Real-time kinematic--blue) to the Inactive (gray). RTK Quality GPS provides 0.03 m accuracy Differential Quality GPS provides sub 1-meter accuracy GGA Uncorrected provides greater that 1-m accuracy RiverSurveyor S5/M9 System Manual (July 2012) 87 SonTek, a Division of YSI Inc. VTG is the GPS vector track and speed over ground data string for the system. The VTG (Vector track and speed over ground) data string presents Track and ground speed information (boat speed over the water) as well as other information. There are four icons (below) for VTG ranging from Measured Velocity (blue) to Inactive (grey). *Acceptable for discharge measurements but additional GPS parameters should be monitored for guidance. See Appendix D—Troubleshooting for additional guidance on using VTG data. Depth Reference refers to the method used to measure depth. The RiverSurveyor presents two options for Depth Reference: Vertical Beam (using the echo sounder) and Bottom Track (using the velocity transducers). The indicator for no depth lock is the red icon, meaning that water depth cannot be determined. The grey icon below indicates the depth reference is not available. System Connection indicates that the system is connected and communicating with external sources (PC or Mobile device). System Connected System Battery is monitored using the status icons indicated below. Typically, a fully charged battery pack has about 5 hours of use. The icons below indicate battery status ranging from 10 to 100%. Users are advised to change the system battery immediately after reaching the 10% level in order to prevent loss of data. If applying a direct power source to the ADP the icon below will still be applied and with 17 V applicable to 100% and 12 V corresponding to 10%. 88 RiverSurveyor S5/M9 System Manual (July 2012) SonTek, a Division of YSI Inc. Data Collection is verified using the two icons below. Blue rotating arrows indicate that the system is actively collecting data. The red clock-like icon indicates that the system is not collecting data and a detailed review of system and application settings should be completed in order to identify any possible problems. Collecting Data – During data collection the blue arrows (above) will move in a circular motion, indicating that data collection is active. No Data Reception – The red icon (above) indicates loss of communications. Re-check communications connections and the range of the system. RiverSurveyor Live for PC Menu Bar is used for the initial setup and startup. Icon utilities are self explanatory; however a brief description is included below: Open File (Ctrl + O) – Opens a window that allows users to select files to open and evaluate using post-processing tools. Connect (Ctrl + N) – Allows the selection of communications types with the RiverSurveyor: for a direct connect option or a SS radio connection select a Com Port, while Bluetooth users should click on the tick-box at the bottom of the window. Show/Hide Processing Toolbox (Ctrl + N) – Toggle button shows or hides the Processing Toolbox for post-processing analysis. Show/Hide Discharge Summary (Ctrl + S) – Toggle button shows or hides the Discharge Summary for post-processing analysis. Load GIS Shape File – Opens a window with options to look for and load pre-saved geo referenced Shape File that can be used as a background for the data collected. This is a useful visualization tool for user in post-processing. Change Program Settings – Opens a pop-up window which presents default program settings--English or Metric Units for example. View Documentation – Presents help documents. RiverSurveyor S5/M9 System Manual (July 2012) 89 SonTek, a Division of YSI Inc. Discharge Summary Menu Bar (Desktop version) presents four icons that allows various post processing options and are described below: Discharge Summary Report – Opens a printer-friendly window that presents the collected data in a pre-defined report format. Export Discharge Summary to ASCII – Opens a dialog box that allows a file to be saved in ASCII format. The file has a plain text format for importing the data into another application for further processing. Delete Selected Discharge Record(s) – A post processing option used to delete a record in the Discharge Summary Window. This option will have an effect on the overall discharge measurement summary as the record is deleted from the summary; however the file is still saved in PC or Mobile device memory. Multiple records can be selected and deleted by checking the tick-mark boxes next to the record. Delete All Discharge Records – Using the Delete All Records button deletes all loaded records from the Discharge Summary. Processing Toolbox Icons (Desktop version) Reset to Field Settings – Allows you to reset the values that were used in the field for the discharge calculation. Export to MATLAB – Opens a pop-up window used to name and save the file for import into MATLAB. Coordinate System Icons (Desktop version) Beam Coordinates – Beam coordinates are relative to the orientation of the transducers on the head of the ADP. Beam coordinates are typically used for diagnostics purposes only. XYZ Coordinates – Applies the standard XYZ coordinates to the data, where: X is the North axis, Y is East axis and Z is the vertical axis. ENU Coordinates – Applies the ENU (East, North, Up) coordinate system to the data. Local ENU coordinates are formed from a plane tangent to the Earth's surface fixed to a specific location. Depth Reference (Desktop Version) Vertical Beam – Applies data from the 0.5 MHz transducer for M9 systems and the 1.0 MHz data from the S5 system to determine water depth for the cross-sectional area. Bottom Track – Applies data from the velocity transducers from the S5 (four 3 MHz transducers) and M9 (four 3 MHz transducers and four 1 MHz transducers) to determine water depth for the cross-sectional area. 90 RiverSurveyor S5/M9 System Manual (July 2012) SonTek, a Division of YSI Inc. Appendix B. Parameter and Hotkey Descriptions This appendix describes the parameters that can be displayed during data collection using the RiverSurveyor Live for Mobile software. There are a number of views available during data collection. Each may be accessed using a Hotkey or selecting a viewing option from the menu. Typically, six to twelve parameters or settings are displayed at one time. Press one of the hotkeys (1-4) during data collection using the Mobile device to change to a different view. Parameter Process Step Sample Time Duration Voltage Total Q # Cells Track Depth Mean Vel Boat Speed Boat/Water DMG Temperature Heading Pitch Roll Satellites GPS Quality D(BT)/D(GPS) GC-BC GPS Age HDOP Total Q Top Q Middle Q Bottom Q Left Q Right Q Total Q Description Moving Boat (Default) Profiling (default) Number of samples taken (typically 1 per second) Time set by the user Duration of the measurement (HH:MM:SS) Voltage of system battery on RiverSurveyor Total accumulated discharge for the transect Number of cells used in the last vertical profile Shows the accumulated total distance the vessel has traveled through the last completed profile for this data set Depth measured for the last profile processed (m or ft) Mean velocity of last profile in m/s or ft/s Shows speed of vessel over ground for the last profile processed Ratio of boat speed to water speed Distance made good is the distance from your last position to your present position Temperature in °C or °F (system settings Metric or English) for the last profile processed Shows vessel heading based on the Track Display Shows the pitch angle of the ADP for the last profile processed Shows the pitch angle of the ADP for the last profile processed Number of satellites used in location determination (GPS option) Quality indicator based on number of satellites used in track data Ratio of Bottom Track track distance to GPS track distance Shows angle (degrees) of average GPS course since start of transect minus ADP bottom-track course; value near 0 is desired. Age of differential GPS connection in seconds Horizontal dilution of precision Total discharge measure for the cross section in m3/s or ft3/s Shows the total accumulated discharge in the top layer that is estimated by the program Shows the total accumulated discharge in the middle layer that is estimated by the program Shows the total accumulated discharge in the bottom layer that is estimated by the program Shows the total accumulated discharge in the left edge of the survey area that is estimated by the program Shows the total accumulated discharge in the right edge of the survey area that is estimated by the program Shows total discharge estimated and measured for entire crosssection RiverSurveyor S5/M9 System Manual (July 2012) Key/Menu Option 1 1 1 1 1 1 1 1 1 1 1 2 2 2 2 2 2 2 2 2 2 2 2 2 3 3 3 3 3 3 91 SonTek, a Division of YSI Inc. Transducer Depth Salinity Magnetic Declination Track Reference Depth Reference Coordinate System 92 Distance the vertical beam transducer is submerged into water column User defined parameter that allows for a correction of the speed of sound in water based on the salinity in parts per thousand (ppt) User defined value for difference in magnetic North and true North User defined criteria used in determining navigation information (i.e. Bottom Track and Boat Speed) User defined criteria used in determining water depth (i.e., Vertical Beam or Bottom Track (4 beams)) Navigation coordinate system applied by user (ENU, System, XYZ) 4 4 4 4 4 4 RiverSurveyor S5/M9 System Manual (July 2012) SonTek, a Division of YSI Inc. Appendix C. MATLAB Export The MATLAB output is ordered into a series of structures each containing their related parameters and settings. The tables below describe each structure and their contents and it is current as of version 2.50 of the RiverSurveyor Live software. IMPORTANT NOTES: The term “sample” refers to a single vertical profile, taken over a period of 1 s. 1. 2. 3. 4. 1. 2. 3. 4. 1. 2. 3. 4. For the four parameters containing Velocity data (BottomTrack.BT_Vel, Summary.Mean_Vel, Summary.Boat_Vel, and WaterTrack.Velocity), the data is in the same coordinate system that was selected in the software when the .mat file was exported. For example: o BT_Vel when exported in ENU coordinates will be: East Velocity (i.e. velocity to the East) North Velocity Up Velocity Difference Velocity (aka Error Velocity; the difference between measuring the vertical component of the velocity from the two pairs of opposing beams) o BT_Vel when exported in XYZ coordinates will be: X Velocity Y Velocity Up Velocity Difference Velocity o BT_Vel when exported in Beam coordinates will be: Beam 1 Beam 2 Beam 3 Beam 4 GPS Altitude (from the GGA string) is based on a proprietary, non-published geoid, and referenced to the bottom-center of the antenna. The basic order of the root structures is as follows. For the Size Column: NS is the number of samples; NC is the maximum number of cells; If the structure contains another structure inside it, or the parameter is a scalar, the size is NA. Structure Name Bottom Track GPS Processing RawGPSData Setup Summary System Description Bottom Track Velocity, Depth and Frequency variables (includes Vertical Beam). GPS data and quality information. Processing settings. The raw GPS data from either the internal GPS or an external serially connected GPS system. This data is stored in its raw format with the same frequency that was output from the GPS. For example, if the GPS outputs data at 10 Hz, then 10 GPS data values are stored for each ADP sample. System settings, edge information and profile extrapolation Calculated discharge variables and the data used to compute them. Core system related parameters: Compass, Temperature, Time, RiverSurveyor S5/M9 System Manual (July 2012) 93 SonTek, a Division of YSI Inc. Transformation_Matrices WaterTrack SNR, Voltage and Profiling settings. System frequencies and transformation matrices. Water velocity and profiling variables in coordinates selected for output. Bottom Track structure Parameter Name Description VB_Depth Vertical Beam depth for each sample, including the Transducer Depth and compensation for tilt. BT_Depth Mean Bottom Track depth for each sample, including the Transducer Depth and compensation for tilt. This is the mean of the depth measured by each active transducer and projected in vertically below of the ADP. BT_Vel Bottom Track Velocity for each direction (or beam, if exported in Beam coordinates) for each sample. BT_Beam_Depth Bottom Track depth for each beam for each sample, including the Transducer Depth and compensation for tilt. BT_Frequency Frequency used for Bottom Track data for each sample (correlate with Frequency parameter from Transformation_Matrices structure) Units Units for above parameters (BT_Frequency is kHz) GPS structure Parameter Name Longitude Latitude Utc Satellites HDOP GPS_Age Altitude GPS_Quality GpsGeoid UTM Units Description Longitude for each sample Latitude for each sample Universal Time Coordinated (UTC) for each sample, in HHMMSS.S Number of satellites in view for each sample Horizontal Dilution of Precision for each sample Time since the last corrected GPS signal received at the rover GPS antenna, whether from the RTK Base Station or from the satellite if using the SonTek DGPS option. Altitude above mean sea level for each sample. GPS Quality for each sample (4 = RTK, 2 = Differential, 1 = Standard, 0 = Invalid). Gps Geoid Height is the distance between the geoid (mean sea level) and the WGS84 ellipsoid Universal Transverse Mercator (UTM) coordinate system in X and Y coordinates for each sample. Units for above parameters (GPS_Age are in seconds). Processing structure Parameter Name Description Screening User-applied minimum SNR filtering settings, in dB Corrections User-applied heading correction, in degrees Size NS x 1 NS x 1 NS x 4 NS x 4 NS x 1 NA Size NS x 1 NS x 1 NS x 1 NS x 1 NS x 1 NS x 1 NS x 1 NS x 1 NS x 1 NS x 2 NA Size NA NA RawGPSData structure (This structure contains 50 columns per sample because the instrument samples the GPS port at 50 Hz. However, because we require the GPS to output normally only up to 10 Hz, typically only the first 10 columns contain data, while the remaining 40 are filled with 0) 94 RiverSurveyor S5/M9 System Manual (July 2012) SonTek, a Division of YSI Inc. Parameter Name VtgTimeStamp VtgTmgTrue VtgTmgMag VtgSogMPS VtgMode GgaTimeStamp GgaLatitude GgaLongitude GgaQuality GgaAltitude GgaUTC Description $GPVTG time stamp for each high frequency GPS sample $GPVTG true course made good for each high frequency GPS sample (degrees) $GPVTG magnetic course made good for each high frequency GPS sample (degrees) $GPVTG speed over ground for each high frequency GPS sample (m/s) $GPVTG active mode for each high frequency GPS sample $GPGGA time stamp for each high frequency GPS sample $GPGGA latitude for each high frequency GPS sample $GPGGA longitude for each high frequency GPS sample $GPGGA fix quality for each high frequency GPS sample (4 = RTK, 2 = Differential, 1 = Standard, 0 = Invalid) $GPGGA altitude above sea level for each high frequency GPS sample (m) $GPGGA UTC for each high frequency GPS sample (HHMMSS.S) Setup structure Parameter Name startEdge magneticDeclination transectAzimuth coordinateSystem trackReference velocityReference depthReference userSalinity sensorDepth screeningDistance Edges_0__DistanceToBank Edges_0__EstimatedQ Edges_0__Method Edges_1__DistanceToBank Edges_1__EstimatedQ Edges_1__Method RatedDischarge extrapolation_Top_nFitType extrapolation_Top_nEntireProfil extrapolation_Top_dExponent extrapolation_Top_nCells extrapolation_Bottom_nFitType Size NS x 50 NS x 50 NS x 50 NS x 50 NS x 50 NS x 50 NS x 50 NS x 50 NS x 50 NS x 50 NS x 50 Description Start edge (0 = Left bank; 1 = Right bank) Magnetic Declination (degrees) Transect azimuth (Stationary measurements) Coordinate system (0 = Beam; 1 = XYZ; 2 = ENU) Track reference (0 = System; 1 = Bottom Track; 2 = GPS GGA; 3 = GPS VTG) Velocity reference (0 = System; 1 = Bottom Track; 2 = GPS GGA; 3 = GPS VTG) Depth reference (0 = Vertical beam; 1 = Bottom Track) User input salinity (ppt) Transducer depth (m) Vertical screening distance (m) Start Edge: Distance to the bank Start Edge: Estimated discharge Start Edge: Method (0 = User input discharge; 1 = Vertical bank; 2 = Sloped bank) End Edge: Distance to the bank End Edge: Estimated discharge End Edge: Method (0 = User input discharge; 1 = Vertical bank; 2 = Sloped bank) User input rated discharge Profile Extrapolation - Top: Fit equation type (0 = Constant fit; 1 = Power fit) Profile Extrapolation - Top: Fit (0 = Use entire profile; 1 = User selected number of cells) Profile Extrapolation - Top: Power fit exponent Profile Extrapolation - Top: Number of cells used in extrapolation Profile Extrapolation - Bottom: Fit equation type (0 = Constant fit; 1 = Power fit) RiverSurveyor S5/M9 System Manual (July 2012) Size NA NA NA NA NA NA NA NA NA NA NA NA NA NA NA NA NA NA NA NA NA NA 95 SonTek, a Division of YSI Inc. extrapolation_Bottom_nEntirePro Profile Extrapolation - Bottom: Fit (0 = Use entire profile; 1 = User selected number of cells) extrapolation_Bottom_dExponent Profile Extrapolation - Bottom: Power fit exponent extrapolation_Bottom_nCells Profile Extrapolation - Bottom: Number of cells used in extrapolation extrapolation_nDiscardType Method for discarding cells at the bottom of the profile (0 = user selected number of cells; 1 = percentage of profile) extrapolation_nDiscardCells Number of cells discarded extrapolation_dDiscardPercent Percentage of profile discarded MeasurementQuality User input measurement quality disableAutovelocity Enable or disable SmartPulseHD UserTemperature User input temperature fixedSoundSpeed User input sound speed useMeasuredTemperature 0 = Use User Input Temperature; 1 = Use Measured Temperature useFixedSoundSpeed 0 = Use Calculated Sound Speed; 1 = Use User Input Sound Speed Units Units for above parameters Summary structure Parameter Name Top_Q Middle_Q Bottom_Q Left_Q Right_Q Total_Q Depth Cells Track Mean_Vel Boat_Vel Track_Reference Units System structure Parameter Name Pitch Roll Heading Temperature Time SNR Sample Voltage Cell_Start 96 Description Discharge for the top section for each sample Discharge for the middle (measured) section for each sample Discharge for the bottom section for each sample Discharge for the left edge for each sample Discharge for the right edge for each sample Total discharge for each sample Depth used for discharge calculation for each sample Number of cells used for discharge calculation for each sample Track location for each sample in X and Y coordinates Mean water velocity for each sample, inclusive of the top and bottom extrapolation, for the horizontal velocity components. Boat velocity used for discharge calculation for each sample Track reference (0 = System; 1 = Bottom Track; 2 = GPS GGA; 3 = GPS VTG) Units for above parameters NA NA NA NA NA NA NA NA NA NA NA NA NA Size NS x 1 NS x 1 NS x 1 NS x 1 NS x 1 NS x 1 NS x 1 NS x 1 NS x 2 NS x 2 NS x 4 NS x 1 NA Description Size Compass pitch for each sample Compass roll for each sample Compass heading for each sample Temperature for each sample Time for each sample Signal to Noise Ratio (SNR) for each cell for each beam for each sample Sample number for each sample Battery voltage for each sample Start of the first cell for each sample NS x 1 NS x 1 NS x 1 NS x 1 NS x 1 NC x 4 x NS NS x 1 NS x 1 NS x 1 RiverSurveyor S5/M9 System Manual (July 2012) SonTek, a Division of YSI Inc. Cell_Size Step Pings Units Size of depth cells for each sample Step in data collection process for each sample For Moving Boat Discharge measurement: 2 = Start Edge 3 = In Transect 4 = End Edge Number of pings for each sample Units for above parameters (Time is seconds from 01/Jan/2000) Transformationatrices structure Parameter Name Description Frequency Frequencies available for the system Matrix Transformation matrices for each frequency WaterTrack structure Parameter Name Description Velocity Water Velocity for each cell for each beam for each sample Vel_StdDev Standard deviation of water velocity for each cell for each beam for each sample Correlation Correlation for each depth cell for each beam for each sample. Only applicable for samples collected with SmartPulseHD WT_Frequency Frequency used for WaterTrack data for each sample (correlate with Frequency parameter from Transformation_Matrices structure) Amb_Velocity Ambiguity Velocity for each sample. Only applicable for samples collected with SmartPulseHD Units Units for above parameters (BT_Frequency is kHz) RiverSurveyor S5/M9 System Manual (July 2012) NS x 1 NS x 1 NS x 1 NA Size 3x1 4x4x3 Size NC x 4 x NS NC x 4 x NS NC x 4 x NS NS x 1 NS x 1 NA 97 SonTek, a Division of YSI Inc. Appendix D. Troubleshooting 1. Communications a. PCM (Power and Communications Module) a) Be sure the dummy plug is installed and the locking sleeve is secured b) Be sure the battery pack in the PCM is fully charged c) Bluetooth Radios 1. Bluetooth communications (BT) PCMs are always active and have an internal antenna. Make sure BT communications are active in the Mobile device or the PC. 2. The Bluetooth dongle requires power from a PC USB port d) Spread Spectrum (SS) Radios 1. The SS base radio requires a rechargeable battery pack. Be sure the battery pack is fully charged. b. Software a) If the COM port shows a red light instead of green, then it is being occupied by another program. The most common cause is Microsoft ActiveSync. Disable the program. If the red light doesn’t turn green, restart the computer. 2. Interconnection and cables a. Please be sure to follow assembly instructions to interconnect correctly to maintain secure connections. b. Make sure that all cables are properly connected. The connections between the transducer (S5 or M9) and PCM should be firm. Make certain that the locking sleeves are tightened. 3. Data Collection a. The Status Bar in the RiverSurveyor Live software is a good place to start to diagnose any potential problems. Here is a list of the icons and description as well as a suggested corrective action. 98 a) Bluetooth in the system is not activated. Activate in the Mobile device as indicated above and be sure that antenna is installed properly. b) Bottom track is not functioning. Please check cable connection between the PCM and S5 or M9 ADP. Also check that the transducers are clean and unobstructed. Some environmental conditions (such as bed conditions or grass/weeds) may also result in invalid bottom detection. c) RTK quality GPGGA data (accurate to 3 cm or less). No action required by the user. Important Note: After powering on both systems (Base Station and RiverSurveyor) it typically takes approximately 10 minutes to connect to the system to achieve this quality of data. d) Differential quality GPGGA data (sub meter accuracy). It usually takes approximately 5 minutes to connect to this level of quality of data. No action required RiverSurveyor S5/M9 System Manual (July 2012) SonTek, a Division of YSI Inc. by user unless RTK quality is required. Be sure that the systems (Base Station and RiverSurveyor) have clear sky view antenna and that SS connections are correct. e) Indicates that communications have been established between the system and satellites, however there is no sub-meter differential correction. Generally not recommended for discharge calculations. Users should make sure that they have a clear sky view. Time needed to establish a connection between System and Satellites: 5 minutes for Differential quality data or up to 10 minutes for RTK quality data. f) and/or Connection not valid. Action required: Revise all cable connections and be sure to have a clear sky view for antenna. Be sure that the battery pack is sufficiently charged. g) and/or GPS not available or not installed. If you are using an external, serially connected GPS, make sure that you have the correct baud rate (38400) and the $GPGGA and the $GPVTG serial data strings are being output from your GPS unit. h) GPVTG data (highest quality VTG data—measured velocity data). It typically takes approximately 5 minutes to connect. No action is required as this is the highest level of VTG data available. To maintain this level of data quality, make certain that RiverSurveyor have clear sky view At least 6-7 satellites are required for reliable VTG data. Satellite changes can affect track data and should be monitored during data collection. Similar to differentially-corrected (not RTK) GGA data, VTG data are best suited to streams greater than 20 meters across. The best VTG data are obtained when the vessel motion is constant. Additional transects may be advisable if VTG accuracy is in question during a discharge measurement. i) Indicates that communications have been established between the system and satellites. Velocity is estimated. Generally not recommended for discharge calculations. Users should make sure that they have a clear sky view. j) Mean Bottom Track depth is used for depth calculation. k) Vertical Beam depth is used for depth calculation. l) No depth-lock for either the Bottom Track or Vertical Beam. Some environmental conditions (such as bed conditions or grass/weeds) may also result in invalid depth detection. RiverSurveyor S5/M9 System Manual (July 2012) 99 SonTek, a Division of YSI Inc. m) Bottom Track not available or not installed. n) Battery level in the system is at 10%. Finish data collection immediately or risk losing data. Communications will have to be re-established after installing a recharged battery pack. o) The data collection device (PC or Mobile device) is not receiving data. This does not mean that the system is not collecting data. The system will continue to collect data even if the communications link is lost. If using a wireless link such as Bluetooth (range is 60 m) or Spread Spectrum radios (range is 2 km), the system may be out of range or there may be obstacles preventing communication. Aim to maintain direct line of sight between the system and communications device at all times. For direct connection, most likely the cable has been disconnected. 4. Multiple discharge calculations across the same transect do not match a. Flow conditions may have changed since you completed the last transect. This may be the case in areas of high tidal variation or when the measurement section is downstream of a man-made structure that regularly alters the flow conditions. Constant stage or water level is not a clear indication the flow conditions have been maintained. b. Be sure to keep a written record of water level at the site during the discharge measurement. The water level can be referenced to a stream gauge that is permanently installed or to a staff that can be temporarily installed on the water’s edge. c. Make sure the site depth and location that you measured for the first transect match the measured values for the second transect in the data collected. You may have moved up or downstream since the last transect. d. Visible landmarks are always a good guide when making a measurement. Check the positional and depth measurements for both transects. e. Make sure the distance made good (DMG) is consistent between transects. f. The acceptable error between two to four measurements is typically less than 2 to 5%, but may be potentially higher depending on your application and the conditions. g. The edge positions should be the same or very close. Therefore the edge distances should be the same or similar for all transects. 5. Mobile Device a. Be sure that the RiverSurveyor Live for Mobile software is installed correctly on the Mobile device prior to field data collection. b. Please use the clear plastic lanyard with the Mobile device to prevent any water damage in the field. The Mobile device is not water resistant. Water damage is not covered by the warranty. c. The operational range can be affected by inclement weather. d. The RiverSurveyor Live for Mobile software will automatically activate the Bluetooth even if it is manually turned off. It can also be activated manually with these steps: a) Select Start on the Mobile device to open a list of Programs b) Select the Applications Icon to open an additional list of Programs c) Select Bluetooth and then Bluetooth Manager d) Select option 6, Settings e) Use arrow keys to activate Bluetooth 100 RiverSurveyor S5/M9 System Manual (July 2012) SonTek, a Division of YSI Inc. e. If Bluetooth or other issues persist, there are two ways to reset the mobile device a) If the phone is on: 1. Press Start 2. Scroll to and Select System Tools 3. Scroll to and Select either Master Reset or Master Clear 4. Press Yes (Left Soft Key) when Alert appears 5. Enter Master Code (normally 000000) b) If the phone is off or frozen: 1. Press and Hold the Center Select Key, while powering up the phone or Press and Hold the Z & E keys, while powering up the phone 2. The MASTER RESET screen will appear 3. Press Yes 4. This will restore the phone to factory settings 6. GPS a. Be sure the GPS antenna(s) have a clear view to the sky. Large trees or structures like bridges and buildings nearby can obstruct the satellite signals. Move away from any over-head obstructions to avoid multi-path errors or GPS dropouts. b. The GPS antenna on the ADP should be connected to the PCM with the coaxial cable. c. GPS Quality a) Zero indicates no GPS signal detected b) One indicates a non-differential GPS signal detected c) Two indicates a differential GPS (DGPS) signal detected d) Four indicates an RTK GPS signal detected d. GPS HDOP a) Horizontal Dilution of Precision is a GPS term used to describe the geometric strength of satellite configuration on GPS accuracy. b) Table 4 describes the possible values RiverSurveyor S5/M9 System Manual (July 2012) 101 SonTek, a Division of YSI Inc. Table 4: HDOP Value Descriptions HDOP Value Rating Description 1 Ideal This is the highest possible confidence level to be used for applications demanding the highest possible precision at all times. 2-3 Excellent At this confidence level, positional measurements are considered accurate enough to meet all but the most sensitive applications. 4-6 Good Represents a level that marks the minimum appropriate for making a goodquality discharge measurement. Positional measurements could be used to make reliable in-route navigation suggestions to the user. 7-8 Moderate Positional measurements could be used for calculations, but the fix quality could still be improved. A more open view of the sky is recommended. 9-20 Fair Represents a low confidence level. Positional measurements should be discarded or used only to indicate a very rough estimate of the current location. 21-50 Poor At this level, measurements are inaccurate by as much as 300 meters with a 6 meter accurate device (50 DOP x 6 meters) and should be discarded. e. RTK a) b) c) d) e) f) g) 102 Be sure the SS antenna is connected to the RTK Base Station Be sure the battery pack in the RTK Base Station is fully charged Be sure the RTK Base Station is within the 1 mile range limit of the ADP The GPS antennas should be mounted to the RTK Base Station and ADP. Connect time for Differential Quality GPS data is approximately 5 minutes Connect time for RTK quality GPS data is approximately 10 minutes Use the status icons to evaluate GPS (RTK and DGPS) Communications Quality. The tables below provide a quick reference for the software status icons and the LEDs on the PCM and RTK Base Station. RiverSurveyor S5/M9 System Manual (July 2012) SonTek, a Division of YSI Inc. Before RTK Lock: Scenario Base Station GPS RTK Lock Lock LED LED PCM GPS RTK Lock Lock LED LED Hardware failure in Base Station and PCM Hardware failure in Base Station and no GPS lock in PCM Hardware failure in Base Station with GPS lock in PCM No GPS lock in Base Station and hardware failure in PCM No GPS lock in Base Station and PCM RiverSurveyor S5/M9 System Manual (July 2012) Software Indicator for PCM GPS GPGGA GPVTG QualiIcon Icon ty 0 Status Action No power to GPS board in both PCM and Base Station Send back both the power/comm. boxes to the factory No power to GPS board in Base Station Send back RTK Base Station to the factory No power to GPS board in Base Station Send back RTK Base Station to the factory No power to GPS board in PCM Send back PCM to the factory No clear view of the sky for Base Station GPS antenna Make sure Base Station GPS antenna has clear view of the sky to get GPS lock 0 1 0 0 103 SonTek, a Division of YSI Inc. GPS lock in Base Station but no DGPS lock No GPS lock in PCM GPS lock in PCM but no differential lock GPS lock in PCM with RTK lock 104 Make sure Base Station GPS antenna has clear view of the sky to get DGPS lock 0 No clear view of the sky for PCM GPS antenna Make sure PCM GPS antenna has clear view of the sky to get GPS lock GPS antenna of the PCM may be near a bridge or some obstruction Move away from the bridge or a structure to get full view of all the available satellites to get differential lock Spread Spectrum radios in PCM and RTK Base Station are not working Send back PCM and RTK Base Station to the factory GPS antenna of the PCM may be near a bridge or some obstruction Move away from the bridge or a structure to get full view of all the available satellites to get RTK lock 1 GPS lock in PCM and no radio link between Base Station and PCM GPS lock in PCM with differential lock 0 No clear view of the sky for Base Station GPS antenna 1 Flashing Green 2 4 RiverSurveyor S5/M9 System Manual (July 2012) SonTek, a Division of YSI Inc. After RTK Lock: Scenario Base Station GPS RTK Lock Lock LED LED GPS Lock LED PCM RTK Lock LED GPS lock in PCM with DGPS lock GPS lock in PCM with DGPS lock and no radio link between Base Station and PCM Hardware failure in Base Station GPS lock in PCM with no DGPS lock and no radio link between Base Station and PCM No GPS lock in PCM RiverSurveyor S5/M9 System Manual (July 2012) Flashing Green Software Indicator for PCM GPS GPGGA GPVTG QualiIcon Icon ty 2 2 2 1 0 Reason Solution to get RTK lock GPS antenna of the PCM may be near a bridge or some obstruction Move away from the bridge or a structure to get full view of all the available satellites to get RTK lock PCM Spread Spectrum radio is out of range from Base Station radio Go back towards Base Station to get radio link for RTK lock Low battery voltage in RTK Base Station Change battery in Base Station to get RTK lock PCM Spread Spectrum radio is out of range from base radio for more than 45 minutes Go back towards Base Station to get radio link for RTK lock GPS antenna on the PCM may be under a tunnel or no view of sky Move away from the tunnel to get full view of all the available satellites to get RTK lock 105 SonTek, a Division of YSI Inc. Appendix E. Software Changes RiverSurveyor Live v1.50 1. Multi-Language Support RiverSurveyor Live software has full language and date/time/numerical support for the following languages: English Spanish Catalan Chinese (Simplified) French German Italian Korean Japanese Portuguese (Brazil) Turkish Hungarian The currently selected language is displayed in the toolbar at the top left on the main screen as an icon representing the flag for the language. The language can be changed at any time in the software by clicking on the flag and selecting the desired language from the drop down list. All text, dates, times and numbers are displayed in the current language. This means that numerical input must correspond with the language. For example: The number 1,000.1 when English is selected, must be input as 1.000,1 when German is selected. The Summary Report and ASCII export have Multi-Language support. All log files (Compass Calibration, System Test) are recorded in English for troubleshooting purposes. 2. All Graphs All graphs can be saved to the clipboard by right clicking on the graph and selecting Save to Clipboard from the popup menu. 3. Time Series Window The Time Series Window displays multi-parameter parameters such as individual BottomTrack Beam Depths. Additional parameters can be displayed including: GC-BC Bottom-Track beam Depths A space on either side of the Time Series Window has been added to illustrate that edges are present. 4. Track Window The Track Window now only displays Tracks that are practical for the current coordinate system. For example GPS-GGA and GPS-VTG cannot be displayed in XYZ or System coordinates. RiverSurveyor S5/M9 System Manual (July 2012) 107 SonTek, a Division of YSI Inc. Track Window settings are now global (i.e. a change to the setting on one graph affects ALL Track Windows). Settings include: AutoScale AutoRotate Show Velocity Vectors UTM Display Tracks When a GIS Map is loaded, right clicking on the Track Window displays the popup menu with a GIS sub-menu. On this menu are the following options: Zoom to Full Extents – Zooms out to display both the full map and all data Zoom to GIS Map – Zooms to the limits of the full map Zoom to Data – Zooms to the limits of all the data 5. Contour Window The Contour Window displays a tooltip for highlighted cells. A space on either side of the Contour Window has been added to illustrate that edges are present. 6. Profile Window When displaying Discharge in the Profile Window, the profile extrapolation extends to the bottom. 7. All Tables/Tabular Data All tabular data can be saved to the clipboard by right clicking on the table and selecting Save to Clipboard from the popup menu. This data can then be pasted into Excel or a text editor for ASCII export. The order of the columns can be changed and is saved in the application settings. The columns should be adjusted to match the user display preferences or requirements for ASCII export. Columns support multi-dimensional parameters (e.g. individual Bottom-Track Beam Depths). 8. System Tab Column selections have been updated. 9. Edges tab The Edges tab displays the Left Bank and Right Bank instead of the Start Edge and End Edge. 10. Times Series Tab A new tab titled Time Series has been added that displays five multi-parameter Time Series windows. 11. Discharge Measurement Summary Active Records (records that are checked) that have discharge values that are outside of +/5% of the mean discharge are now displayed in red. This feature can be enabled/disabled using the Highlight Records button on the Discharge Summary toolbar. The icons for the Start Edge - Left Bank and Right Bank have been swapped. The arrows now point in the direction of travel across the river. 108 RiverSurveyor S5/M9 System Manual (July 2012) SonTek, a Division of YSI Inc. The splitter for the Discharge Measurement Summary has been repositioned to display 6 measurements plus statistics by default. The Summary only displays data for completed transects. Export to .dis from discharge summary table includes Start Date. 12. Site Information Site Information can be edited/changed in post-processing and all changes saved to the workspace. Any modified values are displayed in green text – just like all other fields. Note: In some cases fields that have not been changed are displayed in green. This is because the original Site Information fields may have been initialized incorrectly. 13. Lock Measurements Individual measurements can now be locked. This means that once a measurement is locked by pressing the Lock Measurement button on the Processing Toolbox toolbar any changes to the settings will not be saved to the workspace. A measurement can be unlocked by pressing the Lock Measurement button a second time. 14. Processing Tools Heading Correction added to the Thresholds tool. This setting should be used for corrections to the Heading for individual transects. The Magnetic Declination should be constant for all transects at a site and the Apply to All button can be used for all transects without affecting individual heading corrections. Composite Tracks option added to the Thresholds tool. This setting by default is ON, in both software and firmware. When disabled the track is calculated only using the selected reference and not a combination of the best possible references. 15. System Test System Test is logged to a text file. 16. MATLAB Export Bottom-Track Velocity label is output as BT_Vel (previously Bt_Vel). Units are removed from the names and are stored in a separate substructure within each of the root structures. 17. Loading Data File Data files are loaded in chronological order. 18. Increased Precision on ALL Parameters The precision has been increased (from float to double) on all values used in the software. Float has a precision of about 6 digits and doubles have 15. This means that the previous version may have done some rounding when dealing with large numbers of samples. The most observable difference between 1.00 and 1.50 could potentially be in the third or more significant digit of the discharge, but in most cases the variation would be extremely small. RiverSurveyor S5/M9 System Manual (July 2012) 109 SonTek, a Division of YSI Inc. RiverSurveyor Live Mobile v1.50 1. Multi-Language Support RiverSurveyor Live software has full language and date/time/numerical support for the following languages: English Spanish Catalan Chinese (Simplified) French German Italian Korean Japanese Portuguese (Brazil) Turkish Hungarian Following are the steps to select a language: 1. When you run this version of the software for the very first time, the following language selection dialog will open before searching for any RiverSurveyor systems. 2. Select a language and click “SELECT” button. 3. The software will start searching for Bluetooth RS systems and it will operate just as v1.00. 4. If you close this application and start it again, the software will automatically start in the language selected. 5. If you would like to change the language again, click “Utilities” on main menu and click “Application Settings”. The following dialog will open: 110 RiverSurveyor S5/M9 System Manual (July 2012) SonTek, a Division of YSI Inc. 6. Click the “Change Language” button and it will take you to the language selection dialog. 7. Unlike the RiverSurveyor Live PC software, you can only change languages from “Application Settings” dialog. 8. To change decimal and thousand separators to particular locale in the software application, you have to change locale manually in the phone. You can do this by going to /Settings/Regional Settings/Locale. To display Chinese, Japanese and Korean fonts: 9. Windows mobile doesn’t have built-in support for Chinese, Japanese or Korean font. 10. Third party software called “CE-Star for SP” is available online to display Chinese, Japanese and Korean characters. All log files (Compass Calibration, System Test) are recorded in English. 2. Mobile Graphics One main addition in this version is mobile graphics in moving boat dialog. Measurement procedure is same but hotkeys 1, 2, 3 and 4 do not work to show different tabular views. To view different tabular and graphical views in moving boat dialog, follow the steps below: 1. Use up and down arrow keys to scroll between following views: a. Tabular b. Graphical 2. Use right and left arrow keys to scroll between pages in each view: a. Tabular – 4 Pages b. Graphical – 4 Pages (time series, profile, track and contour plots) 3. Summary Table Hotkeys 1, 2, 3 and 4 do not work to show different tabular summary options. To view different summary options in summary view, use right and left arrow keys to scroll between summary options. RiverSurveyor S5/M9 System Manual (July 2012) 111 SonTek, a Division of YSI Inc. RiverSurveyor Live v2.50 RiverSurveyor Stationary Live v1.50 1. Data Storage Data files are saved to the computer as well as the M9/S5 recorder. This eliminates the need to download files to process them if communications are not lost during a measurement. Files saved on the computer are appended with the letter ‘r’, i.e. *r.rivr. The system serial number is embedded in the compass calibration and system test file. 2. Temperature and Speed of Sound Correction Water temperature and speed of sound can be manually input prior to a measurement and in post-processing. 3. Data Display Beam frequency added to the SNR profile plot The following variables can be plotted on the Time Series tab and displayed in the Samples tab: Track Reference Code - 3 MHz, 1 MHz, GGA, VTG or invalid Depth Reference Code - VB, 3 MHz, 1 MHz or invalid Water Profiling Code - 3 MHz PC, 3 MHz IC, 1 MHz PC or 1 MHz IC 4. Lock Measurement A transect that is locked remains displayed as locked after the file is closed and reopened. 112 RiverSurveyor S5/M9 System Manual (July 2012) SonTek, a Division of YSI Inc. 5. Discharge Summary Report Water temperature, compass calibration, system test and moving bed test results are displayed. Comments for each transect are displayed. A change in the Site Information is updated properly. Measurement number is included. Date Created is replaced with Measurement Date. A locked transect is displayed as such. RiverSurveyor Mobile v2.50 RiverSurveyor Stationary Mobile v1.00 1. Data Storage Data files are saved to the mobile device as long as a memory card is installed. This eliminates the need to download files to process them if communications are not lost during a measurement. Files saved on the computer are appended with the letter ‘r’, i.e. *r.rivr. The system serial number is embedded in the compass calibration and system test file. 2. Temperature and Speed of Sound Correction Water temperature and speed of sound can be manually input prior to a measurement and in post-processing. RiverSurveyor Live v2.50 RiverSurveyor Mobile v2.50 1. Loop Method A USGS developed method to correct moving-boat discharge measurements using bottomtracking is integrated in the software. See Appendix H for details. RiverSurveyor S5/M9 System Manual (July 2012) 113 SonTek, a Division of YSI Inc. RiverSurveyor Live v3.00 RiverSurveyor Mobile v3.00 1. Smart Page Setup This feature provides a step by step guide through the system setup with real-time feedback to collect the most reliable discharge measurements. System functional test results (such as a compass calibration) as well as system settings are stored in the data file for easier access in post-processing. The initial screen after connecting now displays red or green icons depending on the status of system functional test and system settings. There is also an option to turn off/on the Composite Tracks feature. This setting by default is ON, in both software and firmware. When disabled the track is calculated only using the selected reference and not a combination of the best possible references. 2. GPS Compass Integration This feature lets you collect true north heading from a GPS Compass sensor. This capability lets you collect reliable heading data where magnetic interference is an issue and GPS coverage is available. In addition to true-north heading information, the GPS compass simultaneously outputs GPGGA (differential using SBAS) and GPVTG NMEA data strings, which are used by the M9/S5 to compute position and boat-speed. In addition, the firmware and software let you input the X and Y distance between the GPS antenna and the M9/S5. This allows the GPS compass antenna to be mounted virtually anywhere on the boat. The system requirements for using GPS compass sensor: a. Data output rate at 10 Hz b. Ability to output GPGGA, GPVTG and HEHDT NMEA sentences c. Communication baud rate of 38400 Note: To collect GPS Compass Heading data, you must obtain a security code that allows you to enable this feature in the system’s firmware. For details on obtaining this code, you will need to contact SonTek. 3. USGS SMBA Method The SMBA-method correction is used when a moving-bed is present and a DGPS or compass is not available or reliable. The calculations are all based on the “Algorithms Used in SMBA” by David S. Mueller and USGS calculations and procedures documented in the USGS “Scientific Investigations Report 2006-5079” by Mueller and Wagner. The USGS recommends a moving-bed test prior to the start of any discharge measurement and the SMBA method is routinely used to identify the magnitude of the moving-bed. The RiverSurveyor software now guides you step by step through this procedure, and then allows you to apply the correction to the appropriate discharge measurements without having to export data to the USGS SMBA program. This saves time and effort in the field and in the office whenever you use this procedure. 4. Additional Profile Extrapolation Methods This version of the firmware supports one additional top and bottom extrapolation method. The top methods are Constant, Power, and 3-point slope; the bottom methods are Constant, 114 RiverSurveyor S5/M9 System Manual (July 2012) SonTek, a Division of YSI Inc. Power, and No Slip. The new 3-point slope method for top extrapolation uses the top three cells to calculate a best-fit line (least squares regression); this slope is then applied from the top cell to the water surface. The new No Slip method for bottom extrapolation uses the cells available in the lower 20% of the water depth to determine a power-fit forcing it through zero at the bed. In addition, this allows you to input the percentage of lower cells to calculate power-fit. RiverSurveyor Live v3.00 RiverSurveyor Stationary Live v2.00 1. ASCII Export The Processing Toolbox includes the ability to export three ASCII comma delimited files (.vel, .sum and .snr). These files contain cell velocity data, cell SNR data and summary of various parameters. The files are exported to the same directory as the recorded measurement file. The column headers and units are listed at the top of the CSV files. 2. CastAway CTD Integration The CastAway CTD is a sophisticated CTD that makes it simple to improve the accuracy of RiverSurveyor discharge measurements by integrating seamlessly with the RiverSurveyor Live software. This new feature provides a turnkey solution for applying sound speed correction to ADCP data. The built in GPS in CastAway CTD marks the location and timestamp of the sound speed profile and allows the software to automatically select which sound speed profile to use for your discharge calculation. The software displays the CTD profile data and the location of CTD cast on the ship track plot. See Appendix I.CastAway CTD Integration for further information. RiverSurveyor S5/M9 System Manual (July 2012) 115 SonTek, a Division of YSI Inc. RiverSurveyor Live v3.50 1. Improved Compass Calibration Feedback The compass calibration feedback for the new SonTek compass (v2.00 or later) is improved. The compass calibration dialog includes a time series chart and graphical interface to guide the user to perform the best possible compass calibration. See Section 6.9.1 for details about the Compass Calibration. 2. Modified Algorithm for USGS Loop Method The USGS Loop Method was updated to support the latest algorithms (MATLAB v4.03) from the USGS Office of Surface Water (OSW). New error messages and warnings are implemented to collect and analyze loop method data correctly. See Appendix H for details about the Loop Method. RiverSurveyor Stationary Live v2.50 1. Under Ice Measurement Feature This feature lets you collect and analyze a stationary measurement under ice. 2. Profile extrapolation (Station by Station) 1. Ability to change profile extrapolation for each station. 2. Following extrapolation methods are available for bottom fit: a. Power fit b. Constant c. No Slip 3. Following extrapolation methods are available for top fit: a. Power fit b. Constant c. 3 point slope (open water) and No Slip (under ice) 4. Ability to apply profile extrapolation to all stations globally 5. Default profile extrapolation for top fit and bottom fit a. Open water – power fit for entire profile b. Ice or Ice/Slush – No Slip with 20% 116 RiverSurveyor S5/M9 System Manual (July 2012) SonTek, a Division of YSI Inc. 3. Pre-Deployment Template 1. Ability to create station template from start page 2. Ability to save station template from start page 3. Ability to save station template from already collected data file 4. Ability to retrieve station template and use it for data collection 4. Additional Features 1. New layout of plots in transect tab 2. Added time series tab 3. Added ability to input transducer depth below ice for each station 4. Re-organized station dialog to help the application flow for ice measurement 5. Ability to access station dialog from contour plot 6. Added %Q time series graph in transect tab with % as text 7. Added water temperature (Independent) to the quality settings dialog 8. Added instrument alignment parameter to help the user to align the M9/S5 properly under ice 9. Added functionality to open/save site information 10. Increased number of characters to 250 for comments in Site information. RiverSurveyor S5/M9 System Manual (July 2012) 117 SonTek, a Division of YSI Inc. Appendix F. SmartPulseHD™ Principles SmartPulseHD™ is name chosen for the new profiling capabilities of the RiverSurveyor M9 and S5. In general terms, it works as follows: - The RiverSurveyor continuously tracks water velocity and depth. Based upon these values, it selects the optimum processing configuration. - At any given time, the system is sending multiple pulse types, potentially at multiple frequencies, using different processing techniques to achieve the optimum system performance. - For the M9, up to three frequencies are used (3 MHz, 1 MHz, 0.5 MHz); for the S5, up to two frequencies are used (3 MHz, 1 MHz). - A variety of different ping types and processing techniques: bottom tracking, bottom detection, incoherent, pulse coherent, and broadband. Many of these pings types are used in combination with each other. The exact pings types being used at any given time will depend on the operating conditions. - The system tracks velocity and depth on a second-by-second basis, and update the ping types and processing methods as needed based on changing conditions. For the S5, two primary data types are output. - - When the water is sufficiently shallow and slow, the system reports data from 3 MHz pulse coherent pings using a 2 cm cell size. o Maximum operating depth is about 1.5 m. o At a depth of 1.5 m, the maximum velocity is about 0.4 m/s. The maximum velocity increases significantly in shallower water. In water depths and velocities greater than above, the system uses 3 MHz incoherent pings with the cell size optimized based on the current water depth. o Depths less than 2 meters use 0.1 m cells o Depths 2-4 meters use 0.2 m cells. o Depths greater than 4 meters use 0.4 m cells. For the M9, several different data types are output. - - - When the water is sufficiently shallow and slow, the system reports data from 3 MHz pulse coherent pings using a 2 cm cell size. o Maximum operating depth is about 1.5 m. o At a depth of 1.5 m, the maximum velocity is about 0.4 m/s. The maximum velocity increases significantly in shallower water. In moderate depth/velocity conditions, the system reports data from 1 MHz pulse coherent pings using a 6 cm cells size. o Maximum operating depth is about 5.0 m. o At a depth of 5.0 m, the maximum velocity is about 0.4 m/s. The maximum velocity increases significantly in shallower water. In water depths less than 5.0 m with velocities greater than the above, the system uses 3 MHz incoherent pings with the cell size optimized based on the current water depth. o 118 Depths less than 2 meters use 0.1 m cells RiverSurveyor S5/M9 System Manual (July 2012) SonTek, a Division of YSI Inc. - o Depths 2-4 meters use 0.2 m cells. o Depths greater than 4 meters use 0.4 m cells. In water depths greater than 5.0 m, the system uses 1 MHz incoherent pings with the cell size optimized based upon the current water depth. o Depths less than 10 meters use 0.5 m cells o Depths 10-20 meters use 1.0 m cells. o Depths greater than 20 meters use 2.0 m cells. The RiverSurveyor SmartPulseHD uses a powerful CPU with multi-thread parallel processing routines; some key advantages from this are listed below. - The RiverSurveyor runs multiple pings types from multiple frequencies at the same time. At any given site, the RiverSurveyor may use a total of 8-10 different ping types; at any given moment, it is typically running 3-5 ping types simultaneously. - The parallel processing capabilities allows the system to collect new acoustic pings while at the same time analyzing data from the last set of pings. This continuous evaluation of data allows the system to modify operation, on a second by second basis, to ensure it always uses the best ping types for the conditions at that moment. - In the case of the M9, the RiverSurveyor has the added advantage of using multiple acoustic frequencies for velocity profiling. It combines different frequencies and different Doppler processing techniques to optimize performance for the current operating conditions. The added power and flexibility provided by the additional acoustic frequency is significant, and makes a major difference in final instrument performance. - The speed of the CPU means that the RiverSurveyor has no limits in the type of processing or analysis that is done. The final performance of the RiverSurveyor is limited only by the physics of underwater sound. SmartPulseHD processing should be able to automatically adapt to any operating condition without any user input. Despite this (as a safety precaution), the updated RiverSurveyor Live PC and Mobile software includes an option to disable SmartPulseHD processing. - This option should be needed only rarely for very particular conditions where the SmartPulseHD algorithms may fail. - We have not yet encountered conditions where SmartPulseHD does not work properly, but it is conceivable. - If you use the RiverSurveyor Live option to disable SmartPulseHD processing, the system will run incoherent pings only exactly as done with previous firmware releases. RiverSurveyor S5/M9 System Manual (July 2012) 119 SonTek, a Division of YSI Inc. Appendix G. Stationary Measurement Software G-1. Overview The SonTek RiverSurveyor Stationary Live software uses an alternative approach to the standard moving boat method of measuring water currents and discharge. Both methods use an Acoustic Doppler Profiler (ADP) to measure water currents. When using the RiverSurveyor Stationary Live software, however, the ADP operates from a fixed mounted position, stationary vessel, or platform (such as a SonTek Hydroboard or Tri-hull boat). This measurement procedure is similar to that used for the SonTek FlowTracker and is in adherence to ISO velocity area measurement techniques. Measurements are made at stationary positions, usually along a tagline, to obtain a more precise representation of the mean velocity profile and therefore determine discharge. Stationary-Measurement can be used in a wide range of applications such as: G-2. Discharge Measurements Current Profiling across transects Under Ice Measurements (available in future release) System Requirements RiverSurveyor Stationary Live requires the following specifications for the PC. Windows Vista or Windows XP 1.6 GHz processor 1 GB memory 1 GB disk space 1024 x 768 Screen Resolution G-3. Installation To install the RiverSurveyor Stationary Live software on your PC, insert the distribution CD into your CD-ROM drive. The program should automatically start and display the Installation Menu (Figure 106). If the installation menu does not appear in a few seconds, click Start|Run on your PC and type D:\install.exe, where d:\ is the letter of your CD-ROM drive. 120 RiverSurveyor S5/M9 System Manual (July 2012) SonTek, a Division of YSI Inc. Figure 106. Installation Menu Click the Install RiverSurveyor Stationary Live option. The installation wizard (Figure 107) will display step-by-step instructions to install the software. Figure 107. Desktop Installation Follow the on screen instructions to complete installation of the software. You are now ready to use RiverSurveyor Stationary Live to make a measurement. G-4. Making a Measurement The primary purpose of the Stationary-Measurement system is to measure the total discharge of a river cross-section. Because velocity measurements are made from a stationary position, the system does not require bottom-tracking or DGPS referenced velocity measurements. This becomes advantageous when one or both reference techniques are unavailable due to site conditions. RiverSurveyor S5/M9 System Manual (July 2012) 121 SonTek, a Division of YSI Inc. Stationary discharge measurements also provide additional opportunities for measurement applications such as: Accurate discharge measurements under ice Velocity profile measurements in conditions where there are significant temporal changes in flow conditions (e.g. pulsing rivers, moving beds and channels with conditions of variable moving beds). This also includes areas of significant turbulence (such as behind bridge pilings) where instantaneous or moving vessel measurements will have significant inaccuracies. G-4.1 Mid-Section Measurement Procedure The procedure for making a discharge measurement follows the well-established methodology as outlined by the U.S. Geological Survey (USGS) for Discharge Measurement by Conventional Current Meters (ISO standards 768 (1997) and 9196 (1992)). This method is also referred to as the “Mid-Section method” of computing discharge and is the same method adopted by the SonTek FlowTracker. . The mid-section method involves making a series of velocity and depth measurements at a specific number of locations (more commonly known as stations, panels or verticals) across a river cross-section. At each station, the depth and mean velocity profile are measured. The depth is computed using either the 4-velocity beams, the low-frequency vertical beam, or manually measured (using a rod or other device) and entered into the software. The mean velocity profile for each station is computed from data from all valid cells above the riverbed. The width of a single station is determined to be the sum of half the distance to the previous station and half the distance to the following station. This method assumes that the velocity profile at each station represents the mean velocity for the entire rectangular station area. Loc0 Loc1 Loc2 Loc3 Loc4 Loc5 Loc6 Loc7 Loc8 Loc9 W1 W2 W3 W4 W5 W6 W7 W8 W9 Dep1 Dep2 Dep3 Dep4 Dep5 Dep6 Dep7 Dep8 Dep9 Loc10 Loc11 Loc12 W10 W11 Dep10 Dep11 Area1 Area11 Area2 Area6 Area 7 Area8 Area9 Area10 Area3 Area Area5 4 Station Location = Loci Station Water Depth = Depi Station Width = Wi = (Loci+1 - Loci)/2 + (Loci - Loci-1)/2 Station Area = Areai = Wi * Depi Mean Station Velocity = Vi Station Discharge = Qi = Areai * Vi Total Discharge = Sum( Qi ) Figure 108. Basic River Discharge Measurement Method Each station is measured for a significant time to remove any environmental and temporal variation in the water velocities. Typically within the USGS, the recommended duration of measurement for a single station is 40 seconds. However, in particularly turbulent waters, extremely lowvelocities, or in areas or rapidly changing water-level, a longer period may be required. This 122 RiverSurveyor S5/M9 System Manual (July 2012) SonTek, a Division of YSI Inc. recommended sample time might vary from country to country and even within different organizations. The basic procedure for making a discharge measurement using the Stationary- Measurement system is as follows: 1. Setting up the Location A measurement section is selected based on the criteria outlined in Section G-5 below. A graduated tag line is strung across the river. In an ideal measurement site, the flow should be perpendicular to the tag line at all points with no flow reversals or obstructions. For ice measurements, a series of holes (one for each station) are drilled in the ice. The spacing of the stations along the tagline is selected so as to provide about 20-30 stations. Each of these stations should also be positioned so that no station is expected to yield more than 10 % of the total discharge. Ideally, no station should have more than 5% of the total discharge. This generally means that the stations are not equally spaced but are instead spaced closely together in deeper and high velocity areas and further apart in shallower and slower flowing areas. The magnetic-north heading (azimuth) of the tagline is measured. This is the compass orientation of the tagline in the direction of the right river bank. Setting the tagline azimuth is important because it allows the M9/S5 to rotate freely around the sample location and still measure the correct mean-station velocity by using its internal compass to resolve the true direction of velocity and then calculate the normal velocity to the tagline. In the example to the right, the tag line is oriented to the southwest (225º). The azimuth should be measured with the internal compass in the ADP (preferred) or a hand-held compass. 2. Setting up the Software Connect to the ADP through the software. Enter the site and system information into the software. This information includes the site name, number, location, starting bank, gauge heights, azimuth, velocity-reference method, depth reference method, rated discharge and any additional weather or measurement conditions comments. 3. Make the Measurement The operator starts at one edge (the start bank), recording the starting-edge location, water depth and gauge heights. The operator then proceeds to the first station and enters the station location, transducer depth, and gauge heights (not required).. If ice is present, the values for the ice thickness, depth of water and slush thickness should also be entered. The M9/S5 is positioned with the transducers submerged and the system as vertical as possible. Ideally the system will be mounted to a platform, vessel, or mounting structure. Data collection begins and the M9/S5 measures the 3D current velocities and bottom depth throughout the water column. Only the component of water velocity perpendicular to the transect line (or azimuth) is used to ensure proper discharge calculations, regardless of the flow direction. This normal component of the velocity is known as the “Normal Velocity”. The true flow direction RiverSurveyor S5/M9 System Manual (July 2012) 123 SonTek, a Division of YSI Inc. or “True Velocity” is still measured, recorded and will be displayed on screen or as a comparison with the Normal Velocity. At the end of the averaging time for the measurement, the discharge is calculated using the formula shown in Figure 108. Repeat the steps above at each station along the transect until the last station is completed. Press the End Section button when the last station is completed. The ending-edge location and depth are recorded. 4. Post Measurement G-5. The quality of the entire measurement is assessed and recorded. The total discharge (the sum of all station discharges), the total area and mean velocity are displayed with graphs of parameters for the entire transect. A report of the entire measurement can then be generated for review. o The report includes the estimated uncertainty of the final discharge calculation; the uncertainty calculation is described in G-8.1. Selecting a Measurement Location The key issues to consider when selecting the location of your measurement cross-section are: G-6. Select an area of relatively uniform and steady flow. Try to avoid areas with standing eddies or strong turbulence. Note that a measurement may still be made in these areas however it may take longer to establish a mean profile (i.e. the averaging interval may need to be increased). The cross-section should have gradual changes in depth. Flow along the riverbanks should be low or close to zero. M9/S5 Mounting and Instrument Orientation Mounting: The mount to which the M9/S5 will be attached should meet the following criteria as closely as possible. Please remember that while the transducer depth should be as shallow as possible, the transducers must be completely submerged at all times during data collection. The key to good Stationary-Measurement data collection is that the transducers remain in a position that is relatively constant in location to the riverbank. 124 Rigid and level when the transducer is in the water to minimize vibration. For some applications it is advantageous that the mount be easily retractable when the vessel is moving from one station to the next. As with a moving vessel measurement; on small to mid-sized boats (10’ – 25’) - the mount can extend over the bow; on larger boats, it is preferable to mount the ADP on either the port or starboard side near mid-ship. Transducer depth should be adjustable. Constructed of non-ferrous material (ideally aluminum). Make sure the M9/S5 is at least a few meters away from the engine or any other ferromagnetic objects mounted to the boat to ensure proper operation of the compass (if used in ENU orientation). The vessel maintains as much as possible a constant and steady position and orientation to the riverbank. Note: Bottom-tracking velocity reference is preferred if there is significant motion of the vessel during data collection. RiverSurveyor S5/M9 System Manual (July 2012) SonTek, a Division of YSI Inc. Instrument Orientation: This is important when making measurements with using the XYZ orientation (i.e. similar to the FlowTracker reference) and/or when using the internal compass (ENU) to determine the tagline azimuth. In the first case, the x-velocity measured by the system is used to compute discharge for that particular station. This will require that the systems x-axis is pointed facing downstream as shown in Figure 109 below. In this orientation, the connector located on the M9/S5 housing will be facing directly downstream. In addition, the M9/S5 should not be allowed to rotate during data collection (similar to using a FlowTracker). Figure 109. Instrument Orientation In most cases, the ENU orientation will be preferred during data collection. The primary reason is that when using the ENU orientation the system will always measure the true velocity and the normal velocity regardless of its angle to the tagline. This ability is helpful in many river conditions especially when you are deploying the system from a small boat with a line. In this case, the boat can freely rotate into the current as it changes in the cross-section and using the internal compass it will accurately compute the true velocity and normal velocity. The same system orientation shown in the figure above must be used when measuring the tagline azimuth using the internal compass of the M9/S5. This procedure (Get Tagline Azimuth) is described in Section G-7.4. RiverSurveyor S5/M9 System Manual (July 2012) 125 SonTek, a Division of YSI Inc. G-7. Software Operation G-7.1 Connecting to the System Ensure that all other software programs that access the serial ports are closed before starting the software. Figure 110. Main Menu Start the software from the Start button and then Programs | SonTek Software | StationaryMeasurement. The start screen will be displayed as shown above in Figure 110. Connect to your system by selecting the Connect to RiverSurveyor System (Ctrl-N). This will display the Select Port dialog. Select the serial port that your system is connected to and click the Connect button or press the Enter key. Note: If you are communicating using a Parani BlueTooth connection select the check box in the lower left hand corner as shown in Figure 111. Figure 111. Communications Port 126 RiverSurveyor S5/M9 System Manual (July 2012) SonTek, a Division of YSI Inc. The Start Page screen, shown below in Figure 112, will be displayed once communication with the system has been established. Figure 112. Start Page This screen is used to input site information, program system settings, rated discharge (to compute percent measured for each station), and perform utility functions. Once you have input this information you can press the Start a Measurement (F5) button to begin your measurement. G-7.2 System Configuration System configuration displays the system type (M9 or S5), the system serial number, and the firmware version for reference purposes. No inputs are required in this section. G-7.3 Step 1: Site Information The Site Information dialog covers information related to the site itself, including the name and personnel involved in the measurement. It is recommended that all fields on this page be filled in prior to starting the measurement. This data will be displayed in the Discharge Measurement Report, and will improve both the record keeping and data review processes. The Site Information dialog (Figure 113) will be displayed. Press the Tab key to step through each of the displayed parameters. RiverSurveyor S5/M9 System Manual (July 2012) 127 SonTek, a Division of YSI Inc. Figure 113. Site Information G-7.4 Step 2: System Settings Click System Settings to input Tagline Azimuth, Salinity, Track Reference, and Depth Reference. This will display the System Settings dialog (Figure 114). Just like the Site Information dialog, press the Tab key to step through each of the displayed parameters. Figure 114. System Settings Tagline Azimuth: It is important to set the tagline azimuth if you are using the ENU orientation. The tagline azimuth (Figure 115) is the heading (direction) in degrees from magnetic north of the tagline going towards the right bank. The normal velocity is used to compute discharge for each station. The following illustration shows the proper orientation of the M9/S5 (connector should always be oriented pointing downstream), the tagline azimuth relative to magnetic north and the REW, and the downstream flow direction. 128 RiverSurveyor S5/M9 System Manual (July 2012) SonTek, a Division of YSI Inc. Figure 115. Tagline Azimuth If you have previously determined the tagline azimuth for this site then simply input that value and proceed to the next tab. If you do not know the azimuth you can use the system's internal compass to determine the tagline azimuth by pressing press Get Tagline Azimuth which will display the Get Tagline Azimuth dialog, shown below in Figure 116. Figure 116. Get Tagline Azimuth RiverSurveyor S5/M9 System Manual (July 2012) 129 SonTek, a Division of YSI Inc. Follow the simple procedure outlined in the Get Tagline Azimuth dialog as follows: 1. Align the M9/S5 power and communications connector to point directly downstream. If you are deploying the instrument from a floating platform (i.e. boat, tri-hull, hydroboard, etc…) then simply lower the boat into the water and allow it to align itself with the flow. This is typically best done in a location near the center of the river in a section of flow that flowing directly downstream. 2. Once the M9/S5 has been correctly aligned with the river and is relatively steady press Start to collect data. During this time the compass will display instrument heading at 1-second intervals, average instrument heading, computed tagline azimuth, and the number of samples (in seconds) as shown in Figure 117. After 20-30 seconds of data collection press Stop and close the dialog. The tagline azimuth field in the system settings dialog box will automatically be updated with the tagline azimuth measured using Get Tagline Azimuth. Figure 117. Get Tagline Azimuth 130 RiverSurveyor S5/M9 System Manual (July 2012) SonTek, a Division of YSI Inc. Salinity: Input the water salinity (0 – 34.5 ppt) at the transducer face (freshwater = 0, sea water = 34.5 ppt). Figure 118. Salinity Track Reference: Select either System (default) or Bottom-Track as a track reference Figure 119. Track Reference In most cases, because the M9/S5 is stationary during a measurement the System track reference will be preferred. Selecting Bottom-track as a track reference is also acceptable for discharge calculations; however it will typically be used as a check against the stationary reference in post-processing for quality assurance purposes. Both System and Bottom-Track reference data are recorded and can be changed in post-processing if desired. RiverSurveyor S5/M9 System Manual (July 2012) 131 SonTek, a Division of YSI Inc. Depth Reference: Select either Vertical Beam or Bottom-Track as a depth reference Figure 120. Depth Reference The M9/S5 measures depth using a center vertical beam and also a 4-beam averaged depth. In most cases, the vertical beam will be preferred to provide a depth reading directly below the instrument. If the vertical beam depth measurement is unavailable then the M9/S5 will automatically use the 4-beam Bottom-Track depth. Once the azimuth, salinity, track and depth reference have been set press OK to continue. G-7.5 Step 3: Rated Discharge The rated discharge used to calculate the percent discharge measured for each station. To input the rated discharge click the update button and input the correct value. The percent measured discharge is used as a data quality parameter to assist in determining the correct width of a section. G-7.6 Utilities The Utilities section includes links to the Compass Calibration, Set Time, Beam Check, System Test, and Update Firmware. Please refer to Section 6.9 of the manual for a complete description of each. G-7.7 Data Collection To begin data collection, press the Start a Measurement (F5) button located towards the upper left hand side of the screen. The Start Edge dialog box will open as shown in Figure 121. 132 RiverSurveyor S5/M9 System Manual (July 2012) SonTek, a Division of YSI Inc. Figure 121. Start Edge Press the Cancel button to return to the system settings page and review the current system and data collection settings. The Start Edge (Station 1) dialog will show several parameters, but only the relevant fields will be enabled in this step. Input the correct start bank (Left or Right), the starting location (edge of water on river bank measured from the tagline), the water depth at the start location (0 is typically used for a slope bank), velocity correction factor (1 is typical for most start and end locations), gauge height and auxiliary gauge height (i.e. water-level) if known, and the observation time of the gauge height reading. Once the fields are updated press the OK (Enter) button and move the instrument to the first measurement location (Station 2). The station dialog will automatically open. The instrument will also start “Pinging” showing you the SNR (signal to noise ratio) profile plot for each beam and the number of valid cells for measurement (as shown in Figure 122). This information is provided to help make a better determination of the first measurement location. In addition, once the measurement is complete the system continues “Pinging” and displays this data as you move it to the next measurement location. Typically, it is recommended that you have a minimum of 2 valid cells and that the SNR profile plot shows the beams are measuring similar depths and are not obstructed by something below the water surface. RiverSurveyor S5/M9 System Manual (July 2012) 133 SonTek, a Division of YSI Inc. Figure 122. Raw Sample Display Once the M9/S5 is in position, enter all relevant information into the appropriate field. On the far right side of the station dialog is the graphical display of the vertical water column for the Station. This graphical display is known as the Station Window and is visible for all stations. The following is a brief description of each field in the station dialog: Location: Distance measured from start bank using tagline. User Depth: Only required if M9/S5 depth measurement is not available. Transducer Depth: Depth of instrument below water surface Screening Distance: Screens velocity cells near surface that may be contaminated due to interference from large boat hull. Coordinate System: ENU or XYZ. ENU enables compass and references measurements from magnetic north. XYZ disables compass and references measurements from the internal system axis. Coordinate reference can be changed on a station by station basis if required. Averaging Time: Time data will be collected and averaged for each station. Longer averaging times in general tend to better represent a true mean discharge in the river. For example USGS recommends minimum 40-seconds. Velocity Correction Factor: 0 – 1. Value of 1 is most common. Please refer to your agencies’ guidelines for reducing this factor. Gauge Height: Observed water level from a known datum at your measurement location. Not required for data collection. Auxiliary Gauge Height: Second water-level reference measurement from a similar datum. Not required for data collection. Water Surface Type: Open Water, Ice Cover or Ice with Slush. Open Water is the only option available in this release. Ice thickness: Available in future release. Water Surface to Bottom of Ice: Available in future release. Water Surface to Bottom of Slush Ice: Available in future release. Island Edge: Select to insert an island in the measurement section 134 RiverSurveyor S5/M9 System Manual (July 2012) SonTek, a Division of YSI Inc. Figure 123. Station Dialog Press the Measure button to begin collecting data, Cancel to go back to review the measured station information, or End Edge to input the end edge location information. If you press Cancel to go back, you must press Next Station (F5) in the upper left hand corner of the window to proceed with the measurement. Once the station measurement is complete, a Measurement Results dialog (shown in Figure 124) will automatically display a summary of the measurement. Review this information and then press Accept to proceed to the next station or Repeat to measure the same station again. RiverSurveyor S5/M9 System Manual (July 2012) 135 SonTek, a Division of YSI Inc. Figure 124. Measurement Results Duplicate this process for the entire transect. When you have completed data collection of the last station, press End Edge to input the ending edge location. Press OK to end the measurement. Once the measurement has ended you will not be allowed to insert any additional stations. If you want to continue your data collection, press Cancel then press Next Station (F5). Once all of the Stations and the End Edge have been entered, press the End Transect button to complete the measurement. The discharge summary report will be automatically generated and displayed. Station Data Collection Once the Measure button has been pressed, the system will start up and begin profiling. The station data will be displayed at 1-second intervals and displayed similar to the screen below. The screen layout is similar to the moving-boat software. Icons in the upper left of the screen indicate the operation and system performance on a second by second basis. A summary table is located below the icons to provide real-time and summary information for the particular station. The two profile plots on the lower left show the SNR (averaged signal-to-noise ratio) and normal velocity (averaged). The upper time-series plot displays quality assurance information, the middle plot display the normal and true velocity for each station, and the lower graph display the normal velocity contour. The contour plot can be changed to display several other variables if required. After the first profile is collected, the graphs and tabular results of the measurement will be displayed and will continue to update as additional data is collected. 136 RiverSurveyor S5/M9 System Manual (July 2012) SonTek, a Division of YSI Inc. Figure 125. Data Collection Screen Inserting a Station The operator can insert a station at any time during the measurement. In the station dialog, the operator will input a station location to be inserted and click Measure. The inserted station will be sorted and included in the total discharge calculation. In order to prevent data loss in the event of a power, communications or computer issue during a measurement, the data file stored on the computer can be reopened to complete the measurement. Island Edges If a river is split into multiple channels, any internal island(s) must be accounted for in the discharge calculation. The stations at each edge of the internal island(s) are treated like the river edges. The operator can click the Island Edge box at the bottom of the station dialog window. The window header will change from Station to Island Start Edge as shown in Figure 126. Enter the location, depth and other information where appropriate. Click OK (Enter) and the software will prompt the operator to enter Island End Edge information automatically before continuing to the next measurement station. RiverSurveyor S5/M9 System Manual (July 2012) 137 SonTek, a Division of YSI Inc. Figure 126. Island Edge 138 RiverSurveyor S5/M9 System Manual (July 2012) SonTek, a Division of YSI Inc. G-8. Discharge Measurement Report The Discharge Measurement Report is a formatted report-style summary of the current measurement. Click the Report button in the toolbar to display the Report. The Summary is designed to be informative, easy to use and output the data in exactly the same format as it is entered. If the report is too large for the monitor on your computer use the vertical scrollbar on the right to move the report up and down. Figure 127. Discharge Measurement Summary Report RiverSurveyor S5/M9 System Manual (July 2012) 139 SonTek, a Division of YSI Inc. G-8.1 Discharge Uncertainty Calculation The Discharge Measurement Report includes the estimated uncertainty of every discharge measurement. This calculation is done two different ways: Statistical or ISO. The Statistical (abbreviated Stats) uncertainty calculation uses a method developed by researchers at the U.S. Geological Survey. In general this provides the most reliable indicator of measurement quality. The ISO method is based on the international standard and provides the results of a published, standard technique. In some cases it may not provide as reliable an indicator of data quality, as it makes limited use of data from the site. The uncertainty calculations are based on several different parameters. In addition to overall uncertainty, the calculation looks at the contribution of each parameter. Accuracy: the accuracy of RiverSurveyor velocity. Depth o In the Statistical calculation, this term includes both uncertainty in the depth measurement and the effect of changes in depth between stations. o In the ISO calculation, this term includes only the uncertainty in depth measurements. 140 RiverSurveyor S5/M9 System Manual (July 2012) SonTek, a Division of YSI Inc. Velocity In the Statistical calculation, this term includes both uncertainty in the velocity measurement and the effect of changes in velocity between stations. o In the ISO calculation, this term includes only the uncertainty in velocity measurements. Width: estimated uncertainty in width measurements. Method: estimated uncertainty from not measuring velocity throughout the entire water column (velocity near the surface and bottom must be estimated). o Used for the ISO calculation only. Number of stations: estimated uncertainty from measuring velocity and depth at a limited number of locations across the river. o Used for the ISO calculation only. o The Discharge Measurement Report shows both uncertainty calculations and the contribution of each parameter to the overall uncertainty. RiverSurveyor S5/M9 System Manual (July 2012) 141 SonTek, a Division of YSI Inc. Appendix H. Loop Method Introduction: The “Loop Method” is used for correcting discharges biased by a moving bed. The RiverSurveyor Live moving-boat software uses calculations and procedures documented in the USGS Scientific Investigations Report 2006-5079 by David S. Mueller and Chad R. Wagner, prepared with the cooperation of Environment Canada (http://pubs.usgs.gov/sir/2006/5079/). This USGS report describes in detail the procedures and techniques for collecting Loop Method field data and the proper calculations used to correct discharge for a moving-bed bias. The report also addresses the sources and magnitude of measurement uncertainty when performing this type of calculation. Based on field measurements from 13 locations the report concludes that when properly applied the Loop Method represents a valid alternative to the use of DGPS when measuring discharge in stream with moving-bed conditions. SonTek highly recommends that you review this document before applying the Loop Method to your data sets. It should be noted: All computer code and output analysis used for this loop-method calculation was provided to SonTek/YSI, Inc. by the USGS Office of Surface Water (OSW). As such, moving-bed results provided using the existing MATLAB program (v4.03 or later) developed by David S. Mueller with the USGS OSW will produce identical results when computed using the RiverSurveyor Live software. The actual moving bed velocity calculation is based on the “distributed correction” method which is described in detail in the report mentioned above. Background For moving-boat discharge measurements, the RiverSurveyor M9/S5 measures boat speed using either bottom-tracking or an integrated DGPS system. Bottom-tracking requires that the riverbed be stationary (motionless) in order to properly compute boat-speed. During certain flow conditions, sediment will be transported along the riverbed (i.e. a moving-bed) and will produce a bias in the bottom-tracking results which will ultimately result in a biased discharge measurement. DGPS is a good alternative to bottom-tracking because it is not affected by the movingbed. In some instances DGPS will not be available or reliable at your measurement site. As an alternative, when used properly the Loop Method can be used to correct the bottom-tracking bias produced by the moving bed. The Loop Method is used to correct discharges that are biased by sediment transport (movingbed) when bottom-tracking is used as a reference to measure boat speed. The basic premise is based on a “back and forth crossing closure error” where the apparent upstream movement of the ship-track is used along with the measurement time to determine the mean velocity of a moving bed. In this case, the discharge will be biased LOW by a certain percentage based on the velocity magnitude of the moving-bed. Loop Method Procedure The Loop Method procedure described here follows explicitly the step-by-step procedure documented in the appendix section of the USGS Scientific Investigations Report 2006-5079 by Mueller and Wagner. SonTek/YSI recommends that this step-by-step procedure is reviewed prior to attempting a Loop Method measurement using the RiverSurveyor Live software. 142 RiverSurveyor S5/M9 System Manual (July 2012) SonTek, a Division of YSI Inc. The Loop Method can be performed using either the PC or mobile Riversurveyor Live software. The procedure is essentially identical. The only difference is the graphical screens available in the PC software. In addition, following the completion of the loop measurement results will only be available using the PC software. Although moving-bed results are available prior to the discharge measurements to be performed, the actual “Loop Correction” will only be applied to discharge measurements in postprocessing (if required). In addition, if the moving bed is determined to be insignificant it will not be possible to apply the correction to the processed data – this is in accordance to USGS procedures. Step-by-step procedure: 1. Start the RiverSurveyor Live PC or mobile software and connect to the M9/S5. 2. In the start menu, input all necessary parameters as usual to measure discharge. 3. Calibrate the compass (Utilities menu). A proper compass calibration is required to produce reliable results when using the Loop Method correction as the compass is used to determine the tagline azimuth. 4. Establish a starting point in the river. It will be helpful to select this location such that the boat can easily be controlled when starting and ending a measurement. Keep in mind that you will need to return to this same location in order to compute properly the moving-bed speed—the greater the difference between the start and end locations, the greater the uncertainty in the Loop Method’s results. Also, the point does not need to be located as near to the bank as a regular discharge measurement. 5. Click on Loop Method located in the Utilities Menu of the PC software as shown in Figure 128. It is in the Main Menu when using the mobile software. The instrument will begin profiling. RiverSurveyor S5/M9 System Manual (July 2012) 143 SonTek, a Division of YSI Inc. Figure 128. Utilities Menu - Loop Method 6. In the PC software, a Loop Method window will appear in front of the transect page as shown in Figure 129. Make sure the boat is stationary and located at your starting position. Press the Start button and proceed to make a steady pass back and forth across the stream. The ship-track and contour plot are displayed. It is essential to a quality measurement to maintain a uniform and steady boat speed during the entire measurement. As you approach the far stream bank, do not spend any extra time along the edge. Rather, gently turn the boat and return to the starting stream bank. Per the USGS recommendation, the boat speed should be the lesser of a.) the boat speed that requires no less than 3-minutes to complete the loop or b.) the boat speed that is less than 1.5 times the mean water speed. 144 RiverSurveyor S5/M9 System Manual (July 2012) SonTek, a Division of YSI Inc. Figure 129. Start Loop Method Figure 130. Stop Loop Method RiverSurveyor S5/M9 System Manual (July 2012) 145 SonTek, a Division of YSI Inc. 7. After returning to the starting position and the boat is stationary, press the Stop button (Figure 130). There will be a slight pause as the loop calculation is performed. The results will be displayed the PC software as shown in Figure 131: Figure 131. Loop Method Results 8. Press Continue to Start Edge to begin regular discharge measurements or Repeat to perform the Loop Method again. A Loop Method file will be stored on the M9/S5 internal recorder and on the PC or mobile device that will contain all data collected during the Loop Method measurement in addition to the moving-bed results. The file name will start with “Loop_” to identify it from a regular discharge measurement. Post-Processing Loop Method Measurements 1. Start the RiverSurveyor Live PC software. 2. Open the regular discharge measurement files as usual. 3. Open the associated Loop Method file by clicking on the LC icon located on the top tool bar. Select the appropriate file associated with the regular discharge measurements to be processed. For data collected using firmware v1.50 or later, the loop file name will begin with the word “Loop_” as shown in Figure 132. For loop measurements made with earlier firmware versions, the file name will begin in the same format as the regular discharge measurements. It should be noted, this is the only way you can load a Loop Method file. 146 RiverSurveyor S5/M9 System Manual (July 2012) SonTek, a Division of YSI Inc. Figure 132. Loop Correction File 4. The Loop Method results will be processed and displayed as shown in Figure 133. Click Close after the results are reviewed. Figure 133. Loop Method Results 5. The moving bed speed is now calculated. Prior to applying the correction, you must first open the Processing Toolbox by clicking the Tools icon (Ctrl+T) on the tool bar located at the top of the screen. It is also helpful to open the Discharge Summary (Ctrl+S) by clicking the summary icon located on the toolbar. The screen should appear as shown in Figure 134. RiverSurveyor S5/M9 System Manual (July 2012) 147 SonTek, a Division of YSI Inc. Figure 134. Loop Method Processing 6. Click on the LC icon at the end of the Track Reference options in the Processing Toolbox on the right side of the screen. Click Apply to all to apply the loop correction to the open measurements. As soon as the correction (if valid) is applied, the Discharge Summary and the side bar summary table will update to show the “Loop Corrected Total Q” as shown in Figure 135: Figure 135. Loop Method Correction 148 RiverSurveyor S5/M9 System Manual (July 2012) SonTek, a Division of YSI Inc. 7. Click the Discharge Summary Report icon under the Discharge Summary table to generate the final discharge summary report. The final report will display the entire Loop Method analysis along with measured and loop corrected discharge values as shown in Figure 136: Figure 136. Discharge Summary Report RiverSurveyor S5/M9 System Manual (July 2012) 149 SonTek, a Division of YSI Inc. Appendix I. CastAway CTD Integration Background - Sound Speed and Acoustic Measurements Underwater acoustic measurements, particularly acoustic depth range measurements, are dependent on information about the speed of sound in the water to collect accurate data. Sound can travel through the water at different speeds based on changes in temperature, salinity and density (Table 5). For example, sound will travel faster in hot salty water and travel slower in cold fresh water. Change Effect on Sound Speed 1° C 4.0 m/s Salinity 1 PSU 1.4 m/s Depth 100 m 1.7 m/s Temperature Table 5. Effect of temperature, salinity and depth changes on the speed of sound in water Figure 137. A stratified Water Column The water in almost every lake, river, estuary and ocean is stratified into different layers. Temperature conditions in one layer may be notably different from conditions in another layer (Fig. 137). As sound transitions from one layer to the next it will also refract and change direction. These changes in sound speed and direction throughout the water column cause errors in acoustic depth measurements. Depth measurement errors are generally largest in deeper rivers or in estuaries where water temperature and salinity at the surface can vary significantly from the water beneath it. For more detailed information about how temperature and salinity affect depth calculations, refer to SonTek Technical Note: Range, Velocity, Sound Speed and Snell’s Law. Similar to acoustic current measurement systems, hydrographic surveying instruments (i.e. multibeam echosounders, side scan sonar) measure the time it takes a sound pulse to travel from the instrument to the seafloor to calculate distance. Hydrographic surveyors apply sound speed corrections to their data to reduce depth measurement errors induced by sound speed variability. To measure sound speed surveyors use a CTD (Conductivity, Temperature, Depth) sensor to collect a vertical sound speed profile during a hydrographic survey. The sound speed correction is then applied to the acoustic sounding data yielding more accurate depth measurements. These sound speed corrections can also be applied to ADP measurements to improve their accuracy. Application to ADP measurements While it has been common practice for hydrographic surveyors to apply sound speed corrections to bathymetric data, corrections have not commonly been applied to ADP data for two primary reasons. First, the advantage of higher accuracy measurements has been overshadowed by the complexity of applying corrections and velocity measurements are impacted less by sound speed than depth measurements. In many environments sound speed corrections will only slightly improve ADP measurement accuracy; however there are environments such as estuaries where corrections will significantly increase accuracy. With growing requirements for 150 RiverSurveyor S5/M9 System Manual (July 2012) SonTek, a Division of YSI Inc. highly accurate flow measurements in our rivers and oceans and with more ADP data being used for measurements other than velocity such as discharge and bathymetry, the need for applying sound speed corrections to ADP data is increasing. Sound speed corrections improve the accuracy of ADP discharge calculations by increasing the accuracy of the river cross-sectional area. Accurate sound speed measurements at the ADP transducer face are important for velocity measurement accuracy. The fast response of the CastAway thermistor eliminates the need for waiting for the ADP thermistor to equilibrate to water temperature. Measuring temperature and conductivity at the surface allows for the most accurate sound speed equation to be used in the velocity calculations. CastAway CTD and RiverSurveyor Integration The CastAway is a small sophisticated CTD that provides a turnkey solution for applying sound speed corrections to RiverSurveyor measurements by integrating seamlessly with RiverSurveyor Live 3.0 and RiverSurveyor Stationary Live 2.0. Collecting sound speed profiles is simple with the CastAway: it can be lowered by hand, requires no preprogramming, and after a cast automatically transfers data to your PC. A built in GPS marks the location and timestamp of the sound speed profile and also allows the software to automatically select which profile to apply to the discharge calculation. In the software, there is also a summary page that displays temperature, salinity and sound speed information from the CastAway (Fig. 138). Figure 138. CastAway CTD Summary Information Tab. The RiverSurveyor Live (v3.0 or later) software adds a marker for the CastAway profile location on the center ship track plot (Fig. 139). The GPS coordinates must be changed to UTM Display by right-clicking on the track plot. Open the Processing Toolbox to select the CastAway CTD Sound Speed Correction from the drop-down box. There are two options for applying the CastAway sound speed correction to a discharge calculation: using ADP surface temperature data and CastAway surface salinity, or using the full CastAway temperature and salinity profile. The correction can be done manually by selecting the appropriate .ctd file or automatically. If RiverSurveyor S5/M9 System Manual (July 2012) 151 SonTek, a Division of YSI Inc. automatically, the software applies the .ctd file collected closest to the start of the discharge measurement. After applying the sound speed correction you can instantly view the effect of the correction on the discharge calculation. Figure 139. CastAway CTD Sound Speed Correction and UTM Track Location Summary Using CTD measurements to apply sound speed corrections to ADP data helps to further improve the measurement accuracy. ADP discharge measurements in rivers with large crosssectional profiles and areas with high stratification such as estuaries will benefit the most from sound speed corrections. The fast response thermistor of the CastAway also ensures accurate temperature data required for all velocity measurements. The CastAway CTD and RiverSurveyor integration is a user-friendly way to apply sound speed corrections to ADP measurements and increase ADP measurement accuracy. References SonTek, 2010, CastAway User’s Manual 1.3. [Available for download at http://www.sontek.com.] SonTek, 2011, RiverSurveyor S5/M9 System Manual. [Available for download at http://www.sontek.com.] SonTek, 2011, Technical Note: Phased Array and Velocity Measurements. [Available online at http://www.sontek.com/pdf/technotes/PhasedArrayRangeAndVelocity.pdf.] SonTek, 2011, Technical Note: Range, velocity, Sound Speed and Snell’s Law. [Available online at http://www.sontek.com/pdf/technotes/VelocityRangeAndSnellsLaw.pdf.] NOAA Office of Coast Survey, 2011, Field Procedures Manual. [Available online at http://www.nauticalcharts.noaa.gov/hsd/docs/Field_Procedures_Manual_May_2011.pdf] 152 RiverSurveyor S5/M9 System Manual (July 2012) CastAway CTD User Manual YSI Inc. 1700/1725 Brannum Lane, Yellow Springs, OH 45287 USA Telephone +1 (800) 765-4974 | +1 (937) 767-7241 • Fax +1 (937) 767-9353 E-mail: [email protected] • Internet: www.ysi.com/CastAway YSI incorporated TM User’s Manual 1.3 Software Version 1.3 Firmware Version v026_r2818 Copyright 2010 by YSI Inc. All rights reserved. This document may not, in whole or in part, be copied, photocopied, reproduced, translated, or reduced to any electronic medium or Machine-readable form without prior consent in writing from YSI. Every effort has been made to ensure the accuracy of this manual. However, YSI makes no warranties with respect to this documentation and disclaims any implied warranties of merchantability and fitness for a particular purpose. YSI shall not be liable for any errors or for incidental or consequential damages in connection with the furnishing, performance, or use of this manual or the examples herein. The information in this document is subject to change without notice. YSI WARRANTY, TERMS, AND CONDITIONS Thank you for purchasing the YSI CastAwayTM-CTD. The instrument was thoroughly tested at the factory and found to be in excellent working condition. If the shipping crate appears damaged, or if the system is not operating properly, please contact YSI immediately. The system you have purchased is covered under a two year limited warranty that extends to all parts and labor for any malfunction due to workmanship or errors in the manufacturing process. The warranty does not cover shortcomings that are due to the design, nor does it cover any form of incidental damage as a result of errors in the measurements. If your system is not functioning properly, first try to identify the source of the problem. If additional support is required, we encourage you to contact us immediately, and we will work to resolve the problem as quickly as possible. If the system needs to be returned to the factory, please contact YSI to obtain a Return Merchandise Authorization (RMA) number. We reserve the right to refuse shipments without RMA numbers. We require the system to be shipped back in the original shipping container using the original packing material with all delivery costs covered by the customer (including all taxes and duties). If the system is returned without appropriate packing, the customer will be required to cover the cost of a new packaging crate and material. CONTACT INFORMATION Any questions, concerns, or suggestions can be directed to YSI by telephone, fax, or email. Business hours are 8:00 a.m. to 5:00 p.m., Eastern Standard Time, Monday through Friday. Phone : +1 (800) 765-4974 | +1 (937) 767-7241 Fax : + 1 (937) 767-9353 Email : [email protected] (Sales information) [email protected] (Support information) Web : http://www.ysi.com/CastAway See our web site for information concerning new products and software/firmware updates. ii TM CastAway -CTD User’s Manual (October 2010) YSI TM CastAway -CTD User’s Manual (October 2010) iii YSI FCC INFORMATION This device complies with part 15 of the FCC Rules. Operation is subject to the following two conditions: (1) This device may not cause harmful interference, and (2) this device must accept any interference received, including interference that may cause undesired operation. The CastAwayTM-CTD FCC license number can be found in two locations: (1) on the shipping box label and (2) engraved on the back of the CastAwayTM-CTD. Examples of the shipping box label and engraving are shown below. iv TM CastAway -CTD User’s Manual (October 2010) YSI TABLE OF CONTENTS Section 1. Getting Started .................................................................................................... 1 1.1. System Components........................................................................................................ 2 1.1.1. CastAwayTM-CTD Magnetic Stylus Pens .................................................................... 2 1.2. Battery Installation .......................................................................................................... 3 1.3. Using the CastAwayTM-CTD ........................................................................................... 4 1.3.1. Setting the Date and Time........................................................................................... 5 1.3.2. Status Icons ................................................................................................................. 6 1.3.3. Status LED .................................................................................................................. 7 1.3.4. GPS Data Quality........................................................................................................ 8 1.3.5. CTD Display Units...................................................................................................... 8 1.3.6. Conductivity and Specific Conductance ..................................................................... 8 1.4. CastAwayTM-CTD System Information Screens ............................................................. 9 Section 2. 2.1. 2.2. 2.3. 2.4. 2.5. Preparing for a Cast....................................................................................................... 10 CTD Cast Overview ...................................................................................................... 12 Pre-Cast Procedures and Diagnostics ........................................................................... 13 Performing a CTD Cast ................................................................................................ 14 Post-Cast Cleaning and Maintenance ........................................................................... 16 Section 3. 3.1. 3.2. CTD Point Measurements................................................................................ 17 CTD Point Measurement Overview.............................................................................. 17 Performing a CTD Point Measurement ........................................................................ 18 Section 4. 4.1. 4.2. CTD Casts ......................................................................................................... 10 Reviewing Recorded CTD Data ...................................................................... 20 CTD Cast – Profile Plots .............................................................................................. 21 CTD Point Measurement – Detailed Data Screens ....................................................... 22 Section 5. CastAwayTM-CTD Windows Software ........................................................... 23 5.1. System Requirements and Compatibility...................................................................... 23 5.2. Installing the Software and USB Bluetooth Adaptor .................................................... 24 5.3. Connecting and Configuring your CastAwayTM-CTD .................................................. 25 5.3.1. Add a CastAwayTM-CTD to Your PC ....................................................................... 25 5.3.2. Connect to a CastAwayTM-CTD ............................................................................... 26 5.3.3. Configuring the CastAwayTM -CTD ......................................................................... 27 5.3.4. Download Data, Format Memory, Firmware Upgrade ............................................. 28 5.4. Using the CastAwayTM-CTD Software ......................................................................... 30 5.4.1. Overview ................................................................................................................... 30 5.4.2. Zooming / Panning on the Map................................................................................. 32 5.4.3. Selecting Casts for Display ....................................................................................... 33 5.4.4. Managing and Organizing Data ................................................................................ 34 5.4.5. Filtering Measurements to be Shown on the Map or File List .................................. 35 5.4.6. Modify Chart Types and Appearance ....................................................................... 37 5.4.7. Capturing Screen Images .......................................................................................... 39 TM CastAway -CTD User’s Manual (October 2010) v YSI 5.4.8. Manually Changing Sample Type ............................................................................. 39 5.4.9. Manually Specifying Measurement Location ........................................................... 40 5.4.10. Deleting Measurements............................................................................................. 40 5.5. Software Settings .......................................................................................................... 41 5.5.1. Software Settings: General....................................................................................... 41 5.5.2. Software Settings: Charts ......................................................................................... 43 5.5.3. Software Settings: Map ............................................................................................ 45 5.5.4. Software Settings: Geo Images ................................................................................ 47 5.5.5. Software Settings: Units .......................................................................................... 49 5.6. Importing and Exporting Data ...................................................................................... 50 5.6.1. Import Files ............................................................................................................... 50 5.6.2. Export Files ............................................................................................................... 51 5.6.3. Export Summary ....................................................................................................... 53 5.7. Software Maintenance Functions .................................................................................. 54 5.7.1. Data Backup .............................................................................................................. 54 5.7.2. Purge Deleted Files ................................................................................................... 54 5.7.3. Import Language File ................................................................................................ 55 5.7.4. Run CastAwayTM Translator ..................................................................................... 56 5.7.5. Repair Device without Firmware .............................................................................. 58 Section 6. Maintenance, Quality Control, and Troubleshooting ................................... 59 6.1. CTD Maintenance and Care.......................................................................................... 59 6.1.1. CTD Housing ............................................................................................................ 59 6.2. Calibration Guidelines .................................................................................................. 60 6.3. Data Quality Control ..................................................................................................... 61 6.4. Troubleshooting Tips .................................................................................................... 63 6.4.1. No System Time........................................................................................................ 63 6.4.2. Unable to Establish Bluetooth Connection ............................................................... 64 6.4.3. Problems in Cold Weather ........................................................................................ 66 6.4.4. Surface Spikes in Conductivity / Salinity ................................................................. 67 6.4.5. CastAwayTM-CTD Does Not Respond ..................................................................... 67 Appendix A. CastAwayTM-CTD Principles of Operation .................................................. 68 A-1. Purpose ............................................................................................................................. 68 A-2. What is a CTD? ................................................................................................................ 68 A-3. Who Uses CTDs? ............................................................................................................. 69 A-4. Water Layers: Temperature, Salinity, and Density .......................................................... 70 A-5. CTD Measured Data ......................................................................................................... 71 A-6. CTD Derived Parameters .................................................................................................. 73 A-7. Best Measurement Practices ............................................................................................. 75 A-8. Overview of Available Data ............................................................................................. 76 A-9. Data Processing Algorithms ............................................................................................. 79 A-10. Data Processing for Point Measurements ....................................................................... 82 A-11. References....................................................................................................................... 83 vi TM CastAway -CTD User’s Manual (October 2010) YSI Section 1. Getting Started The CastAwayTM-CTD is a profiling instrument that measures conductivity, temperature, and pressure. You can start data collection and review data directly from the LCD screen. An integrated GPS records the time and location of every cast. It is ready to use out of the box, just install the batteries and follow a few simple directions to see data in minutes. When using the system for the first time, we suggest reviewing a few sections of this manual. • • • • • • • Unpack the system (§1.1). Install the batteries (§1.2). Learn the LCD interface (§1.3). Perform a CTD cast (Section 2). Connect the CastAwayTM-CTD to your PC and download data (§5.3). Use the CastAwayTM-CTD Software to review the data you collected (§5.4). To learn more about how the CastAwayTM-CTD works, read Appendix A. TM CastAway -CTD User’s Manual (October 2010) 1 YSI 1.1. System Components Figure 1 – System Components The following items are included with each CastAwayTM-CTD (Figure 1). 1. Quick Start Guide 2. 15 m (50 ft) deployment line 3. Two magnetic stylus pens, plus one lanyard to hold stylus 4. CastAwayTM-CTD in protective sleeve 5. Two locking carabiners (for use with the deployment line) 6. Four AA batteries 7. USB Bluetooth adapter 8. USB data drive with software and documentation 9. Two sensor cleaning brushes 10. One replacement o-ring with o-ring lubricant 1.1.1. CastAwayTM-CTD Magnetic Stylus Pens The buttons used to control the CastAwayTM-CTD are activated using a magnetic stylus pen. Two of these pens are included with the system. A third smaller pen, for emergency use in the event the other pens are lost, is stored inside the battery housing (Figure 2). Figure 2 – Spare Magnetic Stylus 2 TM CastAway -CTD User’s Manual (October 2010) YSI 1.2. Battery Installation The CastAwayTM-CTD runs from 2 AA batteries installed in the bottom of the housing. • Several battery types are supported. o Alkaline: ~40 hours normal operation o Rechargeable NiMH: ~40 hours normal operation o Energizer ultimate lithium 1.5 V: ~60 hours normal operation IMPORTANT: You must only use 1.5 V lithium batteries – other lithium batteries (which run at 3.6 V) may damage the system YSI has found these batteries work particularly well in cold weather. • To display battery health, the CastAwayTM-CTD must know what battery type is installed. o Use the CastAwayTM-CTD Software to specify battery type (§5.3.3). • If the CTD will be idle for more than 1 week, remove the batteries to avoid draining them. Step 1 Step 2 Remove the CTD housing from the protective sleeve. Open the battery compartment by gripping the top of the CTD with one hand, and twisting the battery cap (bottom of the housing) counter clockwise. Pull down to remove the battery cap. Step 3 Install the batteries using the alignment shown in the housing. The + and - signs indicate the polarity at the top of the battery. Step 4 Carefully clean and inspect the o-ring; replace the o-ring if necessary. When needed, apply a small amount of lubricant to the o-ring. Step 5 Step 6 Push the battery compartment closed; twist clockwise to lock. It takes some force to properly close and seal the housing; use the palms of both hands to push the battery cap onto the CTD housing. TM CastAway -CTD User’s Manual (October 2010) Insert the CTD housing back into the protective sleeve. Align the grooves on the sides of the CTD with the raised tracks on the inside of the protective sleeve. 3 YSI 1.3. Using the CastAwayTM-CTD To navigate the menus on the LCD screen use the three buttons on front of the CastAwayTM-CTD. These buttons are activated using one of the magnetic stylus pens included with the system. To press a button, insert the stylus as if gently pushing a button at the bottom of the hole (Figure 3). Figure 3 TM To turn the CastAway -CTD on, press any button. The first screen is the home screen, which gives access to all major CTD functions. The purpose of each button is shown in the corner of the screen closest to that button. • Use the lower left button to change the highlighted function. • Use the lower right button to execute the highlighted function. • • • Use the upper left button to turn the system off. The CTD serial number is shown on the top of the screen System date and time is shown on the bottom of the screen o Date and time are obtained from GPS. o The first time the system is turned on, it will not have the date and time. Take the system to an open area outside and wait as GPS satellites are obtained (§1.3.1). o On the LCD, time is always displayed in Universal Coordinated Time (UTC). The CastAwayTM-CTD Software automatically uses the local time zone. Four functions are available from the home screen: • Perform a CTD Cast (Section 2). • Review Data (Section 4). • Perform a CTD Point Measurement (Section 3). • System Information (§1.4). 4 TM CastAway -CTD User’s Manual (October 2010) YSI 1.3.1. Setting the Date and Time The CastAwayTM-CTD uses the integrated GPS to acquire and track the date and time. • When powering the CastAwayTM-CTD for the first time, you will need to get a GPS signal to set the system clock. o In this case, date/time is not shown at the bottom of the screen. • After installing batteries, go outside. • On a cold start, GPS reception can take 3 to 6 minutes depending on the location and the number of available satellites. Limited GPS reception may increase the wait time. Follow the progress with the GPS status indicator or watch for the date and time to appear at the bottom of the screen. • • o GPS off o GPS on, no signal o GPS on, weak signal o GPS on, good signal When the Universal Coordinated Time (UTC) appears at the bottom of the screen you are ready to start collecting data. You may have to repeat this process when you replace the batteries. The system will keep track of time for a short period without batteries, but if left without batteries the date and time will need to be re-acquired. TM CastAway -CTD User’s Manual (October 2010) 5 YSI 1.3.2. Status Icons System status icons are located across the top of the home screen. • Bluetooth status Grey: Modem ok, not active. o o Blue: Modem ok, actively communicating with a PC. In general, when connected to a PC this icon will remain grey since there is no active data transfer. The icon will only turn blue when there is active data transfer. o Red: Modem error • GPS status • o GPS off o GPS on, no signal o GPS on, weak signal o GPS on, good signal Recorder status o 60-100% free space o 30-60% free space o 10-30% free space o 0-10% free space • Battery status 6 o 90-100% full charge o 20-90% full charge o 10-20% full charge o 0-10% charge remaining, change batteries immediately TM CastAway -CTD User’s Manual (October 2010) YSI 1.3.3. Status LED Below the LCD is a LED status light (Figure 4). • The LED is capable of generating a number of different colors, although depending on light conditions it may be difficult to distinguish some colors. • A magenta LED indicates the CastAwayTM-CTD is preparing for its next activity. o Turning the system on or off. o Responding to a pressed button. • • Figure 4 – Status LED Flashing blue indicates active Bluetooth data transfer. The following are seen while acquiring a GPS position fix. o Flashing red indicates a GPS position is unavailable. o Flashing yellow indicates a poor quality GPS position has been obtained. Solid green indicates a good quality GPS position has been obtained. o • The following are seen during a CTD cast or measurement. o Flashing green indicates the system is actively collected CTD data. • The following are seen when upgrading firmware. o Flashing white indicates the boot loader is active. o Flashing yellow indicates the boot loader is initializing. o Flashing red and blue indicates the new firmware is being written. • Except when obtaining a GPS fix, flashing red indicates a system error. TM CastAway -CTD User’s Manual (October 2010) 7 YSI 1.3.4. GPS Data Quality When acquiring GPS location during a cast or point measurement, the CastAwayTM-CTD will display an icon to indicate the quality of the GPS measurement, based on the number of satellites that are being tracked. • No GPS position: less than 4 satellites, no position fix • Low quality GPS position: 4 or more satellites, low quality position fix • Good GPS position: 4 or more satellites, good quality position fix 1.3.5. CTD Display Units Using the CastAwayTM-CTD Software, you can configure the instrument to change the units used for display of CTD data (§5.3). 1.3.6. Conductivity and Specific Conductance Conductivity is one of the key parameters measured by the CastAwayTM-CTD. • • When using this data, it may be important to understand the difference between conductivity and specific conductance. In the simplest sense, conductivity is the raw measurement while specific conductance is this measurement compensated for the influence of temperature. With the CastAwayTM-CTD, we use and display both values depending on where and how the data is being used. For additional details, refer to the CastAwayTM-CTD Principles of Operation (§A-6. ). 8 CastAway -CTD User’s Manual (October 2010) • • TM YSI CastAwayTM-CTD System Information Screens 1.4. To access system information from the home screen: • Press to highlight the system information icon. • Press to execute this function. System Information Screen • • • Serial number Firmware version number YSI contact information • Press the upper left button to return to the home screen. • Press the lower right button to display raw CTD data. • Press the lower left button to view recorder / battery status. Raw CTD Data • • • This may be useful to verify the system is operating properly. This data is for display only and is not recorded. Press upper button to return to the home screen. Recorder / Battery Status • Detailed recorder and battery status information is shown. • Press the upper left button to return to the home screen. • Press the lower right button to display the YSI logo. • Press the lower left button to format the recorder. o You will be prompted twice to verify that you want to erase the recorder. o Erased files cannot be recovered. o Once the format has been started, it cannot be stopped. Press the lower left button to verify you want to erase the recorder. o Press any other button to abort and return to the home or system information screen. o TM CastAway -CTD User’s Manual (October 2010) 9 YSI Section 2. CTD Casts The purpose of a CTD cast is to measure key water quality parameters (conductivity, temperature, salinity, etc) over the full depth of the water column. This is in contrast to a point measurement (Section 3), where these parameters are measured at a single location. 2.1. Preparing for a Cast The CastAwayTM-CTD includes a 15 m (50 ft) deployment line. • • • The line is 3 mm (1/8 in.) diameter polymer cord. It allows minimal water absorption and is close to neutrally buoyant. The line is appropriate for casts in relatively shallow water. To use this deployment line: • • • Securely tie the line to a locking carabiner. Attach the carabiner and line to the top of the CastAwayTM-CTD’s protective sleeve and engage the lock. Attach the opposite end of the line to something secure in case the line should slip out of your hands. o • • Never attach the other end of the line to yourself. Be sure the deployment line is long enough for the expected cast depth. Coil the line without knots or tangles, so that it is easy to pay out during the cast. Be aware of the local bottom conditions: • If you intend to let the CTD freefall to the bottom: o Use caution around rocks, reefs, piers, bridges, sunken trees, etc. to avoid snagging the line or the CTD. o Layers of silt or mud on the bottom could plug the conductivity flow cell. o Try not to drag the CTD along the bottom if you are casting from a moving vessel. Be aware of the currents in the water: • You may need to add weight to the bottom of the CTD if you are casting in strong currents. o Strong currents may keep the CTD from descending because of drag on the line. o We recommend attaching no more than 2.5 kg (5 lb) the bottom of the CastAwayTM’s protective sleeve. For deeper casts, you will need to provide your own deployment line and line handling equipment. A variety of different lines can be used; guidelines for selecting and configuring line are given below. • Do not attach the CastAwayTM-CTD to more than 100 m (330 ft) of line. o The maximum deployment depth of the CastAwayTM-CTD is 100 m (330 ft). o Deploying the system to greater depths can result in permanent damage. o If your CTD accidently exceeds 100 meters during a deployment, you will need to send it back to the factory for recalibration and to check for damage. • Do not use a large diameter line, or one with significant positive buoyancy. 10 TM CastAway -CTD User’s Manual (October 2010) YSI o This can slow or stop the CTD descent during the down cast. Use a line that has good abrasion and cut resistance, with a suitable working load. o We recommend a working load of at least 10 kg (20 lb). • For deeper casts, consider using a small winch or other mechanical device to simplify retrieval of the system. o One good option is a scuba dive reel. • The link below provides some examples of dive reels. YSI has tested some of the devices on this page and found them to work well with the CastAwayTM-CTD. There are a variety of devices available from many different companies. Secure deployment of the CastAwayTM-CTD is the customer’s responsibility; any deployment device should be evaluated carefully. http://www.leisurepro.com/Cat/Context_965/Page_1/Reels/969.html TM CastAway -CTD User’s Manual (October 2010) 11 YSI 2.2. CTD Cast Overview The basic procedure for performing a CTD cast is below. • • Perform pre-deployment diagnostics and procedures (§2.3). Attach the CastAwayTM-CTD to the deployment line. o Attach the opposite end of the line to something secure in case the deployment line comes out of your hands. • Begin the cast from the LCD interface, including a starting GPS location (§2.4). • Lower the CTD to just below the water surface. o Keep the system at the water surface for approximately 10 seconds. o This allows the CTD sensors to stabilize to the surface water conditions. • Allow the CTD to free fall to the bottom. Do not deploy the system deeper than the 100 m (330 ft) pressure rating. • • • • • 12 After it reaches the bottom, immediately retrieve the system to the surface. o Retrieve the system at a steady rate of about 1 m/s (3 ft/s). For the best data quality, do not stop the system at any point during the down or up cast and don’t leave it resting on the bottom. At the surface, stop data collection and record the ending GPS fix (§2.4). Complete the cast and review data on the LCD (Section 4). Rinse the system with fresh water, allow to air dry and store securely until the next cast (§2.5). TM CastAway -CTD User’s Manual (October 2010) YSI 2.3. Pre-Cast Procedures and Diagnostics The CastAwayTM-CTD is designed to require minimal maintenance, while providing a long life of reliable measurements. To ensure quality data collection, we recommend that you perform the following simple diagnostic procedures prior to data collection. • • • Follow YSI guidelines for CastAwayTM-CTD maintenance (§6.1) Make sure you haven’t exceeded one year since the factory calibration (§6.2). If your CastAwayTM has been in storage for more than a month: o You may want to confirm that your sensors are operating correctly by checking the raw data from the sensors. o Navigate to the Raw CTD data view as described in the previous section (§1.4). o Verify that the temperature in air is reasonable for your location. o Verify that the atmospheric pressure is reasonable (approximately 10.1 dBar or 14.7 psi). o The conductivity, salinity, and sound speed are meaningless in the air. These should be close to zero, but don’t worry if they are not. The CTD may just be detecting some humidity or moisture inside the measurement cell which could be from the air or the flow cell could still be wet from the last cast. • Prior to each cast: o Verify you have sufficient battery power and recorder space. o o o o o Battery icon on the home screen (§1.3.2) has more than 10% capacity. Recorder icon on the home screen (§1.3.2) has more than 10% available space. Look inside the measurement flow cell to make sure it is clear of dirt and debris. Make sure the casting line is properly secured to the CastAwayTM Make sure the opposite end of the casting line is secured to the boat or something nearby. Check the casting line for knots or tangles. Make sure the time and date are being displayed at the bottom of the Home Screen TM CastAway -CTD User’s Manual (October 2010) 13 YSI 2.4. Performing a CTD Cast To start a CTD cast from the home screen: • Press to highlight the CTD cast icon. • Press to execute this function. Record Starting GPS Position The CastAwayTM-CTD first acquires a starting GPS location. • Icons at the bottom of the LCD (plus the status LED) show the quality of the GPS location data. o No GPS position ( flashing red). o Low quality GPS position ( flashing yellow). o High quality GPS position ( solid green). o The number of satellites being tracked is also displayed. If the number of satellites is greater than 10, the actual number of satellites is the last digit of the number. The 1 or the first digit indicates that a good position is being computed. • GPS location is not required to perform a CTD cast. o When possible, we encourage recording high quality GPS data as this is a valuable addition to the measurement. o If GPS coverage is not available, you can begin the cast at any time. The CastAwayTMCTD Software can be used to manually enter the location of the cast at a later time (§5.4.9). o After installing batteries, the first GPS signal lock can take 3 to 6 minutes depending on your location and the number of available satellites. o The first GPS signal lock of the day can also take 3 to 6 minutes depending on when and where your last successful signal lock occurred. o To minimize GPS signal acquisition time, keep the CTD level with the LCD facing the sky in a clear open area free of overhead obstructions. Trees, buildings, and bridges can interfere with GPS reception. • When ready, press the lower right button to begin the CTD cast. • Press any other button to abort the cast and return to the home screen. 14 TM CastAway -CTD User’s Manual (October 2010) YSI Perform the Cast • • A screen is shown to indicate the cast is starting. The LCD screen will go blank to conserve power. The flashing green LED indicates the system is actively collecting CTD data. • It is possible to configure the CastAwayTM-CTD to display real time data on the LCD during a cast. o The option is enabled using the CastAwayTM-CTD Software (§5.3.3). o This significantly affects the power consumption of the CastAwayTM-CTD. o We recommend that you use this option only when necessary, and leave the LCD screen disabled for normal data collection. o For field diagnostics, it is possible to view raw data on the LCD without recording (§1.4). • Lower the CTD to just below the water surface. o Keep the system at the water surface for approximately 10 seconds. o This allows the CTD sensors to stabilize to the surface water conditions. • Allow the CTD to free fall to the bottom. o Do not deploy the system deeper than the 100 m (330 ft) pressure rating. • After it reaches the bottom, retrieve the system to the surface. o Retrieve the system at a steady rate of about 1 m/s (3 ft/s). • For the best data quality, do not stop the system at any point during the down or up cast. • When complete, press any button to end CTD data collection. Record Ending GPS Position Lastly the CastAwayTM-CTD acquires an ending GPS location. • Icons at the bottom of the LCD (plus the status LED) show the quality of the GPS location data. o No GPS position ( flashing red). o Low quality GPS position ( flashing yellow). o High quality GPS position ( solid green). o The number of satellites being tracked is also displayed. • GPS location is not required to perform a CTD cast. o When possible, we encourage recording high quality GPS data as this is a valuable addition to the measurement. o If GPS coverage is not available, you can end the cast at any time. • When ready, press the lower right button to complete the CTD cast. When complete, the CastAwayTM-CTD automatically loads the cast into the review data screen to allow immediate review of data quality (Section 4). TM CastAway -CTD User’s Manual (October 2010) 15 YSI 2.5. Post-Cast Cleaning and Maintenance Careful cleaning and maintenance of the CastAwayTM-CTD ensures a long operating life and accurate data collection. • • • 16 If you are casting in salt or brackish water you may want to rinse the CTD with fresh water in between each cast if the time between casts is more than 15 minutes. When you are finished casting for the day, remove the CTD from the protective sleeve. Rinse the CTD and sleeve with fresh water and allow them to air dry. If the CTD has been fouled with any oil or other foreign materials, use a mild detergent and the sensor cleaning bushes to clean the CTD and sensors (§6.1). TM CastAway -CTD User’s Manual (October 2010) YSI Section 3. CTD Point Measurements The purpose of a CTD point measurement is to record water quality parameters (conductivity, temperature, salinity, etc) at a single location and depth. This is in contrast to a cast (Section 2), where these parameters are measured as a profile over the full depth at a given location. 3.1. CTD Point Measurement Overview The same deployment line and equipment used for a CTD cast should be used for point measurements (§2.1). The basic procedure for performing a CTD point measurement is below. • • • • • • • Perform pre-deployment diagnostics and procedures, the same as for a cast (§2.3). Attach the CastAwayTM-CTD to the deployment line. o Attach the opposite end of the line to something secure in case the deployment line comes out of your hands. Begin the point measurement from the LCD, including a starting GPS location (§3.2). Place the CTD in the desired measurement location. o Keep the system at this location, moving back and forth to flush water through the measurement cell, for about 5 seconds. o Since this is a point measurement, it is not necessary to collect data for a long period of time. Just a few seconds of data is sufficient. Retrieve the system and stop data collection. There is no end GPS location for a point measurement. Complete the measurement and review data on the LCD (Section 4). Rinse the system with fresh water, allow to air dry, and store securely until the next measurement (§2.5). TM CastAway -CTD User’s Manual (October 2010) 17 YSI 3.2. Performing a CTD Point Measurement To start a CTD point measurement from the home screen: • Press to highlight the CTD point measurement icon. • Press to execute this function. Record Starting GPS Position The CastAwayTM-CTD first acquires a starting GPS location. • Icons at the bottom of the LCD (plus the status LED) show the quality of the GPS location data. o No GPS position ( flashing red). o Low quality GPS position ( flashing yellow). o High quality GPS position ( solid green). o The number of satellites being tracked is also displayed. If the number of satellites is greater than 10, the actual number of satellites is the last digit of the number. The 1 or the first digit indicates that a good position is being computed. • GPS location is not required to perform a point measurement. o When possible, we encourage recording high quality GPS data as this is a valuable addition to the measurement. o If GPS coverage is not available, you can begin the point measurement at any time. • When ready, press the lower right button to begin the CTD cast. • Press any other button to abort the cast and return to the home screen. 18 TM CastAway -CTD User’s Manual (October 2010) YSI Perform the Measurement • • A screen will be shown to indicate the measurement is starting. The LCD screen will go blank to conserve power. The flashing green LED indicates the system is actively collecting CTD data. • It is possible to configure the CastAwayTM-CTD to display real time data on the LCD during a point measurement. o The option is enabled using the CastAwayTM-CTD Software (§5.3) o This significantly affects the power consumption of the CastAwayTM-CTD. o We recommend that you use this option only when necessary, and leave the LCD screen disabled for normal data collection. o For field diagnostics, it is possible to view raw data on the LCD without recording (§1.4). • Place the CTD in the desired measurement location. o Keep the system at this location, moving back and forth to flush water through the measurement cell, for about 5 seconds. o Since this is a point measurement, it is not necessary to collect data for a long period of time. Just a few seconds of data is sufficient. • When complete, press any button to end the CTD measurement. o When the measurement is complete, the CastAwayTM-CTD automatically loads the review data screen to allow immediate verification of data quality (Section 4). TM CastAway -CTD User’s Manual (October 2010) 19 YSI Section 4. Reviewing Recorded CTD Data To review recorded data files, from the home screen: • Press to highlight the review data icon. • Press to execute this function. The most recently recorded file is initially displayed. File Summary Screen The screen layout is slightly different for a CTD cast versus a point measurement; examples of each are shown below. • CTD Cast o The screen shows date/time, location, plus depth and duration of the cast. o o Press the upper left button to return to the home screen. Press the lower left button to move to the next earlier file (based on date/time). Press the lower right button to view CTD profile plots o (§4.1). • CTD Point Measurement Press the upper left button to return to the home screen. Press the lower left button to move to the next earlier file (based on date/time). o Press the lower right button to view detailed data screens (§4.2). o o 20 TM CastAway -CTD User’s Manual (October 2010) YSI 4.1. CTD Cast – Profile Plots Four profile plots can be viewed: temperature, specific conductance, salinity, and sound speed. • • Date and time of the cast is shows at the bottom of each screen. Press the lower right button to move to the next profile plot. o After the last profile, the file information screen is shown. o You can return to the home screen from the file information screen. • Using the upper and lower left buttons, you can scroll through data from multiple files recorded on the CastAwayTM-CTD. o Press the upper left button to move to the next later CTD cast or measurement (based on date/time). o Press the lower left button to move to the next earlier CTD cast or measurement (based on date/time). Using the CastAwayTM-CTD Software, you can change the units used for data display and which profile plots are shown (§5.3). TM CastAway -CTD User’s Manual (October 2010) 21 YSI 4.2. CTD Point Measurement – Detailed Data Screens Four data screens can be viewed: temperature, specific conductance, salinity, and sound speed. • • Date and time of the measurement is shows at the bottom of each screen. Press the lower right button to move to the next data screen. o After the last data screen, the file information screen is shown. o You can return to the home screen from the file information screen. • Using the upper and lower left buttons, you can scroll through data from multiple files recorded on the CastAwayTM-CTD. o Press the upper left button to move to the next later CTD cast or measurement (based on date/time). Press the lower left button to move to the next earlier CTD cast or measurement o (based on date/time). Using the CastAwayTM-CTD Software, you can change the units used for display of any parameter and which profile plots are shown (§5.3.3). 22 TM CastAway -CTD User’s Manual (October 2010) YSI Section 5. CastAwayTM-CTD Windows Software You should feel free to experiment with the CastAwayTM-CTD Software and try out different functions; we are confident you will find the software powerful and easy to use. • • • 5.1. As with any specialized application, there are a number of features in the CastAwayTM-CTD Software that are not common in other software programs. In the beginning, some of these features may be difficult to locate and understand. This section is intended as a reference to locate and use all of the different functions available within the CastAwayTM-CTD Software. System Requirements and Compatibility The CastAwayTM-CTD Software runs from a PC with the following system capabilities. • Operating System o Windows XP o Windows Vista o Windows 7 • Any PC capable of using the above operating systems should be able to use the CastAwayTMCTD Software. • Access to a high speed internet connect is not required, but does provide a greater number of options for the background map (§5.5.3). TM CastAway -CTD User’s Manual (October 2010) 23 YSI 5.2. Installing the Software and USB Bluetooth Adaptor The CastAwayTM-CTD Software and user documentation is stored on the USB data drive (Figure 5) included with the system. • • • Figure 5 – USB Data Drive Insert the USB data drive into an available USB port on your PC. Run the Ysi.CastAwayCtd.Setup_#.#.msi program stored on the drive. The “#” symbols in the file name represent the current software version number. Follow the on-screen installation instructions. The software communicates with the CastAwayTM-CTD using Bluetooth radio communication. • • A USB Bluetooth adaptor is included with the system (Figure 6). Though many PCs are already Bluetooth enabled, the built-in Bluetooth Figure 6 – USB TM functions do not work reliably with the CastAway -CTD Software. We Bluetooth only recommend using the USB Bluetooth adaptor included with the system. • To install the USB Bluetooth adaptor, insert it into an available USB port of your PC. o The adaptor should be plug-and-play with all supported operating systems, and should install automatically. • If you encounter any problem installing or using the USB Bluetooth adaptor, refer to the troubleshooting section for additional help (§6.4.2). • Once the Bluetooth adapter is finished installing, you can run the CastAwayTM-CTD Software to communicate with the CTD and download data (§5.3). 24 TM CastAway -CTD User’s Manual (October 2010) YSI 5.3. TM Connecting and Configuring your CastAway -CTD When you open the CastAwayTM-CTD Software for the first time, this manual will be displayed. After the initial run, the normal display is a world map, several empty profile charts, and space for selected measurement data (Figure 7). • • A good first step is to establish communications between the CastAwayTM-CTD and your PC. This allows you to download data files and configure the instrument. Figure 7 5.3.1. Add a CastAway • TM -CTD to Your PC Click on the Devices tab in the upper left portion of the screen. • Click on the Add Device icon in the upper left portion of the screen. o Input the serial number of your CastAwayTM-CTD. o Click Add Device. • Your CastAwayTM-CTD is now controlled and configured by this PC. o A single PC can control any number of CastAwayTM-CTDs. o A single CastAwayTM-CTD can be controlled by any number of PCs. TM CastAway -CTD User’s Manual (October 2010) 25 YSI 5.3.2. Connect to a CastAwayTM-CTD • • • Make sure the USB Bluetooth adaptor has been installed and is connected to your PC. Run the CastAwayTM-CTD Software. While the instrument is reasonably close to the PC, turn the CastAwayTM-CTD on. o The maximum Bluetooth range is 10 m (30 ft). o When possible, place the CTD within 1-2 m (3-6 ft) of the PC for best results. • The software will automatically establish communications with the CastAwayTM-CTD o This can take a few moments to establish communications. If you encounter any problem establishing Bluetooth communications, refer to the troubleshooting section for additional help (§6.4.2). o Once communications are established, the software automatically downloads any new files on the CastAwayTM-CTD recorder. If desired, you can disable the automatic file download (§5.5.1). o For any device currently connected to the PC, the software displays instrument status and configuration (Figure 8). Figure 8 – Device Status and Configuration • 26 You can disable communications if you do not want the software to automatically establish communications with the CastAwayTM-CTD whenever in range. o Right click in the Status section for the desired device and click on Communications Disabled to enable/disable communication with that device. o This can be useful if multiple PCs are within range of the device. TM CastAway -CTD User’s Manual (October 2010) YSI 5.3.3. Configuring the CastAwayTM-CTD A number of options are available to customize the operation of the CastAwayTM-CTD (Figure 9). The system can only be configured when connected to a PC using the CastAwayTM-CTD Software. • • • • • Figure 9 – Device Configuration the operating language and display units on the CastAwayTM-CTD. o This setting affects only the LCD interface, not the CastAwayTM-CTD software. To change the language or display units for the software, see §5.5.1 or §5.5.5. o English / Metric: English language, metric units (m, ºC, dBar, m/s) o English / Imperial: English language, Imperial units (ft, ºF, psi, ft/s) o Español / Metrico: Spanish language, metric units (m, ºC, dBar, m/s) Plot Salinity: this enables/disables display of salinity in the review data screens (Section 4). Plot Specific Conductance: this enables/disables display of specific conductance in the review data screens (Section 4). Plot Sound Speed: this enables/disables display of sound speed in the review data screens (Section 4). Battery type: o This specifies the type of battery installed in the CastAwayTM-CTD, and is needed for accurate battery capacity calculations. See §1.2 for battery life estimates. Language & Units: Alkaline NiMH Rechargeable Energizer Ultimate Lithium 1.5 V IMPORTANT: You must use only 1.5 V lithium batteries – other lithium batteries (which run at 3.6 V) will damage the system Show data during cast: this enables/disables the display of data on the LCD during a cast o o o • or measurement. o This significantly increases power consumption and decreases battery life. o Use this option only when necessary, and keep it disabled the rest of the time. • If any system configuration parameters have been changed, the task section will show two options. Save new configuration settings to the CastAwayTM-CTD. o o Abandon new configuration settings and keep existing settings. o You must click Save configuration for any changes to take effect. TM CastAway -CTD User’s Manual (October 2010) 27 YSI 5.3.4. Download Data, Format Memory, Firmware Upgrade Several functions are available when connected to a CastAwayTM-CTD. • Download files o This option is only available if the automatic file download has been disabled (§5.5). o Press this button to download any new files. • Refresh info o This option refreshes all status information downloaded from the CastAwayTM-CTD. • Figure 10 – Device Tasks Format memory o This option will erase the memory on the CastAwayTM-CTD. o It will prompt you to confirm that you want to erase the memory before processing. Erased files can not be recovered. Once the format has been started, it cannot be stopped. o Erasing the memory takes several minutes; no other CTD functions should be accessed during this time. • Firmware info / upgrade o Firmware updates may be periodically available from YSI. o IMPORTANT: Prior to updating firmware: Download and backup all data files. Format the CTD memory (see above). The firmware update may not work properly if the recorder has not been formatted. o This option displays the firmware version and can be used to upgrade the firmware. o After viewing firmware version number, click No to exit or Yes to upgrade. o When upgrading, select the firmware file provided by YSI and click Open. o When prompted, click Ok to proceed with the firmware upgrade. o The upgrade will take several minutes. Do not turn the system off, exit the software, or use other applications on your PC during the upgrade process. o If the firmware upgrade process is accidentally interrupted, the CastAwayTM-CTD will still operate using the old firmware. The upgrade process should be repeated. 28 TM CastAway -CTD User’s Manual (October 2010) YSI • Reset factory defaults: o This option changes all internal CastAwayTM-CTD settings to the factory defaults. Click No to exit or Yes to reset the CTD configuration to factory defaults. This option may be useful if settings were accidentally changed. TM CastAway -CTD User’s Manual (October 2010) 29 YSI 5.4. Using the CastAwayTM-CTD Software 5.4.1. Overview Figure 11 – Software Map View Figure 11 shows the main screen of the CastAwayTM-CTD Software. • • A toolbar across the top gives access to a number of key functions. The main area is a map showing the location of CastAwayTM-CTD measurements o Only currently filtered measurements are displayed (§5.4.5). o The blue circles indicate the location of CTD measurements; the number inside indicates how many measurements are at that location. o A highlighted blue circle indicates those measurements are currently selected. The right side shows charts of data from selected CastAwayTM-CTD measurements. o The number and location of charts can be changed (§5.5.2). • The bottom of the screen lists the selected CastAwayTM-CTD measurements, including key parameters such as serial number and measurement date/time. • 30 TM CastAway -CTD User’s Manual (October 2010) YSI The left side of the toolbar allows you to switch which display is shown. • Selecting the Devices tab allows you to connect to, download data from, and configure individual CastAwayTM-CTD units (§5.3). • Selecting the Data tab allows you to view data from CastAwayTM-CTD measurements using either the map or file view. o Show Map gives the map view, seen in Figure 11. o Show Files gives the file view, seen in Figure 12. o In the file view, the map has been replaced with a list of files. Only currently filtered measurements are displayed (§5.4.5). o Clicking on a column header in the file list sorts the list based on that value. Figure 12 – Software File View TM CastAway -CTD User’s Manual (October 2010) 31 YSI 5.4.2. Zooming / Panning on the Map There are several ways to zoom the view on the world map. • • • • • • • • Use the mouse wheel to zoom in or out. o Hold the mouse over the part of the map that you want to remain in view. Hold the Alt key, click and drag a rectangle to zoom into the highlighted area. Click the + and - keys to zoom in or out. Press Home to zoom to the entire world map. Several zoom buttons are included on the toolbar. Zoom to World shows the entire world map. Zoom to Filtered scales the map to fit only those casts that are currently filtered (§5.4.5). Zoom to Selected scales the map to fit only those casts that are currently selected (§5.4.3). There are several ways to pan the view on the world map. • • 32 Click and drag on the map to pan the view (shift the view left/right/up/down). Use the arrow keys (←↑→↓) to pan the view. TM CastAway -CTD User’s Manual (October 2010) YSI 5.4.3. Selecting Casts for Display To display data from one or more CTD measurements, you must select those measurements. • To select files from the Show Map view (Figure 11): o Click on a blue circle indicating one or more CTD measurements. o Hold SHIFT while clicking on multiple measurements selects multiple locations. o Hold CTRL while clicking and dragging a rectangle to select all measurements within that rectangle (removing any previous selected measurement). o Hold SHIFT while clicking and dragging a rectangle to select all measurements within that rectangle (keeping any previous selected measurement). o To un-select all files, simply click at any point on the map that is not on a measurement. • To select files from the Show Files view (Figure 12): o Click on a measurement line to select that measurement. o Hold CTRL or SHIFT while clicking on multiple lines will select multiple measurements. You can plot data from some or all of the selected measurements. • Selected measurements are listed at the bottom of the screen (Figure 13). Figure 13 – Selected Measurement List • By default, the first 5 of the selected measurements are automatically shown in the charts. o The number of measurements automatically displayed can be modified (§5.5.2). • You can add/remove measurements from the charts using the check boxes along the left side of the selected measurement list. TM CastAway -CTD User’s Manual (October 2010) 33 YSI 5.4.4. Managing and Organizing Data To organize data, you can generate Projects and assign measurements to those projects. • A Project is much like a folder used to organize data on your PC. o A project can contain any number of CTD measurements. o A CTD measurement can be included in more than one project. • To add files to a project, or to create a new project: o Select one or more measurements to be placed in the new project. o Click Add to Project to see the add files dialog (Figure 14). Figure 14 – Add Files to Project o Select the desired project, or type in a new project name. o Click Add to add the files to that project. • To remove files from a project. o Filter the display to show only the files from a single project (§5.4.5). o Select one or more measurements to remove (§5.4.3). o Click Remove from Project to see the remove files dialog (Figure 14). Figure 15 – Remove Files from Project o All projects that contain the selected files will be listed. o Select the desired project and click Remove. 34 TM CastAway -CTD User’s Manual (October 2010) YSI 5.4.5. Filtering Measurements to be shown on the Map or File List By default, all measurements stored in the CastAwayTM-CTD Software will be displayed on the map and in the file list. • • The number of measurements will increase rapidly, especially if you are working with more than one CastAwayTM-CTD. To simplify data management, you can filter which measurements are displayed based on several different parameters (Figure 16). o o Project Dates TM Devices (CastAway -CTD serial number) Sample type (CTD cast or point measurement) o o • If more than one type of filter is specified, only those files which meet all filter criteria will be displayed. Figure 16 – Filter Files Toolbar • To filter files by Project: o Use the Project pull down menu to specify the desired project or (All Files). • To filter files by Dates: o Click on the Dates icon. Figure 17 – Filter Dates Options o Select from several fixed filter options (Figure 17). Today, Yesterday, Last 7 Days, Last 30 Days, Last 90 Days, All o Alternatively, click on Selected Dates and specify the start and end date. TM CastAway -CTD User’s Manual (October 2010) 35 YSI • To filter based on Devices: o Click on the Devices button. Figure 18 – Filter Devices Options o Use the check boxes to select the devices for which files should be displayed. o If no boxes or all boxes are checked, data from all devices will be displayed. o Systems that show (not listed) are not controlled by this PC under the Devices tab (§5.3). • To filter based on Sample type: o Click on the Sample type button. Figure 19 – Filter Sample Type Options o Use the check boxes to select the sample types for which files should be displayed. o If no boxes or all boxes are checked, data from all samples types will be displayed. o The software can also mark a file as deleted without removing it from the system (§5.4.10). You can filter displayed files based on Not deleted only, Deleted only, or Deleted & not deleted. 36 TM CastAway -CTD User’s Manual (October 2010) YSI 5.4.6. Modify Chart Types and Appearance The right side of the software screen shows a number of charts plotting CTD data (Figure 20). Figure 20 – Example CTD Charts Many details of the charts can be specified in the software settings (§5.5.2). o Number and location of charts o Data type o Common axis variable (typically the vertical axis) o Chart appearance • A pull down menu at the top of each chart is used to specify the variable being plotted. • The number of casts plotted is based on the selected cast list at the bottom of the screen (§5.4.3). • To zoom or pan, first click on the desired chart. o Use the mouse wheel to zoom in or out. Hold the mouse over the part of the plot you want to remain in view. o Hold Alt while clicking and dragging a rectangle to zoom into that area. o Use the + and - keys to zoom in and out. o Click and drag on the charts to pan the view (shift the view left/right/up/down). o Use the arrow keys (←↑→↓) on the charts to pan the view. o Right click and select Fit to view to return the chart to its original appearance. o Press the Home key to return the chart to its original appearance. • TM CastAway -CTD User’s Manual (October 2010) 37 YSI • Use the toolbar at top to modify the charts (Figure 21). Figure 21 – Charts Toolbar o Use Enable auto-fit to determine if the plot axes change when additional measurement data is added or removed. If enabled, the axes will automatically adjust each time an additional measurement file is added or removed. If disabled, the axes are only automatically adjusted when the first measurement file(s) are added. The axes are not changed when additional measurements are added or removed. o Use Show samples to turn the plotting of sample location on/off. • Right click and select Copy Screenshot or Save Screenshot to capture the image of a chart. 38 TM CastAway -CTD User’s Manual (October 2010) YSI 5.4.7. Capturing Screen Images It is possible to capture an image of the map or any chart shown in the CastAwayTM-CTD Software. • • • Right click on the desired map or chart. Select Copy Screenshot to capture that image to the clipboard. Select Save Screenshot to save the image to a file. 5.4.8. Manually Changing Sample Type CastAwayTM-CTD measurements are flagged as either a Cast or Point Measurement based on how the data was collected. If there is insufficient data in a file, it will be flagged as Invalid. • You can manually change the sample type if needed. o Select the desired measurement file. o Right click on that file and click Sample Type. o Click the desired action. Change to Cast. Change to Point Measurement. Change to Invalid. TM CastAway -CTD User’s Manual (October 2010) 39 YSI 5.4.9. Manually Specifying Measurement Location Since the CastAwayTM-CTD includes a built-in GPS, most measurements include location data. If no GPS location data is included in the file (typically due to blocked satellites), you can manually input a location for that file. • Location data can be manually input only if no GPS data was stored with the file. o In the File view, these files show the Location Source as None. • To manually specify the location for a file: o Select the desired measurement file. o Go to the Map view. o Zoom / pan the map to view the region with your desired location. o From the selected file list, click the file and drag the cursor to the desired measurement location on the map. o The location for that file will now be marked by a red dot, indicating a manually specified location. • To remove a manually entered location: o Go to the file view and select the desired file. o Right click on that file and specify Location – Remove Manual Location. o That file will now show Location Source as None. 5.4.10. Deleting Measurements • To delete one or more measurements. o Go to the file view and select the desired file(s). o Right click on that file and select Mark as deleted. • These files are maintained in the software database and can be recovered. • To recover files marked as deleted: o Go to the file view and select the desired file(s). o Right click on that file and select Mark as deleted to revert to a non-deleted flag. • To permanently remove all files marked as deleted, you must purge the database (§5.7.2). 40 TM CastAway -CTD User’s Manual (October 2010) YSI 5.5. Software Settings The CastAwayTM-CTD Software settings allow you to control and customize all aspects of operation. • To access the settings dialog, click this icon in the upper left corner of the screen. • Alternatively, click the menu icon and select Settings from the pull down menu. 5.5.1. Software Settings: General Figure 22 – Software Settings: General The General tab configures basic software operation. • Language o This allows you to specify the preferred language for the software. o By default, only English language operation is supported. o The CastAwayTM-CTD Software allows the user to generate, import and share files to support operation in other languages (§5.7.3 and §5.7.4). o The language on the CastAwayTM-CTD LCD is configured separately (§5.3.3). • Show confirmation dialog on exit o Enables/disables the display of a confirmation dialog before exiting software. • Automatic file download o When enabled, the software automatically downloads any new files from a CastAwayTMCTD whenever that system is connected. o When disabled, the user must manually download files from the system (§5.3.4). • Default latitude o To accurately convert pressure to depth, the latitude of the measurement must be known. o This is normally taken from the GPS data in the cast. o If position data is not available, this value is used for pressure to depth conversions. • Default altitude o To accurately convert pressure to depth, the altitude of the measurement must be known. o This is normally taken from the GPS data in the cast. TM CastAway -CTD User’s Manual (October 2010) 41 YSI o If position data is not available, this value is used for pressure to depth conversions. • CSV fields in native language o This affects data exported to a CSV (comma separated values) format (§5.6). o If this option is enabled, labels in the CSV file are output in the language specified by these General software settings. o If this option is disabled, labels in the CSV file are always output in English. • CSV export header prefix o This affects data exported to a CSV (comma separated values) format (§5.6). o One export option is to output a CSV (comma separated values) format with header information at the top of the file. o This option allows you to specify a text string to put at the start of each header line, which may make the CSV easier to load for some software programs. o The default setting is %, which is the comment indicator for MATLAB. This setting allows MATLAB to ignore the header lines when loading a CastAwayTM-CTD CSV file. 42 TM CastAway -CTD User’s Manual (October 2010) YSI 5.5.2. Software Settings: Charts Figure 23 – Software Settings: Charts The Charts tab configures the plots used to display CTD data. • Layout o Determines the number and relative location of plots that are shown. o A variety of different row/column configurations are available (Figure 24). Figure 24 – Chart Layout Options • Graph type o This specifies what type of data is used in the CTD charts. For information about processing of CTD cast data, see § A-8. . o Processed: down and up cast data are combined to produce the best measurement possible (Appendix A). o Down: only data from the down cast are shown. o Up: only data from the up cast are shown. o Down and Up: data from the down and up cast are both plotted. o Raw: all samples are shown without processing or editing. This includes data prior to entering the water, while holding at the surface, and while waiting at the bottom between the down and up cast. TM CastAway -CTD User’s Manual (October 2010) 43 YSI • Common axis o This specifies the value against which all charts are shown: Depth, Pressure, or Time. • Axis synchronization o When set to Common axis only, all charts are zoomed and scaled to the same dimensions of the common axis – allowing for easier comparison of multiple plots. o When set to None, each chart is zoomed and scaled independently. • Max number of auto-loaded charts o When you select a number of casts to be displayed, the charts automatically show plots of the data from those casts. o If a large number of casts are selected, this can potentially show more data on the charts that can be easily viewed. This option determines the maximum number of files that are automatically displayed. o The default setting is 5. This means that if you select 20 different casts, only data from the first 5 of those casts will be automatically plotted. o It is always possible to manually add or remove casts from the plot (§5.4.3). • Line width o This specifies the line size on charts. • Point size o This specifies the size of symbols on charts when individual samples are displayed. • Font size o This specifies the text size for labels on charts. 44 TM CastAway -CTD User’s Manual (October 2010) YSI 5.5.3. Software Settings: Map Figure 25 – Software Settings: Map The Map tab configures the world map used as the background display. • Display up-cast location o Normally only the down-cast GPS location is displayed. o This enables display of both up and down-cast location on the map. o Down cast location is a solid blue circle, up cast is an empty blue circle; the two locations are connected by a line. • Map coordinates display o The GPS location of the cursor on the map can be shown on the map screen. o This option selects the format for the display of that data Hidden Coordinates not shown One line • Two lines Lat/lon format o GPS position data (latitude and longitude) can be displayed in a variety of formats. TM CastAway -CTD User’s Manual (October 2010) 45 YSI • Background map o Three different background maps are available. o Offline Map o Open Street Map o This map is included with the software installation and can be used without access to an internet connection. Because of file size limitations, the resolution is fairly low. This online map provides improved resolution with a street view, but requires access to an internet connection. Open Street Map - Osmarender o • This online map provides improved resolution with a street view, but requires access to an internet connection. The two online maps (Open Street Map and Open Street Map - Osmarender) provide an essentially identical view. The two versions are hosted by different web servers, giving a redundant source of data in the event that one of the servers is unavailable. New Custom Map o The CastAwayTM-CTD Software can be used with a variety of other online maps. o This button provides a dialog to configure the software for use with other online maps (Figure 26). Figure 26 – Custom Map Dialog o This option is intended for advanced users only. o Because of the wide variety of maps that are available, YSI is not able to provide direct support for the use of other online maps. This option is provided for customer convenience, but is not considered an integral and supported part of the software. 46 TM CastAway -CTD User’s Manual (October 2010) YSI 5.5.4. Software Settings: Geo Images Figure 27 – Software Settings: Geo Images A geo-referenced image is typically a satellite or aerial photograph of an area that has been imbedded with precise location data. • • The CastAwayTM-CTD Software can use geo-referenced images as a background for plotting in various parts of the map. The Geo Images tab allows you to load and configure geo-referenced images. To add a geo-referenced image to the CastAwayTM-CTD Software: • • • • Click the Add New button. Select the image file and click OK to load. Once the file has been loaded, you can specify how it is used. o The Visible check box determines whether or not the image is shown. o Transparency can be used to show the map through the image. 0% shows only the image, and 100% shows only the map. o Projection can be used to change which mapping projection is used. The software supports Web Mercator and WGS 84 Mercator projections. Move Up o When multiple geo images have been loaded, they can potentially be shown on top of one another. Images listed towards the top of the list are shown in front of those listed below. o This button moves a given image one step higher in the list. • Move Down o When multiple geo images have been loaded, they can potentially be shown on top of one another. Images listed towards the top of the list are shown in front of those listed below. o This button moves a given image one step lower in the list. TM CastAway -CTD User’s Manual (October 2010) 47 YSI An example of the map with a geo-reference image is below (Figure 28). Figure 28 – Software Map with Geo Image The use of geo-reference images is intended for more advanced users. Because of the wide variety of images that are available, YSI provides only limited support for this option. 48 TM CastAway -CTD User’s Manual (October 2010) YSI 5.5.5. Software Settings: Units Figure 29 – Software Settings: Units The Units tab allows you to specify the units used for all parameters displayed and output by the TM CastAway -CTD Software. • These units affect the software display and exported data. o See §5.3.3 to change the units shown on the CastAwayTM-CTD LCD. • A pull down menu is used to select the units for each parameter; the following units are available for each parameter type. o Time o Pressure o Depth o Temperature o Conductivity o Specific conductance o Salinity o Sound velocity Seconds Bar (bar), Decibar (dbar), Pascal (pa), Pounds Force per Square Inch (psi) Centimeter (cm), Meter (m), Fathom (fathom), Foot (ft), Yard (yd) Celsius (ºC), Fahrenheit (ºF), Kelvin (ºK) MicroSiemens per Centimeter (μS/cm), Siemens per Meter (S/m) MicroSiemens per Centimeter (μS/cm), Siemens per Meter (S/m) Practical Salinity Scale (PSS) o Meters per Second (m/s), Feet per Second (ft/s), Kilometers per Hour (km/h), Miles per Hour (mph) Density Kilograms per Cubic Meter (kg/m3), Grams per Cubic Centimeter (g/cm3), Pounds per Cubic Foot (lbs/ft3), Pounds per Cubic Inch (lbs/in3) When ready, click OK to enable new settings or Cancel to revert to previous settings. • TM CastAway -CTD User’s Manual (October 2010) 49 YSI 5.6. Importing and Exporting Data The CastAwayTM-CTD Software can import and export data in a variety of different formats. Click the Import Files, Export Files, or Export Summary icons at the top right corner of the screen. 5.6.1. Import Files • Data files can be imported in two different formats. o Archive (.zip) files as exported by the CastAwayTM-CTD Software (§5.6.2). o Raw CastAwayTM-CTD files (.ctd, .cactd) as generated by the CastAwayTM-CTD. • Simply click the Import Files icon and select the desired files. • Alternatively, you can simply drag these files onto the CastAwayTM-CTD Software and they will be imported automatically. • The software shows a dialog that allows you to select which of the files are imported, how they are merged if the file already exists, and whether or not project information is imported with the data files (Figure 30). Figure 30 – Import Files Dialog 50 TM CastAway -CTD User’s Manual (October 2010) YSI 5.6.2. Export Files CastAwayTM-CTD files can be exported in a variety of formats. • • Select the file or files that you wish to export (§5.4.3). Click the Export Files icon to open the export files dialog (Figure 31). Figure 31 – Export Files Dialog A variety of export options are available. • Files to export o Use the pull down menu to specify a Single file, all Selected files, or All files. • Format TM o CastAway raw o The CTD data in CastAwayTM format, with no post-processing modifications. The default file name uses serial number, date and time with the .ctd extension. TM CastAway The CTD data in CastAwayTM format, including any post-processing modifications, and any project information that has been added. The default file name uses serial number, date and time with the .ctdx extension. o TM CastAway with edits (remove project info) The complete CTD data, including any post-processing modifications; any project information has been removed. The default file name uses serial number, date and time with the .ctdx extension. o with edits CSV (comma separated values) This is a common ASCII file format that can be easily imported by many other software programs (such as Microsoft Excel). The system outputs one line per sample, including only the fields specified. • Fields: Pressure, Depth, Temperature, Conductivity, Specific conductance, Salinity, Sound velocity, and Density. • The first line in the file shows the parameter and units for each column. The default file name uses serial number, date and time with the .csv extension. TM CastAway -CTD User’s Manual (October 2010) 51 YSI o CSV (comma separated values) + INFO HEADER o HYPACK® o MATLAB • This is a standard ASCII file format that can be easily imported by many other software programs (such as Microsoft Excel). The top of the file includes an informational header with cast information such as date, time, and GPS location. • Each line of the header can be proceeded by user specified text if desired (§5.5.1). The system outputs one line per sample, including only the fields specified. • Fields: Pressure, Depth, Temperature, Conductivity, Specific Conductance, Salinity, Sound velocity, and Density • The first line of data labels the parameter and units for each column. The default file name uses serial number, date and time with the .csv extension. A format compatible with import into the Hypack software package. A format compatible with import into the MATLAB software package. Export packaging o When exporting multiple files, they can either be combined into a single Zip file (archive) or placed into a Folder. • Cast data o This specifies what type of data is output. For information about processing of CTD cast data, see §A-7. o Processed: only the final processed profile (combined down and up casts) is output. o Down: only down cast data is output. o Up: only up cast data is output. o Down and Up: down and up cast data are output. o Raw: all raw CTD data is output without processing or editing. This will include data taken in the air, at the surface (not moving), and at the bottom (not moving). 52 TM CastAway -CTD User’s Manual (October 2010) YSI 5.6.3. Export Summary This option exports a summary of one or more CastAwayTM-CTD files (Figure 32). Figure 32 – Export Summary Dialog • Files to export o Use the pull down menu to specify Selected files or All files. • Click Export to output a summary of the Processed Data from the desired files. o Specify the desired file name and location. o The summary is output in CSV (comma separated values) format, easily readable by a variety of different software programs. o The summary output includes data such as file name, date and time, location, and min/max values for all CTD data. TM CastAway -CTD User’s Manual (October 2010) 53 YSI 5.7. Software Maintenance Functions To access software maintenance functions, click the menu icon in the upper left corner, select Maintenance from the pull down menu, and then select the desired function. 5.7.1. Data Backup All data in the CastAwayTM-CTD Software is stored in a customized database. To create a backup of this database: • • • From the menu icon, click Maintenance and then Data backup. Specify the file name and desired location for the backup. The backup data is stored a .zip archive file. o If you need to re-load backup data into the CastAwayTM-CTD Software, open the software and import the archive file into the software (§5.6.1). 5.7.2. Purge Deleted Files The software allows you to mark files as deleted (§5.4.10), which flags the files as deleted but does not permanently remove them. • • • The Purge Deleted Files function permanently removes any of these files from the CastAwayTM-CTD Software database. Purged files cannot be recovered unless they have been backed up or are still available on the system that collected the files. From the menu icon, click Maintenance and then Purge Deleted Files. Confirm that you want to permanently remove these files from the database. 54 CastAway -CTD User’s Manual (October 2010) • TM YSI 5.7.3. Import Language File The CastAwayTM-CTD Software is configured to allow operation in many different languages. For this, it includes a program called the CastAwayTM Translator that allows users to generate their own language files – and thus to provide custom translations in any language desired. For information on using the CastAwayTM Translator to generate a new language file, see §5.7.4. To load a language file into the CastAwayTM-CTD software: • Click the menu button in the upper left corner. o Select Maintenance. o Select Import Language File. • Select the desired language file (.lang). o This will load the desired language file into the software. • It will then restart the software using the new language settings. • This new language is then added to the list of available languages in the software settings menu (§5.5.1). You should feel free to exchange language files with other CastAwayTM-CTD users. TM CastAway -CTD User’s Manual (October 2010) 55 YSI 5.7.4. Run CastAwayTM Translator The CastAwayTM-CTD Software is configured to allow operation in many different languages. To do this, it includes a program called the CastAwayTM Translator that allows users to generate their own language files – and thus to provide custom translations in any language desired. To generate the language file needed to operate the software in a new language: • Click the menu button in the upper left corner. o Select Maintenance. o Select Run CastAwayTM Translator. • This will open the CastAwayTM Translator program (Figure 33). • To work properly, the computer must be connected to the internet. Figure 33 – CastAwayTM Translator • First click on Supported culture names in the upper right corner. o This loads a list of supported culture names from the internet. A supported culture name is required in order to use the automatic translation feature. o Enter the desired culture name from the list on the first line of the translator table. The culture name is typically an abbreviation of 2-6 letters. For example, es-mx is the abbreviation for Spanish (Mexico). • One option is to manually enter all translated values. o The problem is that there are many hundreds of terms and phrases that need to be translated, and this would be very time consuming. o For many common languages, a quicker option is available. • Once a valid culture name has been entered, the software can use GoogleTM to automatically translate all phrases. o Click GoogleTM all empty. o The software will search for translations of all empty terms. This will take a few minutes depending on the speed of the computer and internet connection. 56 TM CastAway -CTD User’s Manual (October 2010) YSI • Once complete, you should review all translations for accuracy. o The automatic translation feature works well, but is likely to use a number of incorrect terms. Reviewing all terms ensures the software will be easy and reliable to use. o You can manually edit any term to improve the translation. • When you are satisfied with all translations, click Save As and specify a name for the new language file (.lang) you have created. • You can now exit the CastAwayTM Translator software and load the language file into the TM CastAway -CTD Software (§5.7.3). The CastAwayTM Translator software can also be used to edit and update existing language files as needed, using the New, Open, Save and Save As functions. • You can also look up only those terms that have not been translated using the GoogleTM empty button. This may be helpful when software updates are available, as there may be new terms that need to be translated. • The Filter function allows you to view only those items whose Id starts with a given text string. o You can see the Id text strings in the first column of the translation table. o Type the desired text into the Filter window. o The software will then display only those items whose Id starts with the entered text. o For example, if you filter based on Common_Button, you will see only those parameters whose Id starts with that text (Figure 34). Figure 34 – Example Filter Use TM CastAway -CTD User’s Manual (October 2010) 57 YSI 5.7.5. Repair Device without Firmware The CastAwayTM-CTD operating system is extremely robust, and has been designed to recover from any foreseeable problem. This section gives procedures that should be used only if the firmware has become corrupted and the system is no longer working reliably. • In some cases (most commonly after a failed firmware upgrade), the system can enter a state where it appears the system is not working properly. o The LCD display is blank. o The LED is flashing red. o The system does not respond to any buttons. • In most cases, the system will recover from this automatically. o Leave the system alone for up to 5 minutes. o The system will typically reboot and should operate normally. If the above does not work, the next step to try: • • Remove the batteries from the system. Leave the system without batteries for at least 30 minutes. o This allows internal capacitors to discharge and forces the system to a complete reset. • Install new batteries. This should reset the system and return it to normal operation. If the above options do not work, contact YSI for additional support. The instructions below should not be attempted without direct assistance from YSI. Only if the above options have failed, and you are certain that the firmware is corrupted, should the next steps be used. • • Remove the batteries from the system. Leave the system without batteries for at least 30 minutes. o This allows internal capacitors to discharge and forces the system to a complete reset. • Install new batteries. While the LED is flashing red for the first few seconds of the reboot process, press all three buttons in the following sequence. This must be done fairly quickly. Upper left button Lower left button Lower right button o This puts the system in a special low-level operating mode. • Run the CastAwayTM-CTD software. o • Click the menu button in the upper left corner. o Select Maintenance. o Select Repair device without firmware. This option may not be initially available until the software has found the system on the Bluetooth communication. If necessary, wait a few seconds and try again. o Follow the on-screen instructions to load new firmware, using the firmware provided by YSI. This procedure is very similar to the standard method of firmware upgrade (§5.3.4). 58 CastAway -CTD User’s Manual (October 2010) TM YSI Section 6. Maintenance, Quality Control, and Troubleshooting 6.1. CTD Maintenance and Care Proper care will extend the life of the CastAwayTM-CTD. It also ensures accurate data within the one year calibration period. • After use: o Remove the CastAwayTM-CTD from its protective sleeve. o Thoroughly rinse the CTD and sleeve with fresh water and allow to air dry. • If the conductivity cell gets oil or grease in it: o Prepare a solution of warm water and mild dish soap. o Place the CTD into the solution and move back and forth to rinse the flow-through cell. o If necessary, you can use the cleaning brushes supplied with the CastAwayTM-CTD. These brushes are carefully selected and sized for use with the CastAwayTM-CTD. Do not use other brushes for cleaning the CTD sensors. Only insert these brushes from the bottom of the system. Inserting from the top of the system can potentially damage the temperature sensor. o The pins for the conductivity cell are located near the bottom of the sensor. These are the sensors that are most sensitive to dirt or oil. o Insert the brush into the bottom of the cell and gently move back and forth to clean (Figure 35). • When done cleaning, rinse the CastAwayTM-CTD with fresh water and allow to air dry. Figure 35 – CastAwayTM-CTD Cleaning Brush 6.1.1. CTD Housing The CastAwayTM-CTD housing is made from a robust plastic material that is designed to withstand most any fresh or salt water environment. It is lightweight and corrosion resistant. The orange color was specifically selected for high visibility. However, this neon orange color is very difficult to match exactly from one production batch to the next. You may notice slight variations in color between housing parts; this in no way affects the accuracy or durability of your CastAwayTM-CTD. TM CastAway -CTD User’s Manual (October 2010) 59 YSI 6.2. Calibration Guidelines It is recommended that the CastAwayTM-CTD sensors be recalibrated at the factory once a year. To arrange for calibration, contact YSI customer support. Phone :+1 (800) 765-4974 | +1 (937) 767-7241 Fax :+1 (937) 767-9353 Email : [email protected] (Support information) Web : http://www.ysi.com/CastAway Your CastAwayTM-CTD is carefully calibrated at the factory and it is designed to remain within specifications for one year. YSI does not allow users to recalibrate the system because of possible errors in the recalibration process. The CastAwayTM-CTD is designed specifically to collect data while moving and the calibration process is engineered to account for this motion. Because of its unique design, a factory calibration is the only way that YSI can ensure that the conductivity and temperature flow cell is properly calibrated for use. 60 TM CastAway -CTD User’s Manual (October 2010) YSI 6.3. Data Quality Control The CastAwayTM-CTD is a field instrument and it is always possible for something to go wrong or get damaged. To avoid collecting data with a damaged system, there are a few self-diagnostic checks that are performed onboard automatically. The CastAwayTM will display a warning message if it should detect a problem. Built in diagnostics will alert you if there is a problem with the system. • • The conductivity cell monitors redundant electrodes for erratic measurements to check for possible contaminant coatings in the flow cell. Comparisons of internal and external temperatures are checked for extremes and possible problems. If you would like to confirm that your CastAwayTM-CTD is operating correctly, there are a few simple checks that you can perform at any time. To check your system in the air: • • • Rinse the system in fresh water and allow to air dry completely. Follow the instructions in §1.4 to navigate to the real time data display screen. Temperature should be close to the local air temperature. If the temperature sensor is wet, the measured temperature could be different from the actual air temperature. • The conductivity, sound speed, and salinity should be near zero in air if the system is completely dry. o In some cases, humidity in the air can be high enough to actually measure conductivity. o Moisture in the conductivity cell or on the temperature sensor can also produce unpredictable results. o If you see conductivity values below 500, you are probably measuring some moisture in the air. Sound speed and salinity will be nonzero, but these numbers are meaningless. o If the values in air are nonzero and the conductivity is much higher than 500, clean the conductivity cell and allow it to dry completely (§6.1) before repeating the previous steps. • Pressure should be about 10 dbar or 15 psi. These values will vary due to atmospheric pressure and altitude. To check your system in water: • • • • Follow the same steps as above to see if your measurements are reasonable for the water you are sampling. Fresh water conductivity can vary greatly depending on the location. Even tap water will be slightly conductive and have a low salinity. Ocean water measurements can also vary depending on location, evaporation, and rainfall. Some general guidelines to keep in mind when making a cast: • • Frequently check to make sure the flow cell is clear of debris before casting. Be aware of nearby inlets, rivers, streams, tributaries, storm water drains, outfalls, etc. These can create unexpected and interesting features in your profile graphs. TM CastAway -CTD User’s Manual (October 2010) 61 YSI When reviewing data with the CastAwayTM-CTD Software, there are some things you can look for to verify that you are collecting high quality data. • • • • • • • Make note of any outliers or spikes in the Processed data profile graphs. Change the data to plot both the Down and Up Casts (§5.5.2). o Look for any large or unexpected differences between the two casts (§A-8. ). Perform repeated casts at the same location, and use the software to compare data from those casts. If repeated casts show the same results, this is a good indicator of data quality. However, if repeated casts are different, this can also be correct if the water you are sampling is moving because of wind, surface waves, or internal waves. Make sure the temperature and conductivity are reasonable for the body of water you are sampling. Spikes in temperature or conductivity near the surface can be caused by air bubbles trapped in the flow cell. Spikes in conductivity can be caused by algae, small fish, jelly fish, plankton, etc. Spikes near the bottom can be caused by sediment entering the conductivity cell. Water is a very dynamic environment. It can be distinctly layered or well mixed and uniform. Layers of different densities can be avenues for internal waves and currents that can create unique features in your data. The best quality control you can perform is to make sure the features you see in your data make sense for the sample location. 62 TM CastAway -CTD User’s Manual (October 2010) YSI 6.4. Troubleshooting Tips 6.4.1. No System Time The CastAwayTM-CTD uses the integrated GPS to acquire and track the date and time. • When powering the CastAwayTM-CTD for the first time, you will need to get a GPS signal to set the system clock. o Note that date/time is not shown at the bottom of the screen. • If you attempt to start data collection without allowing the system to acquire the date and time, it will report an error message. • To resolve this, you must go to an open area outside and allow the system to acquire a GPS signal to determine the date and time. • On a cold start, GPS reception can take 3 to 6 minutes depending on your location and the number of satellites in view. Poor GPS satellite reception can increase the wait time. Follow the progress with the GPS status indicator or watch for the date and time to appear at the bottom of the screen. • • o GPS off o GPS on, no signal o GPS on, weak signal o GPS on, good signal When the Universal Coordinated Time (UTC) appears at the bottom of the screen you are ready to start collecting data. You may have to repeat this process when you replace the batteries. The system will keep track of time for a short period without batteries, but if left without batteries the date and time will reset. TM CastAway -CTD User’s Manual (October 2010) 63 YSI 6.4.2. Unable to Establish Bluetooth Connection If you are unable to establish communication from the CastAwayTM-CTD Software to your system, there are first a couple of simple checks you should perform. • Be sure the USB Bluetooth adaptor included with the system is installed in a USB port of your PC (§5.2). • Make sure the CastAwayTM-CTD is close to your PC and has been turned on. o The maximum Bluetooth range is 10 m (30 ft). o When possible, place the CTD within 1-2 m (3-6 ft) of the PC for best results. • Under the Devices tab in the software, make sure that communication for that system has not been disabled. o If it has been disabled, right click on the Status area and click Communication disabled to toggle this setting. • If possible, attempt to communicate with the CastAwayTM-CTD using another computer and a different USB Bluetooth adaptor. This can help resolve where the problem occurs. If none of the above is successful, you may have a problem with the driver installation for the USB Bluetooth adaptor. Some general guidelines are given here; consult your system administrator when making any changes. • • • • You need to access the Device Manager of your Windows operating system. Windows XP: the following should access the Device Manager. Open the Control Panel. Click the System icon. Select the Hardware tab and click on Device Manager. Window Vista: the following should access the Device Manager. CP - DM Open the Control Panel. Click the System icon. For XP and Vista, the Device Manager will be similar to Figure 36. Figure 36 – Windows Device Manager 64 TM CastAway -CTD User’s Manual (October 2010) YSI • • • • • • Expand the section that shows Bluetooth Radios. The exact drivers shown will vary depending on the operating system and the specifics of your computer, but it is likely to look something like Figure 36. o The driver for the CastAwayTM-CTD USB Bluetooth adaptor is commonly called Generic Bluetooth Radio. Look for any other Bluetooth adaptors that are installed, especially any that are flagged as not working (_!_). Whenever making changes to device drivers, be sure to consult your systems administrator to be sure these changes do not cause other problems on your PC. It may be necessary to remove the USB Bluetooth adaptor, un-install any remaining drivers, and then re-install the USB Bluetooth adaptor. If necessary, a driver for the USB Bluetooth adaptor is included on the USB data drive included with the system. To Troubleshoot the Bluetooth Radio in Windows 7 • • • • Open the Control Panel. Select View Devices and Printers under the Hardware and Sound section. Right click on the CSR Bluetooth Radio Select the Troubleshoot option and consult with your system administrator before following the Windows 7 recommendations. TM CastAway -CTD User’s Manual (October 2010) 65 YSI 6.4.3. Problems in Cold Weather Operation of any electronic device, particularly one that uses a LCD, can be challenging in very cold weather. • Batteries lose power in very cold conditions. o This can cause batteries to die much sooner than they would otherwise. o Monitor battery power closely, and expect that you may need to change batteries more often than you would in warmer weather. YSI has found that Energizer ultimate lithium 1.5 V AA batteries offer improved performance in colder weather. Though these batteries are more expensive, you might consider using them if you will be making multiple measurements in cold weather. IMPORTANT: You must only use 1.5 V lithium batteries – other lithium batteries • The LCD used by the CastAwayTM-CTD is rated for operation to -20º C (-4º F). o LCD operation is likely to be the limiting factor for using the CastAwayTM-CTD in cold weather. o When air temperatures are very cold, you can improve operation by minimizing the length of exposure to the cold air. o When possible, keep the system in a warm place when not in use. This might be in the inside of a heated vehicle, or tucked inside a warm jacket. If the system housing is kept warm, the LCD may keep operating for some time even if the air temperature is below the minimum operating temperature. o Remember that water temperature will never be much less than 0º C – so by comparison, the system may be warmer when in the water. o Minimize the amount of time spent reviewing data on the LCD. If possible, move the system to a warmer environment when reviewing data. 66 CastAway -CTD User’s Manual (October 2010) (which run at 3.6 V) may damage the system TM YSI 6.4.4. Surface Spikes in Conductivity / Salinity In some casts, you may see spikes in the conductivity and salinity data near the water surface. • • These spikes can be caused by air bubbles trapped in the conductivity cell when the system is first immersed in the water. Following the recommended procedure of soaking the system for 5-10 seconds at the surface prior to starting the cast should avoid this problem. 6.4.5. CastAwayTM-CTD Does Not Respond If the CastAwayTM-CTD does not wake up properly or respond to normal commands, there is generally a simple solution. Try the steps below in the order shown – using only those steps required to regain normal operation. • Leave the system idle for a period of 5 minutes. o In certain situations, the system will enter a special low level boot mode. o In this mode, it should automatically re-start after about 1 minute. o In most cases, this problem will resolve itself automatically. Waiting 5 minutes ensures the system will re-start if possible. • Remove the batteries and install new batteries. o Verify the batteries are installed in the correct orientation (§1.2). o Batteries that have been drained may not allow the system to operate normally. • Remove the batteries from the system. o Leave the system without batteries for at least 30 minutes. o This allows internal capacitors to discharge and forces the system to a complete reset. o Install new batteries. This should reset the system and return it to normal operation. If none of the above work, it is possible that the system firmware has been corrupted. At this point, contact YSI customer support. They will lead you through a procedure to evaluate if the firmware is functioning, and to recover from corrupted firmware if necessary (§5.7.5). TM CastAway -CTD User’s Manual (October 2010) 67 YSI Appendix A. CastAwayTM-CTD Principles of Operation TM Most people probably think water is simply water. But if we dive a little deeper into the details, water is a complex fluid. It is arguably the most important molecule on this planet and quite possibly the most interesting. It exists in a variety of states from ice to steam and clouds to rain. It can dissolve rocks and minerals. You can walk on it when it’s frozen, swim in it when it’s liquid, and even drink it when you’re thirsty. It sustains just about every life form on earth and it is an ecosystem unto itself. We’ve built spacecraft to look for it and submarines to explore it. It is no wonder that oceanographers and hydrologists dedicate so much of their time to studying water. The CastAwayTM-CTD will open new doors in the science of water. The small handheld size makes collecting data easy enough for a single person to do just about anywhere. The integrated LCD screen displays a simple yet comprehensive user interface along with instantaneous data feedback. You can view graphs and statistics from your casts without the need for a separate computer. The integrated GPS for precise location data completes the picture of a functional and field-friendly solution for capturing high quality data with a minimum of time and effort. Coastal and inland water profiling has never been easier. A-1. Purpose The CastAwayTM-CTD Principles of Operation provides both experienced and novice users with a technical description of the CastAwayTM-CTD and the data it records. It includes basic advice on methods for collecting the best CTD data and how to interpret your data. This document is intended to work in tandem with the CastAwayTM-CTD Users Manual, which describes the details for operating the system. A-2. What is a CTD? A CTD measures conductivity and temperature profiles with respect to depth. The acronym CTD stands for Conductivity, Temperature, and Depth. For a CTD, profiling refers to a series of measurements collected as the instrument itself descends from the surface of the water to the bottom and back up again. To collect profile data, a CTD is typically lowered from a boat or dock by hand or with a winch. Conductivity, temperature, and pressure are recorded while descending and ascending. This data provides a complete picture of water properties that change with respect to depth. Using these three measurements and applying the appropriate equations, we can calculate salinity, sound speed, density and depth to name a few of the more commonly sought parameters. 68 TM CastAway -CTD User’s Manual (October 2010) YSI A-3. Who Uses CTDs? The CTD is a versatile tool that is used by many different groups of people. • • • • • • Oceanographers studying and modeling the intricate details of seawater consider the CTD to be one of their most essential tools. Hydrographic surveyors use CTDs to characterize the speed of sound in water so that they can precisely calibrate the ranges of their echo sounding equipment. Hydrologists employ CTDs to detect salt water intrusion and other contaminants in rivers, lakes, wells, and reservoirs. Biologists in the aquaculture and fisheries industries regularly collect CTD data to ensure the health and well-being of the fish they monitor. Coastal engineers use CTDs in rivers, inlets, and estuaries to study local tides. Even fisherman use CTDs to locate parcels of water that are attractive to certain species of fish. TM CastAway -CTD User’s Manual (October 2010) 69 YSI A-4. Water Layers: Temperature, Salinity, and Density The water in almost every lake, river, estuary and ocean is stratified into different layers. The formation of these layers is usually driver by temperature, salinity, and/or and density. In general, cold water is denser than warm water while salt water is denser than fresh water. Denser water usually tends to settle near the bottom, while less dense water tends to float towards the surface – although there are exceptions to this. Figure 37 is a graphic representation of intersecting layers of water where a freshwater river is flowing into the ocean. Because the fresh water is less dense, it floats near the surface as it enters the ocean. Fresh water wedges can extend out into the ocean for several kilometers and salt water wedges can migrate similar distances up rivers during high tides. Figure 37 – Boundary Layers for a Fresh Water River Flowing into the Ocean Temperature conditions in one layer may be notably different from conditions in another layer. The boundary between two layers with different temperature is called a thermocline. Water of different salinities will often be stratified in layers, especially where fresh and salt waters come together. The boundary where there is a notable change in salinity is called a halocline. Likewise a change in density is called a pycnocline. In coastal waters, the pycnocline usually coincides with the halocline because water density is directly related to temperature and salinity. Underwater acoustics are widely used to map the depth of rivers, lakes and the ocean, as well as to measure physical properties of the water and its motion. Thermoclines and haloclines are areas of interest in the field of underwater acoustics because these boundaries have unique physical properties. They are capable of reflecting sound from acoustic instruments as well as changing the direction or path of an acoustic beam through refraction. The local change in water density creates this unique boundary. Thus measurements of different water layers can be essential for many studies using underwater acoustics. 70 TM CastAway -CTD User’s Manual (October 2010) YSI A-5. CTD Measured Data The CastAwayTM-CTD uses three sensors to profile conditions in the water: conductivity, temperature, and pressure. The conductivity and temperature sensors are located in the flow-through channel along the back of the CastAwayTMCTD housing, while the pressure sensor port passes through the housing at the top of the battery cap (Figure 38). The flow-through channel is designed to ensure a steady flow of water past the sensors when the system is descending and ascending through the water column. Conductivity refers to the electrical properties of water, or specifically how much electricity the water conducts. Pure water has low conductivity while seawater has high conductivity. The conductivity of water is proportional to the concentration of ions in solution which carry the electrical current. The most common ion in seawater is chlorine, primarily from dissolved salts. Figure 38 – CTD Sensors To measure conductivity, the CastAwayTM-CTD has six electrodes in its flow-through channel. Although only two electrodes are required for a basic conductivity measurement, using six electrodes within the enclosed channel improves the accuracy of the conductivity measurement while increasing its immunity to calibration errors that plague many conductivity measurements. Two electrodes generate an electrical current and the remaining four are used to measure the resistivity of the water contained within the cell. Resistivity and conductivity are related by the following equation. C= K R C is conductivity, R is the measured resistance in ohms and K is the cell constant. K= l A l is the distance between the electrodes in centimeters and A is the cross-sectional area of the volume of water enclosed by the cell in square centimeters. The CastAwayTM-CTD measures resistance in ohms and this is converted to conductivity, reported in units of microsiemens per centimeter (µS/cm). Temperature is measured using a thermistor. Thermistors have a well known relationship between resistance and temperature; resistance of a thermistor changes as the temperature changes. The thermistor in the CastAwayTM-CTD is calibrated to the ITS-90 standard following the recommendations of the Joint Panel on Oceanographic Tables and Standards and Saunders (1990). The CastAwayTM-CTD, like all CTDs, uses a pressure sensor to determine depth. It is important to note that depth is not directly measured; pressure is measured and depth is derived from this data. The calculation of depth is described later (§A-6. ), but it is important to understand that although depth and pressure are related, they are not necessarily equal. TM CastAway -CTD User’s Manual (October 2010) 71 YSI Scientists often use units of decibars for pressure because one decibar is approximately equal to a depth of 1 meter. This approximation gets worse the deeper you go. At a pressure of 100 decibars the depth in the ocean is closer to 100.5 meters while at 10,000 dbars the depth is about 9,700 meters. These depths vary slightly with changes in density caused by temperature and salinity differences. Pressure (dbar) The CastAwayTM-CTD removes atmospheric pressure from the underwater pressure measurements; this is sometimes referred to as gauge pressure. The atmospheric pressure is measured before and after each deployment. During post-processing, the change in atmospheric pressure over time is removed from the entire sample using a linear fit. 0 0 10 10 20 20 30 30 40 40 50 50 60 60 70 70 80 80 90 90 100 10 12 14 16 o Temperature ( C) 18 100 3.7 3.8 3.9 4 4.1 4.2 4.3 Conductivity (µS/cm) 4.4 x 10 4 Figure 39 – Example Temperature and Conductivity Profiles Figure 39 gives an example of the raw conductivity, temperature and pressure data collected by the CastAwayTM-CTD; this data was collected in the Pacific Ocean near San Diego, California. In this data, a temperature gradient of about seven degrees exists in the upper layer of the ocean. The thermocline is located at a pressure of about 30 decibar (depth of about 30 meters). Below this, the temperature is much more stable. The influence of temperature on conductivity is seen in the nearly identical vertical structure of the two measurements. Since the salinity of the ocean is fairly constant in this area, the change in temperature is mostly responsible for the change in conductivity. To separate the influence of temperature on conductivity, scientists often use a derived parameter called specific conductivity (§A-6. ). 72 TM CastAway -CTD User’s Manual (October 2010) YSI A-6. CTD Derived Parameters In addition to conductivity and temperature, a number of valuable parameters can be derived from the data collected by a CTD. Using an advanced microprocessor, the CastAwayTM-CTD provides four of the most commonly derived parameters after the completion of each cast: specific conductance, salinity, sound speed, and depth. In the CastAwayTM-CTD Software, you can also view density. To derive these additional parameters the CastAwayTM-CTD uses established, internationally recognized methods. These methods have been compiled into something known as EOS-80 – the International Equation of State for Seawater (1980). The equations were published by UNESCO in 1983 (§A-11. ). Specific Conductance The CastAwayTM-CTD measures the conductivity of the water, which is primarily a function of the concentration of ions in the water. However, conductivity is also affected by water temperature. To remove temperature effects, we derive a parameter called specific conductance. Specific conductance may be a more useful parameter for certain applications. Hydrologist sometimes use specific conductance to identify pollution events in fresh water. Because pesticides and fertilizers increase the conductivity of water, agricultural runoff can often be detected by analyzing profiles of specific conductance in fresh water basins. The calculation of specific conductance from conductivity is a fairly simple formula. This is the standard method for applying a temperature correction to any conductivity measurement; the slope depends on the material measured. The slope of 0.020 used here is for water. SpC = C 1 + 0.020 * (T − 25) Where: • • • SpC C T = Specific conductance (µS/cm) = conductivity (µS/cm) = temperature (ºC) Salinity Prior to the 1970s, the salinity of water was measured primarily through the chemical analysis methods of titration and evaporation. In the mid 1960s, oceanographers began using conductivity meters to analyze water samples exploiting the direct correlation between the electrical conductivity of water and the amount of ions it contained. Since Chlorine from salt is the primary ion, the amount of ions can be directly related to the amount of salt in the water. Historically, salinity was defined in terms of parts per thousand (ppt). A salinity of 35 ppt meant 35 pounds of salt per 1,000 pounds of seawater. In 1978, oceanographers redefined salinity in terms of the Practical Salinity Scale (PSS-78) based on the conductivity ratio of a sea water sample to a standard potassium chloride KCl solution at 15º C and atmospheric pressure. Ratios have no units, so technically the salinity given by PSS-78 has no units and it is not the same as ppt; a salinity of 35 PSS-78 is not equal to 35 grams of salt per liter of water. Ocean salinity generally ranges from 31 to 39 PSS-78. TM CastAway -CTD User’s Manual (October 2010) 73 YSI Using the EOS-80 equations, salinity can be directly calculated from temperature, conductivity, and pressure measurements (Millard & Fofonoff, 1983). The CastAwayTM-CTD records these parameters and calculates salinity onboard after each cast. Sound Speed The speed of sound in water is a critical value for any application that makes use of underwater sound. These applications include bathymetric surveys done in harbors, estuaries, rivers, and coastal areas. Detailed knowledge of the sound speed profile is needed to convert the acoustic data to accurate water depth information. Sound speed can be calculated from temperature, salinity, and pressure (Millard & Fofonoff, 1983). Since the CastAwayTM-CTD measures and calculates these parameters with each cast, this data can be directly used for a variety of applications using underwater acoustics. Density Density is the mass of a given volume of water. It is important for converting pressure data to depth, and also can be used to predict density driven currents. Density can be calculated from temperature and salinity (Millard & Fofonoff, 1983). Depth A CTD does not directly measure depth, it measures pressure. To accurately determine depth from pressure data, we need several other pieces of information – all of which are directly available from the CastAwayTM-CTD. • • The density of water, which can be calculated based on temperature and salinity. The location of the measurement, specifically latitude and altitude. This data is recorded from the GPS onboard the CastAwayTM-CTD. With the above data, we can convert pressure to depth with considerable accuracy. • • 74 Gravity is calculated using the WGS84 ellipsoidal gravity formula using local latitude and altitude measured by the GPS. o If there is no information from the GPS a default latitude of 30 degrees and a default altitude of zero are used. These defaults can be changed in the software (§5.5.1). o These calculations are taken from the WGS84 Ellipsoidal Gravity Formula, Department of Defense World Geodetic System, 1984. The depth is calculated from equation 25 of (Millard & Fofonoff, 1983), and includes a full integration of the geopotential anomaly over the entire cast to account for changes in water density. TM CastAway -CTD User’s Manual (October 2010) YSI A-7. Best Measurement Practices Making measurements with the CastAwayTM-CTD is quite simple; the basic steps are described in detail in the Users Manual (Section 2 and Section 3). There are a few key items that should be kept in mind to ensure the best quality data. • • • • At the start of the cast, hold the system underwater near the surface for 5-10 seconds. This allows the temperature and conductivity sensors to adjust from air to water conditions, and avoids problems in the first part of the down cast. For the down cast, allow the system to free fall to the bottom. o The size, shape and weight of the CastAwayTM-CTD has been specifically designed to free fall at approximately 1 m/s (3.3 ft/s). o Allowing a clean free fall ensures a steady flow of water through the flow-through cell and past the sensors. For the up cast, retrieve the system at a steady rate of about 1 m/s (3.3 ft/s). o A steady rate ensures a steady flow of water past the sensors for the best quality data. o Do not let the system rest on the bottom. Begin the up cast as quickly as possible. Do not pause during either the down or up cast. TM CastAway -CTD User’s Manual (October 2010) 75 YSI A-8. Overview of Available Data The user can view several types of data from the CastAwayTM-CTD: Processed, Down Cast, Up Cast, or Raw. For most applications, we recommend using the processed data without additional modification. This section provides an overview of the different types of data available from the CastAwayTM-CTD. Raw Data o Raw data is exactly that – the raw samples of conductivity, temperature, and pressure data versus time. No derived parameters (specific conductivity, salinity, sound speed, density or depth) are available. o Pressure data has been corrected for atmospheric pressure using data collected in the air at the start and end of the cast. This sets pressure at the water surface to zero. o Raw data is used only for specialized applications. In most cases, it is better to use either the Processed data, or the Down / Up Cast data. o Raw data includes all data during the entire cast: in air at the beginning, at the surface, down cast, at the bottom, up cast, and in the air at the end. o The figure to the right shows raw temperature data from a sample cast (collected in a reservoir in San Diego, California). Notice the variation in temperature at the top – indicating some of that data was collected in air. This data is removed by the CastAwayTM-CTD processing. Notice the temperature at the bottom. When the system first hits the bottom the temperature is accurate. As the system sits on the bottom motionless, the thermistor begins heating the water around it. This only occurs when the system or the water is not moving. This heating is a result of the electrical current that is required to read the temperature sensor. This data is removed by the processing. 76 TM CastAway -CTD User’s Manual (October 2010) YSI • Down and Up Cast o Converting raw data to down and up casts takes several steps. o Pressure data has been corrected for atmospheric pressure using data collected in the air at the start and end of the cast. This sets pressure at the water surface to zero. o We calculate the rate of change of pressure versus time, which is the vertical speed of the system through the water. We use this to eliminate data collected in the air or while stationary at the surface or bottom, as well as to separate the down and up casts. o We then combine the raw data from the down and up casts into vertical bins based on pressure. All samples within a bin size of 0.3 decibars are averaged into a single value, giving profile data with regular spacing for easier post-processing. o When looking at data from the down or up cast, only the binaveraged values from the desired cast are shown. Data when out of the water, waiting at the surface, or waiting at the bottom have been removed. o The figure to the right shows temperature data from the down and up cast for the same file shown in Raw data. The difference between the two casts are likely caused by internal waves propogating along the different temperature and density layers. When you first view the data difference between the up and down cast in this data set, it may appear that there is a problem with the sensor. However, there are many factors that can influence the distribution of measured parameters in the water column. Internal waves are certainly one phenomenon to be aware of, but more often the differences will be from the CTD moving through different columns of water. Even though you may be stationary during your measurements, the water could be moving. Even enclosed bodies of water have thermally driven currents that you can’t see from the surface. As a result, your down cast and up cast could be through two different volumes of water. Changes in water temperature and conductivity can be abrupt, especially near merging bodies of water like lakes and rivers or rivers and oceans. These areas will often produce interesting data. TM CastAway -CTD User’s Manual (October 2010) 77 YSI • Processed o This is the most common form of the data from the CastAwayTM-CTD, and is what we recommend for the majority of our users. o In this form, data from the down and up cast have been combined to give the best possible measurement of the true profile. o The simplest description of CastAwayTM-CTD data processing is that Processed profile is a weighted average of the down and up casts based on fall velocity. Up Casts are more heavily weighted near the surface and down casts are more heavily weighted near the bottom. o Details of how data are processed to produce the final profile are given in section A-9. . o The figure to the right shows an example plot of processed CastAwayTM-CTD data, using the same data shown for Raw and Down/Up casts. 78 TM CastAway -CTD User’s Manual (October 2010) YSI A-9. Data Processing Algorithms When processing data from the CastAwayTM-CTD, we take a number of things into account. • • • The sensors work best when they have a steady flow of water through the cell. o A higher flow of water through the cell provides the best measurements. o The measured temperature will increase slightly with time when the water or the CTD is stationary. o Thus when combining measurements, we weight the measured data based on the vertical speed of the system – which is determined by monitoring the change in pressure. For near surface data, the up cast is weighted more heavily than the down cast. This is because the up cast will have been moving at a steady rate for some time, while the down cast has just started moving – providing more reliable data. For near bottom data, the down cast is weighted more heavily than the up cast. This is because the down cast will have been moving at a steady rate for some time, while the up cast has just started moving. Below is a step by step description of the data processing steps used to convert Raw CTD data into the Processed profile. • • • • Pressure is corrected for the ambient atmospheric pressure. o Pressure data is collected at the start and end of the cast, while the system is in the air. o This air pressure is subtracted from the raw pressure data to get a measure of water pressure only. If there is a difference in the start and end air pressure, a linear correction is applied over the course of the cast. Next we calculate how pressure changes with time. o We calculate the rate of change of pressure versus time for each sample in the data file. The rate of change in pressure can be thought of as the vertical speed of the system through the water. o We set a minimum value for the rate of change of 0.025 decibars/second. If the rate of change of pressure is less than this, we consider the system to be stationary. o The sensors and flow-through cell are designed for measurements while the system is in motion; while processing the data, we discard any samples where the system is considered to be stationary. The conductivity data is de-spiked. This is to remove erratic measurements near the water surface that can be caused by air bubbles trapped in the conductivity flow cell or measurements made when the system is only partially submerged. o Using a one second moving window, the standard deviation of the conductivity measurements is computed. o If the center measurement in the window is more than 3 standard deviations from the mean value of the windowed samples, this spike is replaced with the mean of the windowed measurements. o After filtering, conductivity samples measured when the pressure is less than 0.15 decibars are replaced with the nearest conductivity measurement in time taken at a pressure greater than 0.15 decibars. This is to preserve as much of the cast as possible before measurements in air contaminate the data. To separate the down and up cast, we monitor the change in pressure to determine: o When the system first enters the water. TM CastAway -CTD User’s Manual (October 2010) 79 YSI When it starts the down cast. When it reaches the bottom (maximum pressure). When it starts the up cast. When it reaches the surface and leaves the water. The downcast is defined as measurements made before reaching the maximum depth. The up cast is defined as measurements made after reaching the maximum depth. There is only one down cast and one up cast for each CTD cast. If multiple up and down motions are contained in a sample period, the up and down casts are separated by the point of maximum pressure. o The maximum pressure is the maximum pressure measured while the fall velocity is greater than 0.05 decibars/second. This sets the maximum pressure to the measurement taken just as the system hits the bottom or the end of the casting line. Based on the maximum measured pressure: o An array of pressure bins is created from the surface downward. o Each bin has a width of 0.3 decibars. The center of the first bin is located at 0.15 decibars, the second at 0.45 decibars, the third at 0.75 decibars, and so on. o The reported pressure is always the center of the bin except for the last (deepest) bin. o The reported pressure in the last bin is set to the maximum measured pressure. The temperature and conductivity from down cast samples and up cast samples are averaged separately into 0.3 decibar bins. o If the absolute value of the fall velocity of the system is less than 0.025 decibars/second during a down cast, this sample is not used for the bin average. o If the absolute value of the upward velocity of the system is less than 0.025 decibars/second during an up cast, this sample is not used for the bin average. o All samples in the up and down portions of the cast that take place within a given 0.3 decibar slice of the water column are averaged together using the fall velocity as a weighting function. Faster velocities have more weight in the average. o If there should be no measurements in a bin after filtering based on fall velocity, a linear interpolation is applied to fill in missing samples in both the up and down casts using the adjacent bins that contain data. o If the surface bin or the last bin near the bottom is empty, the next nearest value from the cast is used to fill that bin. This is applied to the up and the down cast data separately. o The conductivity and temperature from the deepest two bins in the up cast are replaced with the measurements from the deepest two bins from the down cast to remove the effects of thermistor heating while resting on the bottom. o o o o o o o • • 80 TM CastAway -CTD User’s Manual (October 2010) YSI • • • The down cast samples and up cast samples are combined to get the final Processed data: o For bins with pressure greater than two decibars and less than 0.9*Maximum Pressure, the up and down cast temperatures and conductivities are averaged to get the final Processed data. o For bins with pressures less than two decibars, the down cast is weighted by the square of half of the bin pressure before averaging with the up cast. This is an exponential decay weighting function on the down cast data near the water surface. This weighting function is shown for temperature below; the same formula applies to conductivity. P 2 * TDown + TUp 2 DownCast , P < 2dbar , TPr ocessed = 2 P +1 2 o For bins with pressures greater than 0.9*Maximum Pressure, only the down cast data is used. After the final Processed temperature and conductivity profiles are computed: o The derived parameters of specific conductance, salinity, sound speed, density and depth are calculated for each pressure bin. o Algorithms for these derived parameters are taken directly from Millard & Fofonoff 1983, using the 1980 International Equation of State for Seawater (EOS-80). o Temperatures are multiplied by 1.00024 to convert from ITS-90 to ITPS-68 before computing the EOS-80 derived parameters. o The up, down, and processed output temperatures are in ITS-90, the conversion to ITPS68 is only applied for EOS-80 calculations. The final step is to convert the pressure bins to depth bins: o Gravity is calculated using the WGS84 ellipsoidal gravity formula using local latitude and altitude measured by the GPS. If there is no information from the GPS a default latitude of 30 degrees and a default altitude of zero are used. These defaults can be changed in the software (§5.5.1). o The depth is calculated from equation 25 of Millard & Fofonoff 1983 and includes a full integration of the geopotential anomaly over the entire cast to account for changes in water density. TM CastAway -CTD User’s Manual (October 2010) 81 YSI A-10. Data Processing for Point Measurements Previous sections (§A-8. and §A-9. ) describe data processing for a CTD cast in detail. Some of the same methods apply to a CTD point measurement, although the processing is simpler since only a single point is being measured. A summary of processing for a CastAwayTM-CTD point measurement is below. For a point measurement, only two data types are available; selecting the Down/Up Cast data shows the same data as selecting Processed data. • • 82 Raw Data o Raw data is exactly that – the raw samples of conductivity, temperature and pressure data versus time. No derived parameters (specific conductivity, salinity, sound speed, density or depth) are available. o Pressure data has been corrected for atmospheric pressure using data collected in the air at the start and end of the measurement. This sets pressure at the water surface to zero. o Raw data is used only for specialized applications. In most cases, it is better to use the Processed data. o Raw data includes all data during the entire measurement: in air at the beginning, in the water, and in the air at the end. Processed (same as Down and Up Cast) o Pressure data has been corrected for atmospheric pressure using data collected in the air at the start and end of the cast. This sets pressure at the water surface to zero. o We calculate the rate of change of pressure versus time, which is the vertical speed of the system through the water. We use this to eliminate data collected in the air. o We then look for the point where the change of pressure is greater than 0.15 decibars from the first recorded point. This typically occurs when the system is first submerged into the water. o We wait 2 seconds and take one sample of conductivity, temperature and pressure. This single sample is used as the point measurement. o After the Processed temperature, conductivity and pressure sample is selected: The derived parameters of specific conductivity, salinity, sound speed, density and depth are calculated. TM CastAway -CTD User’s Manual (October 2010) YSI A-11. References International Temperature Scales of 1948, 1968 and 1990 http://www.ices.dk/ocean/procedures/its.htm [4/28/2010 7:24:44 PM] Millard & Fofonoff, “Algorithms for computation of fundamental properties of seawater”, UNESCO technical papers in marine science 44, 1983. WGS84 Ellipsoidal Gravity Formula, Department of Defense World Geodetic System 1984, NIMA TR8350.2, 3rd edition amendment 1, January 2000, Technical Report pages 3-5 to 4-2. It is worth noting that a new standard for CTD calculations has been proposed to the scientific community; the Thermodynamic Equation of State of Seawater (TEOS-10). However, the methods shown in the UNESCO 1983 publication are still the most commonly used calculations and are the only ones supported by the CastAwayTM-CTD. Users interested in applying the TEOS-10 equations can export raw data from the CastAwayTM-CTD to perform these calculations. TM CastAway -CTD User’s Manual (October 2010) 83 YSI Incorporated Yellow Springs, Ohio 45387 USA•Phone 937-767-7241•800-765-4974•Fax 937-767-9353 Item # 400322REF Drawing A400322 Rev A October 2010 Appendix D – Field Data Sheets and QA/QC Calibration Records ADCP Field Data Log Sheets by Lunar Event Sonde Post Calibration Worksheets Sonde Sensor Pre- and Post-Calibration Data for Dissolved Oxygen, pH, and Conductivity ADCP Compass Calibration and System Tests Sonde Post Calibration Worksheets Printed on 3/21/2014 at 3:26 PM Calibration Worksheet Optical DO 13G100240 UTC Time Coordinated Universal Time Start Date/Time 10/5/2013 03:34:03 PM 10/5/2013 03:34:03 PM End Date/Time 10/5/2013 03:42:27 PM 10/5/2013 03:42:27 PM Previous Calibration Date/Time 8/2/2013 08:50:42 PM 8/2/2013 08:50:42 PM Sensor Type Optical DO Sonde Type EXO2 Sonde Sensor SN 13G100240 Sonde SN 13G102274 Sensor Firmware Version 1.1.3 Sonde Firmware Version 1.0.9 Calibration Parameter ODO % sat Sonde ID Sonde 13G102274 Cal Point 1 Cal Point 2 QC Score Standard Air Saturated Pre Calibration Value 106.00 % sat Post Calibration Value 99.90 % sat Raw Value (ODO % RAW) 101.53 Temperature 20.65 ° C Additional Input 1 (Baro mmHg) 760.00 Cal Point 3 Additional Input 2 (N/A) Additional Input 3 (N/A) Type Air-Saturated Manufacturer n/a Lot Number n/a Calibration Point Accepted YES Stability Achieved YES Completed YES Applied YES Valid YES Sensor Removed NO Uncalibrated NO Hardware EXO Desktop KOR Version 1.0.6 Worksheet Version 1 Additional Post Calibration Info: Membrane SN: 13F100307 Membrane Info Last Updated: 07/23/2013 08:52:52 ODO Gain: 0.98 Printed on 3/21/2014 at 3:17 PM Calibration Worksheet Optical DO 13G100222 UTC Time Coordinated Universal Time Start Date/Time 10/4/2013 04:15:39 PM 10/4/2013 04:15:39 PM End Date/Time 10/4/2013 04:16:35 PM 10/4/2013 04:16:35 PM Previous Calibration Date/Time 8/28/2013 06:35:22 PM 8/28/2013 06:35:22 PM Sensor Type Optical DO Sonde Type EXO2 Sonde Sensor SN 13G100222 Sonde SN 13G102274 Sensor Firmware Version 1.1.3 Sonde Firmware Version 1.0.9 Calibration Parameter ODO % sat Sonde ID Sonde 13G102274 Cal Point 1 Cal Point 2 QC Score Standard Air Saturated Pre Calibration Value 103.30 % sat Post Calibration Value 100.00 % sat Raw Value (ODO % RAW) 98.65 Temperature 20.65 ° C Additional Input 1 (Baro mmHg) 760.00 Cal Point 3 Additional Input 2 (N/A) Additional Input 3 (N/A) Type Air-Saturated Manufacturer Lot Number Calibration Point Accepted YES Stability Achieved YES Completed YES Applied YES Valid YES Sensor Removed NO Uncalibrated NO Hardware EXO Desktop KOR Version 1.0.6 Worksheet Version 1 Additional Post Calibration Info: Membrane SN: 13F100305 Membrane Info Last Updated: 07/22/2013 09:11:34 ODO Gain: 1.01 Printed on 3/21/2014 at 3:19 PM Calibration Worksheet Optical DO 13G100225 UTC Time Coordinated Universal Time Start Date/Time 10/4/2013 04:15:41 PM 10/4/2013 04:15:41 PM End Date/Time 10/4/2013 04:22:03 PM 10/4/2013 04:22:03 PM Previous Calibration Date/Time 8/2/2013 09:11:37 PM 8/2/2013 09:11:37 PM Sensor Type Optical DO Sonde Type EXO2 Sonde Sensor SN 13G100225 Sonde SN 13G102274 Sensor Firmware Version 1.1.3 Sonde Firmware Version 1.0.9 Calibration Parameter ODO % sat Sonde ID Sonde 13G102274 Cal Point 1 Cal Point 2 QC Score Standard Air Saturated Pre Calibration Value 103.60 % sat Post Calibration Value 100.10 % sat Raw Value (ODO % RAW) 98.31 Temperature 20.65 ° C Additional Input 1 (Baro mmHg) 760.00 Cal Point 3 Additional Input 2 (N/A) Additional Input 3 (N/A) Type Air-Saturated Manufacturer Lot Number Calibration Point Accepted YES Stability Achieved YES Completed YES Applied YES Valid YES Sensor Removed NO Uncalibrated NO Hardware EXO Desktop KOR Version 1.0.6 Worksheet Version 1 Additional Post Calibration Info: Membrane SN: 13F100301 Membrane Info Last Updated: 07/22/2013 09:08:19 ODO Gain: 1.02 Printed on 3/21/2014 at 3:18 PM Calibration Worksheet Optical DO 13G100224 UTC Time Coordinated Universal Time Start Date/Time 10/4/2013 04:15:39 PM 10/4/2013 04:15:39 PM End Date/Time 10/4/2013 04:18:03 PM 10/4/2013 04:18:03 PM Previous Calibration Date/Time 8/2/2013 09:13:09 PM 8/2/2013 09:13:09 PM Sensor Type Optical DO Sonde Type EXO2 Sonde Sensor SN 13G100224 Sonde SN 13G102274 Sensor Firmware Version 1.1.3 Sonde Firmware Version 1.0.9 Calibration Parameter ODO % sat Sonde ID Sonde 13G102274 Cal Point 1 Cal Point 2 QC Score Standard Air Saturated Pre Calibration Value 103.00 % sat Post Calibration Value 100.10 % sat Raw Value (ODO % RAW) 97.23 Temperature 20.65 ° C Additional Input 1 (Baro mmHg) 760.00 Cal Point 3 Additional Input 2 (N/A) Additional Input 3 (N/A) Type Air-Saturated Manufacturer Lot Number Calibration Point Accepted YES Stability Achieved YES Completed YES Applied YES Valid YES Sensor Removed NO Uncalibrated NO Hardware EXO Desktop KOR Version 1.0.6 Worksheet Version 1 Additional Post Calibration Info: Membrane SN: 13F100302 Membrane Info Last Updated: 07/22/2013 09:08:22 ODO Gain: 1.03 Printed on 3/21/2014 at 3:23 PM Calibration Worksheet Optical DO 13G100234 UTC Time Coordinated Universal Time Start Date/Time 10/4/2013 04:15:42 PM 10/4/2013 04:15:42 PM End Date/Time 10/4/2013 04:26:15 PM 10/4/2013 04:26:15 PM Previous Calibration Date/Time 8/2/2013 08:44:51 PM 8/2/2013 08:44:51 PM Sensor Type Optical DO Sonde Type EXO2 Sonde Sensor SN 13G100234 Sonde SN 13G102274 Sensor Firmware Version 1.1.3 Sonde Firmware Version 1.0.9 Calibration Parameter ODO % sat Sonde ID Sonde 13G102274 Cal Point 1 Cal Point 2 QC Score Standard Air Saturated Pre Calibration Value 105.40 % sat Post Calibration Value 100.00 % sat Raw Value (ODO % RAW) 96.73 Temperature 20.65 ° C Additional Input 1 (Baro mmHg) 760.00 Cal Point 3 Additional Input 2 (N/A) Additional Input 3 (N/A) Type Air-Saturated Manufacturer Lot Number Calibration Point Accepted YES Stability Achieved YES Completed YES Applied YES Valid YES Sensor Removed NO Uncalibrated NO Hardware EXO Desktop KOR Version 1.0.6 Worksheet Version 1 Additional Post Calibration Info: Membrane SN: 13F100292 Membrane Info Last Updated: 07/22/2013 09:03:56 ODO Gain: 1.03 Printed on 3/21/2014 at 3:27 PM Calibration Worksheet Optical DO 13G100244 UTC Time Coordinated Universal Time Start Date/Time 10/5/2013 07:03:45 PM 10/5/2013 07:03:45 PM End Date/Time 10/5/2013 07:04:25 PM 10/5/2013 07:04:25 PM Previous Calibration Date/Time 1/1/1970 12:00:00 AM 1/1/1970 12:00:00 AM Sensor Type Optical DO Sonde Type EXO2 Sonde Sensor SN 13G100244 Sonde SN 13G102232 Sensor Firmware Version 1.1.3 Sonde Firmware Version 1.0.9 Calibration Parameter ODO % sat Sonde ID Sonde 13G102232 Cal Point 1 Cal Point 2 QC Score Standard Air Saturated Pre Calibration Value 93.60 % sat Post Calibration Value 99.80 % sat Raw Value (ODO % RAW) 93.63 Temperature 23.38 ° C Additional Input 1 (Baro mmHg) 760.00 Cal Point 3 Additional Input 2 (N/A) Additional Input 3 (N/A) Type Air-Saturated Manufacturer n/a Lot Number n/a Calibration Point Accepted YES Stability Achieved YES Completed YES Applied YES Valid YES Sensor Removed NO Uncalibrated NO Hardware EXO Desktop KOR Version 1.0.6 Worksheet Version 1 Additional Post Calibration Info: Membrane SN: 13F100316 Membrane Info Last Updated: 07/23/2013 08:53:20 ODO Gain: 1.07 Printed on 3/21/2014 at 3:20 PM Calibration Worksheet Optical DO 13G100228 UTC Time Coordinated Universal Time Start Date/Time 10/5/2013 05:09:34 PM 10/5/2013 05:09:34 PM End Date/Time 10/5/2013 05:12:55 PM 10/5/2013 05:12:55 PM Previous Calibration Date/Time 1/1/1970 12:00:00 AM 1/1/1970 12:00:00 AM Sensor Type Optical DO Sonde Type EXO2 Sonde Sensor SN 13G100228 Sonde SN 13G102274 Sensor Firmware Version 1.1.3 Sonde Firmware Version 1.0.9 Calibration Parameter ODO % sat Sonde ID Sonde 13G102274 Cal Point 1 Cal Point 2 QC Score Standard Air Saturated Pre Calibration Value 97.50 % sat Post Calibration Value 100.00 % sat Raw Value (ODO % RAW) 97.46 Temperature 20.65 ° C Additional Input 1 (Baro mmHg) 760.00 Cal Point 3 Additional Input 2 (N/A) Additional Input 3 (N/A) Type Air-Saturated Manufacturer n/a Lot Number n/a Calibration Point Accepted YES Stability Achieved YES Completed YES Applied YES Valid YES Sensor Removed NO Uncalibrated NO Hardware EXO Desktop KOR Version 1.0.6 Worksheet Version 1 Additional Post Calibration Info: Membrane SN: 13F100298 Membrane Info Last Updated: 07/22/2013 09:08:07 ODO Gain: 1.03 Printed on 3/21/2014 at 3:18 PM Calibration Worksheet Optical DO 13G100223 UTC Time Coordinated Universal Time Start Date/Time 10/5/2013 03:34:04 PM 10/5/2013 03:34:04 PM End Date/Time 10/5/2013 03:45:29 PM 10/5/2013 03:45:29 PM Previous Calibration Date/Time 1/1/1970 12:00:00 AM 1/1/1970 12:00:00 AM Sensor Type Optical DO Sonde Type EXO2 Sonde Sensor SN 13G100223 Sonde SN 13G102274 Sensor Firmware Version 1.1.3 Sonde Firmware Version 1.0.9 Calibration Parameter ODO % sat Sonde ID Sonde 13G102274 Cal Point 1 Cal Point 2 QC Score Standard Air Saturated Pre Calibration Value 100.00 % sat Post Calibration Value 99.90 % sat Raw Value (ODO % RAW) 99.97 Temperature 20.65 ° C Additional Input 1 (Baro mmHg) 760.00 Cal Point 3 Additional Input 2 (N/A) Additional Input 3 (N/A) Type Air-Saturated Manufacturer n/a Lot Number n/a Calibration Point Accepted YES Stability Achieved YES Completed YES Applied YES Valid YES Sensor Removed NO Uncalibrated NO Hardware EXO Desktop KOR Version 1.0.6 Worksheet Version 1 Additional Post Calibration Info: Membrane SN: 13F100303 Membrane Info Last Updated: 07/22/2013 09:08:26 ODO Gain: 1.00 Printed on 3/21/2014 at 3:19 PM Calibration Worksheet Optical DO 13G100226 UTC Time Coordinated Universal Time Start Date/Time 10/5/2013 05:09:35 PM 10/5/2013 05:09:35 PM End Date/Time 10/5/2013 05:16:56 PM 10/5/2013 05:16:56 PM Previous Calibration Date/Time 8/2/2013 09:02:55 PM 8/2/2013 09:02:55 PM Sensor Type Optical DO Sonde Type EXO2 Sonde Sensor SN 13G100226 Sonde SN 13G102274 Sensor Firmware Version 1.1.3 Sonde Firmware Version 1.0.9 Calibration Parameter ODO % sat Sonde ID Sonde 13G102274 Cal Point 1 Cal Point 2 QC Score Standard Air Saturated Pre Calibration Value 106.10 % sat Post Calibration Value 100.00 % sat Raw Value (ODO % RAW) 98.58 Temperature 20.65 ° C Additional Input 1 (Baro mmHg) 760.00 Cal Point 3 Additional Input 2 (N/A) Additional Input 3 (N/A) Type Air-Saturated Manufacturer n/a Lot Number n/a Calibration Point Accepted YES Stability Achieved YES Completed YES Applied YES Valid YES Sensor Removed NO Uncalibrated NO Hardware EXO Desktop KOR Version 1.0.6 Worksheet Version 1 Additional Post Calibration Info: Membrane SN: 13F100300 Membrane Info Last Updated: 07/22/2013 09:08:15 ODO Gain: 1.02 Printed on 3/21/2014 at 3:25 PM Calibration Worksheet Optical DO 13G100238 UTC Time Coordinated Universal Time Start Date/Time 10/5/2013 03:34:02 PM 10/5/2013 03:34:02 PM End Date/Time 10/5/2013 03:40:42 PM 10/5/2013 03:40:42 PM Previous Calibration Date/Time 8/2/2013 08:52:27 PM 8/2/2013 08:52:27 PM Sensor Type Optical DO Sonde Type EXO2 Sonde Sensor SN 13G100238 Sonde SN 13G102274 Sensor Firmware Version 1.1.3 Sonde Firmware Version 1.0.9 Calibration Parameter ODO % sat Sonde ID Sonde 13G102274 Cal Point 1 Cal Point 2 QC Score Standard Air Saturated Pre Calibration Value 106.60 % sat Post Calibration Value 100.00 % sat Raw Value (ODO % RAW) 97.69 Temperature 20.65 ° C Additional Input 1 (Baro mmHg) 760.00 Cal Point 3 Additional Input 2 (N/A) Additional Input 3 (N/A) Type Air-Saturated Manufacturer n/a Lot Number n/a Calibration Point Accepted YES Stability Achieved YES Completed YES Applied YES Valid YES Sensor Removed NO Uncalibrated NO Hardware EXO Desktop KOR Version 1.0.6 Worksheet Version 1 Additional Post Calibration Info: Membrane SN: 13F100312 Membrane Info Last Updated: 07/23/2013 08:53:08 ODO Gain: 1.02 Printed on 3/21/2014 at 3:20 PM Calibration Worksheet Optical DO 13G100227 UTC Time Coordinated Universal Time Start Date/Time 10/5/2013 05:09:36 PM 10/5/2013 05:09:36 PM End Date/Time 10/5/2013 05:19:42 PM 10/5/2013 05:19:42 PM Previous Calibration Date/Time 1/1/1970 12:00:00 AM 1/1/1970 12:00:00 AM Sensor Type Optical DO Sonde Type EXO2 Sonde Sensor SN 13G100227 Sonde SN 13G102274 Sensor Firmware Version 1.1.3 Sonde Firmware Version 1.0.9 Calibration Parameter ODO % sat Sonde ID Sonde 13G102274 Cal Point 1 Cal Point 2 QC Score Standard Air Saturated Pre Calibration Value 98.80 % sat Post Calibration Value 99.90 % sat Raw Value (ODO % RAW) 98.82 Temperature 20.65 ° C Additional Input 1 (Baro mmHg) 760.00 Cal Point 3 Additional Input 2 (N/A) Additional Input 3 (N/A) Type Air-Saturated Manufacturer n/a Lot Number n/a Calibration Point Accepted YES Stability Achieved YES Completed YES Applied YES Valid YES Sensor Removed NO Uncalibrated NO Hardware EXO Desktop KOR Version 1.0.6 Worksheet Version 1 Additional Post Calibration Info: Membrane SN: 13F100299 Membrane Info Last Updated: 07/22/2013 09:08:11 ODO Gain: 1.01 Printed on 3/21/2014 at 3:21 PM Calibration Worksheet Optical DO 13G100231 UTC Time Coordinated Universal Time Start Date/Time 10/4/2013 04:15:42 PM 10/4/2013 04:15:42 PM End Date/Time 10/4/2013 04:23:54 PM 10/4/2013 04:23:54 PM Previous Calibration Date/Time 8/2/2013 08:46:18 PM 8/2/2013 08:46:18 PM Sensor Type Optical DO Sonde Type EXO2 Sonde Sensor SN 13G100231 Sonde SN 13G102274 Sensor Firmware Version 1.1.3 Sonde Firmware Version 1.0.9 Calibration Parameter ODO % sat Sonde ID Sonde 13G102274 Cal Point 1 Cal Point 2 QC Score Standard Air Saturated Pre Calibration Value 105.60 % sat Post Calibration Value 100.00 % sat Raw Value (ODO % RAW) 96.60 Temperature 20.65 ° C Additional Input 1 (Baro mmHg) 760.00 Cal Point 3 Additional Input 2 (N/A) Additional Input 3 (N/A) Type Air-Saturated Manufacturer Lot Number Calibration Point Accepted YES Stability Achieved YES Completed YES Applied YES Valid YES Sensor Removed NO Uncalibrated NO Hardware EXO Desktop KOR Version 1.0.6 Worksheet Version 1 Additional Post Calibration Info: Membrane SN: 13F100295 Membrane Info Last Updated: 07/22/2013 09:06:23 ODO Gain: 1.04 Printed on 3/21/2014 at 3:25 PM Calibration Worksheet Optical DO 13G100237 UTC Time Coordinated Universal Time Start Date/Time 10/5/2013 05:09:35 PM 10/5/2013 05:09:35 PM End Date/Time 10/5/2013 05:14:32 PM 10/5/2013 05:14:32 PM Previous Calibration Date/Time 8/2/2013 09:15:12 PM 8/2/2013 09:15:12 PM Sensor Type Optical DO Sonde Type EXO2 Sonde Sensor SN 13G100237 Sonde SN 13G102274 Sensor Firmware Version 1.1.3 Sonde Firmware Version 1.0.9 Calibration Parameter ODO % sat Sonde ID Sonde 13G102274 Cal Point 1 Cal Point 2 QC Score Standard Air Saturated Pre Calibration Value 104.50 % sat Post Calibration Value 100.00 % sat Raw Value (ODO % RAW) 96.93 Temperature 20.65 ° C Additional Input 1 (Baro mmHg) 760.00 Cal Point 3 Additional Input 2 (N/A) Additional Input 3 (N/A) Type Air-Saturated Manufacturer n/a Lot Number n/a Calibration Point Accepted YES Stability Achieved YES Completed YES Applied YES Valid YES Sensor Removed NO Uncalibrated NO Hardware EXO Desktop KOR Version 1.0.6 Worksheet Version 1 Additional Post Calibration Info: Membrane SN: 13F100311 Membrane Info Last Updated: 07/23/2013 08:53:05 ODO Gain: 1.03 Printed on 3/21/2014 at 3:21 PM Calibration Worksheet Optical DO 13G100230 UTC Time Coordinated Universal Time Start Date/Time 10/5/2013 06:29:20 PM 10/5/2013 06:29:20 PM End Date/Time 10/5/2013 06:30:37 PM 10/5/2013 06:30:37 PM Previous Calibration Date/Time 8/2/2013 08:59:29 PM 8/2/2013 08:59:29 PM Sensor Type Optical DO Sonde Type EXO2 Sonde Sensor SN 13G100230 Sonde SN 13G102274 Sensor Firmware Version 1.1.3 Sonde Firmware Version 1.0.9 Calibration Parameter ODO % sat Sonde ID Sonde 13G102274 Cal Point 1 Cal Point 2 QC Score Standard Air Saturated Pre Calibration Value 107.10 % sat Post Calibration Value 100.00 % sat Raw Value (ODO % RAW) 99.63 Temperature 20.65 ° C Additional Input 1 (Baro mmHg) 760.00 Cal Point 3 Additional Input 2 (N/A) Additional Input 3 (N/A) Type Air-Saturated Manufacturer n/a Lot Number n/a Calibration Point Accepted YES Stability Achieved YES Completed YES Applied YES Valid YES Sensor Removed NO Uncalibrated NO Hardware EXO Desktop KOR Version 1.0.6 Worksheet Version 1 Additional Post Calibration Info: Membrane SN: 13F100296 Membrane Info Last Updated: 07/22/2013 09:06:31 ODO Gain: 1.00 Printed on 3/21/2014 at 3:23 PM Calibration Worksheet Optical DO 13G100235 UTC Time Coordinated Universal Time Start Date/Time 10/5/2013 05:09:33 PM 10/5/2013 05:09:33 PM End Date/Time 10/5/2013 05:10:25 PM 10/5/2013 05:10:25 PM Previous Calibration Date/Time 8/19/2013 04:02:42 PM 8/19/2013 04:02:42 PM Sensor Type Optical DO Sonde Type EXO2 Sonde Sensor SN 13G100235 Sonde SN 13G102274 Sensor Firmware Version 1.1.3 Sonde Firmware Version 1.0.9 Calibration Parameter ODO % sat Sonde ID Sonde 13G102274 Cal Point 1 Cal Point 2 QC Score Standard Air Saturated Pre Calibration Value 103.80 % sat Post Calibration Value 100.10 % sat Raw Value (ODO % RAW) 97.46 Temperature 20.65 ° C Additional Input 1 (Baro mmHg) 760.00 Cal Point 3 Additional Input 2 (N/A) Additional Input 3 (N/A) Type Air-Saturated Manufacturer n/a Lot Number n/a Calibration Point Accepted YES Stability Achieved YES Completed YES Applied YES Valid YES Sensor Removed NO Uncalibrated NO Hardware EXO Desktop KOR Version 1.0.6 Worksheet Version 1 Additional Post Calibration Info: Membrane SN: 13F100291 Membrane Info Last Updated: 07/22/2013 09:03:52 ODO Gain: 1.02 Printed on 3/21/2014 at 3:22 PM Calibration Worksheet Optical DO 13G100232 UTC Time Coordinated Universal Time Start Date/Time 10/5/2013 07:03:46 PM 10/5/2013 07:03:46 PM End Date/Time 10/5/2013 07:05:55 PM 10/5/2013 07:05:55 PM Previous Calibration Date/Time 8/21/2013 02:09:53 PM 8/21/2013 02:09:53 PM Sensor Type Optical DO Sonde Type EXO2 Sonde Sensor SN 13G100232 Sonde SN 13G102232 Sensor Firmware Version 1.1.3 Sonde Firmware Version 1.0.9 Calibration Parameter ODO % sat Sonde ID Sonde 13G102232 Cal Point 1 Cal Point 2 QC Score Standard Air Saturated Pre Calibration Value 101.40 % sat Post Calibration Value 99.90 % sat Raw Value (ODO % RAW) 94.45 Temperature 23.41 ° C Additional Input 1 (Baro mmHg) 760.00 Cal Point 3 Additional Input 2 (N/A) Additional Input 3 (N/A) Type Air-Saturated Manufacturer n/a Lot Number n/a Calibration Point Accepted YES Stability Achieved YES Completed YES Applied YES Valid YES Sensor Removed NO Uncalibrated NO Hardware EXO Desktop KOR Version 1.0.6 Worksheet Version 1 Additional Post Calibration Info: Membrane SN: 13F100294 Membrane Info Last Updated: 07/22/2013 09:04:03 ODO Gain: 1.06 Printed on 3/21/2014 at 3:27 PM Calibration Worksheet Optical DO 13G100242 UTC Time Coordinated Universal Time Start Date/Time 10/5/2013 03:34:01 PM 10/5/2013 03:34:01 PM End Date/Time 10/5/2013 03:36:56 PM 10/5/2013 03:36:56 PM Previous Calibration Date/Time 1/1/1970 12:00:00 AM 1/1/1970 12:00:00 AM Sensor Type Optical DO Sonde Type EXO2 Sonde Sensor SN 13G100242 Sonde SN 13G102274 Sensor Firmware Version 1.1.3 Sonde Firmware Version 1.0.9 Calibration Parameter ODO % sat Sonde ID Sonde 13G102274 Cal Point 1 Cal Point 2 QC Score Standard Air Saturated Pre Calibration Value 99.40 % sat Post Calibration Value 100.00 % sat Raw Value (ODO % RAW) 99.53 Temperature 20.65 ° C Additional Input 1 (Baro mmHg) 760.00 Cal Point 3 Additional Input 2 (N/A) Additional Input 3 (N/A) Type Air-Saturated Manufacturer n/a Lot Number n/a Calibration Point Accepted YES Stability Achieved YES Completed YES Applied YES Valid YES Sensor Removed NO Uncalibrated NO Hardware EXO Desktop KOR Version 1.0.6 Worksheet Version 1 Additional Post Calibration Info: Membrane SN: 13F100314 Membrane Info Last Updated: 07/23/2013 08:53:14 ODO Gain: 1.01