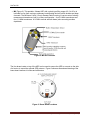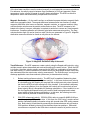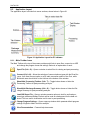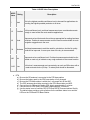
1
SonTek/YSI 9940 Summers Ridge Road, San Diego, CA 92121-3091 USA Telephone (858) 546-8327 • Fax (858) 546-8150 E-mail: [email protected] • Internet: http://www.sontek.com RiverSurveyor S5/M9 System Manual Firmware Version 1.0 Copyright 2010 by SonTek/YSI. All rights reserved. This document may not, in whole or in part, be copied, photocopied, reproduced, translated, or reduced to any electronic medium or machine-readable form without prior consent in writing from SonTek/YSI. Every effort has been made to ensure the accuracy of this manual. However, SonTek/YSI makes no warranties with respect to this documentation and disclaims any implied warranties of merchantability and fitness for a particular purpose. SonTek/YSI shall not be liable for any errors or for incidental or consequential damages in connection with the furnishing, performance, or use of this manual or the examples herein. The information in this document is subject to change without notice. SonTek/YSI RECORD OF CHANGES Effective 15 FEB 2009 15 FEB 2010 ii Description Initial release; CPU firmware version 1.0 RiverSurveyor Live v1.50 support RiverSurveyor S5/M9 System Manual (February 2010) SonTek/YSI Release Notice This is the February 15, 2010 release of the RiverSurveyor S5/M9 System Manual. During the creation of this manual, the following were the latest versions of firmware/software. As such, if you are using different firmware/software versions, not all aspects of this manual may apply. • RiverSurveyor S5/M9 firmware version 1.0 • RiverSurveyor Live software version 1.50 Trademarks The terms SonTek, ADP, ADV, Argonaut, FlowTracker, and RiverSurveyor are registered trademarks of YSI Inc. All rights are reserved. All other brand names are trademarks of their respective holders. Warranty, Terms, and Conditions The system you have purchased is covered under a one year limited warranty that extends to all parts and labor for any malfunction due to workmanship or errors in the manufacturing process. The warranty is conditioned upon your proper maintenance and operation under normal use as outlined in the User’s Manual that was provided along with the system. The warranty does not cover shortcomings that are due to the design, nor does it cover any form of incidental damage as a result of errors in the measurements. SonTek/YSI will repair and/or replace, at its sole option, any product established to be defective, with a product of like type. CLAIMS FOR LABOR COSTS AND/OR OTHER CHARGES RESULTING FROM THE USE OF SonTek/YSI GOODS AND/OR PRODUCTS ARE NOT COVERED BY THIS LIMITED WARRANTY. SonTek/YSI DISCLAIMS ALL EXPRESS WARRANTIES OTHER THAN THOSE CONTAINED ABOVE AND ALL IMPLIED WARRANTIES, INCLUDING BUT NOT LIMITED TO WARRANTIES OF MERCHANTABILITY AND/OR FITNESS FOR A PARTICULAR PURPOSE. It is understood and agreed that SonTek DISCLAIMS AND WILL NOT BE LIABLE, UNDER ANY CIRCUMSTANCE, IN CONTRACT, TORT OR WARRANTY, FOR ANY SPECIAL, INDIRECT, INCIDENTAL OR CONSEQUENTIAL DAMAGES OF ANY KIND, INCLUDING BUT NOT LIMITED TO LOST PROFITS, BUSINESS INTERRUPTION LOSSES, LOSS OF GOODWILL, OR LOSS OF BUSINESS OR CUSTOMER RELATIONSHIPS. Some states do not allow the exclusion of implied warranties or the limitation or exclusion of liability for incidental or consequential damages, so the above exclusion may not apply to the Buyer. The parties specifically agree that the scope and enforceability of this provision shall be governed by California law. If your system is not functioning properly, first try to identify the source of the problem. If additional support is required, we encourage you to contact us immediately, and we will work to resolve the problem as quickly as possible. If the system needs to be returned to the factory, please contact SonTek/YSI to obtain a Service Request (SR) number. We reserve the right to refuse receipt of shipments without SRs. We require the system to be shipped back in the original shipping container using the original packing material with all delivery costs covered by the customer (including all taxes and duties). If the system is returned without appropriate packing, the customer will be required to cover the cost of a new packaging crate and material. RiverSurveyor S5/M9 System Manual (February 2010) iii SonTek/YSI About This Manual Thank you for your interest in using a SonTek/YSI RiverSurveyor S5 or M9 system. This RiverSurveyor S5/M9 System Manual describes how to install and configure the RiverSurveyor system and its associated software. It includes instructions and guidelines for the most common applications for which this system is used. Scope and Audience Even if you have used other SonTek acoustic Doppler products, we recommend that you spend some time reading this manual to learn about the special features of this system. This manual is more “application-oriented” in that it tries to explain how to use the RiverSurveyor system for specific, real-world applications. If you intend to use the instrument for other applications, or if you need detailed information about the instrument itself, please contact us. How to Use This Manual This manual was especially designed for on-line viewing through a computer. Even though you may now be reading a paper copy of this manual, an “electronic” copy of this manual was provided to you on the distribution disk (RiverSurveyor.pdf). The use of this “PDF” file requires you to have the Adobe® Acrobat Reader® software installed on your computer. This software is freely available from Adobe at http://www.adobe.com. This RiverSurveyor.pdf file is also used as a Help file within the RiverSurveyor Live software program. If you install RiverSurveyor Live on your computer using the default installation instructions, the RiverSurveyor.pdf file will be in the folder C:\Program Files\SonTek\Manuals. The PDF version of this manual makes it easy for you to navigate within the document. Several hyperlinks (in blue) let you quickly go to referenced sections, figures, and tables. Additionally, you can use the built-in search features of Acrobat to find specific words and phrases. With the PDF copy, you can also print out high-quality copies of the manual to paper (for your organization’s personal use only and not for resale or redistribution). Reader Feedback Your feedback about the RiverSurveyor system and this manual will help us to improve our products. Please let us know what improvements we can make by contacting us via telephone, fax, or e-mail (see next page for Contact Information). iv RiverSurveyor S5/M9 System Manual (February 2010) SonTek/YSI Contact Information Any questions, concerns, or suggestions can be directed to SonTek by telephone, fax, or email. Business hours are 8:00 a.m. to 5:00 p.m., Pacific Standard Time, Monday through Friday. Phone : +1 (858) 546-8327 Fax : +1 (858) 546-8150 Email : [email protected] (General information) [email protected] (Sales information) [email protected] (Support information) Web : http://www.sontek.com See our web site for information concerning new products and software/firmware upgrades. RiverSurveyor S5/M9 System Manual (February 2010) v SonTek/YSI Table of Contents About This Manual ................................................................................................................. iv Table of Contents .................................................................................................................... vi Section 1. Getting Started ...................................................................................................1 1.1. What does the System do?..............................................................................................1 1.2. What’s new? ..................................................................................................................1 Section 2. RiverSurveyor Instrument Configuration and Options ...................................3 2.1. RiverSurveyor Core System S5 and M9 .........................................................................3 2.2. Power and Communications Module (PCM) - Optional..................................................5 2.2.1. Bluetooth Option .....................................................................................................5 2.2.2. Spread Spectrum (SS) Option ..................................................................................6 2.3. GPS Components – Optional ..........................................................................................6 2.3.1. SonTek RTK GPS - Optional ...................................................................................7 2.3.2. SonTek DGPS - Optional ........................................................................................8 2.4. SonTek Hydroboard - Optional ......................................................................................8 2.5. Oceanscience Riverboat – Optional ................................................................................8 Section 3. System Configurations and Setup .....................................................................9 3.1. Overview .......................................................................................................................9 3.2. Configuration A – Direct Connection with S5 or M9 Core System .................................9 3.2.1. Description ..............................................................................................................9 3.2.2. Hardware Setup .......................................................................................................9 3.3. Configuration B – Bluetooth Communications .............................................................10 3.3.1. Description ............................................................................................................10 3.3.2. Hardware Setup .....................................................................................................11 3.4. Configuration C –Spread Spectrum Communications ...................................................12 3.4.1. Description ............................................................................................................12 3.4.2. Hardware Setup .....................................................................................................13 3.5. Configuration D – RTK GPS........................................................................................14 3.5.1. Description ............................................................................................................14 3.5.2. Hardware Setup .....................................................................................................16 3.6. Configuration E – SonTek Differential GPS .................................................................18 3.6.1. Description ............................................................................................................18 3.6.2. Hardware ...............................................................................................................18 3.7. Configuration F - SonTek Hydroboard .........................................................................19 3.7.1. Description ............................................................................................................19 3.7.2. Hardware Setup .....................................................................................................19 Section 4. 4.1. 4.2. 4.3. 4.4. 4.5. vi System Maintenance ........................................................................................21 Overview .....................................................................................................................21 Cleaning the transducers ..............................................................................................21 Cables and connectors ..................................................................................................21 O-rings .........................................................................................................................21 Batteries .......................................................................................................................21 RiverSurveyor S5/M9 System Manual (February 2010) SonTek/YSI 4.6. Mobile Device..............................................................................................................22 4.7. Factory Calibration ......................................................................................................22 Section 5. Introduction to Measurement Procedure ........................................................23 5.1. Overview .....................................................................................................................23 5.2. Applications .................................................................................................................23 5.3. Pre-Measurement Tests ................................................................................................23 5.3.1. Check cables and connections ................................................................................23 5.3.2. Communications ....................................................................................................23 5.3.3. System Test ...........................................................................................................24 5.3.4. Compass Calibration ..............................................................................................24 5.3.5. Recorder ................................................................................................................24 5.4. Measurement Procedure ...............................................................................................25 5.4.1. Overview ...............................................................................................................25 5.4.2. Starting The System ...............................................................................................27 5.4.3. Collecting Start Edge Data .....................................................................................27 5.4.4. Collecting Transect Data ........................................................................................27 5.4.5. Collecting End Edge Data ......................................................................................27 5.4.6. Making Additional Measurements/Transects ..........................................................27 Section 6. RiverSurveyor Live for PC Software ..............................................................28 6.1. Overview – RiverSurveyor Live for PC Software .........................................................28 6.2. System Requirements ...................................................................................................28 6.3. Installation ...................................................................................................................28 6.4. Starting the Software ....................................................................................................29 6.5. Connecting to the System .............................................................................................30 6.6. Site Information ...........................................................................................................31 6.7. System Settings ............................................................................................................32 6.8. Measurement Settings ..................................................................................................34 6.9. Pre-Measurement Tests and Utilities ............................................................................35 6.9.1. Compass Calibration ..............................................................................................35 6.9.2. System Test ...........................................................................................................36 6.9.3. Set Time ................................................................................................................36 6.9.4. BeamCheck ...........................................................................................................37 6.9.5. Update Firmware ...................................................................................................38 6.9.6. SonTek GPS Option...............................................................................................38 6.10. Recorder ......................................................................................................................39 6.11. Data Collection ............................................................................................................39 6.11.1. Start System...........................................................................................................40 6.11.2. Start Edge ..............................................................................................................40 6.11.3. Start Moving ..........................................................................................................42 6.11.4. End Edge ...............................................................................................................42 6.11.5. End Transect ..........................................................................................................43 6.12. Discharge Measurement Summary ...............................................................................44 Section 7. RiverSurveyor Live for Mobile .......................................................................46 7.1. Overview—RiverSurveyor Live for Mobile Software ..................................................46 7.2. Mobile Device Requirements .......................................................................................46 RiverSurveyor S5/M9 System Manual (February 2010) vii SonTek/YSI 7.3. Installation ...................................................................................................................46 7.4. Navigation and Controls for Mobile Device .................................................................48 7.5. Starting the Software and Connecting to the System .....................................................49 7.6. Preparing for a Measurement - Main Menu ..................................................................50 7.6.1. Site Information (1) ...............................................................................................51 7.6.2. System Settings (2) ................................................................................................51 7.6.3. Track and Depth Reference (3) ..............................................................................53 7.6.4. Compass Calibration (4) ........................................................................................55 7.6.5. Download Recorder (5)..........................................................................................56 7.6.6. Measurement Summary (6) ....................................................................................57 7.6.7. Utilities (7) ............................................................................................................58 7.7. Discharge Measurement - Data Collection....................................................................63 7.7.1. Starting the measurement .......................................................................................63 7.7.2. Start Edge ..............................................................................................................63 7.7.3. Start Moving ..........................................................................................................65 7.7.4. End Edge ...............................................................................................................65 7.7.5. End Transect ..........................................................................................................66 7.7.6. Data collection - Swapping between Mobile Device and PC ..................................67 7.7.7. Transferring Data from Mobile Device to PC .........................................................68 Section 8. Reviewing Data Files/Post-Processing .............................................................69 8.1. Overview .....................................................................................................................69 8.2. Opening Data Files.......................................................................................................69 8.3. Application Layout ......................................................................................................70 8.3.1. Main Toolbar Icons ................................................................................................70 8.3.2. Data file Tabs ........................................................................................................71 8.3.3. Sidebar ..................................................................................................................71 8.3.4. Tab Windows selection ..........................................................................................72 8.3.5. Tab Window display ..............................................................................................72 Samples Tab..........................................................................................................................73 Navigation Tab......................................................................................................................74 Edges Tab .............................................................................................................................75 Transect Tab .........................................................................................................................75 8.3.6. Discharge measurement summary ..........................................................................76 8.3.7. Processing toolbox .................................................................................................77 8.4. Hot Keys/Accelerators .................................................................................................81 8.5. Processing Data Files – Step by Step ............................................................................81 Appendix A. Description of RiverSurveyor Live Icons ....................................................83 Appendix B. Parameter and Hotkey Descriptions ...........................................................87 Appendix C. Matlab Export ..............................................................................................89 Appendix D. Troubleshooting ...........................................................................................93 Appendix E. Software Changes ....................................................................................... 103 viii RiverSurveyor S5/M9 System Manual (February 2010) SonTek/YSI Section 1. Getting Started 1.1. What does the System do? The SonTek RiverSurveyor system is a robust and highly accurate Acoustic Doppler Profiler (ADP) system specifically designed to measure river discharge, 3-Dimensional water currents, depths, and bathymetry from a moving or stationary vessel. The RiverSurveyor system combines proven state-of-the-art acoustic Doppler velocity profiler instrumentation with a Windowsbased software package that can be used on a Personal Computer (PC) or Mobile device (using cell phone technology). The high degree of accuracy and ease of use allows you to measure confidently without having to change measurement settings for a specific river condition. First-time users will find data collection and analysis a relatively simple task, while advanced users will benefit from the flexible processing and analytical tools that are provided. One of the major benefits of the RiverSurveyor system is that it is easy to program – time-consuming and complicated training courses are not required before you can start collecting meaningful data. 1.2. What’s new? Shallow and/or deep water profiling solutions – The ADP can be either one of the following types. Both of these profilers are described in detail in Section 2. • S5 ADP: A five-beam system with four profiling beams and one vertical beam. The S5 has a velocity measurement range of up to 5 m and a discharge measurement range of 15 m (when referencing GPS and the vertical beam). • M9 ADP: A nine-beam system with two sets of four profiling beams (each set having its own frequency) and one vertical beam. The M9 has a velocity profiling range of up to 30 m and a discharge measurement range of 80 m (when referencing GPS and the vertical beam). Multi-frequency – Multiple acoustic frequencies fused with precise bandwidth control make for the most robust and continuous shallow-to-deep measurements ever for an ADP. A deterministic microcontroller automatically apportions the appropriate acoustics and pulse schemes as you cross the river. This allows you to focus on the measurement technique, and not on the instrument setup. The end result of the automatic adjustments is that it gives you the best measurement settings possible at all times, no matter the depth and velocity of the river. Automated cell size adjustments – As you go from shallow to deep water, the cell size automatically adjusts to optimize performance and resolution. This feature further enhances your ability to measure continuously in dynamic river conditions. Vertical beam – A low-frequency, fast-sampling vertical beam extends the maximum depth range of the system and provides superior channel definition for river discharge measurements and bathymetric surveys. The vertical beam also provides you the confidence that you will measure the proper depth during extreme conditions such as high-sediment flows and floods. Integrated GPS, Power, and Communications – The RiverSurveyor Power and Communications Module (PCM) brings unmatched ease of use and flexibility to the S5 and M9 ADPs. The PCM contains a rechargeable battery pack for power, factory-configured Bluetooth® radio or spread spectrum (SS) radio (for communication with a PC or a compatible Mobile device; see §6.2), and an optional GPS enclosed in a water-tight housing. RTK GPS integration – Available exclusively from SonTek, the RTK (real-time kinematic) GPS optional solution is easy to use and offers incredibly precise positioning and fast data sampling rates (10-Hz). This option can augment or be an alternative to bottom tracking and positioning. Unlike existing “Differential” GPS solutions, which sometimes requires 50+ meters width for a RiverSurveyor S5/M9 System Manual (February 2010) 1 SonTek/YSI reliable discharge measurement, RTK GPS allows you to measure minimum stream widths consistently to less than 1 meter. Internal Discharge Calculations – All calculations are performed inside the ADP. This gives you the increased flexibility to collect data, disconnect from the system, and then reconnect to the system during data collection without stopping the data collection process and without the fear of losing data. It avoids any possibility of data loss if communication is lost or becomes intermittent. You can even change communications devices (to/from PC or Mobile device) during a discharge measurement if needed. Quality and status feedback – New, dynamic software interface and vibrant graphics for clear feedback in the office or field. Review and analyze data faster – Load, view, and analyze multiple data sets simultaneously all from your PC. Flexible Mobile Device operation – RiverSurveyor runs on both PC and Mobile device hosts giving you the flexibility to collect data to best suit your field requirements. Both software hosts also offer you the ability to make complete measurements without relying on secondary programs or utilities to extract or playback data. Patent Pending on Multi-frequency, Automated cell size adjustments, Vertical beam and Internal Discharge Calculations 2 RiverSurveyor S5/M9 System Manual (February 2010) SonTek/YSI Section 2. RiverSurveyor Instrument Configuration and Options The RiverSurveyor discharge measurement system is flexible enough to fit most every field setup requirement you will need. The core system includes everything you need to make a directconnect discharge measurement from a manned powerboat and external power supply. The options are modular, designed to be used with any S5 or M9 system, to best suit your field measurement needs. The following is a brief description of the core system and the options available with the new RiverSurveyor discharge measurement system. 2.1. RiverSurveyor Core System S5 and M9 The core system includes: Part Description Multi Frequency ADP (S5 or M9) User Software Disc ADP Quickstart Guide Power/Comm Cable (Std. 10m) Power Supply (18V) AC Power Cord Qty 1 1 1 1 1 1 The S5 and M9 ADPs integrate a compass/2-axis tilt sensor, temperature sensor, 8-GB internal recorder, and a vertical acoustic beam (echo-sounder) for depth measurement. • S5 (Figure 1): This portable, 5-beam ADP with a velocity profiling range of 0.2 to 5.0 m is ideal for use in shallow channels. The S5 has a 5-inch (13-cm) diameter Delrin housing that narrows to 3.2 inches (8.1-cm). It has four 3.0-MHz velocity measurement transducers in a Janus configuration. A 1.0-MHz vertical acoustic beam (echo sounder) provides depth data. Figure 1. S5 ADP Features RiverSurveyor S5/M9 System Manual (February 2010) 3 SonTek/YSI • M9 (Figure 2): This portable, 9-beam ADP with a velocity profiling range of 0.2 to 30 m is intended for use from moving or stationary boats/floating devices in both shallow and deep channels. The M9 has a 5-inch (13-cm) diameter Delrin housing. It has two sets of velocity measurement transducers, both in a Janus configuration – four 3.0-MHz transducers and four 1.0-MHz transducers. A 0.5-MHz vertical acoustic beam (echo sounder) provides depth data. Figure 2. M9 ADP Features The four brass inserts on top of the ADP can be used to secure the ADP to a mount on the side of a boat or to mount the optional GPS antenna. Figure 3 shows a dimensioned drawing of the brass insert locations in inches and millimeters. Figure 3. Brass Insert Locations 4 RiverSurveyor S5/M9 System Manual (February 2010) SonTek/YSI 2.2. Power and Communications Module (PCM) - Optional The PCM (Figure 4) connects directly to the S5 or M9 using a 1-m cable. It provides power to the ADP using a rechargeable battery pack. It allows for remote communications with a PC or Mobile device via a radio link. There are two different radio communications options depending on range. Figure 4. Power and Communications Module (PCM) The PCM has four LEDs. Table 1 describes their purpose. In all cases, a green light would indicate that the component is functioning while a red/orange light would indicate that the system is not functioning. Below is a description for the LED labels. Label PWR Radio DGPS* GPS* Table 1. PCM LED Descriptions Description Power Radio Communication Differential Quality GPS (Green) GPS Lock (Green) *Note: Depends on optional GPS selection Important: The dummy plug must be installed when using the PCM. 2.2.1. Bluetooth Option A PCM with the Bluetooth option provides remote communication between the ADP and PC or Mobile device. The maximum range using the supplied Bluetooth dongle plugged into a PC is up to 200m. The Bluetooth range of the Mobile device is approximately 60m. Those approximate ranges assume a clear line-of-sight with no obstructions or poor weather. RiverSurveyor S5/M9 System Manual (February 2010) 5 SonTek/YSI 2.2.2. Spread Spectrum (SS) Option A PCM with the spread spectrum radio option provides remote communication between the PCM and the SS Base radio connected to a PC. The operational range is about 2 km. 2.3. GPS Components – Optional SonTek offers two GPS options integrated into the PCM. The first option provides RTK quality data (±3 cm). RTK quality data requires additional hardware in the PCM as well as a separate RTK Base Station (Figure 5). The Base Station provides RTK corrections to the GPS receiver built into the PCM. The Differential GPS (DGPS) option does not require a base station, but additional hardware is required for the PCM. Some general rules of thumb for connection times for the various communications are: • GPS Lock: Typically takes 5 minutes to turn from Red to Green (greater than 1-m accuracy). • Differential Lock: Typically takes up to about 5 minutes to turn from Red to flashing Red/Green (submeter accuracy). • RTK Lock: Typically takes up to about 10 minutes to turn from alternatively flashing Red/Green to Green (±3 cm accuracy). • BT/SS LED: Turns to Green as soon as connection is established between PC/Phone and the system (assuming you are within range). • Base Station Radio Link Established: Red light Figure 5. Real-Time Kinematic (RTK) Base Station 6 RiverSurveyor S5/M9 System Manual (February 2010) SonTek/YSI 2.3.1. SonTek RTK GPS - Optional The RTK GPS option provides precise (±3 cm) real-time kinematic position data to the ADP. The Bluetooth or spread spectrum PCM includes an internal RTK GPS receiver, an external, high-gain GPS antenna and a mounting mast. It also includes an additional spread spectrum radio modem for communication with the RTK base station. The RTK Base Station consists of an RTK GPS receiver with an external, high-gain GPS antenna, a spread spectrum radio modem for communication with the PCM, an external, high gain antenna and a mounting tripod. The Base Station receives GPS data at 10-Hz and provides RTK corrections at 1-Hz to the PCM connected to the ADP. The Base Station should be in a fixed location on shore. A direct line of sight is best for communication. The maximum communication range is about 2 km. Figure 6 shows the details for the Base Station. Table 2 describes the base station LED labels. Figure 6. RTK Base Station Components Table 2. RTK Base Station LED label descriptions Description Label RTK GPS RTK Quality Connection (Green) GPS Lock (Green) The RTK Base Station receives GPS data via satellite and applies an RTK correction that is transmitted to the internal GPS of the PCM via spread spectrum radio communications. The RTK correction data is transferred to the ADP’s internal memory for processing. It is then transmitted along with the ADP data from the PCM to the PC or Mobile device. Note: If communication between the RTK Base Station and PCM is lost, a sub-meter correction is typically valid for up to 45 minutes without having to re-establish communications. RiverSurveyor S5/M9 System Manual (February 2010) 7 SonTek/YSI 2.3.2. SonTek DGPS - Optional The DGPS option provides sub meter differential GPS positioning data to the ADP. The Bluetooth or spread spectrum PCM includes a DGPS receiver and external antenna. No base station is required for this option. The GPS satellites communicate with the differential GPS receiver inside the PCM. The DGPS data is received by the PCM at 10-Hz and transferred to the ADP’s internal memory for integration and processing. It is then transmitted along with the ADP data from the PCM to the PC or Mobile device. 2.4. SonTek Hydroboard - Optional The SonTek Hydroboard (Figure 7) is specifically designed to be used with the S5 and M9 ADP systems. It has easy to use, drop-in installation mounts for the ADP and the PCM. Simply insert the components into their corresponding mounts and tighten the thumb screws. The Hydroboard has two hydro-fins to provide increased stability. There are two embedded towing mounts near the front as well as one in the rear for an optional drag chute to increase boat track stability. A detailed description of the mounting procedure for the Hydroboard is explained in Section 3.7.2. Figure 7. SonTek Hydroboard w/Optional GPS 2.5. Oceanscience Riverboat – Optional The Oceanscience Riverboat is available for use in environments with higher flow rates. It provides a stable device for accurate measurements by reducing pitch, roll and yaw in flows up to 3 m/s. The flared box design reduces nose-diving and allows for wider selection of acceptable measurement sites. 8 RiverSurveyor S5/M9 System Manual (February 2010) SonTek/YSI Section 3. System Configurations and Setup 3.1. Overview An important configuration concept to remember is that the RiverSurveyor system and all its components are completely interchangeable. Any PCM can be connected to any S5 or M9 ADP system. The S5 or M9 can be mounted with the PCM to the SonTek Hydroboard or any other boat with a custom installation. We encourage you to become familiar with the components, assembly instructions, and functionality of the system before going into the field. This section provides information on how to interconnect and prepare the system for data collection. The next several figures (Figure 8 through Figure 15) present some typical PCM configurations with system communications and setup details. 3.2. Configuration A – Direct Connection with S5 or M9 Core System 3.2.1. Description The core system is typically used in a manned powerboat application using a direct cable connection to the PC and the external power supply (Figure 8). The dashed line indicates the use of an optional third party external GPS. The use of an external GPS precludes the use of all wireless communications (i.e. Bluetooth and spread spectrum); therefore, a direct connection via serial communications is necessary. Figure 8. Core system/direct connect setup 3.2.2. Hardware Setup Follow these instructions to set up the hardware for the core system: 1. Connect the underwater, 8-pin, male connector of the 10-m power and communications cable to the female ADP connector until the face of the cable connector is flush with the ADP connector. Screw-on the locking sleeve to secure the connection. 2. Connect the female, 9-pin, serial connector marked USER on the power and communications cable to the PC. If the PC does not have a serial port, use the USB to serial adapter included. 3. Mount the ADP to the boat. Be sure to mount the ADP deep enough that the transducers will remain submerged for the entire measurement. 4. Connect the external AC power supply to the system by connecting the 2-pin power cable from the 10-meter power/serial communications cable to the power source. Figure 9 shows the hardware necessary for this option. RiverSurveyor S5/M9 System Manual (February 2010) 9 SonTek/YSI Figure 9. Hardware required for the direct connect option 5. Start the RiverSurveyor Live for PC software and connect to the system to start the measurement. Details for conducting a discharge measurement with a PC are presented in Section 6. 6. To integrate an external GPS system, connect the male, 9-pin, serial connector marked GPS on the power and communications cable to the GPS system. The external GPS needs to have the following settings: • Communications Protocol – 38400 N,8,1 • Data Rate – 10 Hz • GPS String – VTG/GGA. To avoid possible communication issues it is always recommended to turn-off (or disable) any additional GPS strings being output by the external GPS. 3.3. Configuration B – Bluetooth Communications 3.3.1. Description Figure 10 shows the RiverSurveyor system with wireless communications, in this case Bluetooth, using a small unmanned boat, such as the SonTek Hydroboard. The maximum range using the supplied Bluetooth dongle plugged into a PC is up to 200m. The Bluetooth range of the Mobile device is approximately 60m. Those approximate ranges assume a clear line-of-sight with no obstructions or inclement weather. 10 RiverSurveyor S5/M9 System Manual (February 2010) SonTek/YSI Figure 10. Bluetooth communications option (without GPS) 3.3.2. Hardware Setup Please us the following directions for Bluetooth communications setup. 1. Be sure to use the mounting directions from section 3.2.2 for the ADP and PCM 2. The Mobile device requires no external hardware for Bluetooth. However, the PC requires a connection to a USB-powered Bluetooth Dongle into a serial port. A serial to USB adapter is provided for PCs without a built-in serial port. The Dongle comes preconfigured and should be recognized as plug-and-play. 3. Be sure that the Bluetooth Communications is activated. Start RiverSurveyor Live for PC and establish communications with the system. Be sure the Parani Bluetooth checkbox is selected in the communications of the Mobile device or PC. 4. Turn on System Power by pressing the white circular button on top of the PCM. The button should then glow solid green. Follow the directions outlined in Section 5 to make a discharge measurement. Figure 11 presents the hardware necessary for the Bluetooth communications option. BT Dongle RiverSurveyor S5/M9 System Manual (February 2010) 11 SonTek/YSI PCM BT Dongle Figure 11. Hardware for Bluetooth communications option 3.4. Configuration C –Spread Spectrum Communications 3.4.1. Description Figure 12 shows the RiverSurveyor system with wireless communications, in this case spread spectrum communications using a PCM on a small unmanned boat, such as the SonTek Hydroboard. The maximum range of the spread spectrum radio link is approximately 2 km. Figure 12. Spread Spectrum communications option (without GPS) 12 RiverSurveyor S5/M9 System Manual (February 2010) SonTek/YSI 3.4.2. Hardware Setup Please use the following directions for spread spectrum communications setup. 1. Be sure to use the mounting directions from section 3.2.2 for the ADP and PCM 2. Connect the spread spectrum radio box to the PC by using the communications cable. Connect the serial end of the connector to the PC and the 8-pin female connector of the cable to the 8-pin male connector on the radio communications box. 3. Turn on System Power and spread spectrum radio box and by pressing the white circular button on top of the PCM. The button should then glow solid green. 4. Follow the directions outlined in Section 5 to make a discharge measurement. Figure 13 presents the hardware necessary for the spread spectrum communications option. PCM SS Radio Figure 13. Hardware for Spread Spectrum Communications RiverSurveyor S5/M9 System Manual (February 2010) 13 SonTek/YSI 3.5. Configuration D – RTK GPS 3.5.1. Description Figure 14 shows the RiverSurveyor system with RTK GPS (with precision to ±3 cm) and wireless communications using a small, unmanned boat such as the SonTek Hydroboard. GPS position data is received at 10-hz by both the RTK base station and ADP (on the rover). The RTK GPS correction is transmitted at 1-hz from the RTK base station to the unmanned boat via spread spectrum communications. The SonTek Hydroboard is used below for conceptual purposes. Note: A sub-meter correction will be maintained up to 45-minutes if communications with the RTK base station is lost and after an RTK correction has been established. If the RTK base station will not be used for the measurement the user must switch the GPS application to “DIFF” for differential measurements. Figure 14. Wireless communications with RTK GPS 14 RiverSurveyor S5/M9 System Manual (February 2010) SonTek/YSI Figure 15 presents a generic or over-the-boat setup using RTK GPS. The setup can utilize either wireless or direct connect communications, which is indicated by the dashed line between the PC and PCM. The dashed line indicates a connection to the PCM in three possible ways: • Directly to the PCM via a cable for a direct connect configuration • Connect to the PCM via Bluetooth communications • Connect to the PCM via SS communications For the wireless communications option, the dummy plug (8-pin plug) must be inserted into the PCM in order to complete internal circuitry and active wireless communications. *Note: The “dummy” plug is required in the direct connect port when not using the direct-connect option for PCM to PC connection. Figure 15. Direct connect application with RTK GPS RiverSurveyor S5/M9 System Manual (February 2010) 15 SonTek/YSI 3.5.2. Hardware Setup There are two components used to collect RTK quality data – the RTK PCM mounted to the boat and RTK Base Station. Figure 16 shows the Bluetooth option with the RTK option. RTK PCM (Boat) Assembly 1. Connect the GPS high gain antenna to the aluminum mast by screwing the male threads on the mast into the antenna receiver. 2. Connect the mounting bracket for the antenna mount to the ADP by inserting the four thumb screws located on the mounting bracket into the four brass holes on the ADP. 3. Connect the coaxial cable to the PCM and the GPS antenna by connecting the female connectors on the coaxial cable to the male connectors in the PCM and GPS antenna. 4. Turn the system on by pressing the power button on the PCM. 5. RTK quality data requires that the RTK Base Station be installed within 2 kilometers of the PCM. The RTK Base Station setup is described below. Figure 16. Hardware for RTK GPS option with Bluetooth Communications RTK Base Station 1. Figure 17 displays an assembled RTK Base Station and tripod. The tripod should be in close proximity to the measurement section (less than 2 km with good line-of-sight) and mounted so that it is reasonably level. Also, nearby obstructions such as bridges, buildings, or large trees should be avoided if possible. These obstructions limit the number of useful satellites increasing the required time to obtain an RTK correction. 2. Attach the tripod adaptor (round plastic disk) to the RTK Base Station until there is a tight fit. Now attach the tripod adaptor to the tripod by screwing the brass thumb screw into the bottom of the tripod adaptor. 3. Attach the Base Station antenna mount to the top of RTK Base Station housing over the brass inserts. Use the four thumb screws on the antenna base mount to secure the mount to the RTK Base Station. 16 RiverSurveyor S5/M9 System Manual (February 2010) SonTek/YSI 4. Attach the screw-in Base Station antenna mast into the base mount. Screw in the Base Station antenna to the top of the mast. Make sure the antenna is high enough to avoid interference from nearby obstructions like overhead trees, bridges, or buildings. The antenna is typically mounted directly on top of the RTK Base Station; however, it can be dismounted and placed in a more ideal location as long as the antenna’s coaxial cable remains connected to the RTK Base Station. 5. Open the RTK Base Station battery cover by loosening the two thumb screws on the battery cover. Insert the rechargeable battery pack by aligning the exposed cells with the spring contacts. Check to make sure the O-ring seal is clear of all debris. When closing the battery cover, securely tighten both thumb screws to maintain a waterproof seal. 6. Connect the SS Radio antenna male connector to the female connector in the RTK Base Station. 7. Plug the male connector of the Base Station antenna cable male connector to the female connector embedded in the RTK Base Station. 8. Adjust the height of the tripod for the best line of sight to the remote PCM. 9. Important: If possible, avoid line of sight obstructions as they may decrease the communication range between the RTK Base Station and the PCM (on the boat). If needed, you can add an extension cable between the RTK Base Station and SS Radio antenna to place the SS antenna in a more ideal location. 10. Turn on system power by pressing the circular button on top of the communications box: it should turn solid green once turned on. 11. The RTK Base Station has two LEDs. In all cases, a green light would indicate that the component is functioning while a red/orange light would indicate that the system is not functioning. Figure 17. Hardware for the RTK Base Station RiverSurveyor S5/M9 System Manual (February 2010) 17 SonTek/YSI 3.6. Configuration E – SonTek Differential GPS 3.6.1. Description Figure 18 shows the RiverSurveyor system with Standard DGPS and wireless communications using a SonTek Hydroboard. The standard differential GPS option has sub-meter precision. The SonTek Hydroboard is used below for conceptual purposes. Figure 18.Wireless communications DGPS 3.6.2. Hardware Below are the directions for mounting the hardware for the DGPS option. Figure 19 displays the hardware necessary for the DGPS option. 1. Connect the female connector of the coaxial cable to the male connection on the receiving antenna. Run the coaxial cable through the antenna mast to the bottom, collecting all excess cable from the antenna mast. 2. Attach the GPS receiver to the mast by screwing the female connector of the antenna to the male connector on the mast. 3. Attach the GPS mounting bracket to the ADP by inserting the four thumb screws into the brass holes in the ADP. Now attach the antenna mast to the mounting bracket by screwing the male threads on the mast to the female threads inside the mounting bracket. 4. Connect the female connector of the coaxial cable to the male connection on the PCM. 5. Turn the system on by pressing the power button on the PCM. Follow the instructions in Section 5 to complete the discharge measurement. 18 RiverSurveyor S5/M9 System Manual (February 2010) SonTek/YSI Figure 19. Hardware for the DGPS option with Bluetooth Communications 3.7. Configuration F - SonTek Hydroboard 3.7.1. Description The SonTek Hydroboard was designed to be lightweight enough for one person, completely assembled. The Hydroboard has easy to use drop-in installation mounts for the ADP and the PCM, simply insert the components into their corresponding mount and tighten the thumb screws. In addition the Hydroboard has two hydrofins that provide increased track stability in water as well as embedded mounts that can be used for towing as well as the incorporation of a drag chute to increase boat track stability. 3.7.2. Hardware Setup This section describes how to assemble the SonTek Hydroboard components (Figure 20). 1. Open the PCM’s battery pack cover by loosening its thumb screws. Insert the rechargeable battery pack by aligning the cells with the contacts. Make sure the O-ring seal is clear of debris. Close the battery cover and securely tighten the thumb screws to maintain a waterproof seal. Set the PCM into position on the Hydroboard (in the rectangular cut-out in the mounting bracket) and tighten its thumb screws. 2. Insert the ADP face (transducers looking down) into the circular hole in the Hydroboard. Start from the topside of the Hydroboard and move the ADP downward (be sure the top of the ADP coincides with the top of the Hydroboard). If needed, slightly rotate the ADP left and right to raise and lower the ADP to the proper level. To properly align the transducers, make sure the female plug-in of the ADP lines up with the female plug-in of the PCM. 3. The Hydroboard is shipped with a fairing unit preinstalled on its bottom. The fairing is attached to the Hydroboard with four screws that pass through the top of the Hydroboard into the fairing unit on the underside of the Hydroboard. 4. The ADP should be installed so that the transducer head is flush with the fairing. The transducer can be installed deeper if required. Tighten the clamp around the transducer by rotating the thumb screw until the ADP is held firmly in place. 5. The white line on the side of the Hydroboard can be used to calculate the transducer depth. The transducer depth is defined as the distance from the vertical beam to the water surface. The distance for both the S5 and M9 with the fairing to the white line is 4.5 in RiverSurveyor S5/M9 System Manual (February 2010) 19 SonTek/YSI (114.3mm). If the ADP head is mounted flush with the fairing, simply subtract the distance of the white line to the waterline from 4.5 inches to get the transducer depth. 6. After the PCM and the ADP are in place, connect the data cable between them. Start by connecting the cable’s 8-pin male connector to the female ADP connector until the face of the cable is flush with the connector; now tighten the connection with the protective locking sleeve. Next, repeat the same procedure to connect the data cable to the PCM. Connect the 8-pin male cable connector by pushing the connector into the female connector embedded in the PCM until the face of the cable is flush with the female connector; tighten the connection with the protective locking sleeve. Figure 20. An Assembled SonTek Hydroboard (with RTK GPS option) 7. GPS set-up information is in §3.5 and 3.6. 8. Attach the contoured hydro-fins to the bottom of the Hydroboard. Insert the fins into the slots in the bottom of the Hydroboard with the contour facing the back of the Hydroboard. Firmly tighten the fin to the board by sliding the screw through the small hole in the fin bottom brace. Align the small metal screw clip (in a slide frame) under the hole and firmly tighten the screw. 9. Turn on System Power by pressing the white circular button on top of the PCM. The button should glow solid green. 10. 20 Follow the instructions in Section 5 for completing a discharge measurement. RiverSurveyor S5/M9 System Manual (February 2010) SonTek/YSI Section 4. System Maintenance 4.1. Overview Under normal conditions, the ADP requires little maintenance for years of reliable performance. This section discusses some routine maintenance procedures that should be followed to ensure long-term operation of your system. 4.2. Cleaning the transducers Periodic cleaning of the ADP transducer face may be needed to maintain optimal performance in areas of high biological activity or mineral build-up. To remove material build-up on the transducer faces, simply clean with a stiff (non-metallic) brush or apply soapy water and clean with a sponge. The transducers themselves are protected in a hard epoxy-resin and are very durable. Minor scratches on the transducer face are normal over a period of time and will not harm them or affect their performance. Direct impacts to the face should be avoided as this might crack the face of the transducer and allow moisture into the electronics housing as well as causing damage to the transducer itself. 4.3. Cables and connectors Cables and connectors used with the ADP are often the most vulnerable portion of the system. All standard SonTek cables use a durable polyurethane jacket that provides excellent long-term wear and abrasion resistance. Rugged underwater flexible connectors are also used along with high-grade metal connectors to prevent connection failures. However, any cable or connector used in the field is susceptible to damage and reasonable precautions should be taken. Inspect all ADP cables and connectors for damage on a regular basis and replace if necessary. GPS cables and connectors are industry standard (TNC male to male) and can be replaced if damaged using a local supplier of GPS/survey equipment or by contacting SonTek directly. For connectors, a light coat of silicone grease or spray is useful in facilitating the connections. However, make sure the silicone does not contain cleaners or solvents that could damage the rubber part of the connector. Inspect both male and female connector pins to make sure they are clear of debris and excess grease, which could interfere with the connection or make it difficult to fully mate the connectors. 4.4. O-rings Make sure that O-rings on the battery compartment of the PCM are completely clean and free of debris. Be sure that the O-ring is seated correctly, and that it is not twisted or broken. It is important to maintain a water-tight seal for the integrity of the instrument. 4.5. Batteries The first thing to do with a new system is charge the battery packs. Please use the charger provided. Follow these steps: 1. Plug the charger into the wall and wait for the LED to turn orange. 2. Insert the battery pack into the charging cradle. Be sure the metal contacts on the battery pack are aligned with the metal springs in the charging cradle. 3. The LED should be red while it is charging. A full charge will take about 1-2 hours. 4. Charging is complete when the LED turns green. 5. Remove the battery from the cradle. 6. Wait for the LED to turn orange to charge another battery. 7. Repeat steps 2 through 6 to charge another battery RiverSurveyor S5/M9 System Manual (February 2010) 21 SonTek/YSI A description of all of the possible light patterns can be found on the bottom of the charger. It is important to use only completely charged SonTek battery packs. A completely charged battery pack should have about 16-18 volts if you check it with a voltmeter. Be sure the battery pack is completely dry before placing it in the charging cradle. Also be sure the battery compartment in the PCM is completely dry before inserting the charged battery pack. Do not try to modify the battery packs shipped with the product. Third party battery packs will not be supported. Any damage incurred from using a third party battery pack will void the warranty. 4.6. Mobile Device Be sure to use the clear plastic lanyard with the Mobile device to prevent any water damage in the field. The Mobile device is not water resistant. Water damage is not covered by the warranty. 4.7. Factory Calibration Each system is individually calibrated during the manufacturing process. Since there are no moving parts and the beams are built into the ADP head, recalibration is not necessary unless the M9/S5 is physically damaged. 22 RiverSurveyor S5/M9 System Manual (February 2010) SonTek/YSI Section 5. Introduction to Measurement Procedure 5.1. Overview This section is a general guide to prepare for and conduct discharge measurements in the field. The information presented here will discuss pre-measurement tests as well as the general procedure for making a discharge measurement. 5.2. Applications The procedures described in this section are useful for all moving boat discharge measurements made with the RiverSurveyor S5 and M9; this includes the use of the SonTek Hydroboard, custom remote device applications as well as over the boat applications. The protocol described below is applicable to measurements made with the PC and Mobile device software. 5.3. Pre-Measurement Tests The steps described below are used to test the RiverSurveyor hardware prior to making a measurement. The pre-measurement tests should be done prior to each discharge measurement to ensure the functionality of the RiverSurveyor hardware for proper data collection. 5.3.1. Check cables and connections Prior to mounting the RiverSurveyor hardware, the structural integrity of all cables should be reviewed to ensure that there are no defects; this includes not only the cable but also the connectors. Once the hardware is mounted, connect all the necessary cables. Be sure the faces of the connectors are flush and secure before screwing down the locking sleeves. When using the SonTek Hydroboard or other remote device, be sure that all knots and clamps are sound and that the rope/cord is strong enough to withstand the onsite conditions. 5.3.2. Communications Communications are vital for remote measurements. There are three types of communications connections to the ADP: Direct Connect, Bluetooth and Spread Spectrum Radio. In the case of wireless communications, be sure to have the dummy plug installed in the PCM. It is important to note that the PCM requires power. Be sure to have the battery packs adequately charged and the spare available. Direct Connect is a cable connection between the ADP and the PC. Confirm that the connection between the cable and the ADP is sound (that the wet mateable connector is flush with the face of the connector on the ADP) and that the locking sleeve is hand tightened. Also make sure that the serial connection to the PC is tight. There is a USB to serial adapter included for PCs without a DB9 serial port. The external AC power adapter is required for direct connections without a PCM. Bluetooth communication is available with an optional PCM. It allows for wireless communication between the ADP and a PC with the Parani Bluetooth dongle (200m range) or the Motorola Q Mobile device (60m range). Parani Bluetooth Dongle – This is an external Bluetooth radio that plugs into a PC serial port or through the USB to serial adapter. The dongle requires power from the PC through the included USB connector. It is automatically configured to 57600 baud by the RiverSurveyor Live software. In all cases, be sure to verify sound connections. Spread Spectrum Radio provides extended range (up to 2 km). The optional PCM communicates with the spread spectrum base that plugs into a PC serial port via an 8-pin wet mateable connector. There is a USB to serial adapter included for PCs without a DB9 serial port. The RiverSurveyor S5/M9 System Manual (February 2010) 23 SonTek/YSI spread spectrum base radio is battery powered, so be sure to have fully charged batteries and to turn it on prior to starting the discharge measurement. 5.3.3. System Test This is a 60 second verification that the components of the hardware are functional. The System Test verifies the battery voltage, compass, SD memory card and temperature sensor are all functioning properly. A system pass would indicate that all systems are sound for use, while a fail would require user action in order to conduct reliable discharge measurements. Below is a list of the following system Fail messages: System battery voltage < 12 volts System compass is not working System SD card (memory) is not working Temperature sensor is not working 5.3.4. Compass Calibration Compass calibration is necessary prior to each discharge measurement. It is used to compensate for magnetic fields specific to the site. To perform a compass calibration, rotate the ADP through two complete circles while varying pitch and roll angles as much as possible. It is important to complete the compass calibration on the boat or mount and as close to the measurement location as possible. The compass calibration routine was updated in firmware v0.81. The new compass calibration procedure improves the ability to detect local magnetic distortion. The result is improved magnetic north heading readings during the actual calibration. The magnetic north readings are used to reference “true north”. Improved magnetic north readings reduce the need to make minor heading corrections in order to properly align the compass to true north. 5.3.5. Recorder The Recorder Menu is provided on the Systems Tab and provides a way of managing files stored on the 8 GB memory card. You can download all or a selection of files by using the options presented in the Recorder window. Download all files – downloads all files from the recorder Download selected files – allows you to select files using the tick box next to the file name. Simply select the files to download and then click on Download selected files. Format Recorder – Clears the memory of the recorder by erasing all files. Make sure that there is adequate memory available on the recorder prior to making a discharge measurement. It is suggested to download files and format the recorder between measurement sites. All files must be downloaded from the ADP for post-processing and data evaluation. 24 RiverSurveyor S5/M9 System Manual (February 2010) SonTek/YSI 5.4. Measurement Procedure Now that the pre-measurement tests and initial site specific entries are complete, it’s time to understand the basic principles behind a discharge measurement. Basically, the total discharge is the amount of water flow (or net flux) through a section and is computed from the mean water velocity and the cross-sectional area of the measurement section. 5.4.1. Overview A single moving boat measurement of discharge can be broken into three key components: the Start Edge, the Transect and the End Edge. These components are shown in Figure 21 below: Figure 21. Measurement Sections The Transect component can be further broken up into the Top Estimate, Middle or Measured Area and Bottom Estimate as shown in Figure 22 be- low: RiverSurveyor S5/M9 System Manual (February 2010) 25 SonTek/YSI Figure 22. Cross-sectional areas not measured by the ADP Therefore the Total Discharge can be calculated by summing the Start Edge, Top Estimate, Measured Area, Bottom Estimate and End Edge. Only the Measured Area is measured by the acoustic Doppler profiler. It is important to note that all other areas are estimated using industry recommended and approved calculations. The reasons for breaking up the total discharge calculation into several components are due to limitations inherent in all acoustic Doppler profilers. An acoustic Doppler profiler cannot measure the entire river cross-section due to several issues: • There is a minimum operating depth for the profiler. At depths lower than this minimum, the water velocity and therefore the discharge must be estimated based on the velocity and depth measurements on the edges. The Start and End Edges are measured in this way. • The mounting depth plus a short distance (referred to as the blanking distance) from the profiler to the start of the measured velocity profile leave a section of the water at the surface unmeasured. This area is referred to as the Top Estimate. • Potential data contamination in the last cell (e.g., the cell is partially or fully “touching” the riverbed), or potential side-lobe interference at the end of the profile, leaves a section of water at the bottom unmeasured. This area is referred to as the Bottom Estimate. So, how do we calculate the velocities and discharges in each of these estimated and edge areas? A technique known as Velocity Profile Extrapolation is used to estimate the unmeasured areas at the top and bottom. This theoretical approach to modeling of the velocities within the water column allows all velocities and therefore the discharge to be computed. Velocity Profile Extrapolation uses a power law velocity profile proposed by Chen (1991), and Simpson and Oltmann (1990), to calculate velocities above and below the Measured Area. Where u is the velocity at height z measured from the river bottom, u* is the bottom shear velocity, z0 is the bottom roughness height, and b is a constant (equal to 1/6 according to Chen, 1991). Use of this equation assumes the currents in the profile are traveling in approximately the same direction. In situations where this may not be the case, (e.g., Stratified Flows or bidirectional flow), one of the other extrapolation methods, available in the RiverSurveyorLive software, should be used. By default, the RiverSurveyorLive software uses the 1/6th Power Law velocity profile (described above) using the entire measured velocity profile to calculate velocities in the top and bottom unmeasured areas. The velocities are now known for each of the estimated top and bottom areas. The discharges for each component are calculated based on the velocities, depth and movement of the vessel across the transect. The discharge in the Start and End Edges is calculated from a mean velocity profile that is developed by maintaining a (relatively) fixed position at the edge. It is important that the vessel be kept as stationary as possible at the edge. The velocity profiles measured at this time will be combined together to produce a single average profile. The discharge calculation at the edge is 26 RiverSurveyor S5/M9 System Manual (February 2010) SonTek/YSI based on the selection of a constant sloped bank or vertical wall and uses a combination of the mean depth and velocity profile at the edge. In the Transect, the discharge calculation is based on the depth, distance travelled and the mean water velocity. During this time the system automatically compensates for changes in the vessel course and speed. One of the key benefits is that the PC and mobile software step through this entire process and do the calculation of discharge automatically. 5.4.2. Starting The System After the system is configured, start the system collecting data. 5.4.3. Collecting Start Edge Data Position the vessel for the starting edge position and begin collecting edge data with the vessel as stationary as possible. It is recommended that a minimum of 10 profiles/samples are collected to perform the edge discharge calculation. Enter the edge distance and shape. 5.4.4. Collecting Transect Data After collecting the start edge data, move the vessel across the transect. Keep the vessel speed and direction as constant as possible. 5.4.5. Collecting End Edge Data After moving across the transect and arriving at an end edge location, enter the end edge distance and shape. Collect at least 10 samples/profiles with the vessel as stationary as possible. 5.4.6. Making Additional Measurements/Transects After entering the end edge information, the measurement is complete. Another measurement can be started from the same location or the system can be shut down. RiverSurveyor S5/M9 System Manual (February 2010) 27 SonTek/YSI Section 6. RiverSurveyor Live for PC Software 6.1. Overview – RiverSurveyor Live for PC Software This section is a quick reference for using the RiverSurveyor Live for PC software. RiverSurveyor Live for PC software is a discharge measurement interface for RiverSurveyor S5 and M9 systems. The software includes everything needed to make real-time discharge measurements as well as post-process the data. 6.2. System Requirements RiverSurveyor Live for PC requires the following specifications for the PC. Windows Vista or Windows XP 1.6 GHz processor 1 GB memory 1 GB disk space 1024 x 768 Screen Resolution 6.3. Installation To install the RiverSurveyor Live for PC software on your PC, insert the distribution CD into your CD-ROM drive. The program should automatically start and display the Installation Menu (Figure 23). If the installation menu does not appear in a few seconds, click Start|Run on your PC and type D:\install.exe, where d:\ is the letter of your CD-ROM drive. Figure 23. Installation Menu Click the Install RiverSurveyor Live for PC option. The installation wizard (Figure 24) will display step-by-step instructions to install the software. 28 RiverSurveyor S5/M9 System Manual (February 2010) SonTek/YSI Figure 24. Desktop Installation Follow the on screen instructions to complete installation of the software. The installation will prompt you to enter your system’s serial number and software license number, so have this information ready. You are now ready to use RiverSurveyor Live for PC to make a measurement. 6.4. Starting the Software Upon starting the software, the main menu will be presented as shown in Figure 25 below: Figure 25. RiverSurveyor Live Main Menu RiverSurveyor S5/M9 System Manual (February 2010) 29 SonTek/YSI 6.5. Connecting to the System There are three ways to connect to the ADP using the RiverSurveyor Live for PC software. - Click the Connect icon on the toolbar at the top of the screen - Use the Connect to RiverSurveyor system link under Connection Options - Use the hot key: Ctrl+N After selecting the option to connect to the System, a popup window will prompt you to select the appropriate COM Port. For Direct Connect, Spread Spectrum Radio or integrated Bluetooth, select the appropriate Com Port and click Connect. Check the Parani Bluetooth connection box highlighted in Figure 26 only when using the Parani Bluetooth dongle. That automatically configures and connects to the Parani BlueTooth dongle at 57600 baud. Figure 26. COM Port Selection Window Following the COM port selection, you will be presented with a search window displaying the serial numbers of systems available for connection (Figure 27). Should no system be detected, click Search again. Be sure that the systems have power. If the power is not turned on, the system cannot be detected to communicate with the PC. Figure 27. System Select Window 30 RiverSurveyor S5/M9 System Manual (February 2010) SonTek/YSI When the connection is established, the System Tab is displayed as shown in Figure 28. This tab allows you to enter Site Information, System Settings and Measurement Settings; download files from the Recorder and perform Pre-Measurement Tests. The COM port and baud rate ( ) are shown at the top. Figure 28. System Tab Following Connection 6.6. Site Information Site information can be entered by clicking Change Site Information. This opens a popup window that allows you to enter site specific details. (Figure 29). The maximum number of characters allowed for each data field is in parentheses. Entering more than the maximum allowable characters will display an error message that will prompt you to enter the information within the allotted number of characters. This information can be changed during post processing. Figure 29. Site Information menu RiverSurveyor S5/M9 System Manual (February 2010) 31 SonTek/YSI 6.7. System Settings System settings are specific to the measurement site. The information is entered by clicking Change System Settings. This will allow you to enter setup information for the site as well as select the Track Reference, Depth Reference and Coordinate System. Figure 30 presents the System Settings menu. This information can be changed during post processing. The data changed in post-processing will be indicated with green text. Below is an explanation of each field in the System Settings menu. Figure 30. System Settings menu Transducer Depth – This is the distance (m) that the vertical beam transducer is submerged below the water surface. Figure 31 shows a basic diagram that depicts an ADP’s transducer face submerged in water. Transducer depth corresponds to the depth of water that the transducer face is submerged. Figure 31. Explanation of transducer depth measurement Screening Distance – This is the distance below the face of the ADP that you want to start collecting data rather than relying on the default setting of the instrument. In essence this setting allows you to program the ADP to start collecting data below a certain point. This is primarily used for over-the-boat applications where the screening distance can be set to avoid flow disturbance from the wake of the boat. Salinity – This user-defined parameter allows for a correction of the speed of sound in water based on the salinity in parts per thousand (ppt) at the face of the ADP. A value representative 32 RiverSurveyor S5/M9 System Manual (February 2010) SonTek/YSI of the local water conditions must be entered manually to avoid potential erroneous calculations. For reference, the salinity range is between 0 ppt (freshwater) to 34.5 ppt (seawater). Water temperature is also a factor for speed of sound in water calculations. The ADP has a built-in temperature sensor that automatically compensates for this effect. Magnetic Declination – On the earth's surface, a calibrated compass indicates magnetic North rather than geographic North. The angular difference between these two directions is called magnetic declination (also known as variation, magnetic variation, or compass variation). Magnetic declination varies across the earth's surface and over time. The ADP compass is calibrated at the factory; however, calibration is required at each site to remove any local magnetic interference. Compass calibration will ultimately give better measurement accuracy. The magnetic declination angle (θ) can be found on maps, like the one presented in Figure 32. Magnetic declination resources can also be found on may sites on the internet. Figure 32. Magnetic declination map of the world Track Reference – The ADP measures a water velocity using the Doppler shift principle, using multiple acoustic pulses transmitted and received throughout the water column. When the ADP is in motion, the water velocity actually measured by the ADP is a combination of boat velocity and water velocity. In order to determine true water velocity the boat speed must be known and then subtracted from the actual water velocity measurement. The RiverSurveyor “moving boat“ discharge application uses three methods (references) to determine boat velocity. 1. Bottom-tracking reference velocity: The ADP itself is capable of determining boat speed using a technique called “bottom-tracking”. In this case, bottom-track velocity is calculated using the Doppler shift received from multiple acoustic pulses (transmitted from the ADP) that have reflected off of the riverbed. If the riverbed is stationary (i.e. non-moving bottom), then the Doppler shift velocity will consist entirely of boat speed velocity which is acceptable for discharge calculations. If the riverbed is in motion the Doppler-shift-based velocity will consist of both boat speed and riverbed speed which will bias discharge calculations. In this case, the following two references would be preferred to determine boat velocity. 2. GGA GPS-referenced velocity: GPGGA (GGA) refers to a specific NMEA-0183 protocol for outputting GPS position data. In this case, the GGA “string” contains actual position (latitude/longitude) information along with several other GPS quality parameters. Boat velocity is calculated by measuring the distance between two successive GGA positions divided by the travel time between those two positions. Differential corrections are required for the GGA data to reduce the amount of position error as- RiverSurveyor S5/M9 System Manual (February 2010) 33 SonTek/YSI sociated with each measurement. The RiverSurveyor uses two types of differential corrections: “Sub-meter” differential and “Real-Time Kinematic” (RTK). 3. VTG GPS-referenced velocity: GPVTG (VTG) refers to a specific NMEA-0183 protocol for outputting GPS velocity data. In this case, the VTG string contains the actual boat speed information along with several other GPS parameters. The GPS velocity is calculated based on the Doppler shift of the received satellite signals. There is a drop down menu to select the appropriate track reference. All available track references will be available for analysis or to recalculate discharge in post-processing. There are four options: • Bottom-Track: The ADP uses the bottom-track feature to measure the velocity of a vessel relative to the river bottom. The vessel velocity is then subtracted from the measured water velocity to give the absolute water current profile independent of vessel motion. This is the only track reference available for systems without an optional GPS. • GPGGA: The ADP uses the GGA string (from the GPS data) to measure velocity of a vessel based on GPS position data. This is only available for systems configured with a GPS option. It is recommended that GGA data use a sub-meter differential or RTK correction for discharge calculations. The highest quality and most accurate method applies RTK-corrected data. • GPVTG: The ADP uses the VTG string (from the GPS data) to measure the velocity of a vessel based on GPS velocity data. This method requires additional review of data quality parameters to verity data quality. • System: The ADP references all velocities only to itself. This should only be used in specialized applications by experienced users. It is not recommended for discharge measurements from a moving vessel. Depth Reference - This is a drop down menu that has two options for determining water depth. Both options are available for post-processing, however you can decide the default measurement. • Vertical Beam: This is highly accurate echo sounder data used to determine water depth. • Bottom-Track: This uses data from the four angled beams to determine the depth of the water column using the average depth from each beam. Coordinate System - This drop down menu has three options. All three options are available for post processing; however you can set the default for the measurement. • ENU: This is the traditional East, North, and Up coordinate system. • System: This uses the ADP as a reference. Used for internal testing only. • XYZ: This is a three-dimensional “relative position” coordinate system used only for specialized applications by experienced users. 6.8. Measurement Settings Measurement Settings can be entered by clicking Change Measurement Settings. They apply to the specific discharge measurement. The information from this menu (Figure 33) can be changed in post-processing. Below is an explanation of the fields for the Measurement Settings window. 34 RiverSurveyor S5/M9 System Manual (February 2010) SonTek/YSI • • • Start Edge – Sets the default starting edge for discharge measurements (right or left bank). Rated Discharge – Enter a rated discharge pre- or post-measurement. This information is useful for post-processing data analysis and evaluation. Measurement Quality – Used as a post-processing qualitative input to evaluate the discharge measurement quality. Figure 33. Measurement Settings menu 6.9. Pre-Measurement Tests and Utilities The steps described below are used to test the RiverSurveyor hardware prior to making a measurement. The pre-measurement tests should be done prior to each discharge measurement to ensure the functionality of the RiverSurveyor hardware for proper data collection. 6.9.1. Compass Calibration A compass calibration is necessary prior to each discharge measurement to compensate for magnetic fields specific to the site. To perform a compass calibration, click the Compass Calibration link in the Utilities menu and click Start in the pop up window (Figure 34). Rotate the ADP through two complete circles while varying pitch and roll angles as much as possible. It is important to calibrate the compass on the boat or mount and as close to the measurement location as possible. Be sure to remove any Mobile devices (including any Mobile device operating the system), PDAs or other metal objects from the area prior to calibration. Figure 34. Compass Calibration window Click Stop upon completion of the compass calibration procedure. The calibration results and score (Figure 35) are displayed in the window. Using the example below, the calibration score is M6.49Q9. The M “value” should always be less than 10 and the Q “value” should always be RiverSurveyor S5/M9 System Manual (February 2010) 35 SonTek/YSI very high (based on a scale from 1-10). If the result is anything other than “Pass” the process should be repeated. A file is saved for quality control procedures in the following directory: C:\Documents\SonTek Data\YYYY_MM_DD\CompassCal where YYYY_MM_DD is the year, month and day format. Figure 35. Calibration Score window 6.9.2. System Test The System Test performs a series of checks to confirm the battery, compass, recorder and temperature sensor are in good operating condition. Click Start to initiate the test (Figure 36). The test typically takes 60 seconds and will present a dialog window indicating a system test Pass or Fail. A failure would indicate that user action is required to ensure proper functionality of the system. Figure 36. System Test Window Below is a list of the following system Fail messages: System battery voltage < 12 volts System compass is not working System SD card (memory) is not working Temperature sensor is not working 6.9.3. Set Time Set Time allows you to verify and set the time used for the discharge measurement. The popup window allows you to click the check-box to use the PC time or set the time manually (Figure 37). Click the Set Time button to apply the time setting and close the window. 36 RiverSurveyor S5/M9 System Manual (February 2010) SonTek/YSI Figure 37. Set System Time Window 6.9.4. BeamCheck BeamCheck displays the SNR (Signal to Noise Ratio) of each beam versus range. Click the BeamCheck link to start the utility. A popup window (Figure 38) will appear displaying the serial number of the system and the selected beam frequency. Figure 38. BeamCheck Menu Beam check will start automatically for the selected beam frequency showing a plot of each beam (Figure 39). The other beam frequencies can be selected from the drop down menu as the system runs. Figure 39. BeamCheck graph RiverSurveyor S5/M9 System Manual (February 2010) 37 SonTek/YSI 6.9.5. Update Firmware This allows users to update firmware from the utilities window by selecting a file from the PC. Typically users can download new firmware files (.a79 extension) from the SonTek webpage. After finding the file on the PC, select “Open” to load the firmware file to the ADP. After the update is loaded, make sure that the firmware version is correct in the Systems Tab. 6.9.6. SonTek GPS Option The SonTek GPS Option provides information about SonTek GPS options available. Clicking this option in the Utilities menu provides a way of verifying the GPS options available. If the GPS option is not available, this will be indicated in a dialog window. If the SonTek GPS application is RTK and you want to change to Differential (DGPS), click Change to Diff. Changing from Differential GPS to RTK GPS works in the same way (Figure 40). It is important to note that the SonTek DGPS option is not upward compatible with the SonTek RTK GPS option as it requires a more advanced hardware. There is also no capability of integrating a shore-station differential GPS correction. Figure 40. SonTek GPS option menus 38 RiverSurveyor S5/M9 System Manual (February 2010) SonTek/YSI 6.10. Recorder The Recorder Menu is provided on the Systems Tab and provides a way of managing files stored on the 8 GB memory card. You can download all or a selection of files by using the options presented in the Recorder window. Download all files – downloads all files from the recorder Download selected files – allows you to select files using the tick box next to the file name. Simply select the files to download and then click on Download selected files. Format Recorder – Clears the memory of the recorder by erasing all files. Make sure that there is adequate memory available on the recorder prior to making a discharge measurement. It is suggested to download files and format the recorder between measurement sites. At the very least, all files should be downloaded and the recorder formatted at the end of the day. Important: To complete any post processing on the recorded data, the file(s) must be downloaded from the ADP and opened in the RiverSurveyor Live for PC software. 6.11. Data Collection After completing the Pre-measurement tests and initial site specific entries to configure the System, you can begin the measurement procedure. The software provides a step-by-step procedure outlined below. Each step is explained in detail in the following sections. Figure 41 displays key concepts for making a discharge measurement Start Edge/ End Edge Transect Left Bank End Edge/ Start Edge Right Bank Figure 41. Steps for Making a Discharge Measurement RiverSurveyor S5/M9 System Manual (February 2010) 39 SonTek/YSI 6.11.1. Start System Click the Start a Measurement (F5) button to start data collection. Figure 42 shows where that button is located on the System tab. Note that this does not record any data. Instead it allows the data from the system to be viewed to make sure the system is operating correctly. Make sure that all indicators (shown in the top left) are all valid (not red). Position the vessel at the start edge of the transect. Figure 42. Data Collection – Start a Measurement (F5) 6.11.2. Start Edge Click the Start Edge button (or F5) as shown in Figure 43 and collect at least 10 edge samples. The Edge window will be displayed (Figure 44) showing information for both edges. Try to keep the vessel as stationary as possible during this time. Input the start edge information into the Edge dialog that pops up and press OK. 40 RiverSurveyor S5/M9 System Manual (February 2010) SonTek/YSI Figure 43. Data Collection – Start Edge (F5) Figure 44. Data Collection – Edge Information RiverSurveyor S5/M9 System Manual (February 2010) 41 SonTek/YSI 6.11.3. Start Moving Click the Start Moving button (or F5) and the Transect window (Figure 45) will be displayed. Try to keep the vessel speed and direction constant as it progresses across the river to the end edge. Figure 45. Data Collection – Start Moving 6.11.4. End Edge Click the End Edge button (or F5) when the vessel reaches the edge of the opposite bank (Figure 46). A dialog box will prompt you to describe the End Edge (Figure 47). Note that the screen changes from the Transect Tab to the Edges Tab. This allows detailed viewing of the edge data collection. Be sure to collect at least 10 samples at the ending edge. Try to keep the vessel as stationary as possible. 42 RiverSurveyor S5/M9 System Manual (February 2010) SonTek/YSI Figure 46. Data Collection – End Edge Figure 47. Data Collection - End Edge dialog box 6.11.5. End Transect Click the End Transect (Figure 48) button upon completion of the end edge. This automatically opens a new data collection windo so you can start a new measurement. The system is still running, so if you need to make another measurement, click the Start Edge button (or F5) to begin again as instructed in Section 6.11.2. If data collection is complete, click the Abort button RiverSurveyor S5/M9 System Manual (February 2010) 43 SonTek/YSI or press F8 to stop. It is recommended to go to the System tab and download the recorded data files upon completion of all the measurements. Figure 48. Data Collection - End Transect 6.12. Discharge Measurement Summary By clicking the Discharge Summary icon, you can show or hide the Discharge Summary window at the bottom of the desktop. This window presents the collected data in tabular format and includes the status icons to evaluate the measurement (Figure 49). If desired, resize the window by using the slider arrow when the mouse pointer is positioned over the window border. Figure 49. Discharge Measurement Summary All records are ordered by date/time with icons for starting edge, depth and track reference and coordinate system. All records can be selected or deselected by clicking with the mouse; this affects the statistics presented and is a quick and easy to understand what effect each measurement has on the overall average of the measurements for the site. 44 RiverSurveyor S5/M9 System Manual (February 2010) SonTek/YSI Additionally, you can select data to include or exclude from the discharge calculation by simply clicking to activate or deactivate the check box. The Discharge Summary has the following options that can be used in post processing: Discharge Summary Report: Generates a printer friendly report that summarizes all data used in the discharge calculation as well as the associated statistics (unchecked records are not displayed). Export Discharge Summary to ASCII: Exports the information found in the discharge summary to an ASCII file (.txt). Delete selected discharge record(s): Deletes the selected records (the ones with the red check). These records will not be used for the discharge calculation. Delete all discharge records: Deletes all records present, essentially removing all transects for discharge calculation Links between open files and records on the discharge summary are as follows: • An open file will update its corresponding discharge record with changes to settings or as sample number changes. • Closing a file leaves the record displayed in the discharge measurement summary, but the record will no longer update • Deleting the record severs the link to the data file. To add the record back, the file must be reopened. • Click on a record to switch to the matching data file. • Delete or uncheck a record to recomputed statistics RiverSurveyor S5/M9 System Manual (February 2010) 45 SonTek/YSI Section 7. RiverSurveyor Live for Mobile 7.1. Overview—RiverSurveyor Live for Mobile Software Due to combined portability and ease of use, we recommend the Mobile device for making discharge measurements. The RiverSurveyor Live for PC software (described in section 6) can also be used for making discharge measurements and has the added ability to apply powerful data viewing and post-processing capabilities (described in section 8). Before getting started in the field, remember that the Mobile device has some setup requirements, as does any mobile device/phone: Battery must be installed and charged, necessary software installed, and Bluetooth configured. 7.2. Mobile Device Requirements RiverSurveyor Live for Mobile requires the following: Operating System: Windows Mobile Smartphone v6.0 or higher Bluetooth Technology: BroadComm stack and Bluetooth v2.0 with A2DP Note: The Motorola Q, Q9h, Q9m and Q9c have been tested for full compatibility. Other Mobile devices with these specifications not supplied by SonTek may work, but they are not supported. 7.3. Installation Prior to installing RiverSurveyorLive for Mobile on the Mobile device, please make sure that Microsoft ActiveSync is installed on your desktop or laptop PC. If you do not have ActiveSync installed it can be downloaded from the distribution CD or online at: http://www.microsoft.com/windowsmobile/en-us/help/synchronize/device-synch.mspx To install the software follow these steps: 1. Connect the Mobile device to your PC with a USB cable. 2. Copy the RiverSurveyor Live.CAB file from CD-ROM. 3. Open ActiveSync on your PC (Figure 50). Figure 50. Active Sync menu 46 RiverSurveyor S5/M9 System Manual (February 2010) SonTek/YSI 4. Click the Explore button in ActiveSync (My Documents folder on the Mobile). 5. Paste the RiverSurveyor Live.CAB file to the open folder (My Documents) from the Explore window 6. In the Mobile device, use File Manager to open My Documents (Figure 51). Figure 51. File Manager menu - My Documents 7. Click the RiverSurveyor Live.CAB file. 8. The RiverSurveyor Live application will automatically install on the Mobile device and automatically confirm the installation of the application (Figure 52). Figure 52. Software Confirmation window When the installation is complete, disconnect the Mobile device from the PC and click on the Start button of the Mobile. Verify that the RiverSurveyor icon is displayed in the list of applications (Figure 53). Following the first use of the RiverSurveyor, the icon will be displayed on the shortcut key (Figure 54). RiverSurveyor S5/M9 System Manual (February 2010) 47 SonTek/YSI Figure 53. RiverSurveyor icon in application list Figure 54. RiverSurveyor icon on shortcut list 7.4. Navigation and Controls for Mobile Device RiverSurveyor Live for Mobile has an intuitive design for navigation and control through its various menus. Text can be entered in various fields using the letter keys on the phone. Navigation from field-to-field in various menus is done using the arrow keys at the top center of the phone. Soft keys can select options, change between screens, and even start and stop data collection. Figure 55 shows an example of the Mobile device with indicators of various functions. Below are a few tips for using the Mobile device: 1. For numerical entry, press the Function key and then the number in edit boxes 2. To lock numerical input (more than one number), press the Function key twice 3. To select or “click” on an item, press the Enter key 4. To view the previous screen, press the Back key 5. To erase all content in a data field, press the Back key 6. To minimize an application, press the End key (minimizing does not close an application) 48 RiverSurveyor S5/M9 System Manual (February 2010) SonTek/YSI Figure 55. Mobile Device Functions 7.5. Starting the Software and Connecting to the System To start RiverSurveyor Live for Mobile: 1. Select Start on the bottom left of the Mobile device screen. 2. Use the arrow keys to navigate to the RiverSurveyor Live for Mobile applicaand select it. Or, select the icon from the short cut key. tion icon A Search screen appears (Figure 56) when you start the software. The software will automatically search for any Bluetooth capable RiverSurveyor systems within range of the Mobile device (60m). Any RiverSurveyor systems within range will be listed on the screen. Figure 56. System Search Screen RiverSurveyor S5/M9 System Manual (February 2010) 49 SonTek/YSI From the list, select the desired system and press the corresponding soft key to Connect (Figure 57). In the case that only one system is found, the software will connect automatically. In the case that no RiverSurveyor system is found or within range, a “No device found” will be displayed. Make sure that the dummy plug is installed, all system LEDs on the PCM are correct, and the battery is charged and installed correctly, then click Search Again. Figure 57. Connection to ADP with serial number ADP-S5 5 7.6. Preparing for a Measurement - Main Menu Once a connection is established, the Main Menu (Figure 58) is displayed and is used to enter site information and initial site parameters. Each of the menu items can be accessed using the control pad or by pressing the corresponding number on the keypad. The START and QUIT options (bottom bar) are selected using the soft keys. Figure 58. Main Menu 50 RiverSurveyor S5/M9 System Manual (February 2010) SonTek/YSI 7.6.1. Site Information (1) On the Site Information screen (Figure 59), specific site information such as Site Name, Station Number, Location, Party, Boat/Motor Measurement Number, and Comments can be entered. To enter data, use the letter keys to enter data and the arrow keys to move between fields. Figure 59. Site Information screen The number in parentheses following each field in Figure 59 indicates the number of characters allowed in the field. If this value is exceeded, an error message is displayed. The information entered in this menu is applied to all future measurements, until the system is powered off. 7.6.2. System Settings (2) The System Settings screen (Figure 60) is for entering transducer depth, salinity, and magnetic declination. A description of each field is presented below. After entering System Settings parameters, select DONE to update the values in the system and return to the Main Menu. Figure 60. System Settings menu Transducer Depth – This is the distance that the vertical beam transducer is submerged below the surface. Figure 61 shows a basic diagram that depicts an ADP’s transducer face submerged in water. Transducer depth corresponds to the depth of water to which the transducer face is submerged. RiverSurveyor S5/M9 System Manual (February 2010) 51 SonTek/YSI Figure 61. Explanation of transducer depth measurement Salinity – This user-defined parameter allows for a correction for the speed of sound in water based on the salinity in parts per thousand (ppt) at the face of the ADP. A value representative of the local water conditions must be entered manually to avoid potential erroneous calculations. For reference, the salinity range is between 0 ppt (freshwater) to 34.5 ppt (seawater). Water temperature is also a factor for speed of sound in water calculations. The ADP has a built-in temperature sensor that automatically compensates for this effect. Magnetic Declination – On the earth's surface, a calibrated compass indicates magnetic North rather than geographic North. The angular difference between these two directions is called magnetic declination (also known as variation, magnetic variation, or compass variation). Magnetic declination varies across the earth's surface and over time. The ADP compass is shipped pre-calibrated; however, calibration is required at each site to remove any magnetic bias present at the site. Compass calibration will ultimately give better measurement accuracy. The magnetic declination angle (θ) can be found on maps, like the one presented in Figure 62. Magnetic declination maps can be found on may sites on the internet. Screening Distance – This is the distance below the face of the ADP that you want to start collecting data. In essence, this setting allows you to program the ADP to start collecting data below a certain point. This is primarily used for over-the-boat applications where the screening distance can be set to avoid flow disturbance from the wake of the boat. Figure 62. Magnetic declination map of the world 52 RiverSurveyor S5/M9 System Manual (February 2010) SonTek/YSI 7.6.3. Track and Depth Reference (3) The Track and Depth Reference menu (Figure 63) displays options for the track reference, depth reference, and coordinate system. Use the up/down keys to move between fields. To change an option in a field use the left/right keys. Select DONE (at bottom) to update the settings and return to the Main Menu. Figure 63. Track and Depth Reference menu Track Reference – The ADP measures a water velocity using the Doppler shift principle, using multiple acoustic pulses transmitted and received throughout the water column. When the ADP is in motion, the water velocity actually measured by the ADP is a combination of boat velocity and water velocity, In order to determine true water velocity the boat speed must be known and then subtracted from the actual water velocity measurement. The RiverSurveyor “moving boat“ discharge application uses three methods (references) to determine boat velocity. 1. Bottom-tracking reference velocity: The ADP itself is capable of determining boat speed using a technique called “bottom-tracking”. In this case, bottom-track velocity is calculated using the Doppler shift received from multiple acoustic pulses (transmitted from the ADP) that have reflected off of the riverbed. If the riverbed is stationary (i.e. non-moving bottom), then the Doppler shift velocity will consist entirely of boat speed velocity which is acceptable for discharge calculations. If the riverbed is in motion the Doppler-shift-based velocity will consist of both boat speed and riverbed speed which will bias discharge calculations. In this case, the following two references would be preferred to determine boat velocity. 2. GGA GPS-referenced velocity: GPGGA (GGA) refers to a specific NMEA-0183 protocol for outputting GPS position data. In this case, the GGA “string” contains actual position (latitude/longitude) information along with several other GPS quality parameters. Boat velocity is calculated by measuring the distance between two successive GGA positions divided by the travel time between those two positions. Differential corrections are required for the GGA data to reduce the amount of position error associated with each measurement. The RiverSurveyor uses two types of differential corrections: “Sub-meter” differential and “Real-Time Kinematic” (RTK). 3. VTG GPS-referenced velocity: GPVTG (VTG) refers to a specific NMEA-0183 protocol for outputting GPS velocity data. In this case, the VTG string contains the actual boat speed information along with several other GPS parameters. The GPS velocity is calculated based on the Doppler shift of the received satellite signals. RiverSurveyor S5/M9 System Manual (February 2010) 53 SonTek/YSI Select the default track reference for the measurement. All available track references will be available for analysis or to recalculate discharge in post-processing. There are four options: • Bottom-Track: The ADP uses the bottom-track feature to measure the velocity of a vessel relative to the river bottom. The vessel velocity is then subtracted from the measured water velocity to give the absolute water current profile independent of vessel motion. This is the only track reference available for systems without an optional GPS. • GPGGA: The ADP uses the GGA string (from the GPS data) to measure velocity of a vessel based on GPS position data. This is only available for systems configured with a GPS option. It is recommended that GGA data use a sub-meter differential or RTK correction for discharge calculations. The highest quality and most accurate method applies RTK-corrected data. • GPVTG: The ADP uses the VTG string (from the GPS data) to measure the velocity of a vessel based on GPS velocity data. This method requires additional review of data quality parameters to verity data quality. • System: The ADP references all velocities only to itself. This should only be used in specialized applications by experienced users. It is not recommended for discharge measurements from a moving vessel. Depth Reference – Select the default depth reference for the measurement. Both options are available for analysis or to recalculate discharge in post-processing. There are two options: • Vertical Beam: This is highly accurate echo sounder data used to determine water depth. • Bottom-Track: This uses data from the four angled beams to determine the depth of the water column using the average depth from each beam. Coordinate System - Select the default coordinate system for the measurement. All options are available for analysis or to recalculate discharge in post-processing. There are three options: 54 • ENU: This is the traditional East, North, and Up coordinate system. • System: This uses the ADP as a reference. Used for internal testing only. • XYZ: This is a three-dimensional “relative position” coordinate system used only for specialized applications by experienced users. RiverSurveyor S5/M9 System Manual (February 2010) SonTek/YSI 7.6.4. Compass Calibration (4) A compass calibration is necessary prior to each discharge measurement to compensate for magnetic fields specific to the site. When ready to perform the calibration, click START. Rotate the ADP through two complete circles while varying pitch and roll angles as much as possible. It is important to calibrate the compass on the boat or mount and as close to the measurement location as possible. Be sure to remove any mobile phones, PDAs or other metal objects from the area prior to calibration. Figure 64 shows the Compass Calibration menu. Figure 64. Compass Calibration menu At the end of calibration process, select DONE, and a calibration score will be displayed as shown in Figure 65, and will be saved to the SD memory card. Using the example below, the calibration score is M6.20Q7. The M “value” should always be less than 10 and the Q “value” should always be very high (based on a scale from 1-10). If the result is anything other than “Pass” the process should be repeated. Figure 65. Calibration score In the case that the SD memory card is not installed in the Mobile device, you will be notified. The calibration can still be run, but will not be saved. RiverSurveyor S5/M9 System Manual (February 2010) 55 SonTek/YSI 7.6.5. Download Recorder (5) This menu displays the staus of the recorder or memory of the ADP. The Download Recorder menu (Figure 66) shows the recorder’s Total Space, Free Space, remaining capacity (as a percentage), and recorded file names and sizes. The file names use a four-digit year, two-digit month, day, hour, minute, and second format (YYYYMMDDHHMMSS). All RiverSurveyor Live files have an .riv extension. Within this menu, additional options are available through the MENU soft key. This submenu has the following options. • Download All Files: Downloads all data files into the SD storage card on the Mobile device (if no card, an error is displayed). A folder on the Mobile device is created named SonTek Data. Gauging data is saved in a subfolder name based on the date/time recorded. • Download New Files: Downloads all files which are not already on the storage card. • Download Selected Files: Downloads individually selected files to the SD storage card. • Format Recorder: Erases all data files on the ADP/system recorder. Transferring files from the Mobile device to PC is easy: Simply insert the SD card from the Mobile device into the PC, and access the files as you would a USB drive. Alternatively, connect the Mobile device to the computer via a USB cable to transfer files using Windows Explorer. Figure 66. Download Recorder menu Make sure that there is adequate memory available on the recorder prior to making a discharge measurement. It is suggested to download files and format the recorder between measurement sites. At the very least, all files should be downloaded and the recorder formatted at the end of the day. Important: To complete any post processing on the recorded data, the file(s) must be downloaded from the ADP and opened in the RiverSurveyor Live for Pc software. 56 RiverSurveyor S5/M9 System Manual (February 2010) SonTek/YSI 7.6.6. Measurement Summary (6) The Measurement Summary displays a running list of the discharge measurements you have made, sorted by date/time (Figure 67). The Measurement Summary helps you evaluate data collected in the field. Using the Menu or numeric keys allows for various views of the available data fields. A checkmark next to a measurement indicates that the measurement is used in the statistics provided at the bottom of the window. A red “x” indicates the measurement is excluded from the statistics. Simply use the arrow keys to scroll through the measurements, and the Enter key to select or deselect measurements for the statistics. Figure 67. Discharge Measurement Summary Using the Menu Key, you can display 12 different data fields using 4 different view options. Alternatively, you can press the number keys 1,2,3 or 4 to change views (Figure 68). Figure 68. Menu options in the Measurement Summary Important Note: Turning off the Mobile device will clear all records from the Measurement Summary on the Mobile device. The full Discharge Measurement Summary is still stored on the ADP system’s internal recorder, however, and can be viewed when the data files are downloaded from the recorder. Also, the DeleteAll option deletes all Measurement Summary records from the Mobile device. RiverSurveyor S5/M9 System Manual (February 2010) 57 SonTek/YSI 7.6.7. Utilities (7) The Utilities Menu (Figure 69) provides several options explained below. The System Test (option 3) is recommended prior to data collection. Select DONE to exit the Utilities Menu. Figure 69. Utilities menu System Information (Figure 70): Shows system type, serial number and firmware version. Figure 70. Utilities – System Information 58 RiverSurveyor S5/M9 System Manual (February 2010) SonTek/YSI Discharge Measurement Settings (Figure 71): Information that is applied to the discharge measurement. • Start Edge – Sets the default starting edge for discharge measurements (right or left bank). • Rated Discharge – Enter a rated discharge pre- or post-measurement. This information is useful for post-processing data analysis and evaluation. • Measurement Quality – A post-processing qualitative input to evaluate the discharge measurement quality. Figure 71. Utilities – Discharge Measurement Settings System Test (Figure 72): Runs a diagnostic test confirming the status of the battery, temperature sensor, internal 8-GB recorder, and compass. When finished, the system reports the test results and saves them to a file in the SonTek Data folder of the SD card of the Mobile device. You will be notified of either a System Test PASS or FAIL result. Figure 72. Utilities – System Test There are four possible System Test failure messages (provided below), all of which require user action prior to making valid discharge measurements. • System battery voltage , 12 volts • System compass is not working • System SD card is not working • Temperature sensor is not working Set System Time (Figure 73): Used to set system time to the Mobile device time or to a manual entry. Typically, this is a pre-processing setting that can be used as a default for all measureRiverSurveyor S5/M9 System Manual (February 2010) 59 SonTek/YSI ments. Use the up/down keys to navigate between fields and the number keys to enter data. Select SET TIME to update the system time and DONE to return to the Utilities Menu. Figure 73. Utilities – Set System Time SonTek GPS Option: Confirms the current SonTek GPS application and provides the option to change to a different application (Figure 74). For RTK GPS applications, you can change from RTK quality GPS to Differential quality GPS and vice versa. However, systems with only Differential quality GPS cannot change to RTK quality GPS based on hardware constraints. There is no capability of integrating a shore-station differential GPS correction. Figure 74. Utilities - SonTek GPS Option Firmware Upgrade (Figure 75): This menu lets you update ADP firmware by selecting a firmware file (*.a79) stored in the phone’s memory card (SD) or internal memory. Select UPGRADE and follow the on-screen instructions to install new firmware. 60 RiverSurveyor S5/M9 System Manual (February 2010) SonTek/YSI Figure 75. Utilities – Firmware Upgrade Figure 76 shows the Find File screen that displays a menu for finding the firmware upgrade file. If a file is not selected, an error message is displayed. You can navigate with the up/down keys and select with the enter key. Additional options are available via the MENU option. Select Open to upload the firmware file. Figure 76. Utilities – Firmware Upgrade Find File Screen Application Settings (Figure 77): Activating the check-box for Bluetooth: Connect Automatically enables the software to connect to the first system detected. This menu is also used to apply either Metric or English units. Typically, these options are applied as default settings. Select DONE to update these settings and return to the Utilities Menu. In the bottom right of the window, the version of the software is indicated. RiverSurveyor S5/M9 System Manual (February 2010) 61 SonTek/YSI Figure 77. Utilities - Application Settings 62 RiverSurveyor S5/M9 System Manual (February 2010) SonTek/YSI 7.7. Discharge Measurement - Data Collection Below is a detailed procedure for conducting a discharge measurement. In general the process has five steps which include the following: 1. Start a Measurement 2. Start Edge 3. Start Moving/Transect 4. End Edge 5. End Transect Once a measurement is started, the software prompts you at each step, allowing you to focus on the measurement. 7.7.1. Starting the measurement To start data collection using the moving boat method, select START from the Main Menu view (Figure 78). The system starts “pinging” and collecting data profiles. Figure 78. Main Menu – Start Data Collection Appendix A provides a description and list of icons used on the software’s status bar. Note that icons are color coded – typically moving from the color blue (indicating optimal status) to red (indicating nonfunctional). Gray indicates the option is not installed. 7.7.2. Start Edge By pressing the soft key corresponding to Start Edge (Figure 79) you are prompted to enter Starting Edge (Left or Right bank), Method (slope bank, vertical bank, user input), and Distance (i.e., distance from Starting edge) as displayed in Figure 80. After entering the edge information, select OK to view start-edge samples. In order to collect precise and accurate information, make sure the boat is as motionless as possible RiverSurveyor S5/M9 System Manual (February 2010) 63 SonTek/YSI Figure 79. Data collection - Start Edge Figure 80. Data Collection - Start Edge Inputs Figure 81 shows the RiverSurveyor collecting data after entering START EDGE inputs. Collect at least 10 profiles/samples edge and select START MOVING to go to the next step. At this point, it is important to make sure the system is running and collecting samples. It is also important to confirm the status icons are valid (see Appendix A). Figure 81. Data screen after Start Edge 64 RiverSurveyor S5/M9 System Manual (February 2010) SonTek/YSI 7.7.3. Start Moving Before moving the vessel across the transect, press Start Moving. Now start moving the system smoothly and slowly across the channel. Figure 82 displays the Start Moving screen. Figure 82. Data collection - Start Moving This window shows the data as its being collected across the channel. Additional views are available to display the other data parameters being collected. Press the Menu key to select the data display to view. The number keys 1, 2, 3 or 4 can also be used to change the views, as shown in Figure 83. Figure 83. Data Collection – Start Moving data view 7.7.4. End Edge After arriving at the opposite bank, select END EDGE (Figure 84). You are then prompted (Figure 85) to enter Method (Vertical Bank, Sloped Bank, User Input) and Distance (i.e., distance from ending edge). If you set Method to User Input, use the User Flow field to enter an estimate of flow for this area starting from the ending edge. Select OK to go to the END TRANSECT menu. Be sure the vessel stays as motionless as possible to collect the best edge data. Collect at least 10 samples/profiles before going to the End Transect step. RiverSurveyor S5/M9 System Manual (February 2010) 65 SonTek/YSI Figure 84. Data collection - End Edge Figure 85. Data collection - End Edge information 7.7.5. End Transect Figure 86 shows the End Transect screen. Press the End Transect button to complete the measurement. Figure 86. End Transect screen 66 RiverSurveyor S5/M9 System Manual (February 2010) SonTek/YSI After the transect ends, the Measurement Summary screen appears (Figure 87). It shows data from each transect as well as statistical calculations. Arrow keys allow movement from cell to cell. Using the Select key in the left column includes/excludes transects, which changes the statistics. This lets you discard invalid transects, making the final discharge calculation available in the field. Figure 87. Discharge Measurement Summary screen Select CONTINUE to make another measurement, or MENU and DONE to go to Main Menu. At any step in the moving boat process, you select MENU and then ABORT to cancel the measurement and go back to main menu. Also at any step, you can select MENU and then DISCONNECT to disconnect the Mobile device from the system, but leave the system still running. You can reconnect to the ADP with the same or different Mobile device, or with a PC, all while the system continues to collect data without losing any information. Figure 88 displays the Abort and Disconnect options. Figure 88. Data Collection - Abort and Disconnect options 7.7.6. Data collection - Swapping between Mobile Device and PC The RiverSurveyor Live software allows you to swap between measurement devices (Mobile device and PC) while the system is collecting data. Data collected by the RiverSurveyor system (ADP) is stored inside the ADP, so there is no risk of losing data when swapping between devices. More importantly, the data will not be lost if communications to the ADP is interrupted for any reason. RiverSurveyor S5/M9 System Manual (February 2010) 67 SonTek/YSI To swap from the Mobile device to a PC, disconnect from the system during data collection. This is done by pressing the Menu button and then Disconnect as displayed in Figure 88. Simply connect to the system with a PC or other Mobile device to continue with the measurement. 7.7.7. Transferring Data from Mobile Device to PC Transferring data files from the Mobile device to the PC is done by simply connecting the Mobile device to the PC via a USB cable. Make sure that ActiveSync is installed on the PC so the Mobile device and PC can communicate. After the Mobile device is powered on and connected to the PC, ActiveSync will recognize the Mobile device and display it as a Mobile device on the PC in Windows Explorer. You can then go to the appropriate folder that contains the collected data (data files have a .riv extension) and download (Save, Copy and Paste, or Cut and Paste) the files to the desired folder on the PC. The PC folder is where you will access the data for viewing, post-processing, and analysis using the RiverSurveyor Live for PC software. Figure 89 shows the Main Menu window for RiverSurveyor Live for PC. In the section titled Data Files (highlighted in red), files can be selected manually, or they can be opened using hot links to the most recently used files. Figure 89. Main menu for RiverSurveyor Live for PC 68 RiverSurveyor S5/M9 System Manual (February 2010) SonTek/YSI Section 8. Reviewing Data Files/Post-Processing 8.1. Overview This section is to be used as a guide to open, view and post-process data files using the RiverSurveyor Live for PC software. An initial explanation will describe the layout of the data and the various tabular views. A detailed description of the post-processing options will follow. 8.2. Opening Data Files To open and process data in RiverSurveyor Live for PC, all data files must have the .riv extension. Figure 90 shows three ways to open data files. Click the open file icon (the folder) on the top toolbar to browse for and select a file. Alternatively, you can click on the Open file (Crtl+O) link or one of the most recently viewed files. Figure 90. Open data files in RiverSurveyor Live for PC RiverSurveyor S5/M9 System Manual (February 2010) 69 SonTek/YSI 8.3. Application Layout The application layout is divided into seven sections, shown below in Figure 91. Figure 91. Application Layout for PC software 8.3.1. Main Toolbar Icons The Main Toolbar at the top of the screen provides quick links to open files, connect to an ADP and change the program views and settings. Below is an explanation of each: Open File (Crtl + O) – Opens a window to select files for viewing and post-processing. Connect (Crtl + N) – Allows the selection of communications types with the RiverSurveyor: for a direct connect option or a SS radio connection select a Com Port, while Bluetooth users should click on the tick-box at the bottom of the window. Show/Hide Processing Toolbox (Crtl + T) – Toggle button shows or hides the Processing Toolbox for post-processing analysis. Show/Hide Discharge Summary (Crtl + S) – Toggle button shows or hides the Discharge Summary for post-processing analysis. Load GIS Shape File – Opens a window presents options to look for and load presaved geo referenced Shape File that can be used as a background for the data collected. This is a useful visualization tool for user in post-processing. Change Program Settings – Opens a pop-up window which presents default program settings--English or Metric Units for example. View Documentation – Presents help documents. 70 RiverSurveyor S5/M9 System Manual (February 2010) SonTek/YSI 8.3.2. Data file Tabs ) ( Figure 91 highlights the location of the Data file tabs. Each tab is an open file with the year, month, day, hour, minute, second format (i.e. YYYYMMDDHHMMSS). The tabs are used to toggle between open data files. Multiple files can be opened simultaneously. Users can swap between tabs by clicking or using Crtl+Tab or Crtl+Shift+Tab. To close tabs, click the X or use the Crtl+F4 hot key. 8.3.3. Sidebar The Sidebar displays the status icons as well as customizable tabular data and a profile graph for the current sample. Status icons are explained in Appendix 1. Right-click on the tabular data to select the display options shown in Figure 92. In addition to the various data display options, there is an “Add all” option to include all data fields or a “Reset to default” option to apply the standard view. Figure 92. Sidebar tabular data with right clicking menu options. The graph portion of the Sidebar displays the vertical profile through the water column. Doubleclick on the axes to change the scale. Right-click on the graph to display a pop-up menu that allows for further customization of the graph. Below is an example for viewing the velocity profile. After right clicking on the graph, select WaterTrack and then Velocity. This will display each velocity component along with the Standard Deviation as a shaded band around each line (Figure 93). RiverSurveyor S5/M9 System Manual (February 2010) 71 SonTek/YSI Figure 93. Profile View – WaterTrack Another useful plot for the profile graph is to select Summary and then Discharge. This will present a graph that plots the profile extrapolation with the area under the graph being the incremental discharge for the sample/profile. 8.3.4. Tab Windows selection There are five views or data tabs in the software. Each tab presents a specific view of the data explained below. 8.3.5. Tab Window display The Tab Window (Figure 94) shows different views of the data as different tabs are selected. When a tab is selected, it becomes the active tab for all data files which are open in the program. The PageUp and PageDown keys can be used to toggle between the tabs. Below is an explanation of each Tab Window. Figure 94. Tab Window display 72 RiverSurveyor S5/M9 System Manual (February 2010) SonTek/YSI System Tab Figure 95 shows the System tab view of a data file in RiverSurveyor Live for PC. To alternate between the views, select the tabs at the bottom of the window to view and analyze the data. Figure 95. System Tab The information on the Systems tab shows the following user inputs and settings. • Measurement Type shows the method used to collect the data. Moving Boat is the only option available at this time. Other measurement types will be available in future releases. • Site Information shows a summary of Site Information entered before data collection. • System Configuration shows the System Configuration used during data collection. • System Settings shows a summary of the System Settings. Information in this block can be modified for post-processing by clicking Change System Settings. • Discharge Measurement shows a summary of Measurement Settings. This information can be modified for post-processing by clicking on Change Measurement Settings. • Edge Estimates shows a summary of information entered during the measurement. • Profile Extrapolation shows a summary of how the profile data was extrapolated for velocity profiles and discharge measurement. Important: You can modify the presentation of graphic and tabular data displays by right clicking and selecting from the options in the context menu. Samples Tab The Samples tab (Figure 96) displays tabular data for all samples collected along with a contour and profile graph. The left side shows status icons for each sample. The main window shows tabular transect data. You can scroll through the data using the up/down keys or predefined Hotkeys/Accelerators (Section 8.4) for viewing and post-processing. The graphics at the bottom show vertical profile data and complete transect data. You can toggle through the vertical profile data using the up/down keys to browse the samples and use the left/right arrow keys to start at the left/right bank respectively. RiverSurveyor S5/M9 System Manual (February 2010) 73 SonTek/YSI Figure 96. Samples Tab Navigation Tab The Navigation tab (Figure 97) has three sections – incremental profile data (left), navigational graphics (main area) and transect view (bottom). The navigational graphics show system trajectory or navigation during the measurement. You can also view collected data superimposed over your own background graphic. Figure 97 Data view – Navigation Tab 74 RiverSurveyor S5/M9 System Manual (February 2010) SonTek/YSI Edges Tab The Edges tab (Figure 98) provides a detailed tool for evaluating data collected on the start/end edges of a discharge measurement. The Edges tab has three sections – incremental profile data (left), navigation data for both edges (main) and transect data for both edges (bottom). Figure 98. Data view – Edges Tab Incremental Profile Data – Presents the incremental profile data collected in the field. The up/down keys page through the data one sample at a time. The left arrow key goes to the first profile of the starting edge; the right arrow key goes to the last profile of the ending edge. The information presented in this section allows evaluation of the data from each sample. Status icons help to determine system performance. Navigation Graphics – Present a view of the trajectory of the system during a measurement. The left arrow key goes to the first profile of the starting edge; the right arrow key goes to the last profile of the starting edge. The up/down keys cycle through the data. Edge Graphics – Presents a view for evaluating starting and ending edges. The left arrow key goes to the first profile of the starting edge; the right arrow key goes to the last profile of the starting edge. The up/down arrow keys cycle through the data. Transect Tab The Transect tab (Figure 99) has three sections – incremental profile data (left), user-selected graphics (main area) and transect view (bottom). As an example, the top graph in Figure 99 shows the depth-to-bottom information taken from the vertical beam data (blue) and the transducer data (green). RiverSurveyor S5/M9 System Manual (February 2010) 75 SonTek/YSI Figure 99. Data view -Transect tab Graphs can be modified by right-clicking on the left or right vertical axis and selecting from the options provided. The middle graph displays the path of the boat with the velocity vectors. The velocity vectors at a good site should be roughly perpendicular to the path of the boat. The bottom graph shows the measured transect with the vertical profile data included. Rightclicking allows various plotting options, while left-clicking provides scaling options. In this window, using the up/down keys allows you to cycle through the data, profile by profile, changing all the graphs simultaneously. This displays the same data from different perspectives along the transect. 8.3.6. Discharge measurement summary By clicking the Discharge Summary icon, you can show or hide the Discharge Summary window at the bottom of the desktop. This window presents the collected data in tabular format and includes the status icons to evaluate the measurement (Figure 100). If desired, resize the window by using the slider arrow when the mouse pointer is positioned over the window border. 76 RiverSurveyor S5/M9 System Manual (February 2010) SonTek/YSI Figure 100. Discharge Measurement Summary All records are ordered by date/time with icons for starting edge, depth and track reference and coordinate system. All records can be selected or deselected by clicking with the mouse; this affects the statistics presented and is a quick and easy to understand what effect each measurement has on the overall average of the measurements for the site. Additionally, you can select data to include or exclude from the discharge calculation by simply clicking to activate or deactivate the check box. The Discharge Summary has the following options that can be used in post processing: Discharge Summary Report: Generates a printer friendly report that summarizes all data used in the discharge calculation as well as the associated statistics (unchecked records are not displayed). Export Discharge Summary to ASCII: Exports the information found in the discharge summary to an ASCII file (.txt). Delete selected discharge record(s): Deletes the selected records (the ones with the red check). These records will not be used for the discharge calculation. Delete all discharge records: Deletes all records present, essentially removing all transects for discharge calculation Links between open files and records on the discharge summary are as follows: • An open file will update its corresponding discharge record with changes to settings or as sample number changes. • Closing a file leaves the record displayed in the discharge measurement summary, but the record will no longer update • Deleting the record severs the link to the data file. To add the record back, the file must be reopened. • Click on a record to switch to the matching data file. • Delete or uncheck a record to recomputed statistics. 8.3.7. Processing toolbox The Processing Toolbox (Figure 101) gives you access to tools to post-process the discharge data. The Processing Toolbox has the following options in its dropdown menu: System Settings, Edge Estimates, Profile extrapolation and Thresholds. Each is described in detail below. The two icons in the top right corner are always present in the Processing Toolbox. The Reset icon allows you to reset all modified values back to those entered in the field. Since any changes to the settings have an impact on the discharge calculation, this option is important for users to have the option of post-processing, but the luxury of not losing the initial field settings. The MatLab icon exports data from RiverSurveyor Live to a MatLab friendly format explained in Appendix C. The velocities, track and summary data are exported in the reference and coordinate system that are set at the time of export. RiverSurveyor S5/M9 System Manual (February 2010) 77 SonTek/YSI To export the raw ADP data, and therefore complete all the velocity coordinate transformations, track referencing and processing manually in Matlab, you will need to follow this procedure: 1. 2. 3. 4. 5. 6. Open the data file you need to export Open the Processing Toolbox Select the System Settings page Set the Track/Velocity Reference to “System” Set the Coordinate System to “Beam” Press the Export to Matlab button Processing Toolbox Discharge Summary Figure 101. Discharge measurement summary and Processing toolbox Processing Toolbox dropdown menu System Settings – Allows post-processing of the data collected in the field. Figure 102 displays the options available. Transducer depth, Screening Distance Salinity, and Magnetic Declination require a manual entry. The Track/Velocity Reference, Depth Reference, and Coordinate System icons allows the user to see the prior setting and change that setting by simply clicking on the icon. Click the “Apply” button to make the changes to a single data file. Use the “Apply to all” button to apply the post-processing changes to all of the data files that are open. Be sure all of the open files have identical settings before using the “Apply to all” button. The previous settings cannot be retrieved. 78 RiverSurveyor S5/M9 System Manual (February 2010) SonTek/YSI Figure 102. System Settings - Processing Toolbox Edge Estimates (Figure 103) – Allows the modification of Left/Right Bank settings in order to better define the characteristics regarding channel width and the slope of the edges. These settings have an important impact on the discharge calculation. Left/Right Method are selected from a dropdown box. Left/Right Distance and Estimated Flow are manual entry fields. Figure 103. Edge Estimates - Processing Toolbox RiverSurveyor S5/M9 System Manual (February 2010) 79 SonTek/YSI Profile Extrapolation (Figure 104) – Allows you to change the way the top/bottom estimates are calculated. In general, the default settings are adequate for most applications. The Method, Cells to Use, and % of Profile fields have dropdown menus. The Coefficient, Discard Last, and Cell(s) fields are manual entries. Figure 104. Profile Extrapolations - Processing Toolbox Thresholds (Figure 105) – Shows an option to set the minimum beam SNR threshold used for water velocity calculations (default = 1.0 dB). This value corresponds to the minimum SNR value needed to make a water velocity measurement. In clear water the SNR values are lower, and an adjustment can be made to the threshold to compensate for low sediment load. Important: No changes will be made to the calculated discharge or associated data until Apply or Apply to All has been clicked. Apply only applies the post-processing options to the open/active tab; Apply to All applies the post-processing changes to all the active tabs. Figure 105. Thresholds - Processing Toolbox 80 RiverSurveyor S5/M9 System Manual (February 2010) SonTek/YSI 8.4. Hot Keys/Accelerators Table 3 presents a list of Hotkeys/Accelerators which can be used via the keyboard, often in place of a mouse click. These Hot Keys are useful in many processes including data collection, data processing, managing data files and viewing data. It is also important to remember for graphic and tabular display, a right-click presents data viewing options. Table 3. Summary of Hotkeys/Accelerators for RiverSurveyor Live for PC Hot Keys F5 F8 Crtl+N Crtl+O Crtl+T Crtl+S Crtl+R Crtl+Tab Crtl+Shift+Tab PageUp PageDown Crtl+F4 Crtl++ Crtl-Z Shift+Z Left Arrow Right Arrow Up Arrow Down Arrow Crtl+Up Arrow Crtl+Down Arrow Crtl+Shift+Up Arrow Crtl+Shift+Down Arrow 8.5. Description/Function Go to Next Step Abort Connect to RiverSurveyor System Open a data file Show/Hide Processing Toolbox Show/Hide Discharge Measurement Summary Show Discharge Summary Report Next File/Connection Tab (top of screen) Previous File/Connection Tab (top of screen) Next Display Tab (bottom of screen) Previous Display Tab (bottom of screen) Close Current Tab Increase Vector Length Decrease Vector Length Zoom in) Zoom out First Sample Last Sample Previous Sample Next Sample Back 20 Samples Forward 20 Samples Back 100 Samples Forward 100 Samples Location/Process Data Collection Data Collection Start Data Collection Data Processing Data Processing Data Processing Data Processing Data Processing Data Processing Data Processing Data Processing Data Processing Track Window Track Window Track Window Track Window Data Files Data Files Data Files Data Files Data Files Data Files Data Files Data Files Processing Data Files – Step by Step This section is a guide for analyzing and post-processing data files collected in the field. 1. Open all files from a measurement site (the same measurement site with the same flow conditions). o Review the System settings. Be sure that the settings are consistent amongst files. To do this go to the Systems tab and cycle through each file (Click on each tab individually or use Ctrl+Tab). o If necessary, change the Track and Depth reference to best represent the best field measurement (in Processing Toolbox – System Settings). o Select the Navigation tab to evaluate the collected data across the transect. Deactivate the UTM Display and activate the AutoScale option: available by right clicking. o Use the Sidebar tabular data to evaluate specific settings (i.e. Duration of the measurement, GPS Quality). • Visually review each measurement by clicking on each tab or by using Crtl+Tab RiverSurveyor S5/M9 System Manual (February 2010) 81 SonTek/YSI • Evaluate BottomTrack vs. GPS (if applicable) to observe any compass, GPS or moving bed issues. • Make sure the magnetic declination is set appropriately for the site (the default setting is zero). • Make sure that the GC-BC (angle of average GPS course since start of transect minus ADP bottom-track course; value near 0 is desired) is less than 2 degrees and the D(BT)/D(GPS) (Ratio of Bottom Track track distance to GPS track distance) is approximately 1 (Sidebar data). • Be sure the number of GPS satellites is good and the GPS quality is valid 2. On the Transect tab, evaluate different plots by right-clicking on the vertical axes. o Plot the depth measured by the Vertical Beam as well as Bottom Track depth. Make sure the VB and BT depth scales are the same. Check for any major discrepancies. o Evaluate Boat Speed and Water speed plotted on the same graph. Ideally, the Boat speed should not exceed the water speed where possible. o Make sure that Heading/Pitch/Roll and Temperature are relatively constant. o Verify that the SNR data and beams are valid with special focus on the edges and shallow water. o Verify water velocity in ENU: U (up) and D (Delta) should be close to zero. o Make sure that discharge curve and profile extrapolation is applicable (using Processing Toolbox – Profile Extrapolation). o Verify that the SNRs are valid for the contour (graph at the bottom). o Verify that the velocity cell cutoff on the contour plot is valid, also look at the screening distance and make sure that is graphically correct. 3. In the Discharge Measurement Summary make sure that: 82 o References and Coordinates should be the same o Starting edges should alternate o Date/times should be consecutive o Duration of measurements should be similar o Use the Statistics to identify any outliers o Channel width and discharge areas should be similar o Uncheck or delete problematic records RiverSurveyor S5/M9 System Manual (February 2010) SonTek/YSI Appendix A. Description of RiverSurveyor Live Icons Bluetooth is a wireless short-range communications technology allowing data transmission over short distances from fixed and mobile devices. When users apply this method of communication between their PC or Mobile device and the ADP, a blue icon indicates that Bluetooth is active, while a red icon represents inactive (icons below). Bluetooth signal strength is indicated with a green icon square, a full square indicates a strong Bluetooth signal, while squares not completely filled indicates proportional signal strength. BT Active BT Inactive Bottom Track is used to remove vessel motion from measured water velocity to determine the “true” water velocity, track distance and depth. That is, when you mount the ADP to a vessel, bottom-track measures the velocity and direction of the ADP/vessel movement over ground. There are four icons (below) for bottom track quality: blue corresponding to depth and track data (optimal); yellow means bottom track only depth is valid (functional); red indicates that bottom track does not have a lock; and the grey icon indicates that the feature is not available. RTK GPS is the essential GGA GPS fix data which provides 3-D location and accuracy data for the system. This data string includes: Latitude, Longitude, Fix quality, Number of satellites used, Altitude as well as many other types of information. There are five icons for RTK GPS, as seen below, ranging from RTK (Real-time kinematic--blue) to the Inactive (gray). • • • RTK Quality GPS provides 0.03 m accuracy Differential Quality GPS provides sub 1-meter accuracy GGA Uncorrected provides greater that 1-m accuracy RiverSurveyor S5/M9 System Manual (February 2010) 83 SonTek/YSI VTG is the GPS vector track and speed over ground data string for the system. The VTG (Vector track and speed over ground) data string presents Track and ground speed information (boat speed over the water) as well as other information. There are four icons (below) for VTG ranging from Measured Velocity (blue) to Inactive (grey). *Acceptable for discharge measurements but additional GPS parameters should be monitored for guidance. See Appendix D—Troubleshooting for additional guidance on using VTG data. Depth Reference refers to the method used to measure depth. The RiverSurveyor presents two options for Depth Reference: Vertical Beam (using the echo sounder) and Bottom Track (using the velocity transducers). The indicator for no depth lock is the red icon, meaning that water depth cannot be determined. The grey icon below indicates the depth reference is not available. System Connection indicates that the system is connected and communicating with external sources (PC or Mobile device). System Connected System Battery is monitored using the status icons indicated below. Typically, a fully charged battery pack has about 5 hours of use. The icons below indicate battery status ranging from 10 to 100%. Users are advised to change the system battery immediately after reaching the 10% level in order to prevent loss of data. If applying a direct power source to the ADP the icon below will still be applied and with 17 V applicable to 100% and 12 V corresponding to 10%. 84 RiverSurveyor S5/M9 System Manual (February 2010) SonTek/YSI Data Collection is verified using the two icons below. Blue rotating arrows indicate that the system is actively collecting data. The red clock-like icon indicates that the system is not collecting data and a detailed review of system and application settings should be completed in order to identify any possible problems. • Collecting Data – During data collection the blue arrows (above) will move in a circular motion, indicating that data collection is active. • No Data Reception – The red icon (above) indicates loss of communications. Re-check communications connections and the range of the system. RiverSurveyor Live for PC Menu Bar is used for the initial setup and startup. Icon utilities are self explanatory; however a brief description is included below: Open File (Crtl + O) – Opens a window that allows users to select files to open and evaluate using post-processing tools. Connect (Crtl + N) – Allows the selection of communications types with the RiverSurveyor: for a direct connect option or a SS radio connection select a Com Port, while Bluetooth users should click on the tick-box at the bottom of the window. Show/Hide Processing Toolbox (Crtl + N) – Toggle button shows or hides the Processing Toolbox for post-processing analysis. Show/Hide Discharge Summary (Crtl + S) – Toggle button shows or hides the Discharge Summary for post-processing analysis. Load GIS Shape File – Opens a window with options to look for and load pre-saved geo referenced Shape File that can be used as a background for the data collected. This is a useful visualization tool for user in post-processing. Change Program Settings – Opens a pop-up window which presents default program settings--English or Metric Units for example. View Documentation – Presents help documents. RiverSurveyor S5/M9 System Manual (February 2010) 85 SonTek/YSI Discharge Summary Menu Bar (Desktop version) presents four icons that allows various post processing options and are described below: Discharge Summary Report – Opens a printer-friendly window that presents the collected data in a pre-defined report format. Export Discharge Summary to ASCII – Opens a dialog box that allows a file to be saved in ASCII format. The file has a plain text format for importing the data into another application for further processing. Delete Selected Discharge Record(s) – A post processing option used to delete a record in the Discharge Summary Window. This option will have an effect on the overall discharge measurement summary as the record is deleted from the summary; however the file is still saved in PC or Mobile device memory. Multiple records can be selected and deleted by checking the tick-mark boxes next to the record. Delete All Discharge Records – Using the Delete All Records button deletes all loaded records from the Discharge Summary. Processing Toolbox Icons (Desktop version) Reset to Field Settings – Allows you to reset the values that were used in the field for the discharge calculation. Export to MatLab – Opens a pop-up window used to name and save the file for import into MatLab. Coordinate System Icons (Desktop version) Beam Coordinates – Beam coordinates are relative to the orientation of the transducers on the head of the ADP. Beam coordinates are typically used for diagnostics purposes only. XYZ Coordinates – Applies the standard XYZ coordinates to the data, where: X is the North axis, Y is East axis and Z is the vertical axis. ENU Coordinates – Applies the ENU (East, North, Up) coordinate system to the data. Local ENU coordinates are formed from a plane tangent to the Earth's surface fixed to a specific location. Depth Reference (Desktop Version) Vertical Beam – Applies data from the 0.5 MHz transducer for M9 systems and the 1.0 MHz data from the S5 system to determine water depth for the cross-sectional area. Bottom Track – Applies data from the velocity transducers from the S5 (four 3 MHz transducers) and M9 (four 3 MHz transducers and four 1 MHz transducers) to determine water depth for the cross-sectional area. 86 RiverSurveyor S5/M9 System Manual (February 2010) SonTek/YSI Appendix B. Parameter and Hotkey Descriptions This appendix describes the parameters that can be displayed during data collection using the RiverSurveyor Live for Mobile software. There are a number of views available during data collection. Each may be accessed using a Hotkey or selecting a viewing option from the menu. Typically, six to twelve parameters or settings are displayed at one time. Press one of the hotkeys (1-4) during data collection using the Mobile device to change to a different view. Parameter Process Step Sample Time Duration Voltage Total Q # Cells Track Depth Mean Vel Boat Speed Boat/Water DMG Temperature Heading Pitch Roll Satellites GPS Quality D(BT)/D(GPS) GC-BC GPS Age HDOP Total Q Top Q Middle Q Bottom Q Left Q Right Q Total Q Description Moving Boat (Default) Profiling (default) Number of samples taken (typically 1 per second) Time set by the user Duration of the measurement (HH:MM:SS) Voltage of system battery on RiverSurveyor Total accumulated discharge for the transect Number of cells used in the last vertical profile Shows the accumulated total distance the vessel has traveled through the last completed profile for this data set Depth measured for the last profile processed (m or ft) Mean velocity of last profile in m/s or ft/s Shows speed of vessel over ground for the last profile processed Ratio of boat speed to water speed Distance made good is the distance from your last position to your present position Temperature in °C or °F (system settings Metric or English) for the last profile processed Shows vessel heading based on the Track Display Shows the pitch angle of the ADP for the last profile processed Shows the pitch angle of the ADP for the last profile processed Number of satellites used in location determination (GPS option) Quality indicator based on number of satellites used in track data Ratio of Bottom Track track distance to GPS track distance Shows angle (degrees) of average GPS course since start of transect minus ADP bottom-track course; value near 0 is desired. Age of differential GPS connection in seconds Horizontal dilution of precision Total discharge measure for the cross section in m3/s or ft3/s Shows the total accumulated discharge in the top layer that is estimated by the program Shows the total accumulated discharge in the middle layer that is estimated by the program Shows the total accumulated discharge in the bottom layer that is estimated by the program Shows the total accumulated discharge in the left edge of the survey area that is estimated by the program Shows the total accumulated discharge in the right edge of the survey area that is estimated by the program Shows total discharge estimated and measured for entire crosssection RiverSurveyor S5/M9 System Manual (February 2010) Key/Menu Option 1 1 1 1 1 1 1 1 1 1 1 2 2 2 2 2 2 2 2 2 2 2 2 2 3 3 3 3 3 3 87 SonTek/YSI Transducer Depth Salinity Magnetic Declination Track Reference Depth Reference Coordinate System 88 Distance the vertical beam transducer is submerged into water column User defined parameter that allows for a correction of the speed of sound in water based on the salinity in parts per thousand (ppt) User defined value for difference in magnetic North and true North User defined criteria used in determining navigation information (i.e. Bottom Track and Boat Speed) User defined criteria used in determining water depth (i.e., Vertical Beam or Bottom Track (4 beams)) Navigation coordinate system applied by user (ENU, System, XYZ) 4 4 4 4 4 4 RiverSurveyor S5/M9 System Manual (February 2010) SonTek/YSI Appendix C. Matlab Export The Matlab output is ordered into a series of structures each containing their related parameters and settings. The units for each parameter are generally shown as the suffix on the end of parameter name. e.g. Altitude_m is Altitude in meters (m) Bt_Vel_m_s is the Bottom Track velocity in meters/second (m/s) The basic order of the root structures is as follows: Structure Name Description Bottom Track Bottom Track Velocity and Depth variables (includes Vertical Beam) GPS GPS data and quality information Processing Processing settings RawGPSData The raw GPS data from either the internal GPS or an external serial connected GPS system. This data is stored in its raw format with the same frequency that was output from the GPS. E.g. The GPS outputs data at 10 Hz so 10 GPS data values are stored for each ADP sample Setup Settings, edge information and profile extrapolation Station Station information for Stationary mode data collection (TBD) Summary Calculated discharge variables System Core system related parameters: Compass, Temperature, Time, SNR, Voltage and Profiling TransformaSystem frequencies and transformation matrices tion_Matrices WaterTrack Water velocity and profiling variables in coordinates selected for output Bottom Track structure Parameter Name VB_Depth_m BT_Depth_m Bt_Vel_m_s BT_Beam_Depth_m BT_Frequency GPS structure Parameter Name Longitude_deg Latitude_deg Utc Satellites HDOP GPS_Age Altitude_m GPS_Quality UTM_m Description Vertical Beam depth for each sample Mean Bottom Track depth for each sample Bottom Track Velocity for each beam for each sample Bottom Track depth for each beam for each sample Frequency used for Bottom Track data for each sample (correlate with Frequency parameter from Transformation_Matrices structure) Description Longitude for each sample Latitude for each sample Universal Time Coordinate (UTC) for each sample Number of satellites in view for each sample Horizontal Dilution of Precision for each sample GPS Age for each sample Altitude above sea level for each sample GPS Quality for each sample (4=RTK, 2=Differential, 1 = Standard, 0 = Invalid) Universal Transverse Mercator (UTM) coordinate system- X and Y coordinates for each sample RiverSurveyor S5/M9 System Manual (February 2010) 89 SonTek/YSI Processing structure Parameter Name Screening Description Structure containing filtering settings RawGPSData structure Parameter Name Description VtgTimeStamp $GPVTG time stamp for each high frequency GPS sample VtgTmgTrue $GPVTG true course made good for each high frequency GPS sample (degrees) VtgTmgMag $GPVTG magnetic course made good for each high frequency GPS sample (degrees) VtgSogMPS $GPVTG speed over ground for each high frequency GPS sample (m/s) VtgMode $GPVTG active mode for each high frequency GPS sample GgaTimeStamp $GPGGA time stamp for each high frequency GPS sample GgaLatitude $GPGGA latitude for each high frequency GPS sample GgaLongitude $GPGGA longitude for each high frequency GPS sample GgaQuality $GPGGA fix quality for each high frequency GPS sample (4=RTK, 2=Differential, 1 = Standard, 0 = Invalid) GgaAltitude $GPGGA altitude above sea level for each high frequency GPS sample (m) GgaUTC $GPGGA UTC for each high frequency GPS sample Setup structure Parameter Name startEdge magneticDeclination transectAzimuth coordinateSystem trackReference velocityReference depthReference userSalinity sensorDepth screeningDistance Edges_0__DistanceToBank Edges_0__EstimatedQ Edges_0__Method Edges_1__DistanceToBank Edges_1__EstimatedQ Edges_1__Method RatedDischarge extrapolation_Top_nFitType extrapolation_Top_nEntireProfil extrapolation_Top_dExponent 90 Description Start edge (0 = Left bank; 1 = Right bank) Magnetic Declination (degrees) Transect azimuth (Stationary measurements) Coordinate system (0 = Beam; 1 = XYZ; 2 = ENU) Track reference (0 = System; 1 = Bottom Track; 2 = GPS GGA; 3 = GPS VTG) Velocity reference (0 = System; 1 = Bottom Track; 2 = GPS GGA; 3 = GPS VTG) Depth reference (0 = Vertical beam; 1 = Bottom Track) User input salinity (ppt) Sensor/Transducer depth (m) Vertical screening distance (m) Start Edge: Distance to the bank Start Edge: Estimated discharge Start Edge: Method (0 = User input discharge; 1 = Vertical bank; 2 = Sloped bank) End Edge: Distance to the bank End Edge: Estimated discharge End Edge: Method (0 = User input discharge; 1 = Vertical bank; 2 = Sloped bank) User input rated discharge Profile Extrapolation - Top: Fit equation type (0 = Constant fit; 1 = Power fit) Profile Extrapolation - Top: Fit (0 = Use entire profile; 1 = User selected number of cells) Profile Extrapolation - Top: Power fit exponent RiverSurveyor S5/M9 System Manual (February 2010) SonTek/YSI extrapolation_Top_nCells Profile Extrapolation - Top: Number of cells used in extrapolation extrapolation_Bottom_nFitType Profile Extrapolation - Bottom: Fit equation type (0 = Constant fit; 1 = Power fit) extrapolation_Bottom_nEntirePro Profile Extrapolation - Bottom: Fit (0 = Use entire profile; 1 = User selected number of cells) extrapolation_Bottom_dExponent Profile Extrapolation - Bottom: Power fit exponent extrapolation_Bottom_nCells Profile Extrapolation - Bottom: Number of cells used in extrapolation extrapolation_nDiscardType Method for discarding cells at the bottom of the profile (0 = user selected number of cells; 1 = percentage of profile) extrapolation_nDiscardCells Number of cells discarded extrapolation_dDiscardPercent Percentage of profile discarded MeasurementQuality User input measurement quality Station structure Parameter Name User_Depth_m Vel_Correction Sensor_Depth_m Surface Ice_Thickness_m Surface_to_Ice_m Surface_to_Slush_m Summary structure Parameter Name Top_Q_m3_s Middle_Q_m3_s Bottom_Q_m3_s Left_Q_m3_s Right_Q_m3_s Total_Q_m3_s Depth_m Cells Track_m Boat_Vel_m_s System structure Parameter Name Pitch_deg Roll_deg Heading_deg Temperature_degC Time SNR_dB Sample Voltage_V Description Depth input by the user for each station Velocity correction factor for each station Sensor/transducer depth for each station Surface type for each station (0 = Open Water; 1 = Ice; 2 = Ice and Slush) Ice thickness for each station Distance from the surface to ice for each station Distance from the surface to slush for each station Description Discharge for the top section for each sample Discharge for the middle section for each sample Discharge for the bottom section for each sample Discharge for the left edge for each sample Discharge for the right edge for each sample Total discharge for each sample Depth used for discharge calculation for each sample Number of profile cells used for discharge calculation for each sample Track location for each sample - X and Y coordinates Boat velocity used for discharge calculation for each sample (in velocity coordinates) Description Compass pitch for each sample Compass roll for each sample Compass heading for each sample Temperature for each sample Time for each sample Signal to Noise Ratio (SNR) for each cell for each beam for each sample Sample number for each sample Battery voltage for each sample RiverSurveyor S5/M9 System Manual (February 2010) 91 SonTek/YSI Cell_Start_m Cell_Size_m Step Pings Start of the first cell in the profile for each sample Size of profile cells for each sample Step in data collection process for each sample For Moving Boat Discharge measurement: 2 = Start Edge 3 = In Transect 4 = End Edge Number of pings for each sample Transformation_Matrices structure Parameter Name Description Frequency Frequencies available for the system Matrix Transformation matrices for each frequency WaterTrack structure Parameter Name Velocity_m_s Vel_StdDev_m_s WT_Frequency 92 Description Water Velocity for each cell for each beam for each sample Standard deviation of water velocity for each cell for each beam for each sample Frequency used for Water Track data for each sample (correlate with Frequency parameter from Transformation_Matrices structure) RiverSurveyor S5/M9 System Manual (February 2010) SonTek/YSI Appendix D. Troubleshooting 1. Communications a. PCM (Power and Communications Module) a) Be sure the dummy plug is installed and the locking sleeve is secured b) Be sure the battery pack in the PCM is fully charged c) Bluetooth Radios 1. Bluetooth communications (BT) PCMs are always active and have an internal antenna. Make sure BT communications are active in the Mobile device or the PC. 2. The Bluetooth dongle requires power from a PC USB port d) Spread Spectrum (SS) Radios 1. The SS base radio requires a rechargeable battery pack. Be sure the battery pack is fully charged. b. Software a) If the COM port shows a red light instead of green, then it is being occupied by another program. The most common cause is Microsoft ActiveSync. Disable the program. If the red light doesn’t turn green, restart the computer. 2. Interconnection and cables a. Please be sure to follow assembly instructions to interconnect correctly to maintain secure connections. b. Make sure that all cables are properly connected. The connections between the transducer (S5 or M9) and PCM should be firm. Make certain that the locking sleeves are tightened. 3. Data Collection a. The Status Bar in the RiverSurveyor Live software is a good place to start to diagnose any potential problems. Here is a list of the icons and description as well as a suggested corrective action. a) Bluetooth in the system is not activated. Activate in the Mobile device as indicated above and be sure that antenna is installed properly. b) Bottom track is not functioning. Please check cable connection between the PCM and S5 or M9 ADP. Also check that the transducers are clean and unobstructed. Some environmental conditions (such as bed conditions or grass/weeds) may also result in invalid bottom detection. c) RTK quality GPGGA data (accurate to 3 cm or less). No action required by the user. Important Note: After powering on both systems (Base station and RiverSurveyor) it typically takes approximately 10 minutes to connect to the system to achieve this quality of data. d) Differential quality GPGGA data (sub meter accuracy). It usually takes approximately 5 minutes to connect to this level of quality of data. No action required RiverSurveyor S5/M9 System Manual (February 2010) 93 SonTek/YSI by user unless RTK quality is required. Be sure that the systems (Base Station and RiverSurveyor) have clear sky view antenna and that SS connections are correct. e) Indicates that communications have been established between the system and satellites however there is no sub-meter differential correction. Generally not recommended for discharge calculations. Users should make sure that they have a clear sky view. Need to establish a connection between System and Satellites: 5 minutes for Differential quality data or up to 10 minutes for RTK quality data. f) and/or Connection not valid. Action required: Revise all cable connections and be sure to have a clear sky view for antenna. Be sure that the battery pack is sufficiently charged. g) and/or GPS not available or not installed. If you are using an external, serially connected GPS, make sure that you have the correct baud rate (38400) and the $GPGGA and the $GPVTG serial data strings are being output from your GPS unit. h) GPVTG data (highest quality VTG data—measured velocity data). It typically takes approximately 5 minutes to connect. No action is required as this is the highest level of VTG data available. To maintain this level of data quality, make certain that RiverSurveyor have clear sky view At least 6-7 satellites are required for reliable VTG data. Satellite changes can affect track data and should be monitored during data collection. Similar to differentially-corrected (not RTK) GGA data, VTG data are best suited to streams greater than 20 meters across. The best VTG data are obtained when the vessel motion is constant. Additional transects may be advisable if VTG accuracy is in question during a discharge measurement. i) Indicates that communications have been established between the system and satellites. Velocity is estimated. Generally not recommended for discharge calculations. Users should make sure that they have a clear sky view. j) Mean Bottom Track depth is used for depth calculation. k) Vertical Beam depth is used for depth calculation. l) 94 No depth-lock for either the Bottom Track or Vertical Beam. Some environmental conditions (such as bed conditions or grass/weeds) may also result in invalid depth detection. RiverSurveyor S5/M9 System Manual (February 2010) SonTek/YSI m) Bottom Track not available or not installed. n) Battery level in the system is at 10%. Finish data collection immediately or risk losing data. Communications will have to be re-established after installing a recharged battery pack. o) The data collection device (PC or Mobile device) is not receiving data. This does not mean that the system is not collecting data. The system will continue to collect data even if the communications link is lost. If using a wireless link such as Bluetooth (range is 60 m) or Spread Spectrum radios (range is 2 km), the system may be out of range or there may be obstacles preventing communication. Aim to maintain direct line of sight between the system and communications device at all times. For direct connection, most likely the cable has been disconnected. 4. Multiple discharge calculations across the same transect do not match a. Flow conditions may have changed since you completed the last transect. This may be the case in areas of high tidal variation or when the measurement section is downstream of a man-made structure that regularly alters the flow conditions. Constant stage or water level is not a clear indication the flow conditions have been maintained. b. Be sure to keep a written record of water level at the site during the discharge measurement. The water level can be referenced to a stream gauge that is permanently installed or to a staff that can be temporarily installed on the water’s edge. c. Make sure the site depth and location that you measured for the first transect match the measured values for the second transect in the data collected. You may have moved up or downstream since the last transect. d. Visible landmarks are always a good guide when making a measurement. Check the positional and depth measurements for both transects. e. Make sure the distance made good (DMG) is consistent between transects. f. The acceptable error between two to four measurements is typically less than 2 to 5%, but may be potentially higher depending on your application and the conditions. g. The edge positions should be the same or very close. Therefore the edge distances should be the same or similar for all transects. 5. Mobile Device a. Be sure that the RiverSurveyor Live for Mobile software is installed correctly on the Mobile device prior to field data collection. b. Please use the clear plastic lanyard with the Mobile device to prevent any water damage in the field. The Mobile device is not water resistant. Water damage is not covered by the warranty. c. The operational range can be affected by inclement weather. d. The RiverSurveyor Live for Mobile software will automatically activate the Bluetooth even if it is manually turned off. It can also be activated manually with these steps: a) Select Start on the Mobile device to open a list of Programs b) Select the Applications Icon to open an additional list of Programs c) Select Bluetooth and then Bluetooth Manager d) Select option 6, Settings e) Use arrow keys to activate Bluetooth RiverSurveyor S5/M9 System Manual (February 2010) 95 SonTek/YSI e. If Bluetooth or other issues persist, there are two ways to reset the mobile device a) If the phone is on: 1. Press Start 2. Scroll to and Select System Tools 3. Scroll to and Select either Master Reset or Master Clear 4. Press Yes (Left Soft Key) when Alert appears 5. Enter Master Code (normally 000000) b) If the phone is off or frozen: 1. Press and Hold the Center Select Key, while powering up the phone or Press and Hold the Z & E keys, while powering up the phone 2. The MASTER RESET screen will appear 3. Press Yes 4. This will restore the phone to factory settings 6. GPS a. Be sure the GPS antenna(s) have a clear view to the sky. Large trees or structures like bridges and buildings nearby can obstruct the satellite signals. Move away from any over-head obstructions to avoid mult-path errors or GPS dropouts. b. The GPS antenna on the ADP should be connected to the PCM with the coaxial cable. c. GPS Quality a) Zero indicates no GPS signal detected b) One indicates a non-differential GPS signal detected c) Two indicates a differential GPS (DGPS) signal detected d) Four indicates an RTK GPS signal detected d. GPS HDOP a) Horizontal Dilution of Precision is a GPS term used to describe the geometric strength of satellite configuration on GPS accuracy. b) Table 4 describes the possible values 96 RiverSurveyor S5/M9 System Manual (February 2010) SonTek/YSI Table 4: HDOP Value Descriptions HDOP Value Rating Description 1 Ideal This is the highest possible confidence level to be used for applications demanding the highest possible precision at all times. 2-3 Excellent At this confidence level, positional measurements are considered accurate enough to meet all but the most sensitive applications. 4-6 Good Represents a level that marks the minimum appropriate for making business decisions. Positional measurements could be used to make reliable in-route navigation suggestions to the user. 7-8 Moderate Positional measurements could be used for calculations, but the fix quality could still be improved. A more open view of the sky is recommended. 9-20 Fair Represents a low confidence level. Positional measurements should be discarded or used only to indicate a very rough estimate of the current location. 21-50 Poor At this level, measurements are inaccurate by as much as 300 metres with a 6 meter accurate device (50 dop * 6 meters) and should be discarded. e. RTK a) b) c) d) e) f) g) Be sure the SS antenna is connected to the RTK base station Be sure the battery pack in the RTK base station is fully charged Be sure the RTK base station is within the 1 mile range limit of the ADP The GPS antennas should be mounted to the RTK base station and ADP. Connect time for Differential Quality GPS data is approximately 5 minutes Connect time for RTK quality GPS data is approximately 10 minutes Use the status icons to evaluate GPS (RTK and DGPS) Communications Quality. The tables below provide a quick reference for the software status icons and the LEDs on the PCM and RTK Base Station. RiverSurveyor S5/M9 System Manual (February 2010) 97 SonTek/YSI Before RTK Lock: Scenario Base Station GPS DGPS Lock Lock LED LED PCM GPS RTK Lock Lock LED LED Hardware failure in base station and PCM Hardware failure in base station and no GPS lock in PCM Hardware failure in base station with GPS lock in PCM No GPS lock in base station and hardware failure in PCM No GPS lock in base station and PCM RiverSurveyor S5/M9 System Manual (February 2010) Software Indicator for PCM GPS GPGGA GPVTG QualiIcon Icon ty 0 Status Action No power to GPS board in both PCM and base station Send back both the power/comm. boxes to the factory No power to GPS board in base station Send back RTK base station to the factory No power to GPS board in base station Send back RTK base station to the factory No power to GPS board in PCM Send back PCM to the factory No clear view of the sky for base station GPS antenna Make sure base station GPS antenna has clear view of the sky to get GPS lock 0 1 0 0 99 SonTek/YSI GPS lock in base station but no DGPS lock No GPS lock in PCM GPS lock in PCM but no differential lock GPS lock in PCM with RTK lock 100 Make sure base station GPS antenna has clear view of the sky to get DGPS lock 0 No clear view of the sky for PCM GPS antenna Make sure PCM GPS antenna has clear view of the sky to get GPS lock GPS antenna of the PCM may be near a bridge or some obstruction Move away from the bridge or a structure to get full view of all the available satellites to get differential lock Spread spectrum radios in PCM and RTK base station are not working Send back PCM and RTK base station to the factory GPS antenna of the PCM may be near a bridge or some obstruction Move away from the bridge or a structure to get full view of all the available satellites to get RTK lock 1 GPS lock in PCM and no radio link between base station and PCM GPS lock in PCM with differential lock 0 No clear view of the sky for base station GPS antenna 1 Flashing Green 2 4 RiverSurveyor S5/M9 System Manual (February 2010) SonTek/YSI After RTK Lock: Scenario GPS lock in PCM with DGPS lock Base Station GPS DGPS Lock Lock LED LED PCM GPS RTK Lock Lock LED LED Flashing Green GPS lock in PCM with DGPS lock and no radio link between base station and PCM Hardware failure in base station GPS lock in PCM with no DGPS lock and no radio link between base station and PCM No GPS lock in PCM RiverSurveyor S5/M9 System Manual (February 2010) Software Indicator for PCM GPS GPGGA GPVTG QualiIcon Icon ty 2 2 2 1 0 Reason Solution to get RTK lock GPS antenna of the PCM may be near a bridge or some obstruction Move away from the bridge or a structure to get full view of all the available satellites to get RTK lock PCM Spread Spectrum radio is out of range from base station radio Go back towards base station to get radio link for RTK lock Low battery voltage in RTK base station Change battery in base station to get RTK lock PCM spread spectrum radio is out of range from base radio for more than 45 minutes Go back towards base station to get radio link for RTK lock GPS antenna on the PCM may be under a tunnel or no view of sky Move away from the tunnel to get full view of all the available satellites to get RTK lock 101 SonTek/YSI Appendix E. Software Changes RiverSurveyor Live v1.50 1. Multi-Language Support RiverSurveyor Live software has full language and date/time/numerical support for the following languages: • English • Spanish • Catalan • Chinese (Simplified) • French • German • Italian • Korean • Japanese • Portuguese (Brazil) • Turkish • Hungarian The currently selected language is displayed in the toolbar at the top left on the main screen as an icon representing the flag for the language. The language can be changed at any time in the software by clicking on the flag and selecting the desired language from the drop down list. All text, dates, times and numbers are displayed in the current language. This means that numerical input must correspond with the language. For example: The number 1,000.1 when English is selected, must be input as 1.000,1 when German is selected. The summary report and ASCII export have Multi-Language support. All log files (Compass Calibration, System Test) are recorded in English for troubleshooting purposes. 2. All Graphs All graphs can be saved to the clipboard by right clicking on the graph and selecting Save to Clipboard from the popup menu. 3. Time Series Window The Time Series Window displays multi-parameter parameters such as individual BottomTrack Beam Depths. Additional parameters can be displayed including: • GC-BC • Bottom-Track beam Depths A space on either side of the Time Series Window has been added to illustrate that edges are present. 4. Track Window The Track Window now only displays Tracks that are practical for the current coordinate system. For example GPS-GGA and GPS-VTG cannot be displayed in XYZ or System coordinates. RiverSurveyor S5/M9 System Manual (February 2010) 103 SonTek/YSI Track Window settings are now global (i.e. a change to the setting on one graph affects ALL Track Windows). Settings include: • AutoScale • AutoRotate • Show Velocity Vectors • UTM Display • Tracks When a GIS Map is loaded, right clicking on the Track Window displays the popup menu with a GIS sub-menu. On this menu are the following options: • Zoom to Full Extents – Zooms out to display both the full map and all data • Zoom to GIS Map – Zooms to the limits of the full map • Zoom to Data – Zooms to the limits of all the data 5. Contour Window The Contour Window displays a tooltip for highlighted cells. A space on either side of the Contour Window has been added to illustrate that edges are present. 6. Profile Window When displaying Discharge in the Profile Window, the profile extrapolation extends to the bottom. 7. All Tables/Tabular Data All tabular data can be saved to the clipboard by right clicking on the table and selecting Save to Clipboard from the popup menu. This data can then be pasted into Excel or a text editor for ASCII export. The order of the columns can be changed and is saved in the application settings. The columns should be adjusted to match the user display preferences or requirements for ASCII export. Columns support multi-dimensional parameters (e.g. individual Bottom-Track Beam Depths). 8. System Tab Column selections have been updated. 9. Edges tab The Edges tab displays the Left Bank and Right Bank instead of the Start Edge and End Edge. 10. Times Series Tab A new tab titled Time Series has been added that displays five multi-parameter Time Series windows. 11. Discharge Measurement Summary Active Records (records that are checked) that have discharge values that are outside of +/5% of the mean discharge are now displayed in red. This feature can be enabled/disabled using the Highlight Records button on the Discharge Summary toolbar. The icons for the Start Edge - Left Bank and Right Bank have been swapped. The arrows now point in the direction of travel across the river. 104 RiverSurveyor S5/M9 System Manual (February 2010) SonTek/YSI The splitter for the Discharge Measurement Summary has been repositioned to display 6 measurements plus statistics by default. The Summary only displays data for completed transects. Export to .dis from discharge summary table includes Start Date. 12. Site Information Site Information can be edited/changed in post-processing and all changes saved to the workspace. Any modified values are displayed in green text – just like all other fields. Note: In some cases fields that have not been changed are displayed in green. This is because the original Site Information fields may have been initialized incorrectly. 13. Lock Measurements Individual measurements can now be locked. This means that once a measurement is locked by pressing the Lock Measurement button on the Processing Toolbox toolbar any changes to the settings will not be saved to the workspace. A measurement can be unlocked by pressing the Lock Measurement button a second time. 14. Processing Tools Heading Correction added to the Thresholds tool. This setting should be used for corrections to the Heading for individual transects. The Magnetic Declination should be constant for all transects at a site and the Apply to All button can be used for all transects without affecting individual heading corrections. Composite Tracks option added to the Thresholds tool. This setting by default is ON, in both software and firmware. When disabled the track is calculated only using the selected reference and not a combination of the best possible references. 15. System Test System Test is logged to a text file. 16. MATLAB Export Bottom-Track Velocity label is output as BT_Vel (previously Bt_Vel). Units are removed from the names and are stored in a separate substructure within each of the root structures. 17. Loading Data File Data files are loaded in chronological order. 18. Increased Precision on ALL Parameters The precision has been increased (from float to double) on all values used in the software. Float has a precision of about 6 digits and doubles have 15. This means that the previous version may have done some rounding when dealing with large numbers of samples. The most observable difference between 1.00 and 1.50 could potentially be in the third or more significant digit of the discharge, but in most cases the variation would be extremely small. RiverSurveyor S5/M9 System Manual (February 2010) 105 SonTek/YSI RiverSurveyor Live Mobile v1.50 1. Multi-Language Support RiverSurveyor Live software has full language and date/time/numerical support for the following languages: • English • Spanish • Catalan • Chinese (Simplified) • French • German • Italian • Korean • Japanese • Portuguese (Brazil) • Turkish • Hungarian Following are the steps to select a language: 1. When you run this version of the software for the very first time, the following language selection dialog will open before searching for any RiverSurveyor systems. 2. Select a language and click “SELECT” button. 3. The software will start searching for Bluetooth RS systems and it will operate just as v1.00. 4. If you close this application and start it again, the software will automatically start in the language selected. 5. If you would like to change the language again, click “Utilities” on main menu and click “Application Settings”. The following dialog will open: 106 RiverSurveyor S5/M9 System Manual (February 2010) SonTek/YSI 6. Click the “Change Language” button and it will take you to the language selection dialog. 7. Unlike the RiverSurveyor Live PC software, you can only change languages from “Application Settings” dialog. 8. To change decimal and thousand separators to particular locale in the software application, you have to change locale manually in the phone. You can do this by going to /Settings/Regional Settings/Locale. To display Chinese, Japanese and Korean fonts: 9. Windows mobile doesn’t have built-in support for Chinese, Japanese or Korean font. 10. Third party software called “CE-Star for SP” is available online to display Chinese, Japanese and Korean characters. All log files (Compass Calibration, System Test) are recorded in English. 2. Mobile Graphics One main addition in this version is mobile graphics in moving boat dialog. Measurement procedure is same but hotkeys 1, 2, 3 and 4 do not work to show different tabular views. To view different tabular and graphical views in moving boat dialog, follow the steps below: 1. Use up and down arrow keys to scroll between following views: a. Tabular b. Graphical 2. Use right and left arrow keys to scroll between pages in each view: a. Tabular – 4 Pages b. Graphical – 4 Pages (time series, profile, track and contour plots) 3. Summary Table Hotkeys 1, 2, 3 and 4 do not work to show different tabular summary options. To view different summary options in summary view, use right and left arrow keys to scroll between summary options. RiverSurveyor S5/M9 System Manual (February 2010) 107