1
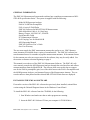
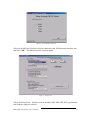
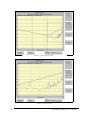
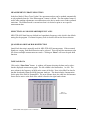
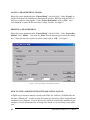
BANTAM INSTRUMENTS
MIL-STD-461E PRE-COMPLIANCE
MEASUREMENT SYSTEM
MODEL EMC-461
SOFTWARE USER’S MANUAL
Model EMC-461 Software User’s Manual
MIL-STD-461E PRE-COMPLIANCE
MEASUREMENT SYSTEM
MODEL EMC-461
Software User’s Manual
BANTAM INSTRUMENTS
197 South Murphy Avenue
Sunnyvale, CA 94086 USA
TEL: (408) 736-3030
FAX: (408) 904-5221
Web Site: www.BantamInstruments.com
© Copyright 2003, Bantam Instruments, Inc.
P/N 9900-0003, Rev. A
Table of Contents
General Information..................................................................................1
Installing the EMC-461 Software.............................................................1
Setting up the EMC-461 Measurement System ......................................2
Starting the EMC-461 Measurement Software ......................................2
Selecting a Measurement Antenna ...........................................................4
Selecting a Cable ........................................................................................5
Selecting the Measurement Specification ................................................5
Changing Measurement Frequency Range .............................................5
Displaying the Measurement ....................................................................6
Changing the Frequency Display Range .................................................7
Measurement Update Selection ................................................................9
Selecting Log or Linear Frequency Axis .................................................9
Quasi-Peak or Peak Hold Detection.........................................................9
Tabular Data ..............................................................................................9
Saving a Measurement ............................................................................10
Printing a Measurement..........................................................................10
How to View and Print the Software User’s Manual ...........................11
Troubleshooting .......................................................................................11
Model EMC-461 Software User’s Manual
GENERAL INFORMATION
The EMC-461 Measurement System makes radiated pre-compliance measurements to MILSTD-461E specification limits. The system is supplied with the following:
Model 401B Spectrum Analyzer
PA01A 26 dB Gain Preamplifier
P101A Active E-Field Probe
EMC-461 Software for MIL-STD-461E Measurements
SMA Male-Male Cable, 6 ft (1.8m) long
Battery Charger, 100-240 VAC, 50/60 Hz
Serial Interface Cable
PC Enhancement Software
Soft Carrying Case for Model 401B
401B Operating Manual
EMC-461 Software User’s Guide
One Year Warranty
The user must supply the EMC measurement antenna they prefer to use. EMC Measurement Antennas are available from a variety of manufacturers. The EMC-461 software has
stored antenna factors for a number of popular measurement antennas. If the antenna factors
for the antenna you select are not pre-stored in the software, they may be easily added. See
the section on antenna selection beginning on page 4.
This manual covers the use of the EMC-461 Measurement Software. The EMC-461 software remotely controls the 401B Spectrum Analyzer through the serial interface and collects
measurement data from the Model 401B. The software then corrects this data to compensate for the PA01A preamplifier gain, loss of the cable between the PA01A Preamplifier and
the 401B Spectrum Analyzer, and Antenna Factors of the Measurement Antenna. The corrected results are then plotted and the selected MIL-STD-461E limit lines are displayed.
INSTALLING THE EMC-461 SOFTWARE
If an earlier version of the EMC-461 software has previously been installed, uninstall that
version using the Uninstall Program feature in the Windows Control Panel.
To install the EMC-461 software from the CD-ROM, do the following:
1. Start Windows and make sure that no other programs are running.
2. Insert the EMC-461 Software CD into your computer’s CD-ROM drive.
Model EMC-461 Software User’s Manual
1
3. Windows should detect the CD and automatically run the setup program. If the
computers automatic detection feature is turned off, click the “Start” button at
the lower left-hand corner of the Windows desktop. Then click on “Run“. In
the “Open” dialog box type D:\SETUP.EXE. If the CD-ROM drive designator
for your computer is not “D”, substitute the appropriate letter for the letter “D”.
Now click the Button labeled “OK” and the EMC-461 software will begin loading.
SETTING UP THE EMC-461 MEASUREMENT SYSTEM
SMA Cable
1 meter
Model 401B
Spectrum Analyzer
Device
Under
Test
PA01A
Preamplifier
Antenna
Serial
Cable
Computer
Figure 1 – EMC-461 System Setup
Connect the hardware as shown above. Also connect the serial port cable between the 401B
Spectrum Analyzer and the Computer. Turn on the power to the 401B before starting the
EMC-461 measurement software. MIL-STD-461E specifications call for the measurement
antenna to be located 1 meter from the device under test. The EMC-461 software assumes
the 1 meter distance in the measurement setup.
STARTING THE EMC-461 MEASUREMENT SOFTWARE
To start the Bantam Instruments EMC-461 Software double click on the Bantam Instruments icon on the desktop. As an alternative, you may select “Start“, then “Programs“,
and then EMC461. The following screen on the next page will be displayed.
2
Model EMC-461 Software User’s Manual
Figure 2 – Serial Interface Selection
Select the Serial Port (Com Port) which is connected to the 401B Spectrum Analyzer and
then click “OK”. The following screen will now appear:
Figure 3 – Setup Screen
This is the Setup Screen. On this screen the antenna, cable, MIL-STD-461E specification,
and frequency range are selected.
Model EMC-461 Software User’s Manual
3
SELECTING A MEASUREMENT ANTENNA
Antenna factors for commonly used antennas from several manufacturers are stored in the
EMC-461 software. A list of these antennas is shown in Table I. This list is accurate at the
time of printing of this manual. Your software may contain antenna factors for additional
antennas if the software has been upgraded since manual publication.
MANUFACTURER
A. H. Systems
www.ahsystems.com
MODEL
SAS-510
SAS-521F-2
SAS-540
Electro-Metrics
EM-6917C-1
www.electro-metrics.com EM-6917B-1
TYPE
Log Periodic
Broadband
Biconical
Broadband
Broadband
ANTENNA
FREQUENCY RANGE
FREQUENCY
USABLE IN
RANGE
EMC-461 SYSTEM
290 MHz - 2000 MHz 290 MHz - 1000 MHz
190 MHz - 2000 MHz 190 MHz - 1000 MHz
20 MHz - 330 MHz
20 MHz - 330 MHz
30 MHz - 1000 MHz
26 MHz - 3000 MHz
30 MHz - 1000 MHz
26 MHz - 1000 MHz
ETS Lindgren
www.emctest.com
3301B
3103
3104C
3142C
3144
3148
Monopole (rod)
Conical Log Spiral
Biconical
Broadband
Log Periodic
Log Periodic
250 Hz - 30 MHz
1 MHz - 30 MHz
100 MHz - 1000 MHz 100 MHz - 1000 MHz
20 MHz - 200 MHz
20 MHz - 200 MHz
26 MHz - 3000 MHz
26 MHz - 1000 MHz
80 MHz - 2000 MHz
80 MHz - 1000 MHz
200 MHz - 2000 MHz 200 MHz - 1000 MHz
Sunol Sciences
www.sunolsciences.com
BC1
JB1
JB2
JB3
LP1
Biconical
Broadband
Broadband
Broadband
Log Periodic
30 MHz - 300 MHz
30 MHz - 300 MHz
30 MHz - 2000 MHz
30 MHz - 1000 MHz
30 MHz - 3000 MHz
30 MHz - 1000 MHz
30 MHz - 5000 MHz
30 MHz - 1000 MHz
200 MHz - 2000 MHz 200 MHz - 1000 MHz
Table I – EMC Measurement Antennas supported by the EMC-461 Software
The first antenna on the list in the EMC-461 software is a Bantam Instruments 433 MHz
quarter wavelength antenna which is used for system demonstration purposes only. It is not
intended to make accurate EMC pre-compliance measurements.
The button labeled “Show Selected Antenna Factor Table” displays the antenna factors
loaded into the software for a specific antenna. Straight line interpolation versus frequency
is used for making measurements between data points. The antenna factor data points have
been carefully chosen so that this interpolation is quite accurate.
If the antenna which you plan to use is not included in the list, or if you wish to enter different antenna factors for your antenna, this can be done by clicking “User Defined Antenna”.
Up to 100 Antenna Factor / Frequency pairs may be entered and the data file can be named
for easy identification and recall in the future. Simply enter the antenna factor and fre4
Model EMC-461 Software User’s Manual
quency pairs and click “Done” when finished. Stored antenna factor files are given the suffix “baf” which stands for “Bantam Antenna Factor“.
SELECTING A CABLE
The cable used between the PA01A Preamplifier and the 401B Spectrum Analyzer must be
entered. The EMC-461 is supplied with a 6 foot (1.8 meter) RG-174/U cable, so this is the
default. RG-174/U cables of 2 (0.6 meter) and 12 foot (3.6 meters) are also available from
Bantam Instruments.
By clicking “User Supplied Cable”, any length of cable may be defined using RG-174/U,
RG-58/U or RG-8/U coax. The software will automatically calculate the insertion loss over
the 1 MHz to 1000 MHz measurement range. The cable can be named for easy identification. Clicking on “Show Calculated Value” will display the insertion loss calculated by the
program for 1 MHz, 10 MHz, 100 MHz, and 1000 MHz. Click on “Done” when cable definition is complete.
SELECTING A MEASUREMENT SPECIFICATION
The EMC-461 Measurement Software supports all radiated emissions specifications defined
in MIL-STD-461E:
RE102-1 limit for surface ship applications
RE102-2 limit for submarine applications
RE102-3 limit for aircraft and space applications
RE102-4 limit for ground applications
Simply click the desired specification and the appropriate limit line or lines will be displayed on the measurement display.
If you desire to enter a custom specification, click “UserDefined Spec”. You will be asked
to enter a start frequency, stop frequency, and dBµV/m value. Up to 100 line segments may
be entered. All must be horizontal line segments, no sloped lines are allowed. The user defined specification can be named and saved. It is given the suffix “bus” which stands for
“Bantam User-defined Specification”.
CHANGING THE MEASUREMENT FREQUENCY RANGE
The measurement frequency range capability of the EMC-461 system is 1 MHz to 1000
MHz, however, no single antenna is available to cover this entire range. When an antenna
is selected, the frequency measurement range is set to the frequency range of the antenna
Model EMC-461 Software User’s Manual
5
within the range of the EMC-461 measurement system. The frequency range is divided into
100 bins, and the highest amplitude of frequencies within each bin is displayed as the data
for that bin. A frequency is never missed and the highest amplitude signals are always displayed.
As a example. If the Frequency Measurement Range is set for 100 MHz to 1000 MHz, this
is a measurement span of 900 MHz. Dividing this span into 100 bins results in 9 MHz per
bin. The first bin will be 100 – 109 MHz, the second 109 – 118 MHz, the third 118 – 127
MHz, etc. The highest amplitude signal found in each bin will be the amplitude displayed
for that bin. The display frequency assigned for each bin is the center frequency of the bin.
The first bin is 104.5 MHz, the second 113.5 MHz, the third 122.5 MHz, etc.
It is possible that there are two or more signals, closely spaced together within a bin. To
check for this, the frequency range can be narrowed around a frequency of interest and the
measurement repeated. Each bin is now narrower. This effectively increases the frequency
resolution of the EMC-461 measurement system.
To accomplish this, simply change the “Start Frequency” and “Stop Frequency” in the
“Frequency Measurement Range” box. To return to the original full range, click on “Set
full freq range for selected antenna”.
DISPLAYING THE MEASUREMENT
To make a measurement and display the results, click “Start Measurement”. The measurement will be displayed using the parameters from the setup screen. The default frequency
range will always be 1 MHz to 1000 MHz, the frequency range of the EMC-461 system. A
typical measurement is in Figure 4 on the next page.
6
Model EMC-461 Software User’s Manual
Figure 4 – Measurement Screen
CHANGING THE FREQUENCY DISPLAY RANGE
The frequency range of the measurement data is 100 MHz to 1000 MHz. It is straightforward to zoom the frequency display to this range. Simply position the mouse cursor at the
upper left-hand corner where you would like the graph to start. Press the left mouse button
and drag the cursor to the bottom left-hand position where you would like the graph to stop.
Release the left mouse button and the new display range will be displayed. To return to the
previous display position the mouse cursor on the graph, press the right mouse key, select
“unzoom” and press the left mouse key. The graph will be returned to its original state.
The two graphs on the next page show the sequence of zooming in to a narrower frequency
range.
Model EMC-461 Software User’s Manual
7
Figure 5 – Selecting the Zoom Area
Figure 6 – Frequency Zoom
8
Model EMC-461 Software User’s Manual
MEASUREMENT UPDATE SELECTION
In the box labeled “Draw Trace Update” the measurement data can be updated automatically
or only updated when the “New Measurement” button is clicked. The auto update feature is
useful when making adjustments or modifications to the device under test to reduce radiated
emissions. The Manual mode is convenient when it is desired to print or save specific
measurement data.
SELECTING LOG OR LINEAR FREQUENCY AXIS
MIL-STD-461E limit lines are defined in a logarithmic frequency scale which is the default
setting for the program. If a linear frequency scale is desired click on the linear selection.
QUASI-PEAK OR PEAK HOLD DETECTION
Quasi-Peak detection is normally used for MIL-STD-461E measurements. If the measured
signals are varying, Peak Hold detection can be selected. This will hold the maximum value
for a bin as multiple measurements are made. Clicking on “Reset” will reset the peak hold
function.
TABULAR DATA
Click on the “Show Data” button. A window will appear showing the data used to calculate the displayed measurement graph. The left column is the bin number, 1 to 100. The
next column is the frequency in MHz at the center of the bin. Next is the dBµV/m data for
that bin downloaded from the 401B Spectrum Analyzer. This data includes compensation
for the gain of the PA01A Preamplifier. The next columns show the cable loss and antenna
factor used to arrive at the final value which is listed in the right hand column.
Table 2 –
Tabular Data
Model EMC-461 Software User’s Manual
9
SAVING A MEASUREMENT TO DISK
Right click on the graph and select “Export Dialog” with a left click. Under “Export” select the file format you would like the measurement saved in. BMP (bit map) and JPG (JPEG) are usually the most popular. Under “Export Destination” click on “File” Now
click “Browse” to name the file and select a storage location. See Figure 7.
PRINTING A MEASUREMENT
Right click on the graph and select “Export Dialog” with a left click. Under “Export Destination” click “Printer”. Now click on “Print” near the bottom right corner of the dialog
box. Check that the correct printer is selected, then click on “OK”. See Figure 7.
Figure 7 – Screen for Saving or Printing Measurements
HOW TO VIEW AND PRINT THE SOFTWARE USER’S MANUAL
A digital copy of this user manual is stored on the EMC-461 Software CD-ROM under the
file name “Manual.pdf”. In order to open the manual you must have Adobe Acrobat Reader
installed on your computer. If you do not have the Adobe Acrobat Reader installed on your
computer, it can be downloaded free of charge from Adobe’s web site at http://www.adobe.
com.
10
Model EMC-461 Software User’s Manual
Once you have Adobe Acrobat Reader installed:
1. Start Adobe Acrobat Reader
2. Insert the EMC-461 CD into your computer’s DC-ROM drive
3. Click on “Start”, then click on “Run”. Type “D:\Manual.pdf” into the “open”
dialog box and then click “OK”. If “D” is not the designator for your CD-ROM
drive, type the appropriate letter in place of the “D”.
To print the manual from Acrobat Reader, select “File”, then select “Print”.
TROUBLESHOOTING
If data is not transferred from the 401B Spectrum Analyzer to the EMC-461 Software, try
the following steps.
1. Cycle power on the 401B Spectrum Analyzer, then restart the EMC-461 software.
2. Insure that a “straight through” wired DB-9 serial cable as supplied by Bantam Instruments is used between the 401B and the serial port on the PC.
3. Confirm that the serial port that you are using on the PC is operational. This can be confirmed by using HyperTerminal in Windows and setting the parameters to 57600 baud
(57600, 8, N, 1) and NONE for hardware handshake (flow control). If your serial port is
operational you should see a message from the 401B spectrum analyzer when you turn
the 401B power off, then back on.
4. When you connect the 401B to the serial port and then select Com1, Com2, Com3, or
Com4, watch the 401B screen for activity. If the PC and the 401B are communicating
you should see “REMOTE CONTROL” across the bottom of the 401B display.
5. If you get an error message regarding the Bantam Instruments preamplifier “not found”,
then confirm that there is an RF connection between the 401B SMA input connector and
the PA01A preamplifier and that the connections are tightened sufficiently. Also, there
must be no other RF components between the 401B and the preamplifier as the 401B
supplies DC power to the preamplifier.
Model EMC-461 Software User’s Manual
11