1
Design Document – Team Gamma
Page
1
Bremen, Germany
Page
1. Introduction ...................................................................................................................................... 5
1.1 The Idea of Apollo 12 ................................................................................................................ 5
1.2 Team Structure ........................................................................................................................... 5
1.3 Mission Objectives ..................................................................................................................... 7
2 CanSat Description ........................................................................................................................... 8
2.1 Apollo 12 Requirements ............................................................................................................ 8
2.2 Mechanical/Structural/Electrical Design ................................................................................... 9
2.2.1 Antenna ............................................................................................................................... 9
2.2.2 The Can ............................................................................................................................. 12
2.2.2.1 Sensor Placement ....................................................................................................... 12
2.2.2.2 Outer Hull .................................................................................................................. 16
2.2.3 Battery ............................................................................................................................... 18
2.2.3.1 Battery Placement ...................................................................................................... 18
2.2.3.2 Runtime ...................................................................................................................... 18
2.3 Software Design ....................................................................................................................... 19
2.3.1 Android Application Design ............................................................................................. 19
2.3.1.1 Structural Design........................................................................................................ 19
2.3.1.1.1 Task ..................................................................................................................... 19
2.3.1.1.2 Required Equipment ........................................................................................... 19
2.3.1.2 Data Coordination ...................................................................................................... 19
2.3.1.3 Graphical User Interface ............................................................................................ 20
2.3.1.3.1 Main Design ........................................................................................................ 20
2.3.1.3.2 Options Menu ...................................................................................................... 21
2.3.1.4 Data Transfer.............................................................................................................. 21
2.3.1.4.1 Realtime .............................................................................................................. 21
2.3.1.4.2 Recieval from File .............................................................................................. 22
2.3.1.4.3 Recieval from Database ...................................................................................... 22
2.3.1.5 Software exposition.................................................................................................... 22
2.3.1.5.1 Packages .............................................................................................................. 22
2.3.1.5.1.1 widget ........................................................................................................... 22
2.3.1.5.1.2 data ............................................................................................................... 22
2.3.1.5.1.3 database ........................................................................................................ 22
2.3.1.5.1.4 filebrowser ................................................................................................... 22
2.3.1.5.1.5 fileoperations ................................................................................................ 22
2.3.1.5.1.6 fragments ...................................................................................................... 22
2.3.1.5.1.7 fragments_androidplot ................................................................................. 22
2.3.1.5.1.8 json ............................................................................................................... 23
2.3.1.5.1.9 main .............................................................................................................. 23
2.3.1.5.1.10 options ........................................................................................................ 23
2.3.1.5.1.11 sensors ........................................................................................................ 23
2.3.1.5.1.12 socket ......................................................................................................... 23
2.3.1.5.1.13 value ........................................................................................................... 23
2.3.1.5.1.14 webView .................................................................................................... 23
2.3.2 Ground Station Design ...................................................................................................... 23
2.3.2.1 Structure ..................................................................................................................... 23
2.3.2.1.1 Task ..................................................................................................................... 23
2.3.2.1.2 Required equipment ............................................................................................ 23
2.3.2.3 Software Exposition ................................................................................................... 24
2
Table of Contents
Page
.............................................. 36
4.3 Logo Idea ................................................................................................................................. 37
4.4 Other......................................................................................................................................... 37
5 Internal Guidelines .......................................................................................................................... 38
3
2.3.2.3.1 Packages .............................................................................................................. 24
2.3.2.3.1.1 control .......................................................................................................... 24
2.3.2.3.1.2 database ........................................................................................................ 24
2.3.2.3.1.3 export ........................................................................................................... 24
2.3.2.3.1.4 livestream ..................................................................................................... 24
2.3.2.3.1.5 main .............................................................................................................. 24
2.3.2.3.1.6 options .......................................................................................................... 24
2.3.2.3.1.7 server ............................................................................................................ 24
2.3.2.3.1.8 transmitting .................................................................................................. 24
2.3.2.3.1.9 usb ................................................................................................................ 25
2.3.2.4 Libraries ..................................................................................................................... 25
2.3.2.5 Livestream Design ..................................................................................................... 26
2.3.3 General Design .................................................................................................................. 27
2.3.3.1 MySQL Database ....................................................................................................... 27
2.3.3.2 JSON .......................................................................................................................... 27
2.4 Recovery System...................................................................................................................... 28
2.5 Issues ........................................................................................................................................ 29
2.5.1 Hardware Error UART to USB Bridge ............................................................................. 29
2.5.2 Sloth Sensors ..................................................................................................................... 29
2.5.3 CO2 .................................................................................................................................... 30
2.5.4 Changing the Plan & Time Schedule ................................................................................ 31
2.5.5 Arduino Crash (SoftwareSerial)........................................................................................ 31
2.5.6 Internal Guidelines ............................................................................................................ 32
2.6.6 Arduino Memory leak Issue (JSON) ................................................................................ 32
3 Project Planning .............................................................................................................................. 33
3.1 Time Schedule of the CanSat Preparation ............................................................................... 33
3.2 Resource Estimation ................................................................................................................ 34
3.2.1 Budget & Components ...................................................................................................... 34
3.2.2 External Support ............................................................................................................... 34
3.2.3 Time .................................................................................................................................. 35
3.3 Test Plan................................................................................................................................... 35
3.4 Test Results .............................................................................................................................. 35
4 Outreach Program ........................................................................................................................... 36
4.1 Social ........................................................................................................................................ 36
4.2 Blog .......................................................................................................................................... 36
Page
4
5.1 Language .................................................................................................................................. 38
5.2 Data Management .................................................................................................................... 38
Appendix A – Ground Station User Manual ...................................................................................... 40
A.1 Livestream ............................................................................................................................... 40
A.2 Export ...................................................................................................................................... 40
A.2.1 Export to .kml................................................................................................................... 40
A.2.2 Export to .xls .................................................................................................................... 41
A.2.3 Export to .csv ................................................................................................................... 41
A.2.4 Export to .txt..................................................................................................................... 41
A.2.5 View logged pictures........................................................................................................ 41
A.2.6 Visualize data ................................................................................................................... 41
A.3 Options .................................................................................................................................... 42
Appendix B – Android Application User Manual ............................................................................. 43
B.1 General info ............................................................................................................................. 43
B.2 Button ...................................................................................................................................... 43
B.2.1 Home ................................................................................................................................ 43
B.2.2 Sensor names .................................................................................................................... 43
B.2.3 Last position ..................................................................................................................... 43
B.2.4 Import ............................................................................................................................... 43
B.2.5 Options ............................................................................................................................. 43
Appendix C – Sensor Pin Out ............................................................................................................ 44
1. Introduction
1.1 The Idea of Apollo 12
One of our early ideas was to measure radioactivity of the surrounding area with our CanSat, after
some research on the topic of radioactivity we let the idea fall down, because the tubes that measure
these kinds of radioactivity need hundreds of volts and are not really suitable for a can. Now our idea
is to make a fully open sourced CanSat, where we will publish all information for hobbyists or people
that are just interested in the topic.
Not only the hardware part of the CanSat which mostly contains sensors and the CanSat kit are
important, but also the software which is essential to get an overview of what is happening with the
CanSat and the surroundings. So the idea was to make a fast and easy way to see data in real time so
we would not have to hold a laptop in our hands at all times. So we thought a little about it and asked
ourselves “what is tiny and can be carried around easily?” – of course one item that most people
already have available – the smartphone. That leads us to our android application which has three
ways for receiving data.
Nonetheless our laptop will not be left behind, it will have its own application to see data in real time
and also save the data for later analysis. The application will transmit data to a database, to make the
data available for everyone that sees our website.
Some ideas came a little later than others, for example the GPS tracking to see where our CanSat is
located and to have a near spot-on reference value for our pressure sensor which calculates the height.
The android application will show the Apollo 12 location if there is Wi-Fi or mobile broadband
available.
1.2 Team Structure
Our Team contains seven students, each one of them has got a task assigned to them as follows:
Kevin Neumeyer (17) is the second member of the developing and constructing group at Team
Page
Till Schlechtweg (17), the second team leader, has the responsibility is to keep the team
communicating between groups and to also develop and construct the CanSat. This means doing the
Electrical Layout and the programming of the Atmel ATMEGA2560, which is the Arduino's
Microprocessor. He has to fiddle with a lot of C for the programming and also has to handle the flood
of datasheets for every component we need. His time dedicated is similar as Mr. Brennecke's: He will
take as much time as possible within school and more than seven hours a week in the reserved labor
at school. His interests lie in the field of engineering hardware and computer science. His workload
is quite high, because all members lack the experience to develop the hardware components. So a lot
of research needs to be done by him and his partner.
5
Alexander Brennecke (18) is one of our team leader and the main spokesperson for our outreach
program. To also give him some work with the CanSat he will develop the Android Application frontend, which means that he will develop everything UI (User Interface) related. At school Mr.
Brennecke dedicates as much time as possible (depends on our teachers and school workload) and
more than seven hours a week in one of our school labors which is reserved for us. His interests lie
in the topic of software, which will be one of the main factors in his future work life, Mr. Brennecke
loves to develop and debug software so the work given to him is very interesting for himself. He has
one of the biggest but not hardest workloads, he is the one talking directly to sponsors and giving the
blog (part of the outreach program) new posts and information, as well as fiddling with the Android
SDK (Source Development Kit).
Gamma. He is – as Mr. Schlechtweg – responsible for getting the CanSat up and running, which
means that the CanSat translates all data to a format which is chosen by us and also getting the data
from all sensors in the first place. Mr. Neumeyer also has to search for the right components needed
for our CanSat. They need to be fast as the CanSat will be falling at a speed more than 8m/s and less
than 11m/s, which means milliseconds of response time are needed. Also most of the components
need to be quite power efficient, because the battery needs to last one hour. They need to run on five
Volts if possible. So Mr. Neumeyer and Mr. Schlechtweg as the hardware group have quite a
workload which is constantly helped with by the whole team. Mr. Neumeyer is also our specialist for
developing web applications so he will also develop the live.team-gamma.de website which will
display a live graph of the measured data received.
Robin Bley (18) is our android application developer. As well as Mr. Brennecke he has to fiddle with
all the Android SDK related stuff and is responsible for the back-end part of the android application.
This contains all data handling as well as making a solid connection between the ground station and
the android application. This will be made possible with a Java socket connection through a WLAN
Hotspot started with our laptop. He needs to obtain the knowledge to complete the task of transmitting
and receiving data with the Java socket, he also needs to know the format and how to get specific
information needed from it. His interest lies in the topic of software developing and planning, he also
would like a job in that general direction.
Alexander Ciupka (16) is part of our ground station group which will build the antenna needed for
our specified frequency and also the software needed to see all the data in real time and to get a good
overview of the CanSat and its flight. Mr. Ciupka specific task is to develop the connection between
our MySQL database and the laptop which will get all the measurement data from our CanSat. The
MySQL connection is essential for our CanSat, because the live.team-gamma.de website needs a
quick and easy way to obtain measured information. He generally takes care of the back-end part of
our laptop application that will handle everything connection related and also will handle the data
format. Mr. Ciupka’s workload is quite high, because no one has real experience with frequency and
antennas, so we get external help from our University Bremen located nearby.
Marc Huisinga (17) is the second member of the ground station group. He will help with building our
antenna with specific requirements. The front-end part of our laptop application is also developed by
Mr. Huisinga. The front-end part will contain the graphs with measurement data and everything
related to our measurements as well as options to save and export data in various formats. He needs
to research for the knowledge of the GUI (Graphical User Interface) library in Java which will be
Swing. The workload of Mr. Huisinga is high, because GUI development is not easy – lots of fiddling
– and building an antenna with no prior knowledge is a big task to do.
Page
The time dedicated by Marc Huisinga, Till Schlechtweg, Alexander Feldmann, Alexander Ciupka,
Robin Bley and Kevin Neumeyer is exactly the same as Mr. Brennecke’s time management. The time
we can offer at school and the time we dedicate specifically to CanSat at one of our school labors
which is less than or more than seven hours, depending on the week and private dates.
6
Alexander Feldmann (17) is pending between our ground station and hardware group, because he has
the task of building the antenna with Mr. Ciupka and to design and construct a prototype parachute.
The parachute will be designed to give the CanSat a safe way to land and to be in the requirements
of falling speed of 8 to 11m/s and the fall period with a maximum of 120 seconds. His workload is
basic. Mr. Feldmann is more of a basic helper with all the tasks and he is boosting the team morale.
Still the building of an antenna as well as a parachute is not an all-day task, as stated in Mr. Huisinga’s
and Mr. Ciupka’s paragraph.
1.3 Mission Objectives
Our secondary mission is to make a really easy to use, plug and play ground station that is available
to all people even with no prior knowledge. This means everyone can operate our CanSat after a brief
instruction, which includes android application and windows application.
We will also write a user handbook for our ground station and the android application. This means
everyone can use these softwares without requiring an instruction from us.
We want to measure various values, these being
Temperature
Humidity
Pressure
Acceleration (X, Y, Z)
and also collect data for easy position tracking using GPS. We will also use the pressure collected
from the primary mission to get an accurate value calculated physically to confirm the GPS location
and the height of our CanSat and also to have a reference value for further analysis.
Also measured data will be available to the public via our website and can be easily exported to
various formats these being:
1.
2.
3.
4.
5.
6.
CSV – A simple table format just with commas
TXT – Default notepad file
BMP – Windows Bitmap (image format)
XLS – Microsoft Excel Format
KML – Google Earth 3D Path Format
Print the data formatted on DIN A4
This makes analysis of the data very easy. For example you could look on your excel spread sheet,
you see some interesting values you want to investigate, look up the position in 3D and you have
everything you need.
We want to get people involved in seeing data and us being transparent, so everything we will do is
open source and will be uploaded when finished (because of competition purposes). Our data will be
available online if Andoya has a solid connection to the internet. If not the data will be uploaded after
the arrival of the CanSat, when an internet connection is available.
The location values are essential to determine where we measured the values, because it is always
important that you can filter and analyze the data for false positives/values.
Everything is licensed under the General Public License, version 3.0, so we do not lose any rights on
our code and documents, but still everyone can use and modulate our work to their liking, also no one
has the right to use our documents and code commercially.
Page
7
The progress reports, feedbacks, design document, code as well as pictures can be found under teamgamma.de/download/.
2 CanSat Description
2.1 Apollo 12 Requirements
To fulfill our mission the following requirements need to be completed:
1. CanSat
a. Landing without destroying of the whole system
b. Saving and logging the data to SD
2. Ground station
a. Flawless receiving of data
b. Exporting to the various formatting
i. to .txt
ii. to .csv
iii. to .xls
iv. to .bmp
v. to printer
c. Display of data
i. in realtime
ii. without errors
3. Android Application
a. Flawless receiving of data
i. per database
ii. per ground station server
iii. per file (import)
b. Flawless exporting of data
i. to .teamgamma
c. Displaying of data
4. Antenna
a. Can be deconstructed
b. Works in the right frequency
Page
8
The following requirements are optional:
1. CanSat & Antenna
a. Receiving data while the CanSat is in air
b. Making photos
2. Ground station
a. Easy to use and user friendly
i. Other languages
ii. Simple menu
b. Exporting of data
i. to .kml
3. Android Application
a. Sidebar
b. Easy to user and user friendly
i. no random crashes
ii. graphs can be modulated on their axises
4. Website
a. Working live stream
b. Displaying of values while the CanSat is in Air
2.2 Mechanical/Structural/Electrical Design
2.2.1 Antenna
The Yagi-Uda-Antenna is linear polarized that’s why when the CanSat and the Yagi-Uda-Antenna
align perfectly with each other nothing will be transmitted or received, and it’s also the reason why
we wanted to change the type of antenna we use.
After talking to professor doctor engineer Martin Schneider of the University Bremen, we came to
conclusion of another antenna design not only the Yagi-Uda-Antenna. Mr. Schneider did say that the
Helix Antenna is one of the best solutions for our project, because of the characteristics she offers.
For calculation of the Helix Antenna we consulted the professor stated above. There is
c f
m
c 3 10 8
s
This states that the wavelength for
c
69,12cm
f
is the perimeter of our Helix. The squared length of our reflector is also the wavelength. For the
diameter of our Helix, there is:
d
with N = 8 winds and the step height of
s
4
there is the length of our antenna with
l 8
The antenna gain is calculated with
22cm
69,12
17,28cm
4
4
138,2cm .
d 2
G 15 N s
3
the step height being
s
4
and N = 8 makes
G 15 8
4
2
2
2
3
which is
G 15
8
30 .
4
For the impedance there is:
d
it will be
.
9
With
d
Page
Z 140
Z 140 140 .
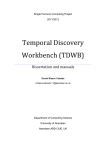
Fig. 1 - Reflector (Picture: Team Gamma)
The Antenna has a length of 138,2cm and the reflector or bottom plate is 69,12cm long. The
impedance of our antenna needs to be 140Ohm, the impendance needs to be very exact that’s why
Mr. Schneider did help us with the adjustment of it.
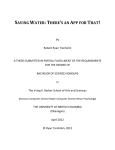
Fig. 2 - Helix Antenna (Picture: Team Gamma)
Page
10
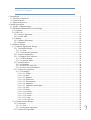
The Antenna seen above was tested in the high frequency labor of the University Bremen, the antenna
was also measured with a spectrum analyzer to see if it would fulfil our requirements of the wanted
frequency.
Fig. 3 - Spectrum Analyzer (Picture: Team Gamma)
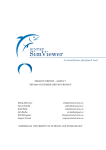
Fig. 4 - Spectrum Analysis of our Antenna (Picture: Team Gamma)
As you can see the frequency is nearly spot on, 432.9 MHz is a pretty good reading, that we need to
get a good connection to our Apollo 12.
Fig. 5 - Constructing the second antenna (Picture: Team Gamma)
Page
11
Because of the flight we can’t really transport the Antenna you see in Fig. 2, we needed a portable
solution. That’s why we build a second antenna which can be deconstructed.
This antenna is ideal for transport and can be deconstructed to almost the tiniest bit. Martin Schneider
present in the background was the one to explain us how we can measure the antenna to see if it
fulfilled our requirements of the wanted frequency and the easy transportation.
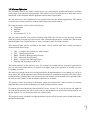
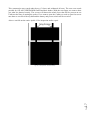
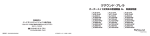
Fig. 6 - Reflection of our antenna (Picture: Team Gamma)
In Fig. 6 you can see that at the wanted frequency nearly everything will be received and on the other
frequencies nearly everything will be reflected from our antenna, these are ideal environments for us
to work with.
The bottom of the network analyzer means that everything will be received and the top means
everything will be reflected. This is mostly driven by the wire being at the exact bottom, if the wire
is too high from the reflector it will reflect more of the energy it receives and if you press it more
towards the reflector plate (without touching) you receive more of the energy.
While the first antenna was built by gluing foam pads together and had a pure 69cm by 69cm metal
reflector plate, the second antenna was constructed from aluminum pipes and plastic tubing for the
holders of the actual copper wire. The bottom plate is pressure wood with aluminum foil.
2.2.2 The Can
Fig. 7 - EM-411 looking through the top (Picture: Team Gamma)
Page
12
2.2.2.1 Sensor Placement
We have to get many sensors in place and on our boards, the TMP006, the L3G4200D, the HIH4000-001, a Micro SD Breakout, MPX4115A and the EM-411. The EM-411, which is a GPS sensor,
will be placed on one of the blank boards and then the antenna will look out the front of our Apollo
12, that way it gets the optimal connectivity to them GPS satellites.
The Micro SD Breakout will be placed on one of the through-hole boards together with the HIH4000-001 Humidity Sensor and the TMP006 infrared temperature sensor. There is just enough room
for these three to fit without interfering themselves.
Fig. 8 - Top board (Picture: Team Gamma)
The L3G4200D, a gyroscope and the MPX4115A, a pressure senor have their own board, because
the L3G4200D needs 3.3V and the T-Minus Board doesn’t have a 3.3V Regulator build in., we
needed a Z-Diode 3.3V and for current limitation an resistor in front of it. The resistor needs the
resistance of
𝑈𝑎𝑙𝑙 − 𝑈𝑧
𝑅𝑣 =
𝐼𝑎𝑙𝑙
At first we need Izmax which is the maximal current the Zenerdiode can handle this is calculated with
the help of Ptot which is the power loss of the Z-Diode, in this case we used a 3.3V Z-Diode which
has 500mW power loss.
𝑃𝑡𝑜𝑡
𝐼𝑧𝑚𝑎𝑥 =
𝑈𝑧
𝐼𝑧𝑚𝑎𝑥 =
0,5𝑊
5𝑉
𝐼𝑧𝑚𝑎𝑥 = 100𝑚𝐴
Now we need the minimum current flow for which in this case we will consult the datasheet of the
Zenerdiode.
𝐼𝑧𝑚𝑖𝑛 = 1𝑚𝐴
Now we can calculate the whole current, which in this case is Izmax plus the gyrp current.
𝐼𝑎𝑙𝑙 = 𝐼𝑧𝑚𝑎𝑥 + 𝐼𝐿
𝐼𝑎𝑙𝑙 = 100𝑚𝐴 + 6.1𝑚𝐴
5𝑉 − 3.3𝑉
= 16.0226 𝑂ℎ𝑚
0.1061𝐴
Page
𝑅𝑣 =
13
𝐼𝑎𝑙𝑙 = 106.1𝑚𝐴
Now we can calculate the resistor, which is there for protecting the Z-Diode, as follows:
For the actual power loss on the Z-Didoe we will calculate:
𝑃𝑧 = 𝑈𝑧 ∗ 𝐼𝑎𝑙𝑙
𝑃𝑧 = 3.3𝑉 ∗ 106.1𝑚𝐴
𝑃𝑧 = 350.13𝑚𝑊
With this calculation you can see that the Z-Diode with 500mW maximum power loss is more thatn
enough to handle this situation. Now let’s see what resistor we need, the resistor boosts our current a
little bit.
𝑈𝑔𝑒𝑠 − 𝑈𝑧
𝐼𝑎𝑙𝑙 =
𝑅𝑣
𝐼𝑎𝑙𝑙 =
5𝑉 − 3.3𝑉
16 𝑂ℎ𝑚
𝐼𝑎𝑙𝑙 = 106.25𝑚𝐴
The resistor needs a specific maximum power loss rating.
𝑃𝑟𝑣 = (𝑈𝑎𝑙𝑙 − 𝑈𝑧) ∗ 𝐼𝑎𝑙𝑙
𝑃𝑟𝑣 = (5𝑉 − 3.3𝑉) ∗ 106.25𝑚𝐴
𝑃𝑟𝑣 = 180.625𝑚𝑊
For the resistor we need a minimum of circa 200mW power loss rating. We did choose a resistor with
300mW just to be safe.
Page
14
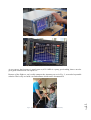
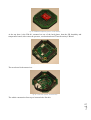
Fig. 9 - Middle board [top] (Picture: Team Gamma)
Fig. 10 - Middle Board [bottom] (Picture: Team Gamma)
At the top there is the EM-411 mounted on one of the back plates, then the SD, humidity and
temperature board, after comes the pressure, acceleration board. Then the main μC-Board.
Fig. 11 - μC-Board (Picture: Team Gamma)
The next board is the transceiver.
Fig. 12 - Transceiver (Picture: Team Gamma)
Page
15
The whole construction from top to bottom looks like this:
Fig. 13 - Apollo 12 (Picture: Team Gamma)
For the pin out of sensors see -> Appendix C. The infrared temperature sensor is focused on the
Can, because the Can is very thin aluminum, the Can will adapt the outer temperature very fast.
Everything will be glued together with hot glue, not the boards but rather the components to give
them a snug hold when the rocket starts.
Fig. 1 - Outer Hull of Apollo 12 (Picture: Team Gamma)
Page
16
2.2.2.2 Outer Hull
The outer hull will be mostly held together by the long screws and nuts. As seen in this figure.
This construction was tested under heavy G forces and withstood all tests. The tests were made
possible by ATLAS ELEKTRONIK GmbH and their shaker. With the next figure we want to show
you what we planned exactly. The screws will almost the whole force that will be present on our
CanSat at the time of starting the rocket. If we want to open the CanSat we need to open four screw
nuts then we can lift of the top half and the battery and power switch will be revealed.
Also we can lift out the entire Apollo 12 for inspection and/or repair.
Page
17
Fig. 14 – Hull (Picture: Team Gamma)
2.2.3 Battery
2.2.3.1 Battery Placement
The battery will be placed between the EM-411 and the SD Card board, as you can see in this
picture:
Fig. 15 - Battery Placement (Picture: Team Gamma)
2.2.3.2 Runtime
Fig. 16 - Power (Picture: Team Gamma)
As you can see our Apollo 12 needs a total of 1173.63mW to operate, this will be 236.8mA at
different voltages. Our battery has a voltage of 9V, to calculate our mA usage at this level we will
divide the total Watts through the battery voltage
1173.63𝑚𝑊
= 130.43𝑚𝐴
9𝑉
so we have 130.43mA at 9V. We need a minimum of 130.43𝑚𝐴 ∗ 3ℎ = 391.31𝑚𝐴ℎ to operate
our Apollo 12 for three continuous hours. The AGFAPHOTO Extreme Power has a capacity of
550mAh and is enough to drive our Apollo 12 for
500𝑚𝐴ℎ
= 3.8ℎ
130.43𝑚𝐴
Page
18
The battery has enough capacity to power the Apollo 12 to the wanted requirements of three hours
and a little puffer, because this is under ideal circumstances which will not be presented during
launch and/or arrival.
2.3 Software Design
2.3.1 Android Application Design
2.3.1.1 Structural Design
2.3.1.1.1 Task
The main task of our android application is the visualization of every value we get from our Apollo
12. There are various different ways to obtain information. The values can be obtained from the
database, a file, or the server running on our laptop. The application also shows the position from
Apollo 12 and uses Google Maps to show exactly where it is located near us. The last task is to
show our website team-gamma.de when you start the application.
2.3.1.1.2 Required Equipment
You only need a smartphone running Google Android with at least the version 2.3. Some devices
with a too little screen will not or not probably show the application, because there is no time to
develop the application for all screen sizes.
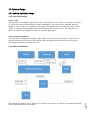
2.3.1.2 Data Coordination
Page
The general design idea was to split the GUI and receiver parts as we did in our ground station that
will be mentioned in the next section.
19
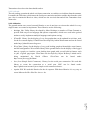
Fig. 17 - DataCoordination (Picture: Team Gamma)
The DataCoordination as seen in the figure above is mainly to – as the name says – coordinate data
to each different checkpoint. We have three ways of getting data:
1. Socket (Send from our laptop)
2. Database (MySQL)
3. Read (Data saved in files)
These can be selected directly in our android application. The DataCoordination looks up which way
is selected and respectively gets all the data in this way formats them right, makes a sensor bbject for
each sensor these will contain data of the sensor selected in the GUI. The GUI gets all the updated
sensor objects and looks up which the user wants displayed, now the GUI gets the sensor bbject
needed and displays the data from it.
The socket is just the way of sending sensor values from our laptop to our smartphone. The database
is just the MySQL database created for our website, but is implemented here for a more redundant
system. After the CanSat flight all values are saved in .txt files, if you still want to view the values
that is no problem. Everything you need to do is select the read from file option and the data will be
displayed.
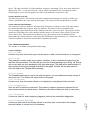
2.3.1.3 Graphical User Interface
2.3.1.3.1 Main Design
Our Android App works with the Android Navigation Drawer (sidebar). The Android Navigation
Drawer is located in the standard Android library and allows us to implement a sidebar which can be
open by sliding from the left border of the smartphone to the middle. The user can also open it by
pressing the button in the top left corner. When an element of this side menu is pressed a method gets
the position of the pressed element based on his position and saves the position as an ordinal.
This number will be given to a switch statement, which is like a filter for determining what to do with
the value. When the switch is called with the specific number, that is the position from the pressed
element in the slide menu, it calls needed functions in the case of pressing the right button. In this
case statement an object, which implements fragment, will be created and shown on the display.
When a class implements fragment it gives the programmer the opportunity to display this class on
the screen.
A class, which implements fragment, has a onViewCreate() method, which is called when an new
object of this class is created, and returns a View. The View includes a layout file which is saved in
an .xml file. In this layout file are text fields, buttons and any other kind of representable objects
defined. The onViewCreate() method is also able to change the text of text fields and nearly every
other representable object in the layout.
Page
20
These two things allow us to easily change the displaying content by pressing one of the Navigation
Drawer’s elements.
Fig. 18 - GUI workings (Picture: Team Gamma)
But this allows us only to display standard objects (buttons, etc.), which we need not mainly. Our
main aim was to have a live chart which displays the actual data the satellite collects. For this we
implemented the Androidplot library which allows us exactly that but with much less expenditure.
The Androidplot library is a free open source library which allows us to add a XYPlot to the .xml
layout file. A XYPlot is able to show a coordinate system and to show values on these. With this
features we are able to create a corresponding line chart in the application.
2.3.1.3.2 Options Menu
When we talk about options we mean everything the user can adjust in our application to his likings.
For example this includes the number of shown values when the user watches the live stream or as
another example the color in which the chart will be drawn. To make these options adjustable every
time, we created a number of classes which include the different options.
As one example for these options there is a ConnectionOptions.java class which includes a number
of Strings and every option has its dedicated String. There is one for the IP address, on for the Port
and so on. The ConnectionOptions.java implements our own options interface. An interface has
different functions which must be available in the class which implements the interface. This is
important for our Options.java which creates an object of each options class (ConnectionOptions.java
is only one example out of several classes which works with the same principle like the
ConnectionsOptions.java).
The Options.java has a singleton pattern which allows us to create only one object of this class. This
very important because if there are more objects of this class we would not have the same information
in each object. But with the singleton pattern which basically just has a function to get the own Object
from it getInstance(). Out of this object we can collect the data we need at the corresponding
situations.
2.3.1.4 Data Transfer
Page
Connection to a server starts via java socket, over this connection we receive the JSON String
messages. The messages are the measured values from Apollo 12. The String will be forwarded to
the DataCoordination, which forwards the data to the JSON class. In this class the message will be
casted to a JSONObject. With the help of the constant names Array in the Values class, the
JSONObject will be iterated through and all Values will be written into the respective Sensor
21
2.3.1.4.1 Realtime
object. The object will take 20 values and their respective timestamp. Every new value deletes the
oldest value. The – by the user selected – sensor will be forwarded to the realtimeGraph class
which displays it as a real time graph. All values will parallel be written into a file.
2.3.1.4.2 Recieval from File
The Read class opens a file and saves all values and their timestamp in an ArrayList of the type
Values, which takes one value and one timestamp. The ArrayList will transmit these to a chart.
2.3.1.4.3 Recieval from Database
The connection with our database, will start at the Databasecoordination class. This class starts a
new thread and takes the response from our database. The thread is the run-method of the
ConnectionRun class which connects the database with the Connection class. The response will be
casted to a JSONObject for easier analysis and the names of all sensor values will be given to the
Sensornames class. The DatabaseCoordination gives the response from our database to the
Sensordata class, which takes the values from the JSONObject and writes these to a ValuesList. The
ValueList returns an ArrayList which will be transmitted to a chart.
2.3.1.5 Software exposition
The Javadoc is located at team-gamma.de/docs/app
2.3.1.5.1 Packages
2.3.1.5.1.1 widget
Contains only one class which gives us the option to add a vertical seek bar to a fragment.
2.3.1.5.1.2 data
This package contains static and constant variables. It also coordinate the data from the
real time communication. The data will get from the Socket package as a String. All Strings
will convert with the Json package to the right data types. The data will be transmitted to a
class inside the Sensors package and then to the graph. Parallel will the data saved to
files with help of the Fileoperations package.
2.3.1.5.1.3 database
The Database package is used to connect the app to our own database and get values of
sensors from it. The values will transmitted to the graph.
2.3.1.5.1.4 filebrowser
Contains only one class which allows us to display the smartphone folder structure.
2.3.1.5.1.5 fileoperations
Here are all file operations executed. This packet is used to generate a separate file for
each measurement and each sensor. Moreover, the data is read back here to view them.
Page
2.3.1.5.1.7 fragments_androidplot
Contains a class which can display values in real time and a class which can display
imported values or values from our database.
22
2.3.1.5.1.6 fragments
Contains a class for each displaying fragment (without the androidplot fragments).
2.3.1.5.1.8 json
In this package all messages will converted to their right data types. All messages,
received from the Socket package, will be forwarded as a String to this Json package.
Json creates a JSONObject which allows us to translate the data into a useable data
format.
2.3.1.5.1.9 main
Contains the MainActivity which is called when the program starts.
2.3.1.5.1.10 options
Contains a class for each kind of options, a class which can handle with the different kind
of options and an enum within the names, as keys, for the different types of options.
Additional there is a class for the reading and writing in and out of the options.txt and a
class which generates a new options.txt when the app starts its first time.
2.3.1.5.1.11 sensors
The Sensor package saves data to a Sensor object. This Sensor object contains 20 values
and timestamps from one Sensor. For each new value, the oldest value will deleted and
the new value will appended to the last index. The Sensor object will be transmitted to the
graph to show the data.
2.3.1.5.1.12 socket
The Socket package provides the connection to the ground station. The Android
Smartphone works as a Socket-Client and gets data from the ground station which works
as a Socket-Server. The Server sends the message as a String to the Client (AndroidApplication). The Socket-Package forwards the String message to the Data-Package
2.3.1.5.1.13 value
This package works as a data type. The Value package contains the classes Value and
ValueList. The Value class contains an Array of Double with two indexes. The first consists
of a timestamp of a Value from a Sensor and the second consist of this respective Value.
The ValueList is a class who append easily timestamps and Values to a Value Object and
add this to a ArrayList.
2.3.1.5.1.14 webView
Contains one class which allows us to display our website into the application.
2.3.2 Ground Station Design
2.3.2.1 Structure
2.3.2.1.1 Task
The ground station was written in the interpreted programming language Java. To run the ground
station you only need a computer that is capable of running Java and the interpreter JRE7.
Page
2.3.2.1.2 Required equipment
23
The ground station is supposed to be the central point of communication. It is supposed to receive the
data transmitted by the CanSat, transmit it to the smartphone application for our CanSat, log the data
in a database, log the data in a local file, visualize the data and provide several options for visualizing
the logged data.
2.3.2.3 Software Exposition
The Javadoc is located at team-gamma.de/docs/ground.
2.3.2.3.1 Packages
2.3.2.3.1.1 control
The control-package contains the controller for the entire program and the GUI-Controller. Both, as
the same suggests, control certain parts of the program. The controller is the highest level access point
of the ground station and serves as communicator and controller for every process in the software.
The GUI-Controller mainly controls the graphical user interface of the software.
2.3.2.3.1.2 database
The database-package is responsible for the connection to the database and the sending of received
data to the database.
2.3.2.3.1.3 export
The export-package is responsible for everything that is related to the exporting algorithms, the
exporting menus and the display of the data. It contains the exporting panel which displays the
exporting options, the exporting algorithms for the various file formats, and the display panel for the
display of the data as graph and the display panel for the pictures logged by the CanSat.
2.3.2.3.1.4 livestream
The live stream-package does everything related to the display and the logging of the received data.
It consists of the live stream panel, which displays the data using a graph and a text field, the live
stream, which logs the data, generates random data in debug mode and inserts the received data into
the live stream panel, and the TransmittedData, which contains the values and units that are being
recognized by the ground station.
2.3.2.3.1.5 main
The main-package contains the MainFrame, which contains all the panels used for GUI-display, the
MainMenuPanel, which serves as the display for the main menu, and the DefaultPanel, which
contains several basic GUI configurations that are used in every panel of the GUI.
2.3.2.3.1.6 options
The options-package is responsible for the display of the options, using an OptionPanel, and the
administration of all the options shown on the OptionPanel in OptionKeys.
Page
2.3.2.3.1.8 transmitting
The transmitting-package is, as its name implies, responsible for the transmitting of the received data
to all other stations (smartphone application, website, etc.). It contains the Transmitter class, which
just coordinate all the transmission work. Also it contains the TransmitOptions class, which tells the
24
2.3.2.3.1.7 server
The server-package is responsible for the java socket server. We need a server like this to send the
data to our smartphone application. It contains the messages and the Server class: In the messages
class we can create messages (data), which will be send to all clients on the Server. The Server class
cares about the creation of the server and also handles the joined clients.
Transmitter class where the data should send to.
2.3.2.3.1.9 usb
The usb-package contains the whole serial port connection, to read the received data from the antenna.
It contains the USB class, which starts the serial port connection and also read the data from the serial
port. Also it contains the Receiver class, which save the received data and tell the Transmitter class
what to do.
huisinga_libs: Utility library developed by Marc Huisinga (a member of Team Gamma) to
provide with easy-to-use language and options components, which were used in the ground
station to easily implement multiple languages and options saving.
•
JChart2D: Library for the display of very fast graphs that can be updated in real time, used
for the live stream display. JChart2D was developed by Achim Westermann and can be found
under http://jchart2d.sourceforge.net.
•
JFreeChart: Library for the display of very good looking graphs with multiple extra features
and full configuration. We used this library in the ground station for the display of the logged
data as a graph, to visualize a neat looking time-graph with several built-in features such
as .pdf, .svg and .png export. JFreeChart was developed by Object Refinery Limited and is
being maintained by David Gilbert. JFreeChart can be found under
http://www.jfree.org/jfreechart/.
•
Jssc (Java Simple Serial Connector): Library for the serial port connection. We used this
library to create the connection to a serial port. JSSC can be found under:
https://github.com/scream3r/java-simple-serial-connector/releases .
•
Apache POI: We used this libraries for the xls exporter. With these libraries it’s very easy to
create Microsoft office files like .doc or .xls.
Page
•
25
2.3.2.4 Libraries
The ground station uses several external libraries so we do not have to reinvent the wheel for every
single feature we wanted to implement. These libraries are the following:
2.3.2.5 Livestream Design
Fig. 19 - Livestream Diagram (Picture: Team Gamma)
The liv stream of our ground station and of our android application is essential, that’s why we invest
a lot of time just programming and designing this part of our mission. The ground station live stream
is designed by Mr. Husisinga as shown in Fig. 19.
The CanSat sends its data to the DataReciever coded by Mr. Ciupka that will get the data via USB
receiver, the data received will then be passed on to our LiveStream Controller which will display all
the values on graphs and also show the values received in an nearby box. The DataWriter is a backup
system, when you think about how the application saves values. As example the LiveStream
Controller will save its data in variables and so that we have a redundant system alias crashes don’t
mean loss of data, we thought we need to directly save the values in an easy readable format, which
will be just a the received JSON object in an txt file.
Page
26
The LiveStream Controller is the one of the main components he houses just the logic to get
everything up and running in a controlled way. We just showed the Controller here, because there is
now good way to show everything GUI related. The GUI is also controlled by the LiveStream
Controller.
2.3.3 General Design
2.3.3.1 MySQL Database
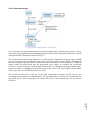
Fig. 20 - Table sensor_values
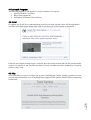
2.3.3.2 JSON
JSON is a format for transmitting data very easy, it has a
ready to go library for Java. We have no problems to get
the data, analyze it and then save and/or work with them.
JSON has to main components these being an Object
declared by these {} and arrays that are declared with [].
Fig. 21 - JSON format (Picture: Team Gamma)
JSON makes it very easy to get the data, just by as
example typing a little function call like this:
jsonobject.getDouble(‘temp’); this would get the value of temp as double in this case -17.6 which
then can be worked with.
Page
27
We did chose JSON, because we don’t think it’s necessary to recode library’s or formats that are
already available to the public and work like a charm. There is no point in doing a similar thing that
has the worse properties than what we can’t even do. It shows that we can adapt on things and are
willing to use the work of others to help us complete our tasks.
2.4 Recovery System
Fig. 22 – Excel Spreadsheet for calculating parachute diameter and area (Picture: Team Gamma)
One idea to recover our CanSat was to cushion it via a CO2 – Cartridge which would blast a little
airbag out of our CanSat, but that idea was abandoned, because of missing knowledge, missing
resources, it’s dangerous and it needs space too much space. Now we have made some research on
the topic of parachutes, how to build and calculate them. We have made an excel spreadsheet (Fig 1.)
to calculate how big our parachute needs to be to brake our falling CanSat to the guideline speed.
Fig. 23 – CAD of our Parachute (Picture: Team
Gamma)
The next equation is for calculating the minimum needed area of our parachute, this originates from
the book “Model Rocket Design and Construction”, 2nd Edition, from Tim Van Milligan.
𝐴𝑝 =
2gm
𝑝𝐶𝑑 𝑉²
Fig. 24 – Formula for calculating the minimum
area needed for a certain speed
Page
28
You can then see that every tile has the area originating from the parachute area divided by the number
of tiles. The final product looks like this:
Fig. 25 - The Final Product
2.5 Issues
In this Chapter we will list all major problems we came across and were stopping us develop our
satellite. We think that this is a good way to step into our minds.
2.5.1 Hardware Error UART to USB Bridge
There is a hardware error on the UART to USB Bridge where when you code your own program to
communicate with the bridge automatically turns RTS on, so the receiver goes in sleep mode. If you
turn the RTS back off it goes back to sending data normally. RTS stands for Request To Send. CTS
on the other hand means Clear To Send. The RTS signal is to indicate that the DTE requests the DCE
to prepare for accepting data. DTE stands for Data Terminal Equipment which is in this case our
Laptop the DCE (Data Communication Equipment) is the APC220, when you set RTS on it will not
send anything, because it is now prepared to get data not to send it.
We were really intrigued by this and spent a lot of time finding the fix, for a not known problem but
after many hours, we finally did manage to find a customer recession of the product which states the
error and fix, which consists of just turning RTS off.
2.5.2 Sloth Sensors
Page
29
In our guidelines it’s stated that the CanSat needs to send data every second and ongoing. Still we
had a little discussion on either we send data as soon as it’s available, but having more problems
working with it. Because it’s like a MySQL database with a whole table full of nulls with the
exception of the time field. We illustrated the two solutions and got with the first Solution.
Fig. 26 - Solution 1 (Picture: Team Gamma)
Fig. 27 - Solution 2 (Picture: Team Gamma)
Because of the sloth sensors, described in 2.5.2 we had many issues finding fast sensors for measuring
CO2 and CO we cancelled these objectives to focus on the other issues we had. The CO2 are sloth,
Page
2.5.3 CO2
30
Of course there would have been much more solutions to this problem, saving the data and then
sending it and much more, but for our Apollo 12 these two were the best and we got with the first
Solution.
because of their heating element - which in some cases - needs a horrendous amount of time to heat
up, before good measurements can be made.
Fig. 28 – TGS 2600-B00 Specifications (not CO2) (Picture: TGS 2600-B00
Datasheet)
These figures show that we could first of all only measure once in perfect conditions and also we
would need about 7 days of preheating which on battery is nearly impossible.
Fig. 29 – MD62 CO2 Gas Sensor Specifications (Picture: MD62 Datasheet)
You could try and preheat the heating element yourself, but you’re in risk of destroying parts that
don’t compensate for that heat.
We could have used other gas sensors, but all in all the searching of a suitable sensor was too time
consuming. That’s why the idea was completely abandoned.
2.5.4 Changing the Plan & Time Schedule
Because of many issues, which came to us while we were finished with the planning phase, we lost
time and were in need to change our general Apollo 12 measuring plan. The components were ordered
but they did arrive a week later than expected which did throw us back again.
Most of the components were tested fast and the plan for our construction was already completed,
after placing everything were it should have been belonged, it didn’t fit. Neither in the Can nor on the
boards itself. We needed to change our plan again.
The Arduino Software was completed fast and was built to be able to change the PINs very fast and
easy. The only problem was to engineer our CanSat the way we planned. In the end, we have invested
a horrendous amount of time in the building of our CanSat, but we also planned enough time for this,
that’s why everything can still be finished as planned.
2.5.5 Arduino Crash (SoftwareSerial)
Page
31
As we were beginning to code our Arduino or so to say the T-Minus main board. There was a problem
that, if we would use the this-fix for our code and then try to access the Software Serial object we
created to communicate with our GPS module. But after trying to see if data is available, the Arduino
crashes and reboots. We did not find any fix or the actual problem. No one seems to have this kind
of problem, because Arduino’s IDE is not the best for bigger projects like this one.
2.5.6 Internal Guidelines
We have very strict internal guidelines and planning for everything there is between groups. Like
code style, database structure, but not every member does fulfill these guidelines all the time, that’s
why sometimes we had issues that shouldn’t have been there in the first place.
In the end, the making of these guidelines was very good and helped us a great amount in completing
our Apollo 12 faster and without more problems than needed.
2.6.6 Arduino Memory leak Issue (JSON)
The Arduino never printed more than 12 JSON objects to the screen and then just stopped for a
unknown reason. Our idea was that this was caused by a memory leak, so we used a library which is
used for memory diagnostics (https://github.com/sudar/MemoryFree/) which offered a function to
determine the remaining available memory.
First we stopped printing the JSON to the screen to make sure that we could track every possible error
source. We saw that the free memory was decreasing a lot after reading, while reading the values, the
Arduino creates aJsonObjects. After searching and trying to free the memory using the C++ delete
operator we found the function aJson.deleteItem(*aJsonObject) to free memory used from
aJsonObjects, after this we diagnosed that no more memory was leaked while reading the values.
Fig. 30 - The memory leak causing function (Picture: Team Gamma)
Page
32
After this we started printing again and traced the memory after each dataset, after running the
diagnostics we were sure there was another memory leak. We inspected the aJson library’s print
function, we searched for the implementation of the print function in the source files of aJson. As
you can see in the screenshot the function allocates 256 bytes of memory used to store the JSON byte
wise. Our problem was that the pointer returned by print was directly used as an argument for
Serial.println() and so there was no reallocation of reserved memory, we changed our code so that
the pointer was first stored in a local variable and was freed using free(void *) after printing our JSON
to the screen, so the memory leaks were fixed.
3 Project Planning
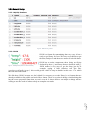
3.1 Time Schedule of the CanSat Preparation
Page
33
Fig. 31 – Time plan
3.2 Resource Estimation
3.2.1 Budget & Components
Budget is a very big factor for our project, so this is estimated very carefully. One of the bigger
problems was to get financial support for the flight. From Germany there is no easy way to get to
Andones Norway, our travel is were the most money lies. The Fig. 21 shows everything we estimated
for sensors.
Fig. 32 – Spreadsheet for Sensors (Picture: Team Gamma)
The travel expense is about 2500€. The material cost for the antenna and some other equipment are
not listed, because these were sponsored by ourselves, estimated about 500€
3.2.2 External Support
We did talk to many external companies and public media. Most of them did respond kindly.
Rheinmetal Defense that they would really like to sponsor this project, because the love the idea, but
they are currently in a not so good state for a company.
At OHB Systems GmbH we got an immediate response, because we had a contact person Frank
Ellmers, from the external spokesperson that is Mr. Stade, he would arrange a meeting with Dr. Fritz
Merkle that is a member of the executive board of OHB Systems GmbH and also a professor of nature
sciences.
After this meeting, OHB Systems GmbH or more to say Mr. Merkle agreed to sponsor and help Team
Gamma with the financial and other resources. Financially with 2500€ (two-thousand-five-hundred),
with other resources we mean that for example there is a shaker at the OHB Systems GmbH which
can simulate high G forces on our Can for testing purposes.
Watterott also agreed to sponsor us with their components, we can order 75€ (seventy-five) worth of
sensors free of charge.
Page
34
Distrelect is one of the late sponsors which agreed to sponsor us our needed components from their
warehouse. Our contact person was Erik Gravenius, he and his company did sponsor us all the parts
listed in the Figure in 3.2.1 Budget & Components.
3.2.3 Time
3.3 Test Plan
The whole system will be tested within the range of 09.05.2014 to 29.05.14. Everything will be
already tested to that point in it on respect, everything together will be tested within these 20 days, as
well as fixed and polished. It’s a pretty tuff schedule but for us this is totally fine because we had
enough time to probably build our Apollo 12 and all its software.
3.4 Test Results
Page
35
As first test we did test the transmitter for the 1000m range and tried to send data, which in an open
field is no problem (without a hull). As a second test we tried it with our Yagi-Uda-Antenna which
was also successful over an even bigger distance (without the can).
4 Outreach Program
The outreach program of our Apollo 12 project contains a few aspects:
1. Social (Facebook, YouTube)
2. Blog (team-gamma.de)
3. Newspaper of Bremen (Weser Kurier)
4.1 Social
Everything we do will be recorded and then posted on our blog, but the videos will be uploaded to
YouTube and a little status update with a link to our blog post will be posted on Facebook.
Fig. 33 - Example post (Picture: Team Gamma)
Facebook was chosen because nearly everybody has a Facebook account and can like and spread the
word for our Apollo 12 and YouTube, because it’s freely available and can be watched by everybody
whenever they want.
4.2 Blog
Fig. 34 - Example Post (Picture: Team Gamma)
Page
36
Over at our blog everyone can follow our process of building the CanSat, getting a general overview
over our mission and also to see if anything fancy happened, like sponsor partners and/or completing
various task.
4.3 Logo Idea
We designed the logo with one of our main ideas in our back heads, simplicity we
wanted to create something that is simple and good looking at the same time that
is how we got the idea for our simple but still good looking logo. Also our team
name which is related to the canceled idea of measuring radioactivity was also why
we choose the gamma symbol for our logo.
4.4 Other
Fig. 35 – Logo (Picture:
Team Gamma)
A presentation in our class also gave everyone an idea what we are doing and why. The whole class
shared our Facebook fan page and is neatly following our progress as well as spreading the word.
The local newspaper here in Bremen, Germany is called the Weser Kurier which already published a
news article about us and will publish one after or before the competition in Norway.
The internal newspaper of the OHB System AG will also have an article about us and how the OHB
System AG interacts with us.
Page
37
We are also in contact with a few more alternatives, which are the local television and some other
newspapers/-sites.
5 Internal Guidelines
5.1 Language
Because our team is German, we needed a way of separating German and English and that’s why
we made a little table to see when to use German and when English.
English:
1. Code
a. Comments
b. Javadoc
2. Documents
a. Progress Report
b. Design Document
3. Social
a. Facebook
b. Blog
c. YouTube
German:
1. Meetings
2. Dropbox
a. Folder
b. Files
3. Internal documents
5.2 Data Management
Page
Fig. 36 - Dropbox Folder (Picture: Team Gamma)
38
Data management is a very important factor for us, we need to overlook all the data we have,
because at the moment of 28th May 2014, we have:
Our Dropbox is organized as follows:
1. Ground station
a. Planning
b. Libraries
2. Construction and technic
a. Antenna
b. Arduino code
c. Parachute
d. GPS
e. JSON
f. Sensors
3. Organization
a. Pictures
b. General documents
i. Meetings
ii. CanSat Kit documents
c. General planning
d. Documentation
4. Android Application
a. Code
b. Data transfer
c. Planning
d. Other
5. Issues
Page
39
This is of course very general and in the Fig. above you can see much more folders and files.
Everything is documented in our Dropbox and can be seen upon request.
Appendix A – Ground Station User Manual
After starting the program a graphical user
interface opens, displaying the main menu of
the ground station. The main menu offers
three options and an exit button to close the
application.
Livestream
Pressing the live stream-button takes you to
the live stream of the ground station. The live
stream is used for processing the received
data. For more information on the live
stream, see → A.1
Export
pressing the export-button takes you to the exporting-options of the ground station. These options
give you the ability to process the data that is logged by the live stream. For more information on
exporting, see → A.2
Options
pressing the options-button takes you to the option menu of the ground station. In the options you can
change various things about how the ground station behaves. For more information on the options,
see → A.3
A.1 Livestream
The live stream serves as general
communicator between the CanSat, the
ground station and the smartphone devices.
When starting the live stream, the ground
station starts expecting data, eventually
forwards the data and logs the data.
The GUI of the live stream consists of a graph
to display the received data, a scrollable text
field for direct display of the received values,
a menu bar offering the ability to adjust the
axes of the graph, a stop-button, which stops
the receival of data, a pause-button, which pauses only the display of data, and a back-button, which
takes the user back to the main menu and ends the live stream.
A.2 Export
Selecting this option will allow for an export to the .kml format. This format is used by Google Earth
to display routes. In our ground station, exporting to .kml exports the GPS data that is logged by the
Page
A.2.1 Export to .kml
40
The export menu allows for several options to
process the data logged by the live stream.
Selecting each of these options will open up
file browser, asking for input (mostly .csl
format) and sometimes even output locations
for the data that is supposed to get exported.
Pressing the back-button takes you back to the
main-menu.
ground station to something that can be processed by Google Earth to display the route of the satellite.
A.2.2 Export to .xls
Selecting this option will export the selected data to the .xls format. .xls is a format used by Microsoft
Excel and in this case used to display the data in Microsoft Excel, using a table and a graph.
A.2.3 Export to .csv
The .csv export is a simplified version of the .xls format. .csv is a really simple table format and can
be imported by every table editor or even databases. In our .csv-export, the first line is used for column
names, each column is separated by a comma and each row is separated by a new line.
A.2.4 Export to .txt
The .txt export serves as a really basic export of the collected data to the text format .txt. .txt is the
most basic text format. In the exported .txt document only the transmitted data will be found in an
easily readable format.
A.2.5 View logged pictures
The “view logged pictures” option is used to
visualize the pictures taken by the camera on
our CanSat.
It displays the selected pictures with the speed
the pictures were taken with. Pressing the
“Pause” button will pause the video and
pressing the “Back” button will take you back
to the exporting menu.
A.2.6 Visualize data
“Visualize data” will visualize the selected
data in a graph. You can zoom in on the graph
by selecting an area you want to zoom onto.
Right clicking onto the graph will give you
several more options for the configuration of
the graph and also the exporting of the graph.
Page
41
These options mainly consist of an optionsmenu to configure the displayed graph, a
function to copy the graph to your cache, a
function to export the graph to .png, .svg
and .pdf, and an option to print the graph.
A.3 Options
“Options” will provide you several options to
configure the live stream.
“Activate debug mode” activates a debug live
stream where random data is generated instead
of received to test the ground station while it is
not connected to a CanSat. This option also
turns off the automatic FPS-calculation for the
exporting option “View logged pictures”, so
you can test this option with pictures that
weren't generated by the camera on our CanSat.
“Save received data” determines if the received
data should be logged into a .csl file or not.
“Stream data to smartphone” determines if the received data is being forwarded to the smartphone
application.
“Stream data to website” determines if the received data is being forwarded to the database and with
that to the website stream.
“Language” allows you to select the language of the ground station.
“API-key” gives you the ability to change the API-key used when communicating with the database
that is connected to the website.
Page
42
“Location of log files” determines the output location of the .csl files logged by the live stream. You
can alter this option by clicking on the field that contains the file path.
Appendix B – Android Application User Manual
B.1 General info
When you start our application the first time you have to generate a new options.txt by clicking on
the displayed button. If you already have an existing options.txt you can select and open it.
It is quite easy to use our android application. The main navigation is handled by the navigation
drawer (slide menu) which can be open by a slide from the left to the right or by pressing the button
in the upper left corner of your screen.
When the navigation drawer opens you can choose your favorite element out of a number of
displaying elements. I hope this little information will help you to understand how to use the different
elements we developed for you.
B.2 Button
B.2.1 Home
Shows the home screen with our website
B.2.2 Sensor names
If you are connected to one of our java socket server you can watch a real time stream of the chosen
sensor values here.
B.2.3 Last position
This little point gives you the option to watch the latest GPS position of our satellite in google maps,
if it is installed on your phone. This is also only available if you are connected to one of our java
socket servers. If you want to watch the landing position of our last flight pleas go to the import
interface.
B.2.4 Import
Here you have two options: you can connect to our database or you can import values from a file. If
you want to import from a file click on the “browse” button. A new interface will open on which you
can select the file you want to open. But if you decide to connect to our database there will be a list
of buttons displaying the possible sensors.
B.2.5 Options
If you chose options you have to decide between three different types of option. The “Chart view
options” gives you the possibility to change the color of the displaying plot and the number of shown
values in a real time chart.
Page
43
The “Connection” options give you the possibility to enter a port and an IP address of one of our java
socket servers and connect to them. Last but not least the “Export” options gives you the possibility
to change the director of automatically saved files.
Page
44
Appendix C – Sensor Pin Out