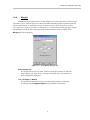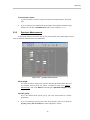
1
®
GEOSYSTEM SHEAR
Axial and Direct Shear Module
for GEOSYSTEM® for Windows
Copyright © 2004 Von Gunten Engineering Software, Inc.
363 West Drake #10
Fort Collins, CO 80526
www.geosystemsoftware.com
Information in this document is subject to change without notice and does not
represent a commitment on the part of Von Gunten Engineering Software, Inc. The
software described in this document is furnished under a license agreement, and the
software may be used or copied only in accordance with the terms of that agreement. The
licensee may make copies of the software for backup purposes only. No part of this
manual may be reproduced in any form for purposes other than the licensee’s personal use
without the written consent of Von Gunten Engineering Software, Inc.
Copyright © Von Gunten Engineering Software, Inc. 2004. All rights reserved.
Published in the United States of America.
GEOSYSTEM® is a registered trademark of VES, Inc.
Windows® is a registered trademark of Microsoft Corporation
Terms of License Agreement
1. The Licensee agrees not to sell or otherwise distribute the program or the
program documentation. Each copy of the program is licensed only for use at a
single address.
2. The Licensee agrees not to hold Von Gunten Engineering Software, Inc. (VES,
Inc.) liable for any harm, damages claims, losses or expenses arising out of any
act or occurrence related in any way to the use of the program.
3. The program is warranted to fully perform the tasks described in the program
documentation. All results of the operation of the program are subject to the
further engineering judgment, prudence, and study of the user.
4. If the program does not perform as described, VES, Inc. will replace the
program or refund the fee paid in the licensing agreement, at its option. In no
event will VES, Inc. be liable for any amount greater than the total of the
license fee or fees paid by the licensee.
5. One year of free consultation and updates is included with the program. In
subsequent years, updates will be available, for a fee, at the user’s option.
1.
1.1
INTRODUCTION, INSTALLATION AND SETUP..........................1
INSTALLATION.............................................................................................. 2
1.2
CONFIGURING SHEAR................................................................................. 3
1.2.1 General........................................................................................................................3
1.2.2 Units............................................................................................................................4
1.2.3 Reporting....................................................................................................................5
1.2.4 Margins ......................................................................................................................8
1.2.5 Triax ...........................................................................................................................9
1.2.6 Direct Shear............................................................................................................ 10
1.3
CONTAINER WEIGHT DATABASE ...............................................................11
1.4
WALKTHROUGH .........................................................................................12
2.
DATA ENTRY...............................................................................13
2.1
SAMPLE INFO..............................................................................................13
2.1.1 Additional Sample Information Required for Triaxial Tests................... 16
2.1.2 Additional Sample Information Required for Direct Shear Tests ........... 18
2.2
SHEAR TESTING DATA ............................................................................19
2.2.1 Moisture Content Data........................................................................................ 19
2.2.2 Specimen Measurements ..................................................................................... 20
2.2.3 Test Parameters..................................................................................................... 23
2.2.4 Test Readings......................................................................................................... 25
2.3
COPYING AND PASTING SHEAR DATA .....................................................28
2.4
DELETING A SHEAR TEST ........................................................................29
2.5
IMPORTING DATA FILES CREATED WITH THE DOS SHEAR PROGRAM....29
3.
CURVE DISPLAY..........................................................................30
3.1
MOHR'S CIRCLES CHART DISPLAY .............................................................30
3.2
P-Q CHART DISPLAY ..................................................................................31
3.3
DIRECT SHEAR CHART DISPLAY ................................................................32
4.
REPORTING YOUR DATA...........................................................34
4.1
XML FILES .................................................................................................34
4.2
DATA SUMMARY REPORTS.........................................................................35
4.3
CHART REPORTS ........................................................................................35
4.3.1 Report Preview Display....................................................................................... 39
4.4
EXPORTING REPORTS TO FILES ..................................................................39
4.5
COPYING REPORTS TO THE WINDOWS CLIPBOARD ....................................42
4.6
LISTING RESULTS FROM MULTIPLE SHEAR TESTS ...................................42
5.
TECHNICAL DOCUMENTATION ................................................44
5.1
INITIAL SPECIMEN PARAMETERS................................................................44
5.1.1 Initial Moisture Content ..................................................................................... 44
5.1.2 Calculating Initial Moisture Content without Initial Moisture
Content Data 44
5.1.3 Initial Wet Density .............................................................................................. 45
5.1.4 Initial Volume........................................................................................................ 45
5.1.5 Initial Cross-Sectional Area for Round Specimen ........................................ 45
5.1.6 Initial Cross-Sectional Area for Square (DS) Specimen............................. 45
5.1.8 Initial Dry Density............................................................................................... 45
5.1.9 Initial Saturation.................................................................................................. 46
5.1.10
Initial Void Ratio............................................................................................. 46
5.2
CORPS OF ENGINEERS UNIFORM STRAIN CALCULATIONS ..........................46
5.2.1 Saturated Moisture Content............................................................................... 46
5.2.2 Saturated Dry Density ........................................................................................ 47
5.2.3 Saturated Saturation ........................................................................................... 47
5.2.4 Consolidated Moisture Content ......................................................................... 47
5.2.5 Consolidated Dry Density .................................................................................. 48
5.2.6 Consolidated Saturation ..................................................................................... 48
5.2.7 Consolidated Area ................................................................................................ 48
5.3
CORPS OF ENGINEERS (SATURATION ASSUMED) CALCULATIONS..............49
5.3.1 Saturated Moisture Content............................................................................... 49
5.3.2 Saturated Dry Density ........................................................................................ 49
5.3.3 Saturated Saturation ........................................................................................... 50
5.3.4 Consolidated Moisture Content ......................................................................... 50
5.3.5 Consolidated Dry Density .................................................................................. 51
5.3.6 Consolidated Saturation ..................................................................................... 51
5.3.7 Consolidated Area ................................................................................................ 51
5.4
ASTM D 4767 METHOD A CALCULATIONS ..............................................52
5.4.1 Saturated Moisture Content............................................................................... 52
5.4.2
5.4.3
5.4.4
5.4.5
5.4.6
5.4.7
Saturated Dry Density ........................................................................................ 52
Saturated Saturation ........................................................................................... 53
Consolidated Moisture Content ......................................................................... 53
Consolidated Dry Density .................................................................................. 53
Consolidated Saturation ..................................................................................... 53
Consolidated Area ................................................................................................ 54
5.5
ASTM D 4767 METHOD B CALCULATIONS ...............................................54
5.5.1 Saturated Moisture Content............................................................................... 54
5.5.2 Saturated Dry Density ........................................................................................ 55
5.5.3 Saturated Saturation ........................................................................................... 55
5.5.4 Consolidated Moisture Content ......................................................................... 55
5.5.5 Consolidated Dry Density .................................................................................. 56
5.5.6 Consolidated Saturation ..................................................................................... 56
5.5.7 Consolidated Area ................................................................................................ 56
5.6
ASTM D 4767 METHOD B WITH SATURATION ESTIMATE
CALCULATIONS ..................................................................................................................57
5.6.1 Saturated Moisture Content............................................................................... 57
5.6.2 Saturated Dry Density ........................................................................................ 57
5.6.3 Saturated Saturation ........................................................................................... 58
5.6.4 Consolidated Moisture Content ......................................................................... 58
5.6.5 Consolidated Dry Density .................................................................................. 58
5.6.6 Consolidated Saturation ..................................................................................... 58
5.6.7 Consolidated Area ................................................................................................ 58
5.7
CORPS OF ENGINEERS UNIFORM STRAIN WITH WATER VOLUME
MEASUREMENTS................................................................................................................59
5.7.1 Saturated Moisture Content............................................................................... 59
5.7.2 Saturated Dry Density ........................................................................................ 60
5.7.3 Saturated Saturation ........................................................................................... 60
5.7.4 Consolidated Moisture Content ......................................................................... 61
5.7.5 Consolidated Dry Density .................................................................................. 61
5.7.6 Consolidated Saturation ..................................................................................... 61
5.7.7 Consolidated Area ................................................................................................ 62
5.8
SATURATED VOID RATIO ...........................................................................62
5.9
CONSOLIDATED VOID RATIO .....................................................................62
5.10
FINAL MOISTURE CONTENT .......................................................................63
5.11
STRESS AND STRAIN CALCULATIONS - TX AND UCC.................................63
5.11.1
5.11.2
Compression
5.11.3
5.11.4
Strain Calculations - TX and UCC ............................................................. 63
Deviator Stress Calculations - Triaxial and Unconfined
64
Unconfined Compression Undrained Shear Strength ............................. 66
Triaxial Principal Stresses and Stress Paths ............................................ 66
5.12 DIRECT SHEAR STRESS AND DEFORMATION CALCULATIONS ....................66
5.12.1
Deformation Calculations.............................................................................. 66
5.12.2
Direct Shear Stress Calculations .................................................................. 67
5.13
TRIAXIAL MOHR'S CIRCLES AND TANGENT ENVELOPE CALCULATIONS....68
5.14
DIRECT SHEAR TANGENT LINE CALCULATIONS ........................................69
5.15
CALCULATION DIFFERENCES FOR STAGED TESTS ......................................69
5.16
ONLINE TESTING SETS ...............................................................................70
5.17
VALUES AVAILABLE FOR DATA SUMMARIES..............................................71
1. Introduction, Installation and Setup
The GEOSYSTEM Axial & Direct Shear module (SHEAR) is designed to reduce laboratory data
from triaxial, direct shear and unconfined compression tests. Following is a list of supported features:
⇒
⇒
⇒
⇒
⇒
⇒
⇒
⇒
⇒
⇒
⇒
⇒
⇒
⇒
⇒
Triaxial pore pressures
Drained test outflow buret readings
Direct shear vertical deformation measurements
Both English and SI (metric) units with automatic unit conversion.
Utilizes the GEOSYSTEM Data Manager program (GDM) for file handling: project
information such as the project name and number is entered only once per project.
GDM can be used to create printed lists of all of the SHEAR tests performed for a
given project.
Supports unconsolidated undrained, consolidated undrained, consolidated undrained
with pore pressures, and consolidated drained triaxial tests
3 triaxial test report formats
Interactively adjust the strength tangent envelope
Plot pore pressure versus strain and the stress path diagram for triaxial tests
Compatible with Corps of Engineers and ASTM procedures
Calculates moisture, density, saturation and void ratio for initial, saturated, and
consolidated phases
Staged load ring constants are permitted, as well as separate constants for each
specimen
Test reports may list up to four specimens
Printed summary lists all testing data and results
Report export to .EMF (word-processor picture), .DXF (CAD) and .PDF (Acrobat
Reader) files.
Since SHEAR utilizes the GEOSYTEM Data Manager program (GDM) or LD4 package for all
file handling, the user should review the GDM or LD4 manuals before proceeding.
1
Introduction, Installation and Setup
1.1 Installation
By itself, SHEAR is not a complete system; the program must be installed into a hard disk or
network subdirectory that already contains a copy of the Data Manager or LD4 (Drilling Log) packages.
(To enter a new SHEAR test, you must first use the Data Manager or LD4 package to open or create a
project file.)
⇒
If you haven’t licensed the Drilling Log package (LD4), SHEAR requires the
GEOSYSTEM for Windows Data Manager (GDM) software, version 2 or later. A
compatible version is automatically installed when you install SHEAR; after
installing, you might want to check the GEOSYSTEM web site
(www.geosystemsoftware.com) for any available updates.
Installing SHEAR is simple: place the program’s CD into a CD drive. If the installation program
doesn’t automatically start, double-click on your My Computer desktop icon, navigate to your CD drive
and double-click on the SETUP program.
⇒
⇒
⇒
If you have already licensed the GEOSYSTEM Drilling Log program or any other
GEOSYSTEM Windows programs, you must install SHEAR into the same hard disk
or network subdirectory.
If you are installing the software onto a network server, please refer to the Networks
section in the LD4 manual or the Network Installation section in the Data Manager
manual before proceeding with the installation.
If you’re adding SHEAR to an existing GEOSYSTEM for Windows installation, you
can make sure that SHEAR was installed correctly by starting the GEOSYSTEM for
Windows package: SHEAR should be listed next to the Installed modules: title
on the right side of the opening screen.
2
SHEAR User’s Guide
1.2 Configuring SHEAR
SHEAR includes support for a few different testing and recording procedures – before typing in
your first test set you should make sure that the package is correctly configured. To do this, start up your
GEOSYSTEM for Windows package (refer to either the GDM or LD4 manuals for instructions) then select
Options > SHEAR Setup.
⇒
1.2.1
Note that these settings affect every test entered into the current project file.
General
Figure 1.2.1 -- Setup Dialog, General Settings Tab
Moisture content uses
SHEAR can be set up to keep a list of container IDs and associated weights -- when
entering moisture content data, instead of entering the container weight you can enter
the container ID and the program will look up the associated weight. To do this,
select Tare ID in this box then enter your list of container IDs and weights into the
program's container database (Options > Container List).
Allow single-specimen test charts (P-Q, Mohr's, peak/residual) to have
tangent lines
When this option is turned off, P-Q, Mohr's and peak/residual stress charts for a
single specimen do not show a tangent line.
Prompt text color
Sets the color of the data entry prompts shown on the Sample Info. and Specimen
# tabs. Click Set to select a color or Reset to restore the program's default color.
3
Introduction, Installation and Setup
Navigation tab placement
Navigation tabs allow you to change from one window to another (for example,
between the specimen data entry window and the report preview window). The tabs
look like this:
The tabs may be placed at either the top of the bottom of the screen by selecting one
of the Navigation tab placement options.
1.2.2
Units
Figure 1.2.2 -- Setup Dialog, Units Tab
Data entry:
Specimen weight
Selects the units used to measure the initial specimen weight (grams or lbs.).
Fluid pressure
Specifies the units used to measure pore pressures.
Dimensions
Determines the units used for dial readings, specimen heights, etc.
4
SHEAR User’s Guide
Reports:
When listing your data on one of the program's chart reports, SHEAR can convert your
measurements into different units. This capability allows you to, for example, take all of your data in
Imperial units and report in SI units. (The conversion does not change the data that you've entered, it
merely reports your measurements in different units.) The Reports section selects the chart report units: if
you do not want to convert your data, make sure that the Reports selections match those in the Data entry
section.
Density
Selects the units used to reporting unit weights.
Stress
Selects the units used for reporting calculated stresses.
Fluid pressure
Pore pressure units: may be different from the Fluid pressure units selected in the
Data entry box in order to report pore pressures in different units than the ones with
which they were taken.
Dimension
Determines the length units in which dial readings, specimen diameters and heights,
etc. are reported. May be different from the Dimension setting in the Data entry
box in order to report length measurements in different units than the ones with
which they were taken.
1.2.3
Reporting
Figure 1.2.3 -- Setup Dialog, Reporting Tab
5
Introduction, Installation and Setup
Rate of strain reported as
Three choices for this selection (Strain rate, in./min., Time to
failure, min. and Strain rate, %/min.) merely determine how the
user-entered rate of strain measurement is labeled on reports. The fourth choice,
Strain at peak, %, causes the program to report the strain calculated at peak
stress instead of rate of strain.
Load reading and load precision
The program automatically selects the precision to be used for reporting load dial
readings and calculated load values. In cases where the dial readings and loads are
larger than normal (such as when testing 6 inch diameter and larger specimens), it
may be necessary to reduce the precision to avoid having the dial readings and loads
overrun their boundaries on the hardcopy printouts.
If printed reports show that load dial readings or loads are overprinting adjacent data,
change the Load reading and load precision selection to nearest whole
number; for lighter loads, select nearest 0.1.
Report Phi to
Selects the precision used for reporting p-q, Mohr's circles and direct shear tangent
angles.
Label specimen numbers
Changes how specimen numbers are labeled on reports: this may be, e.g., Sample
No. or Specimen No. or Lab. No.
Include specimen number on stress-strain charts
Checking this option causes the program to label individual curves on stress-strain
charts with the number of the specimen used to produce the curve. (Specimens are
numbered 1-4 in the order in which they are entered.) Because stress-strain charts
include curves from all the specimen entered into the current file, it can be difficult
to determine which specimen produced a given curve if the Include specimen
number... option is not selected.
Additional decimal precision for all testing results
Strengths, cohesions and failure pore pressures are all reported using a commonly
accepted number of decimal places for the measurement units being used. To add an
extra decimal place to these values, check the Additional decimal... box.
Additional decimal precision for reporting dimensions
Diameters and heights are reported using a commonly accepted number of decimal
places for the measurement units being used; checking the Additional decimal
precision... box adds one more decimal place.
6
SHEAR User’s Guide
Staged tests
Determines how the stress and strain values calculated for staged tests are reported:
•
Restart stress & strain at 0 for each stage
Each stage's stress and strain values begin with 0 at the start of the stage.
•
Stress & strain accumulates from first stage
Each stage's stress and strain values begin with the previous stage's final stress and strain.
•
Strains accumulate, stress restarts at 0
Each stage's strain values begin with the last stage's final strain, but the stress values
restart at 0 with the start of each new stage.
Include disclaimer on chart reports
If selected, a disclaimer is printed down the left margin of chart reports. The
disclaimer is listed in the Disclaimer field directly below the checkbox, and may be
modified after checking the Include disclaimer... box.
Drop "Tested by" from reports if a name is not entered
The Sample Info. window includes a data entry field titled Tested by. This field,
along with the Drop "Tested by" from reports if a name is not entered
checkbox on the program's setup dialog affects the appearance of chart reports:
•
If the Tested by data entry field is left blank and Drop "Tested by" from reports if
a name is not entered is not checked:
"Tested by"; will appear below chart report's bottom margin, along with an area for a signature.
•
If the Tested by data entry field is left blank and
Drop "Tested by" from reports if a name is not entered is checked:
"Tested by" will NOT appear below chart report's bottom margin.
•
If the Tested by data entry field is filled in:
"Tested by" will appear below chart report's bottom margin, followed by the name entered into the
Tested by field.
Drop "Checked by" from reports if a name is not entered
Is similar to Drop tested by..., discussed above. Leaving this box unchecked, and
leaving the Checked by data entry field blank provides an area below chart reports'
bottom border for the report's reviewer to sign the page.
7
Introduction, Installation and Setup
1.2.4
Margins
SHEAR features two printed reports: one that summarizes your raw testing data in a tabular format
(the summary report, shown in Figure 4.2.1) and a second that reports the program’s calculated results and
includes charts of stress vs. strain, Mohr’s circles, etc. (the chart report, shown in Figure 4.3.1, Figure
4.3.2, Figure 4.3.3, Figure 4.3.4, Figure 4.3.5 and Figure 4.3.6). You can change both report type’s margins
(the whitespace between the sides of the page and the borders around the report) by clicking on the
Margins tab of the Setup dialog.
Figure 1.2.4 -- Setup Dialog, Margins Tab
Select margins for
This drop-down box selects for which of the two report types (summary or chart) the
margin changes will apply. Prior to entering new margins, make sure that this box
shows the appropriate report style.
Top, Left, Right and Bottom
The measurement units that are used for the report margins (inches or centimeters)
are determined by the Regional Options in your Windows Control Panel.
8
SHEAR User’s Guide
1.2.5
Triax
Figure 1.2.5 -- Setup Dialog, Triax Tab
Minimum strain scale range (0.2%-100%)
This setting can be used to ensure that all stress-strain charts produced with the
program share the same strain scale: specify the minimum strain scale as the desired
strain scale maximum for all the charts. (As long as all of the strain data fit within
your selected minimum scale, the program will use your selected strain scale range.)
⇒
To leave the strain scale selection up to the program, enter 0.2 into the field.
Label failure stress as
Label ultimate stress as
The terms used on reports to label the deviator stress at failure and ultimate deviator
stress may be changed.
⇒
The labels typically used are Failure Stress and Ultimate Stress,
respectively.
Mark failure point on P-Q charts with a circle
Since P-Q charts show the stress path through to the end of the test, the failure point
may be indistinct: checking the Mark failure point... box causes the program to
place a circle at the specimen failure point on P-Q charts.
9
Introduction, Installation and Setup
Mark ultimate point on P-Q charts with a cross
Since P-Q charts show the stress path through to the end of the test, the ultimate
point may be indistinct: checking the Mark ultimate point... box causes the
program to place a cross at the specimen ultimate point on P-Q charts. (Note that the
ultimate stress point must be manually selected for each specimen: refer to § 2.2.4
for details.)
Report pore pressures as excess
The pore pressures reported with consolidated/undrained tests can either be absolute
or excess. Selecting Report pore pressures as excess causes the program to
subtract the initial pore pressure from all subsequent readings, so the values reported
are the excess pressure from the initial. (This selection also applies to the pore
pressure graphs shown on the second page of the triaxial test report.)
Do not summarize ASTM Method B saturated params.
If selected, calculated saturated values (diameter, density, void ratio and saturation)
will be omitted from the program's data summary report for ASTM D 4767 Method
B tests.
1.2.6
Direct Shear
Figure 1.2.6 -- Setup Dialog, Direct Shear Tab
Label failure stress as
Label ultimate stress as
The terms used on reports to label the stress at failure/peak and ultimate stress may
be changed.
⇒
The labels typically used are Failure Stress and Ultimate Stress,
respectively.
10
SHEAR User’s Guide
1.3 Container Weight Database
The program may be set up to keep a list of container IDs and weights (this list is shared with
other GEOSYSTEM programs, such as the Moisture-Density and Atterberg Limits modules). After setting
up the list, you can enter your moisture-content test data with a container ID in place of the tare weight.
Selecting Options > Container List displays the container weight editor:
Figure 1.3.1 -- Container List Dialog
Container IDs are what you use when entering moisture content data: they’re convenient, unique
identifiers assigned to the containers holding the moisture content samples. IDs may be any combination of
alphabetic and numeric characters; e.g., ACD or 123. IDs that differ only by case (e.g., 3A and 3a) are
considered identical.
⇒
⇒
To add a new container to the list: Click on the first blank row in the list and enter
the container ID and container weight.
To remove a container from the list: Click in either the Container ID or Weight
columns of the row you want to delete then click on the Delete button.
Note that this list is optional: if you run a moisture content test with a container which is not on
your container list, you can skip entering a container ID and instead enter the container's weight. (If you
want to use the container list, make sure to select Tare ID in the Data entry requires Setup field (see §
1.2.1 ).
11
Introduction, Installation and Setup
1.4 Walkthrough
Before continuing, consider taking the program’s 30 minute tutorial:
1.
Start the GEOSYSTEM for Windows package: If you have a “GEOSYSTEM” shortcut on
your desktop, double-click on it (you can also click on your “Start” button and select
Programs > GEOSYSTEM > GEOSYSTEM for Windows).
2.
On the left side of the program’s screen is a directory box: navigate to the directory where the
GEOSYSTEM software is installed. (If you’ve installed the software onto your own hard
disk, this will probably be either C:\GEOSYS or C:\PROGRAM FILES\GEOSYS.)
3.
In the program directory, you’ll find a file called DEMO: double-click on it.
4.
The software should display the contents of the DEMO project. On the left side of the screen
is a yellow box listing the material sources from which DEMO’s testing samples were taken:
double-click on B-4.
5.
On the right side of the screen you should see a list of samples taken from B-4: find the data
entry card for sample S-4 and click on the SHEAR link for that card.
6.
You should see the SHEAR data entry screen. Select Help > Tutorial: the program will
display a series of yellow tutorial cards at the bottom of the data entry window
12
SHEAR User’s Guide
2. Data Entry
Begin data entry for a SHEAR test by filling in a data entry card on the LD4 or Data Manager
screen:
1.
Create or open a project file (see Sections 2.1 and 2.2 in the GDM manual or, if you’ve
licensed LD4, Sections 2.3 and 2.4 in the LD4 User’s Guide).
2.
Create or open a material source folder (see Sections 2.5 and 2.9 in the GDM manual or
Sections 2.7.1 and 2.7.2 in the LD4 User’s Guide).
3.
Locate a data entry card for the sample and fill in the sample’s identifying information (see
Section 2.6 in the GDM manual or Section 2.9 in the LD4 User’s Guide).
Click on the SHEAR link at the bottom of the sample’s data entry card (see Section 2.7 in the
GDM manual or Section 6.1 in the User’s Guide). You should see a display similar to the one shown
below:
2.1 Sample Info.
SHEAR’s initial data entry window covers basic information about the SHEAR test and the
sample tested. (This window can also be reached by clicking on the Sample Info. tab at the bottom of
your screen.)
13
Data Entry
⇒
⇒
Except for Test method and Specimen values calculation method, any data
entry field in this window may be left blank
Entering symbols: to enter a symbol which is not a part of your keyboard (such as the
degree symbol), press function key F9.
The following data are requested:
Type of sample
Use this field to indicate whether the tested sample was Undisturbed or
Disturbed.
Test method
SHEAR supports a number of test variants:
•
•
•
•
•
•
Unconfined Compression
Direct Shear
Unconsolidated Undrained
Consolidated Undrained
Consolidated Undrained with Pore Pressures
Consolidated Drained
SHEAR may be licensed with support for unconfined compression, direct shear
and/or triaxial shear test methods: if a particular test method is not licensed
then that method will not be available for selection in the Test method list. For
example, if SHEAR is licensed without support for triaxial tests, then the
Unconsolidated Undrained, Consolidated Undrained and Consolidated Drained
testing methods will not be available.
Specimen values calculation method
The specimen calculations (moisture content, density, saturation, etc.) for triaxial
tests can be performed using several different methods, including:
ASTM D 2850 is the standard ASTM procedure for unconsolidated undrained
triaxial tests.
COE - uniform strain is the first method described in Section 7c2 of EM 1110-21906 Appendix X.
COE - saturation assumed is the second method described in Section 7c2 of EM
1110-2-1906 Appendix X.
COE - uniform strain & water volume is a variant method which combines the
COE - uniform strain and COE - saturation assumed methods.
14
SHEAR User’s Guide
ASTM D 4767 Method A and ASTM D 4767 Method B D 4767 is the standard
ASTM procedure for consolidated undrained triaxial tests. SHEAR supports both
methods A and B of the after-consolidation cross-sectional area calculation.
ASTM D 4767 Method B w/ saturation est. is a non-standard variant of the ASTM
D 4767 Method B procedure that allows the user employ an estimate of the
consolidated specimen saturation rather than assuming 100% saturation. This
calculation method is only available for consolidated undrained tests.
⇒
The Specimen values calculation method selection is not changeable for direct
shear and unconfined compression tests because SHEAR only supports a single
calculation method for these tests.
Material description
By default, SHEAR uses the material description that you entered into the Material
Description field on the Data Manager screen (that's the screen where you click on
the SHEAR link). However, if you're entering drilling log data, the material
description at the depth where you took the SHEAR sample may only be something
like grades to slightly silty, with the full stratigraphy description taken
at some depth above the SHEAR sample. If this is the case, you can either override
the default description or click on the link that reads Click here to select from a
list of material descriptions: this drops down a box listing all of the material
descriptions entered into the current source folder. Double-click on one of the
descriptions to select it.
Date sampled
Use any date format desired; e.g., mm/dd/yy or dd/mm/yyyy or November 20, 2004.
Liquid limit/Plasticity index
These values are automatically retrieved from the GEOSYSTEM Atterberg Limits
program if it has been licensed and if Atterberg testing data are entered prior to
entering the SHEAR test data.
⇒
If a valid liquid limit and plasticity index are entered, SHEAR will automatically
calculate and report the plastic limit on chart reports.
Testing remarks
Use this field to note any deviations from normal sample preparation and testing
procedures, testing personnel, etc.
15
Data Entry
Chart report figure number
This value is printed at the bottom-right corner of the chart reports. Typically, the
value will be shown as Figure No.: xxxxxxx; to change the title from 'Figure No.' to,
e.g., 'Plate No.', exit SHEAR (SHEAR > Save and Exit) then select Options > Setup
General Options, click on the Lab. Modules tab and enter the new title into the On
reports, "Figure No." is titled: field.
Page 2 figure no. (if applicable)
This field only applies to triaxial tests: the Corps of Engineers and alternate triaxial
test report forms are two page forms (see this page for a sample of the second page):
if desired, the second page's figure number may be entered into the Page 2 figure
no. field.
Skip initial moisture data
As an alternative to taking moisture content data both before and after the test, the
entire test specimen can be used post-test to determine the post-test moisture content:
the dry weight from the post-test moisture content test and the initial moist weight
are used to calculate all specimen values (initial moisture content, density, etc.)
without requiring an initial moisture content determination.
Specific gravity is assumed
Check this box if a test was not performed to determine the specific gravity of the
sample: SHEAR's chart reports will label the specific gravity value that you enter as
Assumed.
2.1.1
Additional Sample Information Required for Triaxial Tests
Several additional fields are included on the Sample Info. window when entering triaxial test
data:
Single specimen staged test
SHEAR supports a triaxial and direct shear test variant where a single soil specimen
is used to develop failure data for several different minor effective principal stresses
(in other words, a single specimen is subjected to up to 4 different stresses; stages 2
and beyond are assumed to start at exactly the same sample state (i.e., height and
area) as when the previous stage completed). If this non-standard procedure was
used, check the Single specimen staged test box.
⇒
Staged tests require initial specimen data (initial moist weight, moisture content,
change in saturated/consolidated water volume, height, etc.) only for the first stage:
subsequent stages require only the change in height during consolidation.
16
SHEAR User’s Guide
⇒
⇒
When testing staged samples, do not reset the deformation dial between stages. The
program does not add in the deformation produced by previous stages, so the dial
cannot change between changes.
SHEAR does not currently support staged consolidated drained tests.
Membrane correction
Selecting this option applies the ASTM D 4767, Section 10.7 correction for rubber
membranes. Note that the correction requires the membrane thickness and the
membrane modulus.
Membrane modulus
See ASTM D 4767 Section 10.7.1. (ASTM D 4767, Section 10.7.1 notes that a
typical value for latex membranes is about 0.137895.)
Membrane thickness
Enter the thickness of the rubber membrane in cms.
Filter paper correction
Selecting this option applies the ASTM D 4767, Section 10.6 correction for filter
paper strips.
Filter paper coefficient
Enter the coefficient for the load carried by the filter paper per unit length of
perimeter covered by filter paper. (ASTM D 4767, Section 10.6 notes that a typical
value is about 0.0019 kN/cm.)
Filter paper percent coverage
Enter the percent of perimeter covered by filter paper. This value should be entered
as a percentage (e.g., fifty percent coverage should be entered as 50 instead of 0.5).
Consolidated Drained Tests Only
Test uses outflow buret
Select this option when outflow buret readings have been taken.
Buret precision
Select the precision used when reading the outflow buret: normally, divisions as
small as 0.1 cc may be read, but large scale testing may involve the use of burets
with 1 cc as the minimum readable division).
Reverse buret convention
Selecting this option indicates use of a buret graduated in increasing values as the
fluid level is increased.
17
Data Entry
2.1.2
Additional Sample Information Required for Direct Shear Tests
Several additional fields are included on the Sample Info. window when entering direct shear
test data:
Enter vertical deformation
If vertical deformation readings are taken then they may be entered and shown
graphically on the program's chart report if this box is checked.
Use square or rectangular shear box
Select this option if a square or rectangular shear box was used for the test. Leave the
option unselected if a circular sample was tested.
Fabric on fabric (no soil) test
Select this option if a geotextile was tested without soil.
⇒
SHEAR only supports fabric on fabric tests when performed in a square or
rectangular shear box.
Report deformation as
Deformations can be reported as either displacements or strains.
Single specimen staged test
SHEAR supports a triaxial and direct shear test variant where a single soil specimen
is used to develop failure data for several different minor effective principal stresses
(in other words, a single specimen is subjected to up to 4 different stresses; stages 2
and beyond are assumed to start at exactly the same sample state (i.e., height and
area) as when the previous stage completed). If this non-standard procedure was
used, check the Single specimen staged test box.
⇒
⇒
Staged tests require initial specimen data (initial moist weight, moisture content,
change in saturated/consolidated water volume, height, etc.) only for the first stage:
subsequent stages require only the change in height during consolidation.
When testing staged samples, do not reset the deformation dial between stages. The
program does not add in the deformation produced by previous stages, so the dial
cannot change between changes.
EXPERIMENTAL: Correct sample areas based upon strain
The ASTM direct shear test standard (D 3080) specifies that shear stresses are to be
calculated by dividing the shear force over the initial sample area. This ignores the
effect of shearing on the sample area: as the test proceeds, the area of the sample
decreases.
18
SHEAR User’s Guide
Selecting the Correct sample areas based upon strain option causes the
program to approximate the sample area at each test reading, and to use the
approximated area when calculating the stress at that reading. While this calculation
differs from the D 3080 standard, it is roughly allowed for by Note 19, which states:
Factors which incorporate assumptions regarding the actual specimen surface area
over which the shear and normal forces act can be applied to the calculated values
of shear or normal stress, or both.
2.2 SHEAR Testing Data
Clicking on the Specimen #1, Specimen #2, Specimen #3 or Specimen #4 tabs at the
bottom of the screen displays the testing data entry screen shown below:
Figure 2.2.1 -- Testing Data Window
⇒
2.2.1
Movement through the entry fields is by the Tab and Shift-Tab keys (Enter may also
be used to jump from one field to the next).
Moisture Content Data
Initial moisture content
An initial moisture content test is required unless the Skip initial moisture data
option is selected (see the Sample Info. window).
19
Data Entry
Final moisture content
A post-test moisture content is required for triaxial tests and optional for direct shear
tests.
⇒
2.2.2
If you’ve added a list of container IDs and weights to the program's container weight
database you can enter a Container ID instead of a tare weight (see § 1.3).
Specimen Measurements
Following the moisture content test data you’ll be asked for data on the initial sample, and, for
some test methods, saturated and/or consolidated data:
Figure 2.2.2 -- Specimen Measurements
Moist weight
This is the total moist weight of the specimen. Note that the measurement units used
are selectable between grams and pounds: to change the units, select Options >
SHEAR Setup, click on the Units tab and change the Specimen weights setting.
(See § 1.2.2.)
Specific gravity
This is the mineral solids specific gravity. The value entered must be a number
greater than 1.
⇒
If you are assuming a specific gravity value for the samples, make sure to check the
Specific gravity value is assumed box on the Sample Info. window.
20
SHEAR User’s Guide
Diameter
and
Height
Sample dimensions may be entered in inches, centimeters or millimeters, depending
on the current data entry units setting (§ 1.2.2).
Compression side length
This is the length of the square or rectangular shear box side against which a direct
shear sample is compressed. (See § 1.2.2 for information on changing the length
measurement units.)
Side 2 length
This is the length of the non-compression side of a square or rectangular shear box.
⇒
See the Use square or rectangular shear box Sample Info. setting (§ 2.1.2) for
information on choosing between a rectangular or circular direct shear test sample.
Net decrease in height
For direct shear and consolidated triaxial tests, the change in height during
consolidation is used to determine the sample volume at the start of the shear test.
Triaxial tests also require the change in height during saturation.
⇒
Change in height should be entered as a positive measurement if the height of the
sample decreased; if the sample swelled, the change in height measurement should
be a negative number.
Net decrease in water volume
In triaxial tests the change in the volume of pore water may be measured during
saturation and, for consolidated tests, during consolidation. The change is entered as
a positive number (in cubic centimeters) if the outflow from the sample was greater
than the inflow, or as a negative number if the specimen took on water.
21
Data Entry
The table below lists which specimen values calculation methods require a water
volume change measurement during the test saturation and consolidation phases:
Saturated
Water Volume
Change
Consolidated
Water Volume
Change
COE saturation assumed
required
required
COE uniform strain & water volume
required
required
Calculation method
COE uniform strain
ASTM D 4767 Method A
required
ASTM D 4767 Method B
required
ASTM D 4767 Method B with saturation estimate
required
Saturation (%)
ASTM D 4767 Method B w/ saturation est. specimen values calculation method
requires an estimation of the consolidated sample's saturation. This value should be
entered as a percentage (e.g., 95% should be entered as 95, not 0.95).
⇒
Staged tests require an estimate of the final saturation instead of the consolidated
sample's saturation.
22
SHEAR User’s Guide
2.2.3
Test Parameters
Below the Specimen Measurements panel is the Test Parameters panel:
Figure 2.2.3 -- Test Parameters
Type of readings
SHEAR supports both load ring equipped compression frames as well as digital dial
gauge equipped frames. Before you begin entering load readings, you'll need to let
SHEAR know how to convert your readings into loads by selecting from the Type
of readings box:
Load ring constant
Select this option for load ring equipped compression frames. (Note that SHEAR
supports both single and double (staged) ring style proving rings.) Load ring constant
frames require the following data:
Load ring #1 constant
Load-ring equipped loading frames require a Load Ring Constant (LRC) to convert
readings into loads; these conversion factors are specified in terms of pounds per
load dial division or kN per load dial division.
⇒
⇒
LRCs can be visualized as being the slope of the load vs. dial reading line on a ring
calibration chart.
When converting a load dial reading to a load, SHEAR subtracts the initial load dial
then multiplies the result by the LRC.
Crossover
Staged load rings utilize a secondary LRC which is employed after the second ring
makes contact and begins compressing. The Crossover field should be filled in
with the load dial reading at which the secondary load ring makes contact.
⇒
If a single load ring is used, leave the Crossover field blank or enter 0.
Load ring #2 constant
This field is the LRC of the secondary proving ring. If a single load ring is used,
leave this field blank or enter 0.
23
Data Entry
Sample LRC calculation, given:
•
•
The frame's LRC is 27030 lbs./inch up to 0.15 inches and 39490 lbs./inch beyond
that.
The initial load dial reading was 0.0025.
•
A subsequent load dial reading of 0.3000 was taken.
The load would be:
(0.15-0.0025)*27030+(.1995-.15)*39490 = 5941.68 pounds
Some notes on using LRCs:
⇒
⇒
In the above example, 27030 would be entered into the Load ring #1 constant
field, 39490 would be entered into the Load ring #2 constant field and .15
would be entered into the Crossover field.
Optionally, to allow load dial readings to be entered as integers, (assuming that the
dial is accurate to .0001), LRC#1 could be entered as 2.7030, LRC2 as 3.9490
and the Crossover as 1500. This makes the initial dial reading for the example 25
and the second reading 1995. Generically, if your LRC is given as X lbs. per inch
and your dial is readable to .0001, entering your load ring constant as X*.0001
allows you to enter your dial readings as whole numbers.
"Ax+B ring equation"
This style of reading-to-load conversion is used with load rings that utilize an
"Ax+B" linear calibration. This equation requires the following data:
"A" term
The "A" term is specified in either pounds per load dial division or kN per load dial
division.
"B" term
"B" term is given in either pounds or kN.
Sample calculation, given:
•
•
•
•
The "A" term is 15000 lbs./inch.
The "B" term is 50 lbs.
The initial load dial reading was 0.0025.
A subsequent load dial reading of 0.1000 was taken.
The load would be
(0.1-0.0025)*15000+50 = 1512.5 pounds
24
SHEAR User’s Guide
⇒
Optionally, to allow load dial readings to be entered as integers, (assuming that the
dial is accurate to .0001), "A" could be entered as 1.5 and "B" as 0.0050. This
makes the initial dial reading for the example 25 and the second reading 1000.
Generically, if your "A" term is given as X lbs. per inch and your dial is readable to
.0001, entering your "A" and "B" terms as X*.0001 allows you to enter your dial
readings as whole numbers.
Actual loads
This option should be selected when working with data taken from a digital dial
gauge (because the gauge reads directly in loads and does not require a conversion
factor.
Readings units
Selects the force units represented by the load dial readings. Currently, pounds and
kN (kilo Newtons) are supported.
Cell pressure
Back pressure
These two fields are only present when entering triaxial testing data. Cell pressure
is the total fluid pressure around the sample. Back pressure is the pore pressure
applied to the sample before the start of the test (typically used to compress air voids
and to increase saturation).
⇒
To change the units used for entering the cell and back pressures, see the Fluid
pressure field on the program's configuration dialog (Options > SHEAR Setup then
click on the Units tab).
Normal stress
This field is only present when entering direct shear data, and should be filled in with
the total normal stress applied to the specimen before and during shear testing.
Strain rate
Time to failure
SHEAR does not use these fields for any calculations; it's included documentation
purposes only.
These fields are shown if you select either Strain rate, in./min., Strain
rate, %/min. or Time to failure, min. from the Rate of strain
reported as box on the program's configuration dialog (§ 1.2.3).
2.2.4
Test Readings
The last panel on the test data entry screen is the Test Readings panel:
25
Data Entry
Figure 2.2.4 -- Test Readings
Deformation dial divisor
Vertical def. dial divisor
This selection allows entry of deformation dial readings as whole numbers such as
1950 instead of decimal values like 0.1950. During data entry, SHEAR accepts
your deformation values and divides them by the deformation dial divisor before
entering them into the Def. Dial column on the test readings grid.
To avoid entering the "0." for each deformation value that you enter, select the dial
divisor representing the value that will produce a whole number when multiplied by
the smallest deformation readable on your dial. For example, if your smallest
readable deformation is .0001, select 10000 as your deformation dial divisor. If you
prefer to enter actual deformations, select 1 as your deformation dial divisor.
⇒
Once your deformation dial reading is entered into the program, the dial divisor is
irrelevant: 1950 entered with a dial divisor of 10000 is the same deformation as
0.195 entered with a dial divisor of 1. Selecting a different dial divisor has no
effect on deformations that you've already entered.
SHEAR supplies a second dial divisor for direct shear tests: the Vertical def. dial
divisor converts values entered into the Vertical Def. Dial column.
Test readings data:
26
SHEAR User’s Guide
Def.
Dial
or
Horiz.
Def.
Dial
Is the deformation undergone by the sample, adjusted for the chosen deformation dial
divisor. The measurement units used (inches, cms. or mms.) must match the
Dimensions units chosen for data entry on the Units tab of the program's Setup
dialog (§ 1.2.2).
Load
Dial
Is the load dial reading. Be sure to make the correct Type of readings selection (§
2.2.3) before entering load dial readings.
Pore
Press.
Is the pore pressure measurement. The measurement units used (psi, tsf, etc.) must
match the Fluid pressure units chosen for data entry on the Units tab of the
program's Setup dialog (§ 1.2.2). Pore pressures are entered only if
Consolidated Undrained with Pore Pressures is the selected test
method (§ 2.1).
Buret
Read.
Is the reading, in CCs, on the outflow buret used for drained triaxial tests. Outflow
buret readings are entered only if Consolidated Drained is the selected test
method (§ 2.1) and Test uses outflow buret box is checked (§ 2.1.2).
Vertical
Def.
Dial
(Direct shear tests only.) Is the vertical deformation dial reading, adjusted for the
chosen vertical deformation dial divisor. To enter vertical deformation data, the Enter
vertical deformation test settings box must be checked. The measurement units used
(inches, cms. or mms.) must match the Dimensions units chosen for data entry on
the Units tab of the program's Setup dialog (§ 1.2.2).
27
Data Entry
Peak
and
Ultimate
An "X" in the Peak column indicates the readings row that holds the specimen's
peak stress, while an "X" in the Ultimate column indicates the readings row that
holds the specimen's ultimate stress.
SHEAR's chart reports show the maximum deviator stress (i.e., peak or failure
stress) encountered by each specimen. SHEAR automatically determines this value;
however, you can override the program's selection:
1.
2.
On the grid holding the test readings values, locate the row containing your maximum
deviator stress value.
On the maximum deviator stress row, click the left mouse button in the column titled
Peak: you should see an "X" appear.
Chart reports also show the ultimate stress reached by each specimen. Unlike the
peak stress, this value is not automatically determined: the ultimate stress point must
be manually selected for each specimen. To specify the ultimate stress point:
1.
2.
⇒
On the grid holding the test readings values, locate the row containing your ultimate
stress value.
On the ultimate stress row, click the left mouse button in the column titled Ultimate: you
should see an "X" appear.
You can remove your peak or ultimate stress selection by clicking on the "X" in the
Peak or Ultimate columns: clicking in the "X" should make it disappear. Removing
your peak stress selection causes the program to automatically determine the
specimen's peak stress, while removing the ultimate stress selection prevents any
ultimate stress data from appearing on the chart reports.
2.3 Copying and Pasting SHEAR Data
If you have two SHEAR tests with similar testing data, you may want to copy the first test entered
piecemeal. To do this:
1.
2.
Open the test and select Edit > Copy Test.
Start the next test (from the Data Manager screen, enter the test's sample data then click on the
SHEAR link) then select Edit > Paste Test.
28
SHEAR User’s Guide
2.4 Deleting a SHEAR Test
To remove all of the data that you’ve entered for a test, refer to Section 2.8 in the GDM manual or
Section 6.2 in the LD4 User’s Guide.
2.5 Importing Data Files Created with the DOS SHEAR
Program
SHEAR can import individual data files entered with GEOSYSTEM's original DOS version of the
program. To do this:
1.
From the Data Manager screen, find a blank sample card and enter the sample number, depth,
etc. of the sample that you want to import.
2.
Click on the underlined SHEAR shown at the bottom of the data entry card.
3.
Select SHEAR > Import DOS SHEAR File.
4.
Navigate to the hard disk subdirectory where your DOS SHEAR program was installed
(typically, this will be C:\SHEAR).
5.
Locate the data file that you're trying to import (DOS SHEAR data file names end in .SDT)
and double-click on it.
29
Curve Display
3. Curve Display
The Charts tab (Window > Charts) displays charts of triaxial Mohr’s circles and p-q stress paths,
direct shear peak vs. normal stress and unconfined compression stress vs. strain curves. The Mohr’s circles,
P-Q and direct shear charts feature adjustable tangent line constructions.
3.1 Mohr's Circles Chart Display
To display a chart of a triaxial test's Mohr's circles, select Window > Charts then click on the
Mohr's toolbar button.
Figure 3.1.1 -- Mohr's Circles Chart Display
⇒
If pore pressure measurements were taken, SHEAR will display two sets of Mohr's
cicles, representing the total and effective stresss: The total stress Mohr's circles are
shown in red and the effective stress circles are shown in blue.
The chart also displays one or two lines that should ideally be tangent to all the Mohr's circles of
the same color. (I.e., the blue line should be tangent to all the blue Mohr's circles.) SHEAR attempts to
automatically adjust these lines for a best-fit. The lines may also be manually adjusted:
1.
If pore pressures were taken, begin by clicking on the Effective or Total buttons.
2.
Drag (with the left mouse button down) the end of the line to be adjusted.
There are also several toolbar buttons designed to help with the adjustment:
30
SHEAR User’s Guide
Best Fit
This button returns the tangent line to the program's automatically selected
alignment.
Through (0,0)
This button forces the left end of the tangent line to pass through the lower-left
corner of the chart; i.e., through (0,0).
Two toolbar buttons determine how the chart appears on the chart report:
Circles on Chart
When this button is in the up position the Mohr's circles are omitted from the report's
chart.
Tangent on Chart
When this button is in the up position Mohr's circles tangent lines are omitted from
the report's chart.
⇒
Check the effect of selecting or deselecting these options by selecting Window >
Report Preview.
Chart Effective
CU with pore pressures only: When this button is in the up position the effective pq paths are omitted from the report's chart.
Chart Total
CU with pore pressures only: When this button is in the up position the total stress
p-q paths are omitted from the report's chart.
3.2 P-Q Chart Display
To display a chart of a triaxial test's p-q values, select Window > Charts then click on the P-Q
toolbar button.
⇒
If pore pressure measurements were taken, SHEAR will display two sets of p-q
values, representing the total and effective stresses: The total stress p-q values are
shown in red and the effective stress values are shown in blue.
The chart also displays one or two lines that should ideally connect all the same colored failure
stress points. (I.e., the blue line connects the failure points on the blue p-q chart.) SHEAR attempts to
automatically adjust these lines for a best-fit; The lines may also be manually adjusted:
1. If pore pressures were taken, begin by clicking on the Effective or Total buttons.
31
Curve Display
2. Drag (with the left mouse button down) the end of the line to be adjusted.
There are also several toolbar buttons designed to help with the adjustment:
Best Fit
This button returns the tangent line to the program's automatically selected
alignment.
Through (0,0)
This button forces the left end of the tangent line to pass through the lower-left
corner of the chart; i.e., through (0,0).
Get Tan from Mohr's
This forces the best-fit line to correlate with orientation of the Mohr's circles tangent
line. (The correlation is useful because the intersection of the Mohr's circles tangent
with a specimen's Mohr's circle represents the specimen's peak stress point.)
Several toolbar buttons determine how the chart appears on the chart report:
Points on Chart
When this button is in the up position the p-q stress paths are omitted from the
report's chart.
Best-fit lines on Chart
When this button is in the up position the lines connecting the p-q peak stress points
are not shown on the report's chart.
⇒
Check the effect of selecting or deselecting these options by selecting Window >
Report Preview.
Chart Effective
CU with pore pressures only: When this button is in the up position the effective pq paths are omitted from the report's chart.
Chart Total
CU with pore pressures only: When this button is in the up position the total stress
p-q paths are omitted from the report's chart.
3.3 Direct Shear Chart Display
For direct shear tests, selecting Window > Charts displays a plot of:
⇒
Peak vs. normal stress
32
SHEAR User’s Guide
⇒
If ultimate stress points have been selected the chart also plots ultimate vs. normal
stress
The blue line should connect the "O" markers representing the peak stress points, while the red
line (if shown) should connect the "X" markers. SHEAR attempts to automatically adjust these lines for a
best-fit. The lines may also be manually adjusted:
1.
2.
Click on the Peak button to adjust the line connecting the peak stress points, or click on the
Ultimate button to adjust the ultimate stress points line.
Drag (with the left mouse button down) the end of the line to be adjusted.
There are also several toolbar buttons designed to help with the adjustment:
Best Fit
This button returns the line to the program's automatically selected alignment.
Through (0,0)
This button forces the left end of the line to pass through the lower-left corner of the
chart; i.e., through (0,0).
Two toolbar buttons determine how the chart appears on the chart report:
Points on Chart
When this button is in the up position the peak and ultimate stress points are omitted
from the report's chart.
Best-fit Lines on Chart
When this button is in the up position the lines connecting the peak and ultimate
stress points are omitted from the report's chart.
⇒
Check the effect of selecting or deselecting these options by selecting Window >
Report Preview.
33
Reporting Your Data
4. Reporting Your Data
SHEAR features three main report styles, discussed in the following sections.
4.1 XML Files
SHEAR’s XML files are small files that list all of your raw SHEAR testing data, along with the
program’s calculated values (e.g., stress, strain, etc.). XML files are saved on-disk and may be viewed by a
web browser or by versions of Microsoft Excel newer than Excel2000. This is an ideal format for e-mailing
testing data and results to your clients in a format that incorporates both a means of presentation (through a
web browser) as well as a means of manipulating the raw data (through a spreadsheet).
XML files are generated by selecting SHEAR > Export XML File. Once exported, a SHEAR
XML file may be saved to a web site or e-mailed directly to your clients.
A portion of a SHEAR XML file, as viewed with Internet Explorer, is shown below:
Figure 4.1.1 -- SHEAR XML File Viewed in Internet Explorer
34
SHEAR User’s Guide
4.2 Data Summary Reports
Data summary reports list the raw data taken from a SHEAR test (e.g., specimen weights and
dimensions, test readings, etc.); the reports may be sent to a printer or saved on disk. Data summary reports
are generated by selecting SHEAR > Output Data Summary Report.
Figure 4.2.1 -- First Page of a Sample Summary Report
⇒
To preview the testing data summary: right-click on the SHEAR link at the
bottom of your sample’s data entry card from the Data Manager or LD4 screens (see
Section 2.7 in the GDM manual or Chapter 6 in the LD4 manual) and select
Summary Preview.
4.3 Chart Reports
Chart reports show SHEAR’s interpretation of your testing data: depending upon the test method
you used, a SHEAR chart report can include graphs of stress vs. strain, Mohr’s circles, p-q stress paths,
vertical deformation, etc. Most often these are the reports that are submitted to testing clients. Chart reports
are generated by selecting SHEAR > Output Chart Report and clicking on the Output button.
35
Reporting Your Data
Figure 4.3.1 -- Direct Shear Chart Report
Figure 4.3.2 -- Unconfined Compression Sample Report
36
SHEAR User’s Guide
SHEAR features three different reporting formats for triaxial data, shown in the following three
figures.
Figure 4.3.3 -- Corps of Engineers Sample Report
Figure 4.3.4 -- Alternate Report Format Sample
37
Reporting Your Data
Figure 4.3.5 -- UCC Report Format used with Triaxial Test Data
You can select between the three formats by selecting Window > Report Preview, then changing
the report format selection:
Figure 4.3.6 -- Triaxial Report Format Selection
38
SHEAR User’s Guide
To preview the testing chart report you can either: right-click on the SHEAR link at the bottom of
your sample’s data entry card from the Data Manager Screen and select Report Preview, or you can click
on the Report tab at the bottom of the SHEAR data entry screen, or select Window > Report. To print the
chart report: select SHEAR > Output Chart Report then click on the Output button.
4.3.1
Report Preview Display
Selecting Window > Report Preview displays a preview of the current test's chart report, as shown
in Figure 4.3.6.
⇒
The display may be magnified by either moving the mouse over the report (which
magnifies a portion of the report) or by adjusting the left toolbar slider control, which
looks like this:
Note: On slower computers and/or higher-resolution displays, the circular magnifier
may be unusably slow. Select Preview > Square Magnifier for a faster magnifier.
(On very slow computers, SHEAR automatically disables the circular magnifier
button.)
⇒
There are several selections on the triaxial chart preview and direct shear chart
preview screens that control the appearance of the report display.
4.4 Exporting Reports to Files
SHEAR’s testing data summary and chart reports may be exported to files that may be posted to a
web server or e-mailed to clients. To do this, begin by selecting either SHEAR >Output Data Summary
Report or SHEAR > Output Chart Report. You should see the dialog shown in the previous section.
Output to: allows you to choose between sending your report to the printer and sending your
report to a disk file in one of several formats:
Adobe Acrobat .PDF
.PDF is a near-universal format for Internet document distribution. Viewing requires
the Adobe Reader program that may be downloaded at no charge from Adobe’s web
site.
AutoCAD .DXF
.DXF is designed for interchange among CAD programs.
Windows Metafile (.EMF)
.EMF files may be inserted as a picture into a word processing document or
manipulated with a vector drawing program such as Adobe Illustrator.
39
Reporting Your Data
Drop down the Output to: box and select either “Adobe Acrobat .PDF File”, “Windows Metafile
(.EMF)” or “AutoCAD .DXF File”. If you select one of the first two options, you’ll see the following
dialog:
Figure 4.4.1 -- PDF Export Dialog
.DXF files are somewhat more complicated and have more options available:
Figure 4.4.2 -- DXF Export Dialog
There are a number of different options available for selecting where and how the reports are
exported:
Base file name
When the program creates a .DXF, .PDF or .EMF file of your report, the file's name
will start with whatever is entered into this field.
40
SHEAR User’s Guide
Add sample number/location to the file name
Without this option, the names of the .DXF, .PDF or .EMF files created for exporting
a report will be whatever you have selected as the Base file name, plus something
like page 1 at the end. (For example, if the Base file name is P92321, if the
Add sample number/location to the file name option was not checked, the
first .PDF report file created would be named P92321 page 1.PDF, the second
report would be named P92321 page 2.PDF and on. A client looking at a list of
submitted .PDF files would have no way of telling which file corresponds to which
tested sample.
Checking the Add sample number/location to the file name box alters how
the program names the report files: the sample number and/or sampling location is
added to the Base file name. Using our previous example, with the box checked the
program would create, for example, PDF files named
P92321 Sample S-4_Boring B-3.PDF
P92321 Sample S-1_Test Pit TP-2.PDF
etc.
⇒
With Base file name and Add sample number/location to the file name
you can come up with some useful file naming variations. For example, you could
leave Add sample number/location to the file name unchecked and enter the
sample number/location as part of the Base file name -- of course, this means that
when you export the next report, you'd have to change the Base file name to
reflect the new sample number.
As another example, if you have created a hard disk subdirectory just to hold .PDF
files from a certain project, you may not need to include the project number as part
of each .PDF file name: instead of being called, for example,
P92321 Sample S-4_Boring B-3.PDF
(P92321 being the project number), by leaving the Base file name field blank you
can get export files with names like Sample S-4_Boring B-3.PDF
Place files in
Gives the directory where your exported .PDF, .DXF or .EMF file will be placed.
Report is scaled in
Reports exported as .DXF, .EMF or .PDF measure either 10 units vertically (when
scaled in inches) or 25.4 units vertically (when scaled in centimeters). This selection
does not affect the report's appearance; rather, it affects the coordinates given to each
line and piece of text on the report. As such, the selection is only important when the
exported report is to be edited by an illustration or CAD program.
41
Reporting Your Data
Binary (.DXF files only)
Binary .DXF files are smaller (by 25 to 50 percent) and are read by AutoCAD faster,
however, reports will appear the same when viewed in a CAD program no matter if
this option is selected or not. Note that few illustration programs will read binary
.DXF report files.
TrueType (.DXF files only)
If this option is unselected, .DXF report files use a monospaced font (similar to
this) for everything on the form, meaning that .DXF reports are less attractive than
their printed counterparts. The TrueType option allows you to generate .DXF files
that look exactly like the printed versions -- however, TrueType .DXF files are only
supported on AutoCAD versions 14 and newer; additionally, many other drawing
and CAD programs do not support TrueType files.
Layer name (.DXF files only)
Specifies the name of the CAD drawing layer on which your report will be drawn.
Layer names may be any combination of alphabetic and numeric characters -however, many CAD programs cannot handle layer names that include spaces.
(MYLAYER is OK, MY LAYER is not.) Since your chosen layer name will be
repeated throughout the .DXF report files, the shorter you make the name the smaller
in size your .DXF files will become.
After selecting the desired export options, click on the Output button to create the file(s) (data
summary reports will be exported as two files if you’ve chosen the .DXF or .EMF file format).
4.5 Copying Reports to the Windows Clipboard
If you’re creating a word processing document which incorporates your SHEAR reports, you can
skip the process of exporting the report to a file then inserting the file as a picture into your word
processing document: instead, open the SHEAR test and select Edit > Copy Data. This places a copy of the
SHEAR chart report on the Windows clipboard. To paste the report into your word processing document,
start the word processor, open the document and select Edit > Paste.
4.6 Listing Results from Multiple SHEAR Tests
The Data Summary and Export tool discussed in Chapter 4 of the GDM manual and Appendix C
of the LD4 User’s Guide may be used to summarize the results of multiple SHEAR tests. The
configuration file, called TXSMRY1.LFG, can be used by selection Tools > Data Summary and Export
from the GDM or LD4 menu, then selecting File > Recall Existing Configuration and double-clicking on
TXSMRY1.LFG.
42
SHEAR User’s Guide
⇒
⇒
If you’ve purchased LD4, you can use TXSMRY1.LFG to view an on-screen list of
the triaxial tests performed for a project: From the LD4 screen, select Project >
Browse and choose TXSMRY1.
See § 5.17 for a list of calculated shear testing values that may be summarized or
exported.
43
TECHNICAL DOCUMENTATION
5. TECHNICAL DOCUMENTATION
The calculations used in the program are presented in the following sections. For purposes of
simplification, the units are omitted.
5.1 Initial Specimen Parameters
The initial specimen parameters are the following:
MCi
γwi
γdi
Si
ei
= moisture content, percent
= wet density
= dry density
= saturation, percent
= void ratio
These initial parameters are calculated using the formulas presented in the following sections.
5.1.1
Initial Moisture Content
MCi =
where: MCi
Wwt
Wdt
Wt
Wwt − Wdt
Wdt − Wt
= initial moisture content (decimal)
= wet weight and tare
= dry weight and tare
= tare weight
5.1.2
Calculating Initial Moisture Content without Initial Moisture
Content Data
If the Skip initial moisture data selection is chosen (§ 2.1), SHEAR calculates the initial
moisture content as follows:
MCi =
where: MCi
Wi − (Wdt − Wt )
Wdt − Wt
= initial moisture content (decimal)
44
SHEAR User’s Guide
= initial specimen weight
= final moisture content test: dry weight and tare
= final moisture content test: tare weight
Wi
Wdt
Wt
5.1.3
Initial Wet Density
γ wi =
where: γwi
Wi
Vi
5.1.4
Wi
Vi
= initial wet density
= initial specimen weight
= initial volume
Initial Volume
Vi = Ai x Hi
where: Vi
Ai
Hi
5.1.5
= initial volume
= initial cross-sectional area
= initial height
Initial Cross-Sectional Area for Round Specimen
Ai =
where: Ai
D
5.1.6
Π × D2
4
= initial cross-sectional area
= diameter
Initial Cross-Sectional Area for Square (DS) Specimen
Ai = S x S
where: Ai
S
5.1.8
= initial cross-sectional area
= side length
Initial Dry Density
γ di =
γ wi
1 + MC i
45
TECHNICAL DOCUMENTATION
where: γdi
= initial dry density
5.1.9
Initial Saturation
Si =
MC i × 100
UWw
1
−
γ di
G ms
where: Si
UWw
Gms
5.1.10
= initial sample saturation, %
= unit weight of water (62.428 pcf)
= specific gravity of mineral solids
Initial Void Ratio
UWw × G ms
−1
γ di
ei =
= initial void ratio
where: ei
5.2 Corps of Engineers Uniform Strain Calculations
Saturated and consolidated specimen parameters in triaxial tests may change during the saturation
or consolidation phase. This is due to changes in height or in volume of pore fluids. This section explains
methods of calculating the saturated and consolidated parameters using the Corps of Engineers uniform
strain methods. The uniform strain method is the first method presented in § 7.c.2 of the Corps of
Engineers lab manual EM 110-2-1906 Appendix X.
5.2.1
Saturated Moisture Content
MC s =
where: MCs
Wws
Wms
Wws
Wms
= saturated moisture content (decimal)
= weight of pore water, saturated
= weight of mineral solids
Weight of pore water:
Wws = ( Vs - Vms ) x UWw
46
SHEAR User’s Guide
= saturated volume
= volume of mineral solids
= unit weight of water
where: Vs
Vms
UWw
Saturated volume:
Vs = ( H i − ∆H s ) × A i ×
H i − 2 × DH s
Hi
= saturated volume
= change in height during saturation
= initial area
where: Vs
∆Hs
Ai
Weight of mineral solids:
Wi
1 + MC i
Wms =
Volume of mineral solids:
Vms =
Wms
UWms
= unit weight of mineral solids
where: UWms
5.2.2
Saturated Dry Density
γ ds =
Wms
Vms
where: γds
5.2.3
= saturated dry density
Saturated Saturation
By definition, the saturated saturation in a Corps of Engineers, uniform strain method test is 100%.
5.2.4
Consolidated Moisture Content
MC c =
Wwc
Wms
47
TECHNICAL DOCUMENTATION
where: MCc
Wwc
= consolidated moisture content (decimal)
= weight of pore water, consolidated
Weight of pore water:
Wwc = ( Vc - Vms ) x UWw
where: Vc
= consolidated volume
Consolidated volume:
Vc = (H i − DH s − DH c ) × A i ×
Hi
= consolidated volume
= change in height during consolidation
where: Vc
∆Hc
5.2.5
H i − 2 × (DH s + DH c)
Consolidated Dry Density
γ dc =
where: γdc
5.2.6
Wms
Vc
= consolidated dry density
Consolidated Saturation
By definition, the consolidated saturation in a Corps of Engineers, uniform strain method test is
100%.
5.2.7
Consolidated Area
Ac = Ai ×
where: Ai
Hi
∆Hs
∆Hc
H i − 2 × ( ∆H s + ∆H c )
Hi
= initial area
= initial height
= change in height during saturation
= change in height during consolidation
48
SHEAR User’s Guide
5.3 Corps of Engineers (Saturation Assumed)
Calculations
Saturated and consolidated specimen parameters in triaxial tests may change during the saturation
or consolidation phase due to changes in height or in volume of pore fluids. This section explains methods
of calculating the saturated and consolidated parameters using the Corps of Engineers saturation assumed
methods. The saturation assumed method is the second method presented in § 7.c.2 of the Corps of
Engineers lab manual EM 110-2-1906 Appendix X.
5.3.1
Saturated Moisture Content
MC s =
Wws
Wms
= saturated moisture content (decimal)
= weight of pore water, saturated
= weight of mineral solids
where: MCs
Wws
Wms
Weight of pore water:
Wws = Wwi + ( ∆Vws x UWw )
where: ∆Vws
Wwi
= change in volume of water during saturation
= initial weight of water
Initial weight of water:
Wwi =
where: Wi
Wi
1
1+
MC i
= initial sample weight
Weight of mineral solids:
Wms = Wi - Wwi
5.3.2
Saturated Dry Density
γ ds =
Wms
Vs
49
TECHNICAL DOCUMENTATION
where: γds
Vs
= saturated dry density
= saturated volume
Saturated volume:
Vs = Vms + Vwi - ∆Vs
where: Vs
Vms
Vwi
∆Vs
= saturated volume
= volume of mineral solids
= initial volume of water
= change in water volume during saturation
Volume of mineral solids:
Vms =
Wms
UWms
where: UWms
= unit weight of mineral solids
Initial volume of water:
Vwi =
Wwi
UWw
where: UWw = unit weight of water
5.3.3
Saturated Saturation
By definition, the saturated saturation in a Corps of Engineers, saturation assumed method test is
100%.
5.3.4
Consolidated Moisture Content
MC c =
where: MCc
Wwc
Wwc
Wms
= consolidated moisture content (decimal)
= weight of pore water, consolidated
Weight of pore water:
Wwc = Wws + ( ∆Vwc x UWw )
50
SHEAR User’s Guide
where: ∆Vwc
Wwi
5.3.5
= change in volume of water during consolidation
= initial weight of water
Consolidated Dry Density
γ dc =
where: γdc
Vc
Wms
Vc
= consolidated dry density
= consolidated volume
Consolidated volume:
Vc = Vs - ∆Vwc
where: Vc
Vs
∆Vwc
5.3.6
= consolidated volume
= saturated volume
= change in water volume during consolidation
Consolidated Saturation
By definition, the consolidated saturation in a Corps of Engineers, saturation assumed method test
is 100%.
5.3.7
Consolidated Area
Ac =
where: Vc
Hc
Vc
Hc
= consolidated volume
= consolidated sample height
Consolidated sample height:
Hc = Hi - ∆Hs - ∆Hc
where: Hc
Hi
∆Hs
∆Hc
= consolidated height
= initial height
= change in height during saturation
= change in height during consolidation
51
TECHNICAL DOCUMENTATION
5.4 ASTM D 4767 Method A Calculations
Saturated and consolidated specimen parameters in triaxial tests may change during the saturation
or consolidation phase due to changes in height or in volume of pore fluids. This section explains methods
of calculating the saturated and consolidated parameters using the ASTM Method A.
5.4.1
Saturated Moisture Content
Saturated moisture content, based on final moisture, adjusted for change in pore water volume
during consolidation:
MC s = MC f +
where: MCs
MCf
∆Vwc
Wms
UWw
∆Vwc × UWw
Wms
= saturated moisture content (decimal)
= final moisture content
= change in volume of water during consolidation
= weight of mineral solids
= unit weight of water
Weight of mineral solids:
Wms =
= initial sample weight
= initial moisture content
where: Wi
MCi
5.4.2
Wi
1 + MC i
Saturated Dry Density
γ ds =
where: γds
Vs
Wms
Vs
= saturated dry density
= saturated volume
Saturated volume:
Vs = As x Hs
where: As
Hs
= saturated area
= saturated height
52
SHEAR User’s Guide
Saturated area:
As = A i ×
where: Ai
Hs
∆Hs
H s − 2 × ∆H s
Hs
= initial area
= saturated height
= change in height during saturation
Saturated height:
Hs = Hi - ∆Hs
where: Hs
Hi
∆Hs
5.4.3
= saturated height
= initial height
= change in height during saturation
Saturated Saturation
Ss =
where: Ss
UWw
Gms
5.4.4
MCs
*100
UWw
1
−
G ms
γ ds
= saturated sample saturation, %
= unit weight of water (62.428 pcf)
= specific gravity of mineral solids
Consolidated Moisture Content
ASTM Method A uses the final moisture content as the consolidated moisture content.
5.4.5
Consolidated Dry Density
The ASTM Method A consolidated dry density calculation is identical to the COE, saturation
assumed dry density calculation covered in § 5.3.5.
5.4.6
Consolidated Saturation
Sc =
MC c
*100
UWw
1
−
G ms
γ dc
53
TECHNICAL DOCUMENTATION
where: Sc
UWw
Gms
5.4.7
= consolidated sample saturation, %
= unit weight of water (62.428 pcf)
= specific gravity of mineral solids
Consolidated Area
Ac =
where: Ac
Vi
∆Vs
∆Vc
Hc
Vi − DVs − DVc
Hc
= consolidated area
= initial volume
= change in volume during saturation
= change in volume during consolidation
= consolidated sample height
Change in volume during saturation:
∆Vs = 3 x Vi x ( ∆Hs / Hi )
where: ∆Hs
Hi
= change in height during saturation
= initial height
Consolidated height:
Hc = Hi - ∆Hs - ∆Hc
where: Hc
Hi
∆Hs
∆Hc
= consolidated height
= initial height
= change in height during saturation
= change in height during consolidation
5.5 ASTM D 4767 Method B Calculations
Saturated and consolidated specimen parameters in triaxial tests may change during the saturation
or consolidation phase due to changes in height or in volume of pore fluids. This section explains methods
of calculating the saturated and consolidated parameters using the ASTM Method B methods.
5.5.1
Saturated Moisture Content
The ASTM Method B saturated moisture content calculation is identical to the Method A
calculation documented in § 5.4.1.
54
SHEAR User’s Guide
5.5.2
Saturated Dry Density
γ ds =
where: γds
Vs
Wms
Vs
= saturated dry density
= saturated volume
Saturated volume:
Vs = Vwf + Vms + ∆Vwc
where: Vwf
Vms
∆Vwc
= final volume water
= volume of mineral solids
= change in water volume during consolidation
Volume of mineral solids:
Vms =
where: Wi
MCi
Gs
Wi
(1 + MC i ) × G s
= initial sample weight
= initial moisture content
= specific gravity of mineral solids
Final volume of water:
Vwf =
where: Wms
MCf
UWw
5.5.3
Wms × MC f
UWw
= weight of mineral solids
= final moisture content
= unit weight of water (1 gm/cc)
Saturated Saturation
By definition, the saturated saturation in an ASTM Method B test is 100%.
5.5.4
Consolidated Moisture Content
ASTM Method B uses the final moisture content as the consolidated moisture content.
55
TECHNICAL DOCUMENTATION
5.5.5
Consolidated Dry Density
γ dc =
where: γdc
Vc
Wms
Vc
= consolidated dry density
= consolidated volume
Consolidated volume:
Vc = Vms + Vwf
where: Vc
Vms
Vwf
5.5.6
= consolidated volume
= volume of mineral solids
= final pore water volume
Consolidated Saturation
By definition, the consolidated saturation in an ASTM Method B test is 100%.
5.5.7
Consolidated Area
Ac =
where: Ac
Vc
Hc
Vc
Hc
= consolidated area
= consolidated volume
= consolidated sample height
Consolidated volume:
Vc = Vwf + Vms
where: Vwf
Vms
= final volume water
= volume of mineral solids
Consolidated height:
Hc = Hi - ∆Hs - ∆Hc
where: Hi
∆Hs
∆Hc
= initial height
= change in height during saturation
= change in height during consolidation
56
SHEAR User’s Guide
5.6 ASTM D 4767 Method B with Saturation Estimate
Calculations
A variation of ASTM Method B allows the user to employ an estimate of the consolidated
specimen saturation rather than assuming 100%. It is available only for CU tests. This section explains
methods of calculating the saturated and consolidated parameters using this variation of ASTM Method B.
5.6.1
Saturated Moisture Content
This calculation is identical to the one covered in § 5.4.1.
5.6.2
Saturated Dry Density
γ ds =
where: γds
Vs
Wms
Vs
= saturated dry density
= saturated volume
Saturated volume:
Vs = Vms + Vvf + ∆Vc
where: Vms
Vvf
∆Vc
= volume of mineral solids
= final volume voids
= change in water volume during consolidation
Volume of mineral solids:
Vms =
where: Wi
MCi
Gs
Wi
(1 + MC i ) × G s
= initial sample weight
= initial moisture content
= specific gravity of mineral solids
Final volume of voids:
Vvf =
Wms × MC f
Sc × UWw
57
TECHNICAL DOCUMENTATION
where: Wms
MCf%
Sc
UWw
5.6.3
= weight of mineral solids
= final moisture content (%)
= estimated consolidated (final) saturation
= unit weight of water (1 gm/cc)
Saturated Saturation
This calculation is identical to the ASTM Method A saturated saturation calculation covered in §
5.4.3.
5.6.4
Consolidated Moisture Content
ASTM Method B, Sat. Est. uses the final moisture content as the consolidated moisture content.
5.6.5
Consolidated Dry Density
γ dc =
where: γdc
Vc
Wms
Vc
= consolidated dry density
= consolidated volume
Consolidated volume:
Vc = Vms + Vvf
where: Vc
Vms
Vvf
5.6.6
= consolidated volume
= volume of mineral solids
= final volume of voids
Consolidated Saturation
The consolidated saturation is the value entered as the estimated consolidated saturation.
5.6.7
Consolidated Area
Ac =
Vc
Hc
58
SHEAR User’s Guide
= consolidated area
= consolidated volume
= consolidated sample height
where: Ac
Vc
Hc
Consolidated volume:
Vc = Vms + Vvf
where: Vms
Vvf
= volume of mineral solids
= final volume of voids
Consolidated height:
Hc = Hi - ∆Hs - ∆Hc
where: Hi
∆Hs
∆Hc
= initial height
= change in height during saturation
= change in height during consolidation
5.7 Corps of Engineers Uniform Strain with Water
Volume Measurements
This method is a variant of the Corps of Engineers uniform strain method. The uniform strain
method is the first method presented in § 7.c.2 of the Corps of Engineers lab manual EM 110-2-1906
Appendix X. This variant does not assume 100% saturation, but rather calculates saturations based on
water volume changes. Specimen volume changes are based on the uniform strain equations like the COE
Uniform Strain method. However, if the resulting saturation is greater than 100%, the calculations revert to
the COE Saturation Assumed method (100% saturation assumed.)
5.7.1
Saturated Moisture Content
MC s = MC i −
where: MCs
MCi
∆Vws
Wms
UWw
∆Vws × UWw
Wms
= saturated moisture content (decimal)
= initial moisture content (decimal)
= change in volume of water during saturation
= weight of mineral solids
= unit weight of water (1 gm/cc)
Weight of mineral solids:
59
TECHNICAL DOCUMENTATION
Wms =
where: Wi
5.7.2
Wi
1 + MC i
= initial sample weight
Saturated Dry Density
γ ds =
where: γds
Vs
Wms
Vs
= saturated dry density
= saturated volume
Saturated volume:
Vs = ( H i − ∆H s ) × A i ×
where: Vs
∆Hs
Ai
H i − 2 × ∆H s
Hi
= saturated volume
= change in height during saturation
= initial area
Minimum allowable saturated volume:
Vs(min) = Vms + Vwi - ∆Vs
where: Vs(min)
Vms
Vwi
∆Vs
= saturated volume
= volume of mineral solids
= initial volume of water
= change in water volume during saturation
Initial volume of water:
Vwi =
where: Wwi
UWw
5.7.3
Wwi
UWw
= initial weight of water (as documented in § 5.3.1)
= unit weight of water (1gm/cc)
Saturated Saturation
The saturated saturation will either be 100%, if the minimum volume criteria was used, or be
calculated as documented in § 5.4.3.
60
SHEAR User’s Guide
5.7.4
Consolidated Moisture Content
MC c = MC s −
∆Vwc × UWw
Wms
= saturated moisture content (decimal)
where: MCs
= consolidated moisture content (decimal)
MCc
Wwc = weight of pore water, consolidated
5.7.5
Consolidated Dry Density
γ dc =
where: γdc
Vc
Wms
Vc
= consolidated dry density
= consolidated volume
Consolidated volume:
Vc = ( H i − ∆H s − ∆H c ) × A i ×
H i − 2 × ( ∆H s + ∆H c )
Hi
= consolidated volume
= change in height during consolidation
where: Vc
∆Hc
Minimum consolidated volume:
Vc(min) = Vs(min) - ∆Vc
where: Vc(min)
Vs(min)
∆Vc
⇒
5.7.6
= minimum consolidated volume
= minimum saturated volume
= change in water volume during consolidation
Vc(min) will always be used if Vs(min) was used.
Consolidated Saturation
The consolidated saturation will either be 100%, if the minimum volume criteria was used, or
calculated as documented in § 5.4.6.
61
TECHNICAL DOCUMENTATION
5.7.7
Consolidated Area
Ac =
Vc
Hc
= consolidated volume, from either the uniform strain calculation or the 100%
where: Vc
saturation calculation
Hc
= consolidated sample height
Consolidated height:
Hc = Hi - ∆Hs - ∆Hc
where: Hc
Hi
∆Hs
∆Hc
= consolidated height
= initial height
= change in height during saturation
= change in height during consolidation
5.8 Saturated Void Ratio
The saturated void ratio calculation is identical for all triaxial methods:
es =
where: es
γds
UWw × G s
−1
γ ds
= saturated void ratio
= saturated dry density
5.9 Consolidated Void Ratio
The consolidated void ratio calculation is identical for all triaxial methods:
ec =
where: ec
γdc
UWw × G s
−1
γ dc
= consolidated void ratio
= consolidated dry density
62
SHEAR User’s Guide
5.10 Final Moisture Content
The final moisture content is calculated using the same method as the initial. Refer to § 5.1.1 for
details.
5.11 Stress and Strain Calculations - TX and UCC
Stress and strain calculations for triaxial and unconfined compression tests are very similar.
Triaxial tests differ in that they may include corrections for filter paper and rubber membrane strengths.
Additionally, consolidated drained (CD) tests may have volumetric change readings that enter into the
calculation of the cross-sectional area. The following sections explain the methods used in these
calculations.
5.11.1
Strain Calculations - TX and UCC
The sample strain at any given reading is the ratio of the change in sample height to the initial
sample height. It is usually expressed as a percentage.
⇒
Note: When entering deformation data for a staged test the initial dial reading should
not be entered as 0 unless the dial gauge (digital display) is actually reset. It is
necessary that the strain at the initial reading for all specimens is 0 when entering
readings for staged tests.
Strain:
ε=
∆H n
Hc
where: ε
∆Hn
Hc
= strain (decimal)
= change in height at reading n
= consolidated (TX) or initial (UCC) specimen height
∆Hn = (DDn - DDi) x DDC
where: DDn
DDi
DDC
= deformation dial reading in user units at dial reading n
= initial reading, user units
= dial constant converting input units to actual units of length
63
TECHNICAL DOCUMENTATION
5.11.2
Deviator Stress Calculations - Triaxial and Unconfined
Compression
Deviator stresses are calculated from the axial load and the specimen area. Triaxial deviator
stresses may optionally be adjusted for filter paper and/or rubber membrane strengths. Drained triaxial
tests may alternatively use effluent volume measurements for determining volume changes, area changes,
and volumetric strain.
Deviator stress:
∆σ n =
Where: ∆σn
Pn
An
σfp
σrm
Pn
− σ fp − σ rm
An
= deviator stress
= applied load
= area at reading n
= strength contribution of the filter paper (TX only)
= strength contribution of the rubber membrane (TX only)
If using proving rings, the load P is:
Pn = (LDRn - LDRi) x LRC1 for single stage rings and 2 stage rings up to the crossover reading
Pn = (LDCR - LDRi) x LRC1 + (LDRn - LDCR) x LRC2 for double stage rings past the crossover
Pn = A x LDRn + B for Ax + B type rings
where: LRC1
LRC2
LRCR
A
B
= primary load ring constant
= secondary load ring constant
= load ring crossover reading
= reading coefficient with Ax+B rings
= ordinal intercept with Ax+B rings
Area at reading n (UCC and undrained TX):
An =
where: Ac
εn
Ac
1− εn
= consolidated area of the sample
= strain (decimal) at reading n
Area at reading n (drained TX):
An =
Vn
Hn
64
SHEAR User’s Guide
= specimen volume at reading n
= specimen height at reading n
where: Vn
Hn
Vn = Vc - ∆Vn
where: Vc
∆Vn
= consolidated specimen volume
= change in volume from effluent measurements at reading n
Hn = Hc - ∆Hn
where: Hc
∆Hn
= consolidated specimen height
= change in height at reading n
σfp at reading n (εn < 0.02):
σ fp = 50 × ε n ×
K fp × Pfp
Ac
σfp at reading n (εn >= 0.02):
K fp × Pfp
σ fp =
Ac
where: σfp
Kfp
Pfp
Ac
Pfp =
= theoretical strength contribution of the filter paper
= load carried by the filter paper strip per unit length of perimeter
= length of perimeter covered by filter paper
= consolidated area of specimen
π × D i × C fp
where: π
Di
Cfp%
100%
= mathematical pi, 3.14159...
= initial specimen diameter
= percent of the perimeter covered by filter paper
σrm at reading n:
σ rm =
4 × E rm × t rm × ε n
Dc
65
TECHNICAL DOCUMENTATION
where: σrm
Erm
trm
εn
Dc
= theoretical strength contribution of the rubber membrane
= modulus of elasticity of the rubber membrane
= thickness of the rubber membrane
= strain at reading n (decimal)
= consolidated diameter of specimen
⇒
If σrm / ∆σn is less than 5%, the effect of the membrane is ignored.
5.11.3
Unconfined Compression Undrained Shear Strength
The undrained shear strength of a soil, as determined in an unconfined compression test, is defined
as:
s=
qu
s
where: s
qu
5.11.4
= undrained shear strength
= unconfined compressive strength
Triaxial Principal Stresses and Stress Paths
For triaxial tests, the major and minor principal stresses ( σ1 and σ3 ) are determined as follows:
σ3 = CPP - U
where: CPP
U
= cell pressure
= pore pressure
σ1 = σ3 + ∆σ
where: ∆σ
= deviator stress
For strengths based on total stresses, U is 0.
5.12 Direct Shear Stress and Deformation Calculations
The stress and deformation values for direct shear tests are calculated using the formulas in the
following sections.
5.12.1
Deformation Calculations
δ h = ( DD n − DD i ) × DDC
66
SHEAR User’s Guide
where: δh
DDn
DDi
DDC
5.12.2
= horizontal deformation
= deformation dial reading, user units
= initial reading, user units
= dial constant, units per input unit
Direct Shear Stress Calculations
τn =
Tn
An
where: τn = shear stress
Tn = shear force
An = area
When using proving rings, the shear force T is:
Tn = (LDRn - LDRi) x LRC1 for single stage rings and 2 stage rings up to the crossover reading
Tn = (LDCR - LDRi) x LRC1 + (LDRn - LDCR) x LRC2 for double stage rings past the crossover
Tn = A x LDRn + B for Ax + B type rings
where: LRC1
LRC2
LRCR
A
B
= primary load ring constant
= secondary load ring constant
= load ring crossover reading
= reading coefficient with Ax+B rings
= ordinal intercept with Ax+B rings
For normal calculations using constant area:
An = Ai
When using the area adjustment formulas with square cross sectional areas:
A n = A i − (S × δ h )
Where: An
Ai
S
δh
= area of a square specimen at reading n, adjusted for strain
= initial sample area
= side length
= horizontal deformation
When using the area adjustment formulas with circular cross sectional areas:
An = π ×
D i 2 (Θ − sin(Θ ))
×
π
4.0
67
TECHNICAL DOCUMENTATION
where: An
Di
θ
= area of a round specimen, adjusted for strain
= initial diameter
= 2 × arccos(
δh
)
Di
5.13 Triaxial Mohr's Circles and Tangent Envelope
Calculations
Mohr's circle based on stresses at failure is plotted on a graph of shear stress versus normal stress.
The circle starts at σ3 for the left side of the circle and ends at σ1 for the right side of the circle. In terms of
the parameters p and q, associated with stress paths, the center of the circle is at p and the radius is length q
where:
p=
σ1 + σ 3
2
and
q=
σ1 − σ 3
2
The program’s placement of the tangent envelope is based on a linear regression fit of the p and q
values, resulting in an equation of the form:
p = a+α×q
A tangent line is then drawn on the Mohr's circle plots using the equation:
τ = c + σ × tan(φ )
Where: τ
σ
Φ
c
a
c
= shear stress
= normal stress
= friction angle
= cohesion (shear stress intercept)
= arcsin(tan α )
a
=
cos( φ )
68
SHEAR User’s Guide
5.14 Direct Shear Tangent Line Calculations
The direct shear tangent line is determined using a linear least squares correlation routine. The
failure shear stress points for each of the test's normal loads are fit with a line of the form:
τ = c + σ × tan(φ )
where: τ
σ
Φ
c
= shear stress
= normal stress
= friction angle
= cohesion (shear stress intercept)
5.15 Calculation Differences for Staged Tests
A staged test, one where a single specimen is used for multiple shear runs at different normal or
confining stresses, has its constitutive parameters handled differently. Since only one specimen is tested,
there is only one set of initial specimen parameters. Likewise, since the sample need only be subjected to a
single saturation cycle, those constitutive values need only be determined once.
In triaxial tests, stages subsequent to the first begin at the state where the last state ended. At that
point the volume is assumed to be the same as when the previous consolidation cycle ended, but the height
and area have changed. The specimen is then subjected to another consolidation cycle at a higher normal
or confining stress. When there are measurements taken of pore water volume changes, these values are
used to determine the constitutive parameters. For example, if ASTM Method B is used, the consolidated
volume at the end of the first stage can be calculated by working back from the final stage:
Vc = Vms + Vvf + ∆Vvw3 + ∆Vvw2
where: Vms
Vvf
∆Vvw3
∆Vvw2
= volume of mineral solids
= final volume of voids
= change in water volume during 3rd stage consolidation
= change in water volume during 2rd stage consolidation
Other methods similarly adapt to staged tests. Contact GEOSYSTEM Software for additional
techincal documentation if desired.
69
TECHNICAL DOCUMENTATION
5.16 Online Testing Sets
If you have Internet Explorer version 6.0 or later, or Mozilla 1.0 or later or Netscape 7.0 or later,
you can view examples of the test sets used to verify the program’s calculations at:
http://www.geosystemsoftware.com/products/shearv4/testing/
These examples include extensive annotations documenting our manual verification of the
program’s results.
Figure 5.16.1 -- Sample SHEAR Test Set with Annotations
70
SHEAR User’s Guide
5.17 Values Available for Data Summaries
For each entered test, SHEAR calculates several different values that may be used on data
summaries created by the GDM “Data Summary and Export” tool (see Chapter 4 in the Data Manager
manual or Appendix C in the LD4 User’s Guide). The following table lists the names and a short
description of all the calculated values provided by SHEAR:
Item Name
Description
SHSMP1PEAKSTRESS,
SHSMP2PEAKSTRESS,
SHSMP3PEAKSTRESS,
SHSMP4PEAKSTRESS
Peak stress encountered by each of the four SHEAR test specimens
SHSMP1PEAKSTRAIN,
SHSMP2PEAKSTRAIN,
SHSMP3PEAKSTRAIN,
SHSMP4PEAKSTRAIN
Strain at peak stress encountered
SHSMP1ULTSTRESS,
SHSMP2ULTSTRESS,
SHSMP3ULTSTRESS,
SHSMP4ULTSTRESS
Ultimate stress encountered by each of the four SHEAR test
specimens. Not an automatic selection: see the ultimate stress
selection discussion in § 2.2.4.
SHSMP1ULTSTRAIN,
SHSMP2ULTSTRAIN,
SHSMP3ULTSTRAIN,
SHSMP4ULTSTRAIN
Strain at ultimate stress encountered
SHSMP1CELLPRESS,
SHSMP2CELLPRESS,
SHSMP3CELLPRESS,
SHSMP4CELLPRESS
Triaxial tests only: chamber cell pressure
SHSMP1BACKPRESS,
SHSMP2BACKPRESS,
SHSMP3BACKPRESS,
SHSMP4BACKPRESS
Triaxial tests only: back pressure
SHSMP1NORMLSTRESS,
SHSMP2NORMLSTRESS,
SHSMP3NORMLSTRESS,
SHSMP4NORMLSTRESS
SHSMP1STRAINRATE,
SHSMP2STRAINRATE,
Direct shear tests only: is the normal stress for each of the four
samples
Rate of strain used during the test
71
TECHNICAL DOCUMENTATION
SHSMP3STRAINRATE,
SHSMP4STRAINRATE
COHESION,
FRICTION_ANGLE
EFF_COHESION,
EFF_FRICTION_ANGLE
PQ_A,
PQ_ALPHA
Resistance at 0 normal stress and friction angle
Resistance at 0 normal effective stress and effective stress friction
angle
P-q stress path tangent q intercept and tangent angle
EFF_PQ_A,
EFF_PQ_ALPHA
P-q effective stress path tangent q intercept and tangent angle
ULT_COHESION
Direct shear resistance @ 0 normal ultimate stress
DIDTX,
DIDDS,
DIDUCC
DIDTX, DIDDS and DIDUCC are initialized to Y for any samples for
which a triaxial, direct shear or unconfined test was performed
(respectively) – can be used to count the number of tests performed
for a given project.
72
SHEAR User’s Guide
.
.DXF
.EMF
.PDF
.WMF
See CAD
See metafile
See Acrobat
See metafile
A
A term
24
Acrobat
1, 39–42, 40
Actual loads
25
Add sample number/location
41
Additional decimal precision
6
area 7, 15, 16, 18, 19, 45, 47, 48, 52, 53, 54, 56, 59, 60,
63, 64, 65, 67, 68, 69
ASTM D 2850
14
ASTM D 4767
10, 15, 17, 22, 52, 54, 57
Atterberg
11, 15
AutoCAD
See CAD
Ax+B ring equation
24
B
B term
Back pressure
Base file name
Best Fit
Best-fit Lines on Chart
Binary
buret
Buret precision
24
25
40, 41
31, 32, 33
33
42
See outflow buret
17
C
CAD
1, 39–42
Cell pressure
25
Chart Effective
31, 32
chart report 5, 7, 8, 15, 16, 18, 28, 31, 32, 33, 35, 39, 42
Chart report figure number
16
Chart Total
31, 32
Circles on Chart
31
clipboard
42
COE
1, 14, 16, 22, 46, 47, 48, 49, 50, 51, 53, 59
Compression side length
21
configuration
See setup
consolidated
1
area
15
drained
1, 17, 63
undrained
1, 15
container ID
3, 11, 20
container list
11
Container List
3, 11
copy
Corps of Engineers
Crossover
2, 28, 42
See COE
23, 24
D
Data entry requires
11
Data Manager
See GDM
data summary
35, 39, 42
data summary and export tool
42, 71
Date sampled
15
Def. Dial
26
deformation
1, 17, 18, 26, 27, 63, 66, 67
vertical
1, 18, 27, 35
Deformation dial divisor
26
deleting data
29
density 1, 14, 16, 44, 45, 46, 47, 48, 50, 51, 52, 53, 55, 56,
57, 58, 60, 61, 62
diameter
6, 45, 65, 66, 68
Dimensions
4, 27
direct shear 1, 6, 14, 15, 16, 18, 20, 21, 25, 26, 30, 32, 39,
66, 69, 72
Do not summarize ASTM Method B saturated params.10
DOS
29
drained
1, 17, 27, 63, 64
Drop Checked by from reports if a name is not entered 7
Drop Tested by from reports if a name is not entered 7
E
English
Enter vertical deformation
excess
Export XML File
See units
18, 27
See pore pressure
34
F
Fabric on fabric (no soil) test
failure
figure number
filter paper
coefficient
correction
percent coverage
Fluid pressure
18
See peak
16
17
17
17
4, 5, 25, 27
G
GDM
Get Tan from Mohr's
1, 2, 13, 15, 28, 29, 35, 39, 71
32
TECHNICAL DOCUMENTATION
H
height16, 18, 21, 45, 46, 47, 48, 49, 51, 52, 53, 54, 56, 59,
60, 61, 62, 63, 65, 69
Import DOS SHEAR File
29
Include disclaimer on chart reports
7
Include specimen number on stress-strain charts
6
initial sample
area
18, 45, 47, 48
height
45, 48
installation
2–3
L
lab. number
See specimen number
Label failure stress as
9, 10
Label ultimate stress as
9, 10
Layer name
42
LD4
1, 2, 3, 13, 29, 35, 42, 43, 71
Liquid limit
15
Load reading and load precision
6
Load ring constant
23–24, 23
LRC
See Load ring constant
M
margins
8
Mark failure point on P-Q charts with a circle
9
Mark ultimate point on P-Q charts with a cross
10
Material description
15
membrane
correction
17
modulus
17
thickness
17
metafile
1, 39–42
metric
See units
Minimum strain scale
9
Mohr’s circle
8, 30, 35
Moist weight
20
moisture content
11
final
52, 53, 55, 58, 63
initial
16, 19, 44, 52, 55, 57, 59
N
4
21
21
2
25
O
options
1, 17, 27
35, 39
35, 39
P
I
Navigation tab placement
Net decrease in height
Net decrease in water volume
network
Normal stress
outflow buret
Output Chart Report
Output Data Summary Report
See setup
Page 2 figure no.
16
paste
42
peak 3, 6, 9, 10, 16, 18, 25, 28, 30, 31, 32, 33, 68, 69, 71
Phi
See tangent:angle
Place files in
41
plastic limit
15
Plasticity index
15
Points on Chart
32, 33
pore pressure
1, 4, 5, 6, 10, 25, 27, 30, 31, 32, 66
p-q
6, 30, 31, 32, 35
preview
35, 39
PROCTOR
11
Prompt text color
3
R
rate of strain
Readings units
Report deformation as
Report is scaled in
Report Phi to
Report pore pressures as excess
Report Preview
residual
Reverse buret convention
6
25
18
41
6
10
31, 32, 33, 39
See ultimate
17
S
Sample Info.
3, 7, 13, 16, 18, 19, 20, 21
sample number
See specimen number
saturated 1, 16, 18, 20, 46, 47, 49, 50, 51, 52, 53, 54, 55,
57, 58, 59, 60, 61, 62
saturation 1, 10, 14, 15, 21, 22, 25, 44, 46, 47, 48, 49, 50,
51, 52, 53, 54, 55, 56, 57, 58, 59, 60, 61, 62, 69
Select margins for
8
setup
3–10
SI See units
Side 2 length
21
Single specimen staged test
16, 18
Skip initial moisture data
16, 19, 44
specific gravity
16, 20, 46, 53, 54, 55, 57
specimen number
6
Specimen values calculation method
14, 15
Specimen weight
4, 20
square
18, 21, 67
Square Magnifier
39
staged
tests
7, 16, 18, 63, 69
SHEAR User’s Guide
strain 1, 6, 7, 8, 9, 14, 18, 19, 22, 25, 30, 34, 35, 46, 47,
48, 59, 62, 63, 64, 66, 67, 68, 71
Strain rate
6, 25
stress 1, 3, 6, 7, 8, 9, 10, 19, 25, 28, 30, 31, 32, 33, 34, 35,
64, 66, 67, 68, 69, 71
summary report
8
T
tangent
angle
6
tangent line
adjusting
30, 31, 33
Tangent on Chart
31
tare weight
11, 20, 44, 45, See also: Container ID
Test method
14
Through (0,0)
31, 32, 33
Time to failure
6, 25
triaxial 1, 10, 14, 15, 16, 18, 20, 21, 25, 27, 30, 31, 37, 39,
46, 49, 52, 54, 62, 63, 64, 66, 69, 72
TrueType
42
Type of readings
23, 27
Type of sample
14
V
Vertical Def. Dial
26
Vertical def. dial divisor
26
vertical deformation
See deformation:vertical
void ratio
1, 44, 46, 62
volume 14, 16, 18, 21, 22, 45, 46, 47, 48, 49, 50, 51, 52,
54, 55, 56, 57, 58, 59, 60, 61, 62, 64, 65, 69
W
water volume
14, 16, 18, 21, 22, 50, 51, 52, 55, 56, 57,
59, 60, 61, 69
word processor
1, 42
X
XML
U
ultimate
unconfined compression
1, 14, 15, 30, 63, 66
unconsolidated undrained
1, 14
undrained
1, 10, 14, 15, 64, 66
uniform strain
14, 22, 46, 47, 48, 59, 62
unit weight
See density
units
1, 4, 5, 6, 8, 20, 21, 25, 27, 41, 44, 63, 67
Use square or rectangular shear box
18, 21
9, 10, 28, 33, 71
34