1
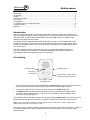
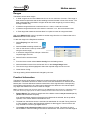
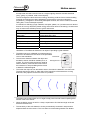
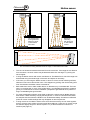
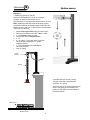
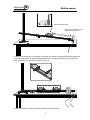
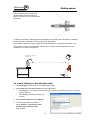
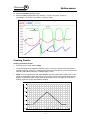
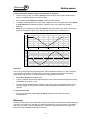
Smart
Q
TECHNOLOGY
Motion sensor
(Product No. 3270)
Ranges
DATA HARVEST
•
Walk 0.15 – 3 m
•
Distance 0.15 – 1 m
•
Distance 0.15 – 2 m
•
Distance 0.15 – 4 m
•
Distance 0.15 – 8 m
•
Distance 15 – 800 cm
•
Distance 6 – 300 inches
•
Time 1,000 – 50,000 µs
Resolution 0.001 m (1 mm)
Resolution: 0.001 m (1 mm)
Resolution: 0.001 m (1 mm)
Resolution: 0.001 m (1 mm)
Resolution: 0.001 m (1 mm)
Resolution: 0.1 cm
Resolution: 0.1 inch
Resolution: 1 µs
Data Harvest Group Ltd.
1 Eden Court, Leighton Buzzard,
Beds, LU7 4FY
Tel: 01525 373666
Fax: 01525 851638
e-mail: [email protected]
www.data-harvest.co.uk
DS 041
© Data Harvest. Freely photocopiable for use within the purchasers establishment
No 5
Smart
Q
Motion sensor
TECHNOLOGY
Introduction ................................................................................................................................ 2
Connecting................................................................................................................................. 2
Ranges ...................................................................................................................................... 3
Practical information .................................................................................................................. 3
Time range................................................................................................................................. 7
Investigations............................................................................................................................. 7
To create Velocity or Acceleration data................................................................................... 10
Creating Presets ...................................................................................................................... 11
Warranty .................................................................................................................................. 12
Introduction
The Smart Q Motion Sensor is a sonar device that emits ultrasonic pulses, which reflect off an
object. It measures the time it takes a high frequency sound pulse to travel from the Sensor to an
object and back. This time data is used, together with the speed of sound, to determine the
distance of an object from the Sensor.
The Motion sensor is supplied with a steel rod (size 80 mm long x 10 mm diameter with a M6
thread). The rod can be screwed into the mounting threads, which are found at the base and on
the sides of the Motion sensor. The rod can be used for clamping into a suitable holding device
e.g. a retort stand.
The Smart Q Motion Sensor is equipped with a micro controller that greatly improves the
accuracy, precision and consistency. It is supplied calibrated and the stored calibration is
automatically loaded when the Motion sensor is connected.
Connecting
Mounting thread
Mounting thread
Red signal
received LED
Insert the sensor cable with the
locating arrow facing forwards
Mounting thread
•
Push one end of the sensor cable (supplied with the EASYSENSE unit) into the shape socket on
the side of the Motion sensor with the locating arrow on the cable facing forwards.
•
Connect the other end of the cable to the input socket on the EASYSENSE unit.
•
The EASYSENSE unit will detect that the Motion sensor is connected and display values
using the currently selected range. If the range is not suitable for your investigation, set to
the correct range (see page 3).
The red signal LED on the Motion sensor will only light when the EASYSENSE unit is powered and a
signal has been reflected from the object. It will emit a clicking sound each time a pulse is sent.
Note: The red signal LED on the Motion Sensor is not a power on indicator; it is used to indicate that a
reflected signal has been received from an object.
The Motion Sensor will start to pulse at approximately 50 pulses per second (every 20 ms). If the time
for a pulse to reflect off an object is longer than 20 ms (when the object is over 2 metres away),
pulses will slow.
2
Smart
Q
Motion sensor
TECHNOLOGY
Ranges
The Motion sensor has 8 ranges.
•
A ‘Walk’ range that can record distances from 0.15 to a maximum of 3 metre. This range is
best used for experiments that involve walking back and forward in front of the sensor. The
data is automatically smoothed to a higher level than other ranges (by 4 levels of rolling
average instead of 2).
•
3 Distance ranges that have a maximum limit of 1 metre, 2 metre and 4 metre.
•
3 Distance ranges that record to the sensor’s maximum - 8 m, 800 cm and 300 inches
•
A Time range that measures the time taken for a pulse to travel to a target and back.
With some EASYSENSE units it is possible to set the range from the unit. Please refer to the
EASYSENSE unit’s user manual.
To alter the range in the EasySense software:
1. Select EasyLog from the Home
screen.
2. Select the New recording wizard icon.
3. Click on the sensor’s name (it will be listed
using its current range).
4. A set sensor range window will open. Select the
required range, then OK.
5. Select Finish to exit the wizard.
Or
1. From the Home screen select Sensor Config from the Settings menu.
2. Select the Motion sensor from the list and click on the Change Range button.
3. The current range will be highlighted. Select the required range and click on OK.
4. Close Sensor Config.
The range setting will be retained until changed by the user.
Practical information
The Motion sensor emits pulses of ultrasonic sound waves from the gold-plated foil of the
transducer. The Motion sensor then ‘listens’ for the echo that results from an obstacle in the
beams path. The time difference between transmission of the signal and the corresponding
echo together with speed in air is then used to determine the distance to the nearest object.
Any object that reflects sound can be used as a target.
Note: The Motion Sensor will report the distance to the closest object that produces a sufficiently strong
echo; this can be any object (such as chairs or tables) that are found in the cone of the ultrasound.
•
Fastest Speed: The maximum sample rate of the Motion sensor is 50 per second (50 Hz)
(20 ms interval between samples).
If an interval between samples of less than 20 milliseconds is selected, the set up will be
rejected, or the values obtained will default to zero.
•
The data from the Motion sensor is serial and is not suitable for use with Timing functions
or Time & Motion mode in the EasySense software or data loggers. These functions will
only use data from switch-type digital sensors.
•
The quality of the reflecting surface used as a target is critical. The nature of sound
wave reflection varies according to the texture and structure of a surface. The best target is
3
Smart
Q
Motion sensor
TECHNOLOGY
an object that will reflect sound waves in a single outgoing direction with little absorbed
(shiny, glossy or polished, solid or hard objects).
The worst targets are those with sound energy absorbing surfaces. Some modern building
materials and finishes have been deliberately engineered to have sound absorbing
properties e.g. fibreglass or acoustically absorptive surfaces, like velour curtains, acoustical
ceiling tiles, or sound-absorptive panels.
If a reflection is diffusing (rough materials, matt paint, plaster, etc.) sound waves can tend to
bounce off in many directions (scatter energy rather than reflect it coherently). Sound waves
may not return with sufficient power to give a valid result.
Good reflectors
Questionable or poor reflectors
Glass or acrylic sheet
Plaster board partitions
Metal plate
Suspended ceiling tiles
Stiff card
Plastic foams
Solid plastic tray
Office type partitions / notice boards
Brick walls
Soft, fluffy, folded or draped fabric or clothing
Wood
Use Meter or Test Mode to determine if an object is providing a good reflection.
•
The Motion sensor is calibrated for measurements of
distance to be made from the centre of the perforated
cover of the transducer.
Transducer
•
The minimum distance between the object and
the Motion sensor should be 0.15 m (15 cm, 6
inches). The circuit inside the Sensor needs to
switch off after a pulse has been sent to allow
the transducer to stop oscillating before it tries
to detect the reflected signal.
•
The further the object is from the Motion sensor, the wider the detection cone becomes.
The best response is within 5˚ either side of the central line of the transducer. At long
distances, stray objects can become more of a problem.
Red signal LED
The Motion sensor leans back at a 6˚ angle to help prevent sound waves impacting a flat
surface close to the sensor.
•
When the Motion sensor is held in a clamp, experiment to find the best angle of tilt and
therefore the best echo.
•
The sensitivity of the echo detection circuitry automatically increases in steps as time
elapses before the echo returns. This is to allow for echoes being weaker from distant
4
Smart
Q
Motion sensor
TECHNOLOGY
objects. This increase in step can produce a slight change in distance measurement that
maybe become noticeable if the distance graph is differentiated.
•
The Motion sensor will continue to send pulses until the EASYSENSE unit stops asking for
a reading. This may result in the clicking noise continuing after logging has stopped.
•
If your EASYSENSE unit goes into ‘sleep mode’ (nothing shown on LCD screen), the red
LED on the Motion sensor will turn off and it will stop sending a pulse until the logger
‘wakes up’ to take a sample.
•
Automatic correction for variation in air temperature has been incorporated into the
Distance ranges. The Motion sensor will use its internal temperature sensor to apply a
correction factor to the value for speed of sound used in calculating the distance (344 ms-1
at 21ºC). Without compensation, values for large distances between hot and cold days
could have an error of up to 0.5 m.
The Time range is not temperature compensated.
There is no compensation made for relative humidity or air pressure.
•
Although the moulding of the Motion sensor has been designed to help protect the
transducer, extra protection will be required if an object is being dropped from above. A
protective wire mesh such as an office in-tray could be used. Test to ensure the wire does
not interfere with the echo; the cone of the echo is at its narrowest close to the transducer.
•
Power requirements: The Motion sensor takes the power it requires from the
EASYSENSE unit. If logging continuously for long periods connect the logger to a power
supply.
If you intend to collect data remotely check the batteries in the logger are fully charged
before you start.
This sensor’s power requirement makes it unsuitable for use with the Flash Logger, Link
and V1.2 or less of the Q3 and Q5 loggers.
If data has ‘spikes’ or appears inaccurate
Spikes occur when the echo is lost. Check the following list, in particular the alignment of the
sensor to the target. The transducer is very directional.
•
Check the target is more than 0.15 m (15 cm, 6 inches) from the Motion sensor.
•
The maximum distance (8 m) is reached under ideal conditions e.g. for a large flat wall
perpendicular to the sensor. For smaller objects or non-flat surfaces the maximum
detection distance will be shorter.
•
Other sound sources can cause a problem if they produce ultrasonic waves in the same
frequency range (around 50 kHz) e.g. air track blowers, air exiting holes on an air track,
motors, fans, etc.
•
The path of sound waves is bent by wind. If the air is turbulent or fluctuating e.g. on a windy
day or by heat from a hot object, measurements will be affected.
•
Check that the reflecting surface reflects squarely. Flat objects must be perpendicular to
the waves.
•
Try increasing the strength of the target’s reflection by increasing the size of the target area.
•
Try altering the reflective property of the target e.g. by attaching a piece of stiff card.
•
When studying a person’s movement they may not supply a strong enough reflection e.g.
by wearing soft sound absorbing jumper. Remove the jumper or get the person to hold an
object e.g. a book or basketball, flat against them to act as the reflector. Avoid large targets
that may flap about.
•
When you are setting up an investigation imagine the ultrasound beam extending out in a
cone shape. Check for stationary objects e.g. tables, chairs, walls and floors that could be
positioned in that cone, they maybe detected instead of the target.
5
Smart
Q
Motion sensor
TECHNOLOGY
Motion
sensor
Motion
sensor
The work surface
is being detected
before the target,
so data will be
inaccurate
Nothing is
interfering
with the signal
so data will be
correct
The work surface is being detected before the target, so data will be inaccurate
•
The cone of ultrasound extends downward from the centre line. If the target is at a distance
from the sensor, the work surface maybe detected rather than the target. Try raising the
sensor higher.
•
If using the Motion sensor with a track use Meters or Test Mode first to check the target can
be detected along the whole length of the track and adjust as necessary.
•
If the room you are using the Motion sensor in has a lot of hard, sound reflecting surfaces,
ultrasound can bounce around the room. If this happens try placing cloth horizontally just in
front of and below the Motion sensor’s transducer.
•
Balls made from foam or balls smaller than 5 cm diameter may not be detected. The best
size is 15 cm diameter or more. Using a light ball e.g. an inflatable beach ball, to measure
gravity is not advised since the air resistance (compared to gravitational force) will be too
large. A basketball gives good results.
•
For most investigations logging using Graph mode with a sample rate of 20 ms gives the
best results. If data wavers try varying the sample rate. In some circumstances the faster
the samples rate the shorter the distance can be detected reliably. Sometimes a reflected
pulse can cause invalid readings that may disappear at other frequencies.
•
If using more than one Motion sensor at the same time ensure they are not close together
as they will ‘hear’ each others echo and cause false readings. If using two on a track, angle
the sensors slightly away from the track (about 12˚) so their ultrasound cones do not
interfere (see page 10).
6
Smart
Q
Motion sensor
TECHNOLOGY
Time range
The Time range will measure the time taken for the pulse to travel to the object and then back
again.
With this range the Motion sensor can be used to measure the speed of sound. Place the
Motion sensor at least one metre away from the object. Select either Meter or Test Mode and
record a value.
Example: the Motion sensor was placed 1 metre away from a wall (one metre to the wall and
one metre back = a distance of 2 metres). The value for time measurement was 5800 µs (5800
x 10-6 s).
Speed of sound (ms-1) = Distance for echo to travel (m) =
2
Echo time (s)
5800 x 10-6
= 344.8 ms-1
The value of the velocity of sound in air increases with temperature.
At 0˚C, v = 331.3 ms-1. If the velocity of sound increases at 0.607 ms-10C-1 then at 24˚C, v =
331.3 + 24 x 0.607 = 331.3 + 14.6 = 345.9 ms-1.
Temperature
(˚C)
Speed of
sound in air
(ms-1)
Temperature
(˚C)
Speed of
sound in air
(ms-1)
18
19
20
21
22
23
24
342.23
342.83
343.44
344.05
344.65
345.26
345.87
25
26
27
28
29
30
31
346.47
347.08
347.69
348.30
348.90
349.51
350.12
Investigations
•
•
•
•
•
•
•
•
•
•
•
•
Walking toward and away from the Sensor
Movement of an object up or down a slope
Simple harmonic motion
Newton’s laws of motion
Pendulum motion
Air track gliders - collisions
Acceleration due to gravity – free fall, pendulum swing, objects dropped or tossed upward
Balanced forces
Conservation of energy - a bouncing object
Speed of sound
Energy changes in simple harmonic motion
Oscillation of a spring
Can be used with a Force sensor to:
• Study the relationship between force & motion
• To study collision and impulse
• Simple harmonic motion
• Spring characteristics, extension, oscillation, SHM
7
Smart
Q
Motion sensor
TECHNOLOGY
Examples:
1. Measuring gravity by free fall.
Select an intersample time of 20 ms, and start
condition of distance rises above 30 cm.
Hold ball about 10 cm below the Motion sensor, click on
Start, release the ball and move hands away quickly.
If the ball is dropped the distance data will be from the
Motion sensor to the ball. To alter data to show distance
of the ball from the floor.
•
•
•
•
•
•
•
•
Select Post-log Function from the Tools menu.
Select the Formula function ax2 + bx + c, Next.
x = the Distance data set, Next.
Change the name to Displacement.
a=0
b = -1 (using -1 “turns the data” to positive
values as the subtraction of “c” gives
negative values)
c = enter the distance from the Motion
sensor to the floor.
Click on Finish
Force
sensor
Spring
2. Simple harmonic motion, energy
changes, extension characteristics,
oscillation of a spring.
The Force sensor is used to measure the
force in the spring as it oscillates. The
position of the mass is monitored using
the Motion sensor.
Mesh guard
Motion sensor
8
Smart
Q
Motion sensor
TECHNOLOGY
Cart with reflector fitted
Motion sensor attached to the
Dynamics System track
3. Used to plot the position of the trolley on the slope to find how the distance and speed change as
a cart rolls up and down a slope; investigating whether acceleration depends on the angle of the
slope; measuring g by rolling a cart down a slope, etc.
4. Elastic and inelastic collisions using two Motion sensors and carts.
9
Smart
Q
Motion sensor
TECHNOLOGY
The two Motion sensors need to be
angled slightly away from the track
(about 12˚) so they do not interfere with
each other.
5. Detecting movement: Measuring distance against time and using this information to calculate
the velocity and acceleration of the moving person. See below.
Using a start condition to trigger logging can be advantageous e.g. distance rises above 0.5 m.
The Predict function of the EasySense software can be used to create a preset line for the
students to try to follow. See page 11.
Approach up to 15 cm from
the transducer
To create Velocity or Acceleration data
1. Use Smoothing (Tools menu) on recorded Distance data.
2. Select Post-log or Pre-log Function from the Tools menu.
•
Use Pre-log prior to the distance data being recorded. Velocity or Acceleration data will be created as
logging progresses.
•
Use Post-log when data has already been
recorded.
3. Select Preset function and then Motion.
4. From the drop-down menu select
either Velocity or Acceleration from
position data or distance data.
Click on Next.
10
Smart
Q
Motion sensor
TECHNOLOGY
5. Select the Distance channel, Next.
6. Enter the units as appropriate e.g. Velocity - m (m/s), cm (cm/s), in (in/s) or
Acceleration - m (m/s/s), cm (cm/s/s), in (in/s/s), Finish.
Acceleration
Distance
Velocity
Creating Presets
Creating a Distance Preset
•
From the Home screen select Graph.
•
On the first page of the logging wizard that opens, click on the sensor name and select a
suitable range e.g. Walk (3 m). Select Next and then the time span e.g. 10 seconds (20 ms
interval). Select Next and enter a suitable trigger, Finish.
•
Right click in the graph area and select Predict. Use the predict tool to draw a line on the
graph for the pupils to follow (left click at start, move the mouse and a thick black line will
appear, click with left hand mouse button at different points on the graph to fix the line in
position, right click to stop and deselect Predict).
11
Smart
Q
Motion sensor
TECHNOLOGY
Creating a Distance and Velocity preset displayed on 2 graphs
•
Use a Pre-log Function to create a Velocity preset function; don’t forget to alter the axis
limits to a suitable minimum & maximum value.
•
From Options select Number of Graphs, select 2 as the number.
•
To display a different data set in each graph, right click in the first graph area, select Show
or Hide Channels and deselect Velocity. Repeat in the second graph but deselect
Distance.
•
Right click in the graph area and select Predict. Use the predict tool to draw a line in each
graph for the pupils to follow. Click with the right mouse button to finish the line.
Distance (m)
Set up file
The set up for an experiment (recording times, interval between samples, any start conditions
or pre-triggers plus options for display such as number of graphs, predictions, deselected
channels, pre-log functions, etc) can be saved as a Setup file for future use.
•
Select Save Setup from the File menu.
•
Type in a suitable name for the experiment (this is the name that will be displayed in the My
Investigations list). Click on OK.
•
The Save Setup file dialogue box will open. Alter the file name if required and Save to the
currently logged on user’s My Documents directory\EasySense Files\Setup Files (.SSS
type file).
To open the setup file
•
From the Home screen select Open ► Setup. Select the setup file from the My
Investigation list.
Warranty
All Data Harvest Sensors are warranted to be free from defects in materials and workmanship for
a period of 12 months from the date of purchase provided they have been used in accordance
with any instructions, under normal laboratory conditions. This warranty does not apply if the
Sensor has been damaged by accident or misuse.
12
Smart
Q
Motion sensor
TECHNOLOGY
In the event of a fault developing within the 12 month period, the Sensor must be returned to
Data Harvest for repair or replacement at no expense to the user other than postal charges.
Note: Data Harvest products are designed for educational use and are not intended for
use in industrial, medical or commercial applications.
WEEE (Waste Electrical and Electronic Equipment) Legislation
Data Harvest Group Ltd is fully compliant with WEEE legislation and is pleased
to provide a disposal service for any of our products when their life expires.
Simply return them to us clearly identified as ‘life expired’ and we will dispose of
them for you.
13